HMA Smoothed RSI [Pinescriptlabs]This indicator uses a modified version of the RSI (Relative Strength Index) weighted by volume. This means it not only takes into account the price but also the amount of volume supporting those price movements, making the indicator more sensitive to real market fluctuations.
Hull Moving Average (HMA) Applied to RSI: To smooth the volume-weighted RSI, a Hull Moving Average (HMA) is applied. The HMA is known for its ability to reduce market "noise" and quickly react to trend changes. This process helps better identify when an asset is overbought or oversold.
Overbought and Oversold Regions: The indicator sets clear overbought and oversold levels, which are adjustable. By default, the overbought level is set at 20 and the oversold level at -20, but you can customize these values. Additionally, there are extreme overbought and oversold levels to help identify more extreme market conditions where a price reversal is more likely.
Buy and Sell Signals:
Buy Signal: This is generated when the modified RSI crosses above the oversold level. This indicates that the price has dropped enough and may be about to rise.
Sell Signal: This occurs when the RSI crosses below the overbought level. This suggests that the price has risen too much and could be about to fall.
Dynamic Visualization and Colors: The indicator is displayed with different colors based on its behavior:
When the RSI is within normal levels, the color is neutral.
If it is above the overbought level, the color turns red (sell alert).
If it is below the oversold level, the color turns green (buy alert).
Alerts: This indicator also allows you to set up alerts. You will receive automatic notifications when buy or sell signals are generated, helping you make decisions without constantly monitoring the chart.
Español:
Este indicador utiliza una versión modificada del RSI (Índice de Fuerza Relativa), ponderado por volumen. Esto significa que no solo tiene en cuenta el precio, sino también la cantidad de volumen que respalda esos movimientos de precios, haciendo que el indicador sea más sensible a las fluctuaciones reales del mercado.
Media Móvil Hull (HMA) aplicada al RSI: Para suavizar el RSI ponderado por volumen, se le aplica una Media Móvil Hull (HMA). La HMA es conocida por su capacidad para reducir el "ruido" del mercado y reaccionar rápidamente a los cambios de tendencia. Este proceso ayuda a identificar mejor cuándo un activo está sobrecomprado o sobrevendido.
Regiones de sobrecompra y sobreventa: El indicador establece niveles claros de sobrecompra y sobreventa que son ajustables. Por defecto, el nivel de sobrecompra está en 20 y el de sobreventa en -20, pero puedes personalizar estos valores. Además, hay niveles extremos de sobrecompra y sobreventa que te ayudan a identificar condiciones más extremas del mercado, donde una reversión de precio es más probable.
Señales de compra y venta:
Señal de compra: Se genera cuando el RSI modificado cruza hacia arriba el nivel de sobreventa. Esto indica que el precio ha bajado lo suficiente y puede estar a punto de subir.
Señal de venta: Se produce cuando el RSI cruza hacia abajo el nivel de sobrecompra. Esto indica que el precio ha subido demasiado y podría estar a punto de bajar.
Visualización y colores dinámicos: El indicador se muestra con diferentes colores según su comportamiento:
Cuando el RSI está dentro de los niveles normales, el color es neutro.
Si está por encima del nivel de sobrecompra, el color se vuelve rojo (señal de alerta de venta).
Si está por debajo del nivel de sobreventa, el color se vuelve verde (señal de alerta de compra).
Alertas: Este indicador también te permite configurar alertas. Así, recibirás notificaciones automáticas cuando se generen señales de compra o venta, ayudándote a tomar decisiones sin estar constantemente monitoreando el gráfico.
Cari dalam skrip untuk "20蒙古币兑换人民币"

Uptrick: Logarithmic Crypto Bands
Description :
Introduction
The `Uptrick: Logarithmic Crypto Bands` indicator introduces an innovative approach to technical analysis tailored specifically for the cryptocurrency markets. By leveraging logarithmic transformations combined with dynamic exponential bands, this indicator offers a sophisticated method for identifying critical support and resistance levels, assessing market trends, and evaluating volatility. Its unique approach stands out from traditional indicators by addressing the specific challenges of high volatility and erratic price movements inherent in cryptocurrency trading.
Originality and Usefulness
** 1. Unique Logarithmic Transformation: **
- Innovation : Unlike traditional indicators that often use raw price data, the Uptrick: Logarithmic Crypto Bands applies a logarithmic transformation to the closing prices: logPrice = math.log(close). This approach is original because it reduces the impact of extreme price fluctuations, providing a smoother and more stable price series. This transformation addresses a common issue in cryptocurrency markets where large price swings can obscure true market trends.
- Advantage : The logarithmic transformation compresses the price range, which allows traders to better identify long-term trends and reduce the noise caused by outlier price movements. This results in a more reliable basis for analysis and enhances the ability to detect meaningful market patterns.
**2. Dynamic Exponential Bands :**
- Innovation : The indicator employs exponential calculations to derive dynamic support and resistance levels based on a central base line : baseLine * math.pow(multiplier, n). Unlike static bands that remain fixed regardless of market conditions, these bands adjust dynamically according to market volatility.
- Advantage : The dynamic nature of the bands provides a more responsive and adaptive tool for traders. As market volatility changes, the bands widen or narrow accordingly, offering a more accurate reflection of potential support and resistance levels. This adaptability improves the tool's effectiveness in varying market conditions compared to static or traditional bands.
Detailed Description and Substantiation
**1. Logarithmic Price Calculation :**
- Code : ` logPrice = math.log(close)
- Description : This calculation converts the closing price into its logarithmic value. By compressing the price range, it minimizes the distortion caused by extreme price movements, which can be particularly pronounced in the volatile cryptocurrency markets.
- Purpose : To provide a stabilized price series that facilitates more accurate trend analysis and reduces the influence of erratic price fluctuations.
**2. Moving Averages of Logarithmic Prices :**
- ** Long-Term Moving Average :**
- Code : maLongLogPrice = ta.sma(logPrice, longLength)
longLength = 2000
- ** Description : A simple moving average of the logarithmic price over a long period. This average helps filter out short-term noise and provides insight into the long-term market trend.
- Purpose : To offer a perspective on the overall market direction, making it easier to identify enduring trends and distinguish them from short-term price movements.
- Short-Term Moving Average :
- Code : maShortLogPrice = ta.sma(logPrice, shortLength) shortLength = 900
- Description : A simple moving average of the logarithmic price over a shorter period. This component captures more immediate price trends and potential reversal points.
- Purpose : To detect short-term trends and changes in market direction, allowing traders to make timely trading decisions based on recent price action.
**3. Base Line Calculation :**
- Code : baseLine = math.exp(maShortLogPrice)
- Description : Converts the short-term moving average of the logarithmic price back to the original price scale. This base line serves as the central reference point for calculating the surrounding bands.
- Purpose : To establish a benchmark level from which the exponential bands are calculated, providing a central reference for assessing potential support and resistance levels.
**4. Band Calculation and Plotting :**
- ** Code :**
- Band 1: plot(baseLine * math.pow(multiplier, 1), color=color.new(color.yellow, 20), linewidth=1, title="Band 1")
- Band 2: plot(baseLine * math.pow(multiplier, 2), color=color.new(color.yellow, 20), linewidth=1, title="Band 2")
- Band 3: plot(baseLine * math.pow(multiplier, 3), color=color.new(color.yellow, 20), linewidth=1, title="Band 3")
- Band 4: plot(baseLine * math.pow(multiplier, 4), color=color.new(color.yellow, 20), linewidth=1, title="Band 4")
- Band 5: plot(baseLine * math.pow(multiplier, 5), color=color.new(color.yellow, 10), linewidth=1, title="Band 5")
- Band 6: plot(baseLine * math.pow(multiplier, 6), color=color.new(color.yellow, 0), linewidth=1, title="Band 6")
- * Multiplier : Set at 1.3, adjusts the spacing between bands to accommodate varying levels of market volatility.
- Description : Bands are plotted at exponential intervals from the base line. Each band represents a potential support or resistance level, with the spacing between them increasing exponentially. The color opacity of each band indicates its level of significance, with closer bands being more relevant for immediate trading decisions.
** How to Use the Indicator :**
**1. Identifying Support and Resistance Levels :**
- Support Levels : The lower bands, closer to the base line, can act as potential support levels. When the price approaches these bands from above, they may indicate areas where the price could stabilize or reverse direction.
- Resistance Levels : The upper bands, further from the base line, serve as resistance levels. When the price nears these bands from below, they can act as barriers to price movement, potentially leading to reversals or stalls.
**2. Confirming Trends :**
- Uptrend Confirmation : When the price consistently remains above the base line and moves towards higher bands, it signals a strong bullish trend. This confirmation helps traders capitalize on upward price movements.
- Downtrend Confirmation : When the price stays below the base line and approaches lower bands, it indicates a bearish trend. This confirmation assists traders in acting on downward price movements.
3. Analyzing Volatility :
- Wide Bands : Wider spacing between bands reflects higher market volatility. This indicates a more turbulent trading environment, where price movements are less predictable. Traders may need to adjust their strategies to handle increased volatility.
- Narrow Bands : Narrower bands suggest lower volatility and a more stable market environment. This can result in more predictable price movements and clearer trading signals.
**4. Entry and Exit Points :**
- Entry Points : Consider buying when the price bounces off the base line or a band, which could signal support in an uptrend.
- Exit Points : Evaluate selling or taking profits when the price nears upper bands or shows signs of reversal at these levels. This approach helps in locking in gains or minimizing losses during a downtrend.
**Chart Example:**
Here you can see how the price reacted getting closer to this level. All green circles show a bounce-off. So just from looking at the chart we can see a potential bounce again pretty soon.
** Disclosure :**
- ** Performance Claims :** The `Uptrick: Logarithmic Crypto Bands` indicator is designed to assist traders in analyzing price levels and trends. It is important to understand that this tool provides historical data analysis and does not guarantee future performance. The features and benefits described are based on historical market behavior and should not be seen as a prediction of future results. Traders should use this indicator as part of a broader trading strategy and consider other factors before making trading decisions.

EMA Crossover Buy/Sell IndicatorScript Overview
This script is a trading indicator designed to identify potential buy and sell signals based on the crossover of two Exponential Moving Averages (EMAs):
Indicator Title and Setup:
The script is named "EMA Crossover Buy/Sell Indicator" and is plotted directly on the price chart.
EMAs Calculation:
It calculates two EMAs: a 20-period EMA and a 50-period EMA. These are used to analyze the market trends over different time frames.
Plotting EMAs:
The 20-period EMA is shown on the chart in blue.
The 50-period EMA is shown in orange.
These lines help visualize the current trend and potential points of interest where the moving averages intersect.
Generating Signals:
A buy signal is triggered when the 20-period EMA crosses above the 50-period EMA.
A sell signal is triggered when the 20-period EMA crosses below the 50-period EMA.
These signals suggest potential buying or selling opportunities based on the crossover of the EMAs.
Displaying Signals:
Buy signals are marked with green labels below the bars on the chart.
Sell signals are marked with red labels above the bars on the chart.
This visual representation helps traders quickly identify potential trading opportunities.
Alerts:
Alerts are set up to notify the trader when a buy or sell signal occurs.
The alert messages specify whether the signal is a buying opportunity or a selling opportunity based on the EMA crossovers.

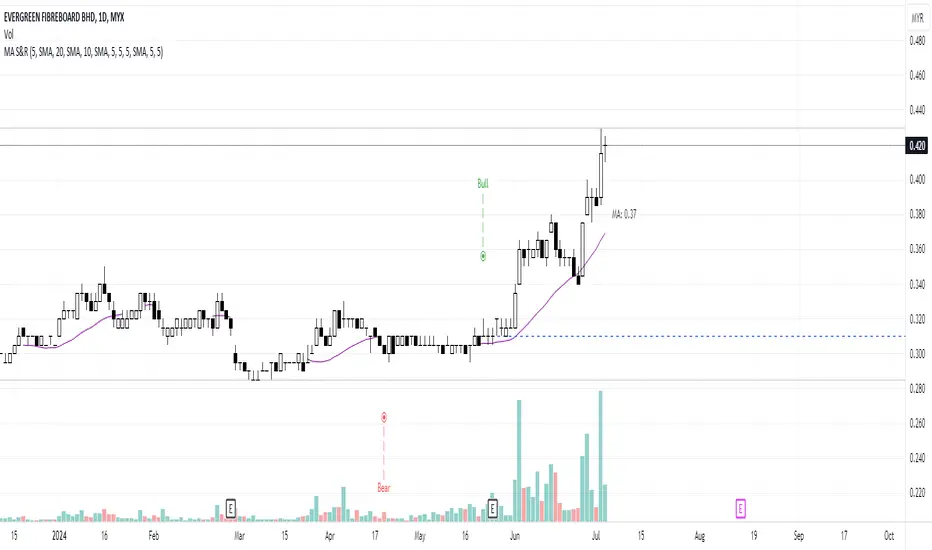
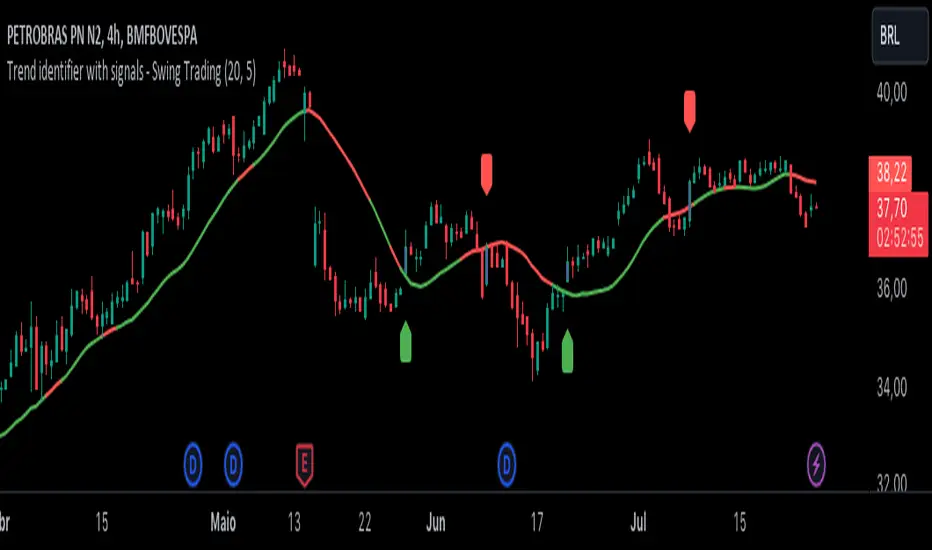
Trend identifier with signals - Swing TradingIndicator Objective
The "Trend identifier with signals - Swing Trading" indicator is designed to help traders identify market trends and provide clear visual signals for potential buy and sell points based on the interaction of price with the 20-period moving average.
How the Indicator Works
20-Period Moving Average:
The indicator calculates the 20-period simple moving average (SMA), which is a common tool for smoothing out price fluctuations and identifying the overall market direction.
The moving average is plotted on the chart, changing color according to the identified trend:
Green: Indicates an uptrend.
Red: Indicates a downtrend.
Gray: Indicates a neutral or undefined market condition.
Trend Identification on the Daily Chart:
The indicator checks the trend based on an adjustable period (default is 5 periods):
Uptrend: When the short-term moving average (5 periods) is above the long-term moving average (10 periods).
Downtrend: When the short-term moving average (5 periods) is below the long-term moving average (10 periods).
Signal for Touching the Moving Average:
When the price crosses the 20-period moving average, the candles are colored purple to indicate that there was a touch on the moving average.
This helps identify critical points where the price may reverse or continue its trend.
Trend Signal:
Green Flag: Appears below the candle when there is a touch on the moving average and the trend is up, suggesting a potential buy point.
Red Flag: Appears above the candle when there is a touch on the moving average and the trend is down, suggesting a potential sell point.
Lateral Zone Identification:
The indicator also checks if the price touched the moving average for 5 consecutive candles, indicating a possible consolidation or lateral zone.
If this occurs, a message "Possible Lateral Zone" is shown on the chart, helping the trader avoid trades in a market without a clear direction.
How the Indicator Helps Traders
Clear Trend Identification:
By changing the color of the moving average according to the trend (green for up, red for down), the indicator provides a clear visualization of market direction.
This allows traders to align their trades with the prevailing trend, increasing the probability of success.
Visual Buy and Sell Signals:
The green and red flags provide direct visual signals for potential entry and exit points, based on the interaction of price with the moving average.
This is particularly useful for novice traders who may struggle to identify these points on their own.
Risk Management and Trade Planning:
Identifying lateral zones helps traders avoid trading in trendless markets, where price movements are more unpredictable.
This improves risk management and allows traders to focus on more favorable opportunities.
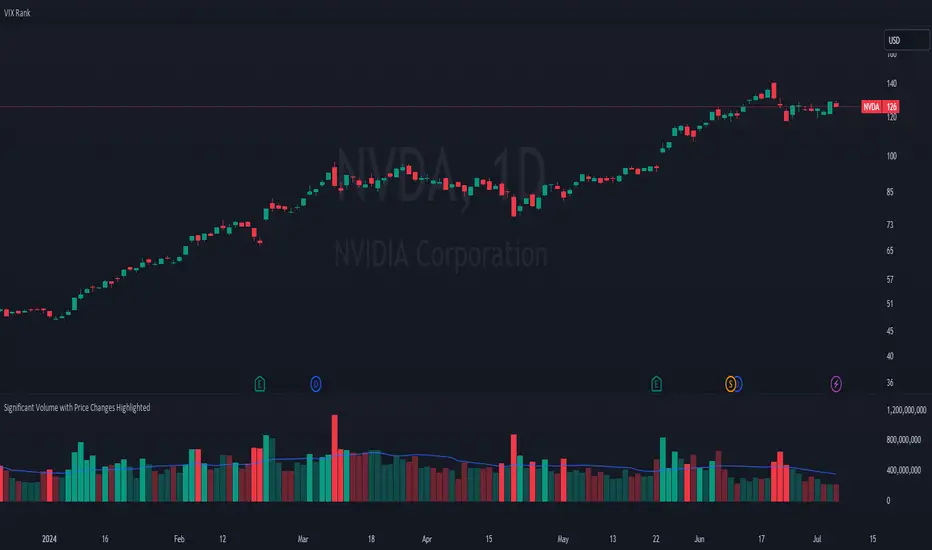
Significant Volume with Price Changes HighlightedSignificant Volume with Price Changes Highlighted
The "Significant Volume with Price Changes Highlighted" indicator by PappyTrading is a powerful tool designed to help traders identify significant volume spikes and price changes in the market. This indicator overlays the volume bars on the price chart and highlights them based on specific volume and price change conditions, providing a clear visual representation of market activity.
What It Does
This indicator calculates the moving average of the volume over a specified period and compares the current volume to this average. It also calculates the daily percentage change relative to the previous day's close and compares this to its moving average. The volume bars are then color-coded based on the following conditions:
Bright Green (#089981): Indicates a significant volume spike with an above-average price increase.
Bright Red (#f23645): Indicates a significant volume spike with an above-average price decrease.
Green with 60% transparency: Indicates a normal up day with a price increase but not a significant volume spike.
Red with 60% transparency: Indicates a normal down day with a price decrease but not a significant volume spike.
Additionally, the indicator plots a 20-period simple moving average (SMA) of the volume, providing a reference point to understand the general volume trend.
How It Works
Volume Calculation:
The indicator calculates the 20-period SMA of the volume and compares the current volume to this average to determine if there is a significant volume spike.
Price Change Calculation:
The indicator calculates the daily percentage change in price relative to the previous day's close and compares this to the 20-period SMA of the percentage change to identify significant price movements.
Color Coding:
The volume bars are color-coded based on the combination of the volume and price change conditions. This visual representation allows traders to quickly identify significant market activities.
How to Use It
Overlay on Chart:
Add the "Significant Volume with Price Changes Highlighted" indicator to your chart. The volume bars will be displayed at the bottom of the chart, color-coded based on the conditions described above.
Identify Market Activity:
Use the color-coded volume bars to identify significant market activities. Bright green bars indicate strong buying pressure, while bright red bars indicate strong selling pressure. Transparent green and red bars indicate normal market activity without significant volume spikes.
Volume Moving Average:
The blue line represents the 20-period SMA of the volume. Use this as a reference to understand the general volume trend and identify deviations from the average.
Concepts Underlying the Calculations
Volume Spikes: Significant volume spikes often precede or accompany major market moves. By highlighting these spikes, traders can gain insights into potential market turning points or continuation patterns.
Price Changes: Large price changes relative to the previous day's close indicate strong market momentum. By comparing these changes to their moving average, the indicator helps traders identify unusually strong buying or selling pressure.
This indicator is ideal for traders who want to gain a deeper understanding of market dynamics by analyzing volume and price changes together. It is suitable for various trading styles, including trend following, swing trading, and scalping.
Scalping System by Machine# Custom Trading System Indicator
This Pine Script indicator is designed to identify potential trading setups based on a specific set of rules. It's intended for use on lower timeframes (M1-M5) in the forex market, particularly during the New York-London overlap period.
## Key Features
1. **EMA Condition**: Uses a 20-period Exponential Moving Average (EMA) to determine trend direction.
2. **Candle Analysis**: Identifies strong bars and candle color changes.
3. **Volume Confirmation**: Checks for increasing volume.
4. **Volatility Filter**: Utilizes the Average True Range (ATR) to gauge market volatility.
5. **Time-based Filter**: Highlights the New York-London overlap period.
6. **Visual Aids**: Plots potential entry points, stop losses, and take profit levels.
## Trading Rules
1. **Buy Signal**:
- Price is above the 20 EMA
- Candle color changes from red to green
- Current candle is a strong bar (closing within 75% of its range)
- Volume is higher than the previous bar
- ATR(14) is above 4 pips OR it's during the NY-London overlap
2. **Sell Signal**:
- Price is below the 20 EMA
- Candle color changes from green to red
- Current candle is a strong bar (closing within 75% of its range)
- Volume is higher than the previous bar
- ATR(14) is above 4 pips OR it's during the NY-London overlap
3. **Stop Loss**: Placed near the low of the setup candle for buys, or near the high for sells.
4. **Take Profit**: Aimed at 1R (one times the range of the setup candle).
## Visual Elements
- **20 EMA**: Plotted as a blue line on the chart.
- **Buy Signals**: Green triangles below the candles.
- **Sell Signals**: Red triangles above the candles.
- **Stop Loss Levels**: Small red dots at the calculated stop loss prices.
- **Take Profit Levels**: Small green dots at the calculated take profit prices.
- **Information Table**: Displays current values for ATR, strong bar condition and volume condition.
## Usage Notes
1. This indicator is designed for manual trading, not automated execution.
2. It works best when combined with analysis of major trend lines, support, and resistance levels.
3. Exercise caution with very large setup candles.
4. Consider additional filters or money management rules for enhanced performance.
5. For higher timeframe bias validation, consider incorporating a 100-period break of structure (BOS) analysis.
## Customization
The indicator includes several input parameters that can be adjusted:
- EMA Length
- ATR Length and Threshold
- Volume Multiplier
- Strong Bar Percentage
Users can also toggle the visibility of stop loss and take profit markers.
Remember, while this indicator can identify potential setups, it should be used in conjunction with other forms of analysis and risk management strategies. Always consider the overall market context and your personal risk tolerance when making trading decisions.

RV - Relative Strength Index Buy/SellIntroduction
The RV - RSI B/S V1.2 indicator leverages the RSI to identify overbought and oversold conditions in the market. The RSI line color changes according to bullish, bearish, oversold, and overbought zones, helping users identify direction and avoid false trades. By plotting the RSI along with user-defined moving averages and Bollinger Bands, it offers a multi-faceted approach to analyzing market momentum.
Indicator Overview
The indicator RSI line color changes as per the bullish, bearish, oversold, and overbought zones. This helps users find out the direction and the zones. The oversold and overbought zones are colored to help users avoid false trades.
Trading Strategy
Long Trades (Bullish Setup):
Entry: A long trade is initiated when the RSI crosses from 60 up to 80.
Exit: Long trades are generally exited when the RSI is between 80 and 90.
Condition: No long trades are taken if the RSI exceeds 80.
Short Trades (Bearish Setup):
Entry: A short trade is initiated when the RSI crosses from 40 down to 20.
Exit: Short trades are generally exited when the RSI is between 20 and 10.
Condition: No short trades are taken if the RSI falls below 20.
RSI Color Coding and Interpretation
The RV - RSI B/S V1.2 indicator uses color coding to provide a visual representation of RSI values, making it easier to identify critical levels at a glance:
Green (RSI 60-80): Indicates a bullish zone where long trades can be considered.
Red (RSI > 80): Signals an overbought condition where long trades should be avoided.
Orange (RSI 20-40): Indicates a bearish zone where short trades can be considered.
Pink (RSI < 20): Signals an oversold condition where short trades should be avoided.
RSI Settings and Their Importance
RSI Length: The default length is set to 12, which is the standard period for RSI calculation. This setting can be adjusted to increase or decrease sensitivity.
Source: The source of the data for the RSI calculation is typically the closing price.
MA Type: Various moving averages can be applied to the RSI, including SMA, EMA, SMMA (RMA), WMA, and VWMA. Each type offers different smoothing properties and can be selected based on
trading preferences.
MA Length: The default length is set to 20, aligning with the RSI length for consistency.
Bollinger Bands: When using Bollinger Bands, the standard deviation multiplier is set to 2.0 by default, but it can be adjusted to suit different volatility conditions.
Disclaimer
This indicator provides valuable signals for potential trading opportunities based on RSI levels and moving averages. However, it is crucial to incorporate directional price action analysis to confirm signals and improve trading accuracy. The RV - RSI B/S V1.2 should be used as part of a broader trading strategy, considering other technical and fundamental factors.

HMA Crossover 1H with RSI, Stochastic RSI, and Trailing StopThe strategy script provided is a trading algorithm designed to help traders make informed buy and sell decisions based on certain technical indicators. Here’s a breakdown of what each part of the script does and how the strategy works:
Key Components:
Hull Moving Averages (HMA):
HMA 5: This is a Hull Moving Average calculated over 5 periods. HMAs are used to smooth out price data and identify trends more quickly than traditional moving averages.
HMA 20: This is another HMA but calculated over 20 periods, providing a broader view of the trend.
Relative Strength Index (RSI):
RSI 14: This is a momentum oscillator that measures the speed and change of price movements over a 14-period timeframe. It helps identify overbought or oversold conditions in the market.
Stochastic RSI:
%K: This is the main line of the Stochastic RSI, which combines the RSI and the Stochastic Oscillator to provide a more sensitive measure of overbought and oversold conditions. It is smoothed with a 3-period simple moving average.
Trading Signals:
Buy Signal:
Generated when the 5-period HMA crosses above the 20-period HMA, indicating a potential upward trend.
Additionally, the RSI must be below 45, suggesting that the market is not overbought.
The Stochastic RSI %K must also be below 39, confirming the oversold condition.
Sell Signal:
Generated when the 5-period HMA crosses below the 20-period HMA, indicating a potential downward trend.
The RSI must be above 60, suggesting that the market is not oversold.
The Stochastic RSI %K must also be above 63, confirming the overbought condition.
Trailing Stop Loss:
This feature helps protect profits by automatically selling the position if the price moves against the trade by 5%.
For sell positions, an additional trailing stop of 100 points is included.

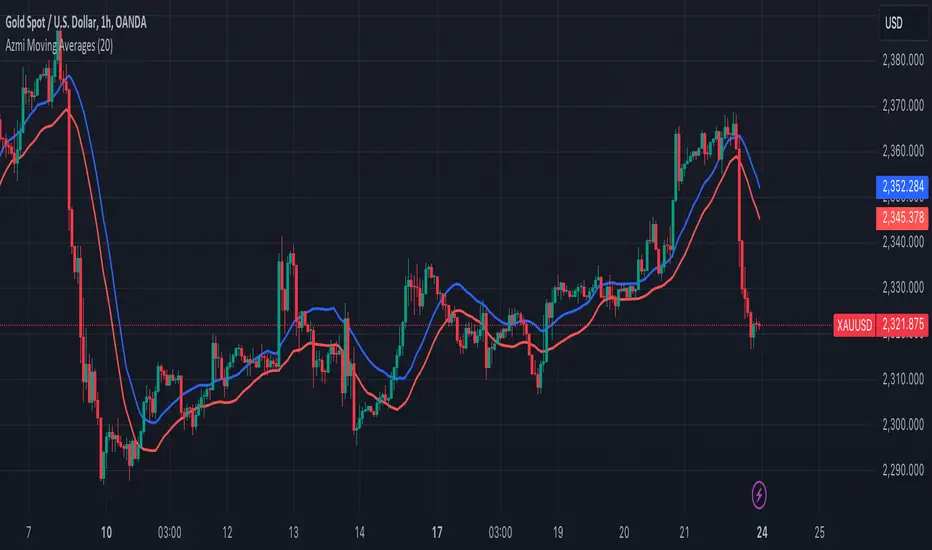
Azmi Moving AveragesThis trading indicator, designed using Pine Script, incorporates two simple moving averages (SMAs) with the same length but different data sources. Here's a detailed description of the indicator:
### Indicator Overview
**Name:** Two Moving Averages
### Inputs
1. **Length (20):** The period over which the moving averages are calculated. Both moving averages use a length of 20 periods.
2. **Source:**
- **High:** The first moving average is calculated using the high prices of the candles.
- **Low:** The second moving average is calculated using the low prices of the candles.
### Calculations
1. **MA High (maHigh):** This is the simple moving average of the high prices over the specified length (20 periods). It smooths the high prices over time, showing the average high price trend.
2. **MA Low (maLow):** This is the simple moving average of the low prices over the same length (20 periods). It smooths the low prices over time, showing the average low price trend.
### Plotting
- **MA High (Blue Line):** This line represents the moving average of the high prices. It is plotted in blue with a line width of 2.
- **MA Low (Red Line):** This line represents the moving average of the low prices. It is plotted in red with a line width of 2.
### Interpretation
1. **Trend Identification:**
- **Bullish Trend:** When the MA High is above the MA Low, it generally indicates a bullish trend, as the average high prices are higher than the average low prices.
- **Bearish Trend:** When the MA High is below the MA Low, it suggests a bearish trend, as the average high prices are lower than the average low prices.
2. **Support and Resistance:**
- The MA High can act as a dynamic resistance level, where the price may face selling pressure.
- The MA Low can act as a dynamic support level, where the price may find buying interest.
3. **Price Channels:**
- The area between the MA High and MA Low creates a channel that can help traders visualize the range within which the price is fluctuating. This channel can be used to identify potential breakout or breakdown points.
### Example Usage
- **Buy Signal:** A potential buy signal may occur when the price crosses above both the MA High and MA Low, indicating a possible upward trend.
- **Sell Signal:** A potential sell signal may occur when the price crosses below both the MA High and MA Low, indicating a possible downward trend.
This indicator provides a visual representation of the average high and low prices, helping traders identify trends, potential support and resistance levels, and price channels for better trading decisions.
Williams %R OB/OS Candle Coloring### Description for TradingView Publication
**Title:** Williams %R OB/OS Candle Coloring
**Description:**
This Pine Script indicator enhances the visibility of market conditions by changing the color of the candlesticks based on the Williams %R values. It helps traders quickly identify overbought and oversold conditions without the need to display the Williams %R line or any additional bands.
**How It Works:**
- The script calculates the Williams %R value using a specified lookback period (default is 14 days).
- It then compares the Williams %R value against predefined overbought and oversold levels.
- **Overbought Condition:** When the Williams %R value is greater than the upper band level (-20 by default), the candlestick color changes to blue.
- **Oversold Condition:** When the Williams %R value is less than the lower band level (-80 by default), the candlestick color changes to yellow.
**How to Use:**
1. **Input Parameters:**
- **Length:** The lookback period for calculating Williams %R (default is 14).
- **Upper Band Level:** The threshold for overbought conditions (default is -20).
- **Lower Band Level:** The threshold for oversold conditions (default is -80).
2. **Candlestick Coloring:**
- Blue candles indicate potential overbought conditions.
- Yellow candles indicate potential oversold conditions.
This indicator is designed to provide a visual cue directly on the price chart, making it easier for traders to spot extreme market conditions at a glance.
**Concepts Underlying the Calculation:**
Williams %R, developed by Larry Williams, is a momentum indicator that measures overbought and oversold levels. It compares the current closing price to the highest high and lowest low over a specified period. By using color-coded candles, traders can quickly assess market conditions and make informed decisions without the need to interpret an additional indicator line.
This script is particularly useful for traders who prefer a clean chart but still want to leverage the insights provided by the Williams %R indicator.
---
### ภาษาไทย:
**คำอธิบาย:**
สคริปต์ Pine Script ตัวนี้ช่วยเพิ่มการมองเห็นสภาวะตลาดโดยการเปลี่ยนสีของแท่งเทียนตามค่าของ Williams %R ช่วยให้เทรดเดอร์สามารถระบุสภาวะการซื้อเกินและขายเกินได้อย่างรวดเร็วโดยไม่ต้องแสดงเส้น Williams %R หรือเส้นระดับเพิ่มเติมใดๆ
**วิธีการทำงาน:**
- สคริปต์คำนวณค่าของ Williams %R โดยใช้ช่วงเวลาที่กำหนด (เริ่มต้นที่ 14 วัน)
- จากนั้นเปรียบเทียบค่าของ Williams %R กับระดับการซื้อเกินและขายเกินที่กำหนดไว้
- **สภาวะการซื้อเกิน:** เมื่อค่าของ Williams %R มากกว่าระดับ Upper Band (-20 เริ่มต้น) สีของแท่งเทียนจะเปลี่ยนเป็นสีน้ำเงิน
- **สภาวะการขายเกิน:** เมื่อค่าของ Williams %R น้อยกว่าระดับ Lower Band (-80 เริ่มต้น) สีของแท่งเทียนจะเปลี่ยนเป็นสีเหลือง
**วิธีการใช้งาน:**
1. **ค่าพารามิเตอร์:**
- **Length:** ช่วงเวลาที่ใช้คำนวณ Williams %R (เริ่มต้นที่ 14)
- **Upper Band Level:** ระดับการซื้อเกิน (เริ่มต้นที่ -20)
- **Lower Band Level:** ระดับการขายเกิน (เริ่มต้นที่ -80)
2. **การเปลี่ยนสีแท่งเทียน:**
- แท่งเทียนสีน้ำเงินระบุถึงสภาวะการซื้อเกิน
- แท่งเทียนสีเหลืองระบุถึงสภาวะการขายเกิน
อินดิเคเตอร์นี้ถูกออกแบบมาเพื่อให้สัญญาณภาพตรงบนกราฟราคาช่วยให้เทรดเดอร์สามารถมองเห็นสภาวะตลาดได้อย่างชัดเจนและทำการตัดสินใจได้ง่ายขึ้น
**แนวคิดที่อยู่เบื้องหลังการคำนวณ:**
Williams %R ที่พัฒนาโดย Larry Williams เป็นอินดิเคเตอร์โมเมนตัมที่วัดระดับการซื้อเกินและขายเกิน มันเปรียบเทียบราคาปิดปัจจุบันกับราคาสูงสุดและต่ำสุดในช่วงเวลาที่กำหนด โดยใช้แท่งเทียนที่มีการเปลี่ยนสี เทรดเดอร์สามารถประเมินสภาวะตลาดและทำการตัดสินใจได้อย่างรวดเร็วโดยไม่ต้องตีความเส้นอินดิเคเตอร์เพิ่มเติม
สคริปต์นี้มีประโยชน์โดยเฉพาะสำหรับเทรดเดอร์ที่ต้องการกราฟที่สะอาดแต่ยังต้องการใช้ข้อมูลเชิงลึกจากอินดิเคเตอร์ Williams %R

BEC (Bearish Elephant Candle)Description:
The Bearish Elephant Candle Indicator is designed to identify and signal potential short entry points based on the Bearish Elephant Candle pattern. This pattern is characterized by a large bearish candle, where the body (difference between open and close) is more than 70% of the entire range (difference between high and low), and the total range is greater than the average true range over a specified period. The indicator also plots a 20-period Exponential Moving Average (EMA) to help visualize the trend.
How It Works:
Bearish Elephant Candle Identification:
The indicator calculates the true range and the average true range (ATR) over a specified period (default is 20 periods).
A candle is identified as a Bearish Elephant Candle if the body is more than 70% of the entire range, and the total range exceeds the average true range.
Short Entry Signal:
When a Bearish Elephant Candle is identified, a short entry signal is plotted on the chart as a red downward label.
Exponential Moving Average (EMA):
A 20-period EMA is plotted on the chart to help users visualize the overall trend. The EMA can serve as an additional filter or exit point for trades.
Pros:
Simplicity: The Bearish Elephant Candle pattern is straightforward to understand and identify.
Visual Signals: The indicator provides clear visual signals for potential short entries, making it easy for traders to spot opportunities.
Trend Visualization: The inclusion of the EMA helps traders stay aligned with the overall trend, potentially improving the effectiveness of the signals.
Cons:
False Signals: Like any pattern-based indicator, it can generate false signals, especially in choppy or sideways markets.
No Confirmation: This version of the indicator does not include additional confirmation signals (e.g., from other indicators like MACD), which may reduce its reliability.
Limited Scope: The indicator focuses solely on bearish signals and does not provide long entry signals.
Best Way to Use It:
Trend Alignment: Use the 20-period EMA to ensure you are trading in the direction of the overall trend. For example, prioritize short signals when the price is below the EMA.
Combine with Other Indicators: Enhance the reliability of the signals by combining this indicator with other technical indicators (e.g., MACD, RSI) for additional confirmation.
Risk Management: Always use proper risk management techniques, such as stop-loss orders, to protect against adverse market movements. Consider placing stop-loss orders above the high of the Bearish Elephant Candle.
Market Context: Be mindful of the broader market context and avoid using the indicator in highly volatile or news-driven environments where patterns may be less reliable.

Uptrick: Trend Analysis 1 Trend Identification:
• The indicator primarily aims to identify trends in the market. It does this by computing two EMAs (fast and slow) and deriving the MACD line, which is the difference between these two EMAs. The MACD line is a momentum indicator that shows the relationship between two moving averages. When the MACD line is above the signal line, it suggests bullish momentum, while below indicates bearish momentum.
2 Entry and Exit Signals:
• The indicator generates potential entry and exit signals based on several conditions:
• Price vs. 20-period EMA: It checks whether the price is above or below the 20-period Exponential Moving Average. This is a common technique used to determine the overall direction of the trend. If the price is above the 20-period EMA, it suggests a bullish trend, and if it's below, it indicates a bearish trend.
• MACD Slope: It calculates the slope of the MACD line over a specified number of bars. A positive slope suggests increasing bullish momentum, while a negative slope indicates increasing bearish momentum.
• Signal Line Crossings: Traders often look for crossovers between the MACD line and the signal line as potential buy or sell signals. When the MACD line crosses above the signal line, it's considered a bullish signal (buy), and when it crosses below, it's seen as a bearish signal (sell).
3 Visual Representation:
• The indicator provides a visual representation of these conditions by plotting the MACD line with different colors depending on the market conditions (bullish, bearish, or neutral). Additionally, it draws vertical lines at the start of negative MACD slopes to highlight potential shifts in momentum.
4 Volume Analysis:
• It incorporates volume analysis by coloring the volume histogram differently based on whether the price is above or below the 20-period EMA. This can provide additional confirmation of trend strength. Higher volumes during price movements above the EMA may confirm bullish trends, while higher volumes during price movements below the EMA may confirm bearish trends.
5 Customization:
• Traders can customize the input parameters such as the fast and slow EMA periods according to their trading strategies and the specific market they're analyzing.

Bitcoin Momentum StrategyThis is a very simple long-only strategy I've used since December 2022 to manage my Bitcoin position.
I'm sharing it as an open-source script for other traders to learn from the code and adapt it to their liking if they find the system concept interesting.
General Overview
Always do your own research and backtesting - this script is not intended to be traded blindly (no script should be) and I've done limited testing on other markets beyond Ethereum and BTC, it's just a template to tweak and play with and make into one's own.
The results shown in the strategy tester are from Bitcoin's inception so as to get a large sample size of trades, and potential returns have diminished significantly as BTC has grown to become a mega cap asset, but the script includes a date filter for backtesting and it has still performed solidly in recent years (speaking from personal experience using it myself - DYOR with the date filter).
The main advantage of this system in my opinion is in limiting the max drawdown significantly versus buy & hodl. Theoretically much better returns can be made by just holding, but that's also a good way to lose 70%+ of your capital in the inevitable bear markets (also speaking from experience).
In saying all of that, the future is fundamentally unknowable and past results in no way guarantee future performance.
System Concept:
Capture as much Bitcoin upside volatility as possible while side-stepping downside volatility as quickly as possible.
The system uses a simple but clever momentum-style trailing stop technique I learned from one of my trading mentors who uses this approach on momentum/trend-following stock market systems.
Basically, the system "ratchets" up the stop-loss to be much tighter during high bearish volatility to protect open profits from downside moves, but loosens the stop loss during sustained bullish momentum to let the position ride.
It is invested most of the time, unless BTC is trading below its 20-week EMA in which case it stays in cash/USDT to avoid holding through bear markets. It only trades one position (no pyramiding) and does not trade short, but can easily be tweaked to do whatever you like if you know what you're doing in Pine.
Default parameters:
HTF: Weekly Chart
EMA: 20-Period
ATR: 5-period
Bar Lookback: 7
Entry Rule #1:
Bitcoin's current price must be trading above its higher-timeframe EMA (Weekly 20 EMA).
Entry Rule #2:
Bitcoin must not be in 'caution' condition (no large bearish volatility swings recently).
Enter at next bar's open if conditions are met and we are not already involved in a trade.
"Caution" Condition:
Defined as true if BTC's recent 7-bar swing high minus current bar's low is > 1.5x ATR, or Daily close < Daily 20-EMA.
Trailing Stop:
Stop is trailed 1 ATR from recent swing high, or 20% of ATR if in caution condition (ie. 0.2 ATR).
Exit on next bar open upon a close below stop loss.
I typically use a limit order to open & exit trades as close to the open price as possible to reduce slippage, but the strategy script uses market orders.
I've never had any issues getting filled on limit orders close to the market price with BTC on the Daily timeframe, but if the exchange has relatively low slippage I've found market orders work fine too without much impact on the results particularly since BTC has consistently remained above $20k and highly liquid.
Cost of Trading:
The script uses no leverage and a default total round-trip commission of 0.3% which is what I pay on my exchange based on their tier structure, but this can vary widely from exchange to exchange and higher commission fees will have a significantly negative impact on realized gains so make sure to always input the correct theoretical commission cost when backtesting any script.
Static slippage is difficult to estimate in the strategy tester given the wide range of prices & liquidity BTC has experienced over the years and it largely depends on position size, I set it to 150 points per buy or sell as BTC is currently very liquid on the exchange I trade and I use limit orders where possible to enter/exit positions as close as possible to the market's open price as it significantly limits my slippage.
But again, this can vary a lot from exchange to exchange (for better or worse) and if BTC volatility is high at the time of execution this can have a negative impact on slippage and therefore real performance, so make sure to adjust it according to your exchange's tendencies.
Tax considerations should also be made based on short-term trade frequency if crypto profits are treated as a CGT event in your region.
Summary:
A simple, but effective and fairly robust system that achieves the goals I set for it.
From my preliminary testing it appears it may also work on altcoins but it might need a bit of tweaking/loosening with the trailing stop distance as the default parameters are designed to work with Bitcoin which obviously behaves very differently to smaller cap assets.
Good luck out there!

Turtle Trading Strategy@lihexieThe full implementation of the Turtle Trading Rules (as distinct from the various truncated versions circulating within the community) is now ready.
This trading strategy script distinguishes itself from all currently publicly available Turtle trading systems on Tradingview by comprehensively embodying the rules for entries, exits, position management, and profit and loss controls.
Market Selection:
Trade in highly liquid markets such as forex, commodity futures, and stock index futures.
Entry Strategies:
Model 1: Buy when the price breaks above the highest point of the last 20 trading days; Sell when the price drops below the lowest point of the last 20 trading days. When an entry opportunity arises, if the previous trade was profitable, skip the current breakout opportunity and refrain from entering.
Model 2: Buy when the price breaks above the highest point of the last 55 trading days; Sell when the price drops below the lowest point of the last 55 trading days.
Position Sizing:
Determine the size of each position based on the price volatility (ATR) to ensure that the risk of each trade does not exceed 2% of the account balance.
Exit Strategies:
1. Use a fixed stop-loss point to limit losses: Close long positions when the price falls below the lowest point of the last 10 trading days.
2. Trailing stop-loss: Once a position is profitable, adjust the stop-loss point to protect profits.
Pyramiding Rules:
Unit Doubling: Increase position size by one unit every time the price moves forward by n (default is 0.5) units of ATR, up to a maximum of 4 units, while also raising the stop-loss point to below the ATR value at the level of additional entries.
海龟交易法则的完整实现(区别于当前社区各种有阉割海龟交易系统代码)
本策略脚本区别于Tradingview目前公开的所有的海龟交易系统,完整的实现了海龟交易法则中入场、出场、仓位管理,止盈止损的规则。
市场选择:
选择流动性高的市场进行交易,如外汇、商品期货和股指期货等。
入市策略:
模式1:当价格突破过去20个交易日的高点时,买入;当价格跌破过去20个交易日的低点时,卖出。当出现入场机会时,如果上一笔交易是盈利的,那么跳过当前突破的机会,不进行入场。
模式2:当价格突破过去55个交易日的高点时,买入;当价格跌破过去55个交易日的低点时,卖出。
头寸规模:
根据价格波动性(ATR)来确定每个头寸的大小, 使每笔交易的风险不超过账户余额的2%。
退出策略:
1. 使用一个固定的止损点来限制损失:当多头头寸的价格跌破过去10个交易日的低点时,平仓止损。
2. 跟踪止损:一旦头寸盈利,移动止损点以保护利润。
加仓规则:
单位加倍:每当价格向前n(默认是0.5)个单位的ATR移动时,就增加一个单位的头寸大小(默认最大头寸数量是4个),同时将止损点提升至加仓点位的ATR值以下。

ottlibLibrary "ottlib"
█ OVERVIEW
This library contains functions for the calculation of the OTT (Optimized Trend Tracker) and its variants, originally created by Anıl Özekşi (Anil_Ozeksi). Special thanks to him for the concept and to Kıvanç Özbilgiç (KivancOzbilgic) and dg_factor (dg_factor) for adapting them to Pine Script.
█ WHAT IS "OTT"
The OTT (Optimized Trend Tracker) is a highly customizable and very effective trend-following indicator that relies on moving averages and a trailing stop at its core. Moving averages help reduce noise by smoothing out sudden price movements in the markets, while trailing stops assist in detecting trend reversals with precision. Initially developed as a noise-free trailing stop, the current variants of OTT range from rapid trend reversal detection to long-term trend confirmation, thanks to its extensive customizability.
It's well-known variants are:
OTT (Optimized Trend Tracker).
TOTT (Twin OTT).
OTT Channels.
RISOTTO (RSI OTT).
SOTT (Stochastic OTT).
HOTT & LOTT (Highest & Lowest OTT)
ROTT (Relative OTT)
FT (Original name is Fırsatçı Trend in Turkish which translates to Opportunist Trend)
█ LIBRARY FEATURES
This library has been prepared in accordance with the style, coding, and annotation standards of Pine Script version 5. As a result, explanations and examples will appear when users hover over functions or enter function parameters in the editor.
█ USAGE
Usage of this library is very simple. Just import it to your script with the code below and use its functions.
import ismailcarlik/ottlib/1 as ottlib
█ FUNCTIONS
• f_vidya(source, length, cmoLength)
Short Definition: Chande's Variable Index Dynamic Average (VIDYA).
Details: This function computes Chande's Variable Index Dynamic Average (VIDYA), which serves as the original moving average for OTT. The 'length' parameter determines the number of bars used to calculate the average of the given source. Lower values result in less smoothing of prices, while higher values lead to greater smoothing. While primarily used internally in this library, it has been made available for users who wish to utilize it as a moving average or use in custom OTT implementations.
Parameters:
source (float) : (series float) Series of values to process.
length (simple int) : (simple int) Number of bars to lookback.
cmoLength (simple int) : (simple int) Number of bars to lookback for calculating CMO. Default value is `9`.
Returns: (float) Calculated average of `source` for `length` bars back.
Example:
vidyaValue = ottlib.f_vidya(source = close, length = 20)
plot(vidyaValue, color = color.blue)
• f_mostTrail(source, multiplier)
Short Definition: Calculates trailing stop value.
Details: This function calculates the trailing stop value for a given source and the percentage. The 'multiplier' parameter defines the percentage of the trailing stop. Lower values are beneficial for catching short-term reversals, while higher values aid in identifying long-term trends. Although only used once internally in this library, it has been made available for users who wish to utilize it as a traditional trailing stop or use in custom OTT implementations.
Parameters:
source (float) : (series int/float) Series of values to process.
multiplier (simple float) : (simple float) Percent of trailing stop.
Returns: (float) Calculated value of trailing stop.
Example:
emaValue = ta.ema(source = close, length = 14)
mostValue = ottlib.f_mostTrail(source = emaValue, multiplier = 2.0)
plot(mostValue, color = emaValue >= mostValue ? color.green : color.red)
• f_ottTrail(source, multiplier)
Short Definition: Calculates OTT-specific trailing stop value.
Details: This function calculates the trailing stop value for a given source in the manner used in OTT. Unlike a traditional trailing stop, this function modifies the traditional trailing stop value from two bars prior by adjusting it further with half the specified percentage. The 'multiplier' parameter defines the percentage of the trailing stop. Lower values are beneficial for catching short-term reversals, while higher values aid in identifying long-term trends. Although primarily used internally in this library, it has been made available for users who wish to utilize it as a trailing stop or use in custom OTT implementations.
Parameters:
source (float) : (series int/float) Series of values to process.
multiplier (simple float) : (simple float) Percent of trailing stop.
Returns: (float) Calculated value of OTT-specific trailing stop.
Example:
vidyaValue = ottlib.f_vidya(source = close, length = 20)
ottValue = ottlib.f_ottTrail(source = vidyaValue, multiplier = 1.5)
plot(ottValue, color = vidyaValue >= ottValue ? color.green : color.red)
• ott(source, length, multiplier)
Short Definition: Calculates OTT (Optimized Trend Tracker).
Details: The OTT consists of two lines. The first, known as the "Support Line", is the VIDYA of the given source. The second, called the "OTT Line", is the trailing stop based on the Support Line. The market is considered to be in an uptrend when the Support Line is above the OTT Line, and in a downtrend when it is below.
Parameters:
source (float) : (series float) Series of values to process. Default value is `close`.
length (simple int) : (simple int) Number of bars to lookback. Default value is `2`.
multiplier (simple float) : (simple float) Percent of trailing stop. Default value is `1.4`.
Returns: ( [ float, float ]) Tuple of `supportLine` and `ottLine`.
Example:
= ottlib.ott(source = close, length = 2, multiplier = 1.4)
longCondition = ta.crossover(supportLine, ottLine)
shortCondition = ta.crossunder(supportLine, ottLine)
• tott(source, length, multiplier, bandsMultiplier)
Short Definition: Calculates TOTT (Twin OTT).
Details: TOTT consists of three lines: the "Support Line," which is the VIDYA of the given source; the "Upper Line," a trailing stop of the Support Line adjusted with an added multiplier; and the "Lower Line," another trailing stop of the Support Line, adjusted with a reduced multiplier. The market is considered in an uptrend if the Support Line is above the Upper Line and in a downtrend if it is below the Lower Line.
Parameters:
source (float) : (series float) Series of values to process. Default value is `close`.
length (simple int) : (simple int) Number of bars to lookback. Default value is `40`.
multiplier (simple float) : (simple float) Percent of trailing stop. Default value is `0.6`.
bandsMultiplier (simple float) : Multiplier for bands. Default value is `0.0006`.
Returns: ( [ float, float, float ]) Tuple of `supportLine`, `upperLine` and `lowerLine`.
Example:
= ottlib.tott(source = close, length = 40, multiplier = 0.6, bandsMultiplier = 0.0006)
longCondition = ta.crossover(supportLine, upperLine)
shortCondition = ta.crossunder(supportLine, lowerLine)
• ott_channel(source, length, multiplier, ulMultiplier, llMultiplier)
Short Definition: Calculates OTT Channels.
Details: OTT Channels comprise nine lines. The central line, known as the "Mid Line," is the OTT of the given source's VIDYA. The remaining lines are positioned above and below the Mid Line, shifted by specified multipliers.
Parameters:
source (float) : (series float) Series of values to process. Default value is `close`
length (simple int) : (simple int) Number of bars to lookback. Default value is `2`
multiplier (simple float) : (simple float) Percent of trailing stop. Default value is `1.4`
ulMultiplier (simple float) : (simple float) Multiplier for upper line. Default value is `0.01`
llMultiplier (simple float) : (simple float) Multiplier for lower line. Default value is `0.01`
Returns: ( [ float, float, float, float, float, float, float, float, float ]) Tuple of `ul4`, `ul3`, `ul2`, `ul1`, `midLine`, `ll1`, `ll2`, `ll3`, `ll4`.
Example:
= ottlib.ott_channel(source = close, length = 2, multiplier = 1.4, ulMultiplier = 0.01, llMultiplier = 0.01)
• risotto(source, length, rsiLength, multiplier)
Short Definition: Calculates RISOTTO (RSI OTT).
Details: RISOTTO comprised of two lines: the "Support Line," which is the VIDYA of the given source's RSI value, calculated based on the length parameter, and the "RISOTTO Line," a trailing stop of the Support Line. The market is considered in an uptrend when the Support Line is above the RISOTTO Line, and in a downtrend if it is below.
Parameters:
source (float) : (series float) Series of values to process. Default value is `close`.
length (simple int) : (simple int) Number of bars to lookback. Default value is `50`.
rsiLength (simple int) : (simple int) Number of bars used for RSI calculation. Default value is `100`.
multiplier (simple float) : (simple float) Percent of trailing stop. Default value is `0.2`.
Returns: ( [ float, float ]) Tuple of `supportLine` and `risottoLine`.
Example:
= ottlib.risotto(source = close, length = 50, rsiLength = 100, multiplier = 0.2)
longCondition = ta.crossover(supportLine, risottoLine)
shortCondition = ta.crossunder(supportLine, risottoLine)
• sott(source, kLength, dLength, multiplier)
Short Definition: Calculates SOTT (Stochastic OTT).
Details: SOTT is comprised of two lines: the "Support Line," which is the VIDYA of the given source's Stochastic value, based on the %K and %D lengths, and the "SOTT Line," serving as the trailing stop of the Support Line. The market is considered in an uptrend when the Support Line is above the SOTT Line, and in a downtrend when it is below.
Parameters:
source (float) : (series float) Series of values to process. Default value is `close`.
kLength (simple int) : (simple int) Stochastic %K length. Default value is `500`.
dLength (simple int) : (simple int) Stochastic %D length. Default value is `200`.
multiplier (simple float) : (simple float) Percent of trailing stop. Default value is `0.5`.
Returns: ( [ float, float ]) Tuple of `supportLine` and `sottLine`.
Example:
= ottlib.sott(source = close, kLength = 500, dLength = 200, multiplier = 0.5)
longCondition = ta.crossover(supportLine, sottLine)
shortCondition = ta.crossunder(supportLine, sottLine)
• hottlott(length, multiplier)
Short Definition: Calculates HOTT & LOTT (Highest & Lowest OTT).
Details: HOTT & LOTT are composed of two lines: the "HOTT Line", which is the OTT of the highest price's VIDYA, and the "LOTT Line", the OTT of the lowest price's VIDYA. A high price surpassing the HOTT Line can be considered a long signal, while a low price dropping below the LOTT Line may indicate a short signal.
Parameters:
length (simple int) : (simple int) Number of bars to lookback. Default value is `20`.
multiplier (simple float) : (simple float) Percent of trailing stop. Default value is `0.6`.
Returns: ( [ float, float ]) Tuple of `hottLine` and `lottLine`.
Example:
= ottlib.hottlott(length = 20, multiplier = 0.6)
longCondition = ta.crossover(high, hottLine)
shortCondition = ta.crossunder(low, lottLine)
• rott(source, length, multiplier)
Short Definition: Calculates ROTT (Relative OTT).
Details: ROTT comprises two lines: the "Support Line", which is the VIDYA of the given source, and the "ROTT Line", the OTT of the Support Line's VIDYA. The market is considered in an uptrend if the Support Line is above the ROTT Line, and in a downtrend if it is below. ROTT is similar to OTT, but the key difference is that the ROTT Line is derived from the VIDYA of two bars of Support Line, not directly from it.
Parameters:
source (float) : (series float) Series of values to process. Default value is `close`.
length (simple int) : (simple int) Number of bars to lookback. Default value is `200`.
multiplier (simple float) : (simple float) Percent of trailing stop. Default value is `0.1`.
Returns: ( [ float, float ]) Tuple of `supportLine` and `rottLine`.
Example:
= ottlib.rott(source = close, length = 200, multiplier = 0.1)
isUpTrend = supportLine > rottLine
isDownTrend = supportLine < rottLine
• ft(source, length, majorMultiplier, minorMultiplier)
Short Definition: Calculates Fırsatçı Trend (Opportunist Trend).
Details: FT is comprised of two lines: the "Support Line", which is the VIDYA of the given source, and the "FT Line", a trailing stop of the Support Line calculated using both minor and major trend values. The market is considered in an uptrend when the Support Line is above the FT Line, and in a downtrend when it is below.
Parameters:
source (float) : (series float) Series of values to process. Default value is `close`.
length (simple int) : (simple int) Number of bars to lookback. Default value is `30`.
majorMultiplier (simple float) : (simple float) Percent of major trend. Default value is `3.6`.
minorMultiplier (simple float) : (simple float) Percent of minor trend. Default value is `1.8`.
Returns: ( [ float, float ]) Tuple of `supportLine` and `ftLine`.
Example:
= ottlib.ft(source = close, length = 30, majorMultiplier = 3.6, minorMultiplier = 1.8)
longCondition = ta.crossover(supportLine, ftLine)
shortCondition = ta.crossunder(supportLine, ftLine)
█ CUSTOM OTT CREATION
Users can create custom OTT implementations using f_ottTrail function in this library. The example code which uses EMA of 7 period as moving average and calculates OTT based of it is below.
Source Code:
//@version=5
indicator("Custom OTT", shorttitle = "COTT", overlay = true)
import ismailcarlik/ottlib/1 as ottlib
src = input.source(close, title = "Source")
length = input.int(7, title = "Length", minval = 1)
multiplier = input.float(2.0, title = "Multiplier", minval = 0.1)
support = ta.ema(source = src, length = length)
ott = ottlib.f_ottTrail(source = support, multiplier = multiplier)
pSupport = plot(support, title = "Moving Average Line (Support)", color = color.blue)
pOtt = plot(ott, title = "Custom OTT Line", color = color.orange)
fillColor = support >= ott ? color.new(color.green, 60) : color.new(color.red, 60)
fill(pSupport, pOtt, color = fillColor, title = "Direction")
Result:
█ DISCLAIMER
Trading is risky and most of the day traders lose money eventually. This library and its functions are only for educational purposes and should not be construed as financial advice. Past performances does not guarantee future results.
Catching Trend Reversals by shorting tops and buying bottomsHOLP (High of the low period) and LOHP (Low of the high period)
Catching Trend Reversals by shorting tops and buying bottoms
using this Swing High/Low Indicator
Trading Strategy comes from Mastering the Trade, by John Carter pg 300.
Trading Rules for Sells, Buys are reversed
1. Identifying a trending market, where today's price is making a 20-day high (17-18 day highs are also fine)
Note this is configurable by setting the trending period variable (defaults to 20)
For example if price is making a 20 period high or 20 period low, it will show a triangle up/down above the candle.
2. Identify the high bar in the uptrend
3. Go short once the price action closes below the low of this high bar
4. The initial stop is the high of the high bar.
5. If you are in the trade on the third day or period, use a 2 bar trailing stop.
You can check 2-bar trailing stop to draw the line, defaults to off.
Stop is indicated by the white dot.
Code Converted from TradeStation EasyLanguage
I can't find the original source anymore for the swing high/low plots, but if someone knows,
let me know and I'll credit here.

ICT IPDAGuided by ICT tutoring, I create this versatile indicator "IPDA".
This indicator shows a different way of viewing the “IPDA” by calculating from START
(-20 / -40 / -60) to (+20 /+40 /+60) Days, showing the Highs and Lows of the IPDA of the Previous days and both of the subsequent ones, the levels of (-20 / -40 / -60) Days can be taken into consideration as objectives to be achieved in the range of days (+20 /+40 /+60)
The user has the possibility to:
- Choose whether to display IPDAs before and after START
- Choose to show High and Low levels
- Choose to show Prices
The indicator should be used as ICT shows in its concepts.
Example on how to evaluate a possible Start IPDA:
Example for Entry targeting IPDAs :
If something is not clear, comment below and I will reply as soon as possible.

No Wick Bull/Bear Candlesticks with Arrow premiumNo Wick Bull/Bear Candlesticks with Arrow premium
This script is for a custom trading indicator called "No Wick Bull/Bear Candlesticks with Arrow premium" developed by ClearTradingMind. It is designed for use with trading platforms that support scripting, such as TradingView. This indicator combines several technical analysis tools to help traders identify potential buy and sell signals in a financial market.
Key Components of the Indicator:
Moving Average (MA): The script allows users to select from various types of moving averages (SMA, EMA, HMA, etc.), which smooth out price data to identify trends. Users can set the length and type of the moving average.
Upper and Lower Bands: These bands are set at a specified deviation percentage above and below the chosen moving average. They help in identifying overbought and oversold conditions.
No Wick Bull/Bear Candlestick Identification:
Bullish Condition: A bullish candlestick is identified when the closing price is higher than the opening price, the low equals the open, and the close is above the moving average.
Bearish Condition: A bearish candlestick is identified when the closing price is lower than the opening price, the high equals the open, and the close is below the moving average.
No Wick: These conditions also imply that the candlesticks have no wicks, suggesting strong buying or selling pressure.
Arrows for Trading Signals:
No lower wick bull bar
No upper wick bear bar
When a bullish condition is met, a green upward-pointing triangle is plotted below the candlestick, indicating a potential buy signal.
When a bearish condition is met, a red downward-pointing triangle is plotted above the candlestick, indicating a potential sell signal.
EMA 20: An additional Exponential Moving Average with a length of 20 periods is plotted for further trend analysis.
Background Color Changes: The script changes the background color to blue if the EMA 20 is above the upper band, and to red if it is below the lower band, providing visual cues about the market trend.
How It Works:
Traders can input their preferences for the moving average type and length, source of the MA (like closing prices), and the deviation percentage for the bands.
The script then calculates the moving average, upper and lower bands, and checks for bullish or bearish candlestick conditions without wicks.
When such conditions are met, it plots arrows to suggest buy or sell signals.
The EMA 20 and background color changes offer additional trend information.
Usage:
This indicator is particularly useful in markets with clear trends. The no wick bull/bear candlesticks indicate strong buying or selling pressure, and the arrows provide clear visual signals for traders to consider entering or exiting positions. As with all trading indicators, it's recommended to use this tool in conjunction with other forms of analysis to confirm trading signals.

Advanced Dynamic Threshold RSI [Elysian_Mind]Advanced Dynamic Threshold RSI Indicator
Overview
The Advanced Dynamic Threshold RSI Indicator is a powerful tool designed for traders seeking a unique approach to RSI-based signals. This indicator combines traditional RSI analysis with dynamic threshold calculation and optional Bollinger Bands to generate weighted buy and sell signals.
Features
Dynamic Thresholds: The indicator calculates dynamic thresholds based on market volatility, providing more adaptive signal generation.
Performance Analysis: Users can evaluate recent price performance to further refine signals. The script calculates the percentage change over a specified lookback period.
Bollinger Bands Integration: Optional integration of Bollinger Bands for additional confirmation and visualization of potential overbought or oversold conditions.
Customizable Settings: Traders can easily customize key parameters, including RSI length, SMA length, lookback bars, threshold multiplier, and Bollinger Bands parameters.
Weighted Signals: The script introduces a unique weighting mechanism for signals, reducing false positives and improving overall reliability.
Underlying Calculations and Methods
1. Dynamic Threshold Calculation:
The heart of the Advanced Dynamic Threshold RSI Indicator lies in its ability to dynamically calculate thresholds based on multiple timeframes. Let's delve into the technical details:
RSI Calculation:
For each specified timeframe (1-hour, 4-hour, 1-day, 1-week), the Relative Strength Index (RSI) is calculated using the standard 14-period formula.
SMA of RSI:
The Simple Moving Average (SMA) is applied to each RSI, resulting in the smoothing of RSI values. This smoothed RSI becomes the basis for dynamic threshold calculations.
Dynamic Adjustment:
The dynamically adjusted threshold for each timeframe is computed by adding a constant value (5 in this case) to the respective SMA of RSI. This dynamic adjustment ensures that the threshold reflects changing market conditions.
2. Weighted Signal System:
To enhance the precision of buy and sell signals, the script introduces a weighted signal system. Here's how it works technically:
Signal Weighting:
The script assigns weights to buy and sell signals based on the crossover and crossunder events between RSI and the dynamically adjusted thresholds. If a crossover event occurs, the weight is set to 2; otherwise, it remains at 1.
Signal Combination:
The weighted buy and sell signals from different timeframes are combined using logical operations. A buy signal is generated if the product of weights from all timeframes is equal to 2, indicating alignment across timeframe.
3. Experimental Enhancements:
The Advanced Dynamic Threshold RSI Indicator incorporates experimental features for educational exploration. While not intended as proven strategies, these features aim to offer users a glimpse into unconventional analysis. Some of these features include Performance Calculation, Volatility Calculation, Dynamic Threshold Calculation Using Volatility, Bollinger Bands Module, Weighted Signal System Incorporating New Features.
3.1 Performance Calculation:
The script calculates the percentage change in the price over a specified lookback period (variable lookbackBars). This provides a measure of recent performance.
pctChange(src, length) =>
change = src - src
pctChange = (change / src ) * 100
recentPerformance1H = pctChange(close, lookbackBars)
recentPerformance4H = pctChange(request.security(syminfo.tickerid, "240", close), lookbackBars)
recentPerformance1D = pctChange(request.security(syminfo.tickerid, "1D", close), lookbackBars)
3.2 Volatility Calculation:
The script computes the standard deviation of the closing price to measure volatility.
volatility1H = ta.stdev(close, 20)
volatility4H = ta.stdev(request.security(syminfo.tickerid, "240", close), 20)
volatility1D = ta.stdev(request.security(syminfo.tickerid, "1D", close), 20)
3.3 Dynamic Threshold Calculation Using Volatility:
The dynamic thresholds for RSI are calculated by adding a multiplier of volatility to 50.
dynamicThreshold1H = 50 + thresholdMultiplier * volatility1H
dynamicThreshold4H = 50 + thresholdMultiplier * volatility4H
dynamicThreshold1D = 50 + thresholdMultiplier * volatility1D
3.4 Bollinger Bands Module:
An additional module for Bollinger Bands is introduced, providing an option to enable or disable it.
// Additional Module: Bollinger Bands
bbLength = input(20, title="Bollinger Bands Length")
bbMultiplier = input(2.0, title="Bollinger Bands Multiplier")
upperBand = ta.sma(close, bbLength) + bbMultiplier * ta.stdev(close, bbLength)
lowerBand = ta.sma(close, bbLength) - bbMultiplier * ta.stdev(close, bbLength)
3.5 Weighted Signal System Incorporating New Features:
Buy and sell signals are generated based on the dynamic threshold, recent performance, and Bollinger Bands.
weightedBuySignal = rsi1H > dynamicThreshold1H and rsi4H > dynamicThreshold4H and rsi1D > dynamicThreshold1D and crossOver1H
weightedSellSignal = rsi1H < dynamicThreshold1H and rsi4H < dynamicThreshold4H and rsi1D < dynamicThreshold1D and crossUnder1H
These features collectively aim to provide users with a more comprehensive view of market dynamics by incorporating recent performance and volatility considerations into the RSI analysis. Users can experiment with these features to explore their impact on signal accuracy and overall indicator performance.
Indicator Placement for Enhanced Visibility
Overview
The design choice to position the "Advanced Dynamic Threshold RSI" indicator both on the main chart and beneath it has been carefully considered to address specific challenges related to visibility and scaling, providing users with an improved analytical experience.
Challenges Faced
1. Differing Scaling of RSI Results:
RSI values for different timeframes (1-hour, 4-hour, and 1-day) often exhibit different scales, especially in markets like gold.
Attempting to display these RSIs on the same chart can lead to visibility issues, as the scaling differences may cause certain RSI lines to appear compressed or nearly invisible.
2. Candlestick Visibility vs. RSI Scaling:
Balancing the visibility of candlestick patterns with that of RSI values posed a unique challenge.
A single pane for both candlesticks and RSIs may compromise the clarity of either, particularly when dealing with assets that exhibit distinct volatility patterns.
Design Solution
Placing the buy/sell signals above/below the candles helps to maintain a clear association between the signals and price movements.
By allocating RSIs beneath the main chart, users can better distinguish and analyze the RSI values without interference from candlestick scaling.
Doubling the scaling of the 1-hour RSI (displayed in blue) addresses visibility concerns and ensures that it remains discernible even when compared to the other two RSIs: 4-hour RSI (orange) and 1-day RSI (green).
Bollinger Bands Module is optional, but is turned on as default. When the module is turned on, the users can see the upper Bollinger Band (green) and lower Bollinger Band (red) on the main chart to gain more insight into price actions of the candles.
User Flexibility
This dual-placement approach offers users the flexibility to choose their preferred visualization:
The main chart provides a comprehensive view of buy/sell signals in relation to candlestick patterns.
The area beneath the chart accommodates a detailed examination of RSI values, each in its own timeframe, without compromising visibility.
The chosen design optimizes visibility and usability, addressing the unique challenges posed by differing RSI scales and ensuring users can make informed decisions based on both price action and RSI dynamics.
Usage
Installation
To ensure you receive updates and enhancements seamlessly, follow these steps:
Open the TradingView platform.
Navigate to the "Indicators" tab in the top menu.
Click on "Community Scripts" and search for "Advanced Dynamic Threshold RSI Indicator."
Select the indicator from the search results and click on it to add to your chart.
This ensures that any future updates to the indicator can be easily applied, keeping you up-to-date with the latest features and improvements.
Review Code
Open TradingView and navigate to the Pine Editor.
Copy the provided script.
Paste the script into the Pine Editor.
Click "Add to Chart."
Configuration
The indicator offers several customizable settings:
RSI Length: Defines the length of the RSI calculation.
SMA Length: Sets the length of the SMA applied to the RSI.
Lookback Bars: Determines the number of bars used for recent performance analysis.
Threshold Multiplier: Adjusts the multiplier for dynamic threshold calculation.
Enable Bollinger Bands: Allows users to enable or disable Bollinger Bands integration.
Interpreting Signals
Buy Signal: Generated when RSI values are above dynamic thresholds and a crossover occurs.
Sell Signal: Generated when RSI values are below dynamic thresholds and a crossunder occurs.
Additional Information
The indicator plots scaled RSI lines for 1-hour, 4-hour, and 1-day timeframes.
Users can experiment with additional modules, such as machine-learning simulation, dynamic real-life improvements, or experimental signal filtering, depending on personal preferences.
Conclusion
The Advanced Dynamic Threshold RSI Indicator provides traders with a sophisticated tool for RSI-based analysis, offering a unique combination of dynamic thresholds, performance analysis, and optional Bollinger Bands integration. Traders can customize settings and experiment with additional modules to tailor the indicator to their trading strategy.
Disclaimer: Use of the Advanced Dynamic Threshold RSI Indicator
The Advanced Dynamic Threshold RSI Indicator is provided for educational and experimental purposes only. The indicator is not intended to be used as financial or investment advice. Trading and investing in financial markets involve risk, and past performance is not indicative of future results.
The creator of this indicator is not a financial advisor, and the use of this indicator does not guarantee profitability or specific trading outcomes. Users are encouraged to conduct their own research and analysis and, if necessary, consult with a qualified financial professional before making any investment decisions.
It is important to recognize that all trading involves risk, and users should only trade with capital that they can afford to lose. The Advanced Dynamic Threshold RSI Indicator is an experimental tool that may not be suitable for all individuals, and its effectiveness may vary under different market conditions.
By using this indicator, you acknowledge that you are doing so at your own risk and discretion. The creator of this indicator shall not be held responsible for any financial losses or damages incurred as a result of using the indicator.
Kind regards,
Ely

Logarithmic Bollinger Bands [MisterMoTA]The script plot the normal top and bottom Bollinger Bands and from them and SMA 20 it finds fibonacci logarithmic levels where price can find temporary support/resistance.
To get the best results need to change the standard deviation to your simbol value, like current for BTC the Standards Deviation is 2.61, current Standard Deviation for ETH is 2.55.. etc.. find the right current standard deviation of your simbol with a search online.
The lines ploted by indicators are:
Main line is a 20 SMA
2 retracement Logarithmic Fibonacci 0.382 levels above and bellow 20 sma
2 retracement Logarithmic Fibonacci 0.618 levels above and bellow 20 sma
Top and Bottom Bollindger bands (ticker than the rest of the lines)
2 expansion Logarithmic Fibonacci 0.382 levels above Top BB and bellow Bottom BB
2 expansion Logarithmic Fibonacci 0.618 levels above Top BB and bellow Bottom BB
2 expansion Logarithmic Fibonacci level 1 above Top BB and bellow Bottom BB
2 expansion Logarithmic Fibonacci 1.618 levels above Top BB and bellow Bottom BB
Let me know If you find the indicator useful or PM if you need any custom changes to it.

Dip & Rip Patterns - The Quant Science🇺🇸
GENERAL OVERVIEW
This indicator detects Dip and Rip patterns by quickly highlighting them on the chart.
These patterns have become popular during the pandemic period mainly in the stock, ETF and cryptocurrency markets on which traders use two interesting strategies:
Buy The Dip
Sell The Rip
Before going into the merits of this technical indicator, let's understand what these two patterns mean and what they identify precisely.
Rip (Rise In Price) : wants to identify a market condition in which the price rises rapidly, for example from $100 to $110 in a few minutes or hours.
Dip (Drop In Price) : wants to identify a market condition in which the price drops rapidly, for example from $100 to $90 in a few minutes or hours.
HOW TO USE
For a better user experience, we recommend choosing a neutral colour for the candles while analysing with this indicator. You can quickly change the colour in Chart Settings > Symbol > Candles .
Depending on the configuration set by the user, the indicator will show Dip (Dip In Price) patterns in red and Rip (Rise In Price) patterns in green.
When the pattern forms, a circle will be displayed and a vertical line will be coloured on the chart along with the body of the candle. The user will then be able to quickly and easily track the configured market conditions.
In this example, we decided to use a 4H timeframe on the BTC/USDT pair (Binance).
Set in the user interface:
Period: 20
Dip (%): -25
Rip (%): 20
Price falls by 25% or more in 80 hours (Dip Pattern).
Price rise by 25% or more in 80 hours (Rip Pattern).
The user can easily configure the parameters via the user interface in the Inputs section (A) and change the indicator design in the Properties section (B).
🇮🇹
PANORAMICA GENERALE
Questo indicatore rileva i Dip e Rip patterns evidenziandoli velocemente sul grafico.
Questi patterns sono diventati famosi durante il periodo pandemico principalmente nel mercato delle azioni, ETF e Criptovalute su cui i trader utilizzano due interessanti strategie:
Buy The Dip
Sell The Rip
Prima di entrare nel merito di questo indicatore tecnico, comprendiamo il significato di questi due pattern e cosa identificano precisamente.
Rip (Rise In Price) : vuole identificare una condizione di mercato in cui il prezzo sale rapidamente, per esempio passando da 100$ a 110$ in pochi minuti o poche ore.
Dip (Drop In Price) : vuole identificare una condizione di mercato in cui il prezzo cala rapidamente, per esempio passando da 100$ a 90$ in pochi minuti o poche ore.
UTILIZZO
Per una migliore esperienza utente consigliamo di scegliere un colore neutro per le candele mentre si analizza con questo indicatore. Puoi cambiare velocemente il colore in Chart Settings > Symbol > Candles .
In base alla configurazione impostata dall'utente l'indicatore mostrerà in rosso i pattern Dip (Dip In Price) e in verde i pattern Rip (Rise In Price).
Quando il pattern si forma verrà visualizzato un cerchio e una linea verticale sul grafico che sarà colorata insieme al corpo della candela. L'utente quindi potrà tracciare facilmente e velocemente le condizioni di mercato configurate.
In questo esempio abbiamo deciso di utilizzare un timeframe 4H con l'obbiettivo di ricercare i patterns sul pair BTC/USDT (Binance).
Impostiamo nell'interfaccia utente:
Period: 20
Dip (%): -25
Rip (%): 20
Il prezzo diminuisce del 25% o più in 80 ore (Dip Pattern).
Il prezzo aumenta del 25% o più in 80 ore (Rip Pattern).
L' utente può configurare facilmente i parametri attraverso l'interfaccia utente nella sezione Inputs (A) e modificare il design dell'indicatore nella sezione Properties (B).

Triple EMA By Ozy
**Triple EMA By Ozy**
The "Triple EMA By Ozy" is a visual indicator that offers traders a clear and concise view of three exponential moving averages (EMAs) at a glance. This tool combines three common EMAs (20, 50, and 200) and additionally calculates and displays the slope angle of each EMA, allowing for a more precise identification of the current trend's direction and strength.
**Key Features:**
1. **Three EMAs in One Indicator:** The 20, 50, and 200-period EMAs are popular among traders and are crucial for identifying short, medium, and long-term trends.
2. **Slope Angle:** The indicator calculates the slope angle for each EMA, which can be indicative of the trend's strength. A positive angle suggests bullish momentum, while a negative angle indicates bearish momentum.
3. **Clear Visual Indication:** The indicator uses colors to easily distinguish between EMAs and also to identify the direction of the slope angle (green for positive, red for negative).
**How to Use:**
- An increasing angle in the EMA20 may indicate the beginning of a new short-term upward trend.
- A decreasing angle in the EMA200 might signal a long-term downtrend gaining strength.
- Crosses between the EMAs can also be points of interest, like the golden cross (EMA50 crossing above the EMA200) or the death cross (EMA50 crossing below the EMA200).
**Triple EMA By Ozy**
El "Triple EMA By Ozy" es un indicador visual que proporciona a los traders una visión clara y concisa de tres medias móviles exponenciales (EMAs) en un solo vistazo. Esta herramienta combina tres EMAs comunes (20, 50 y 200) y, además, calcula y muestra el ángulo de inclinación de cada EMA para identificar con mayor precisión la dirección y la fuerza de la tendencia actual.
**Características principales:**
1. **Tres EMAs en un solo indicador:** Las EMAs de 20, 50 y 200 períodos son populares entre los traders y son esenciales para identificar tendencias a corto, mediano y largo plazo.
2. **Ángulo de inclinación:** El indicador calcula el ángulo de inclinación de cada EMA, que puede ser un indicativo de la fuerza de la tendencia. Un ángulo positivo sugiere un impulso alcista, mientras que un ángulo negativo indica un impulso bajista.
3. **Indicación visual clara:** El indicador utiliza colores para distinguir fácilmente entre EMAs y también para identificar la dirección del ángulo de inclinación (verde para positivo, rojo para negativo).
**Cómo usar:**
- Un ángulo creciente en la EMA20 puede indicar el comienzo de una nueva tendencia al alza a corto plazo.
- Un ángulo decreciente en la EMA200 puede ser una señal de una tendencia bajista a largo plazo que está ganando fuerza.
- Los cruces entre las EMAs también pueden ser puntos de interés, como el cruce dorado (EMA50 cruza por encima de la EMA200) o el cruce de la muerte (EMA50 cruza por debajo de la EMA200).

MA Support & Resistance SignalThis indicator is to show MA Support/Resistance and trend of a stock.
It contains three (3) Moving Averages that can be set to SMA or EMA:
1. Upper Line : SMA 5 (default)
2. Lower Line : SMA 20 (default)
3. Support/Resistance Line : SMA 10 (default)
Other signals:
1. Bull and Blue Dotted Line signal: Upper Line (SMA 5) crossover with Lower Line (SMA 20).
2. Bear and Red Dotted Line signal: Lower Line (SMA 20) crossover with Upper Line (SMA 5).
3. Red Triangle signal: Price closes below Support/Resistance Line (SMA 10).
4. Green Bar signal: Price breaks Support/Resistance Line (SMA 10).
The way how I use it:
- Since I don't like my chart to be crowded with a lot of moving averages, I will disable SMA 5 and SMA 10 and will only leave SMA 20 as my final support line.
- Entry when only:
1. Bull signal appeared.
2. Green bar appeared, or;
3. Price rebound on SMA 20.
I let the script open so that you guys can custom it based on your own preferences. Hope you guys enjoy it.