3 EMA & SMA (Market Cycle)Simple Indicator based on 3 Simple and 3 Exponential Moving Averages. Used to indicate Market Cycles.
Definition of Bull Market: 10 SMA is above 21 EMA . 30 SMA slope is up. 55 EMA is trending above 200 EMA .
Definition of Bear Market: 10 SMA is below 21 EMA . 30 SMA slope is down. 55 EMA is trending below 200 EMA .
Cari dalam skrip untuk "55 ema"
UM EMA SMA WMA HMA with Directional Color ChangeUM EMA SMA WMA HMA with Directional Color Change
Description:
This is a Swiss Army knife type of Moving Average tool. Select your favorite Moving Average type, EMA - Exponential Moving Average, SMA - Simple Moving Average, WMA - Weighted Moving Average, or HMA - Hull Moving Average. Then selection your number of periods. The MA line is green when trending higher and red when trending lower. The fill between price and the MA line matches the red/green of the direction.
Defaults and Configuration:
The default setting is 65 period and EMA. Line colors and optional fill colors are user-configurable.
Alerts:
An alert can be set on the MA for directional color changes (red to green, or green to red) Right click the indicator and select Add Alert. Then select Bullish or Bearish color change.
Suggested Uses:
Add this to any timeframe chart with your favorite Moving averages. A strategy I use frequently is to "stretch" the Moving average. For example if you like the 8 day moving average on the daily chart, try the 52 period Moving average on the hourly chart. (6.5 market hours per day * 8) By looking at smaller time frames with longer MAs you get smoother color transitions on the Moving average. Add multiple instances of the MA. I prefer to use a smaller quick MA with a longer MA that represents a longer time frame.
Another use case I also like is the color transition over a Moving Average crossover. While I do like the daily 2/6 and 8/3 moving average crossovers, red-to-green and green-to-red color transitions seem to work with less lag than the crossovers.
Suggested Settings:
Daily charts: 8 EMA
Hourly charts: 55 EMA
30 minute charts: 65 WMA. (I like this one for inverse ETFs)
3 minutes charts: 178 EMA and 233 EMA
I also like to round MA settings up or down to the nearest fibonacci number: 5, 8, 13, 21, 34, 55, 89, 144, 233, 377, etc.
EMA Squeeze RythmHere's a description of this indicator and its purpose:
This indicator is based on the concept of price consolidation and volatility contraction using multiple Exponential Moving Averages (EMAs). It primarily looks for "squeeze" conditions where the EMAs converge, indicating potential market consolidation and subsequent breakout opportunities.
Key Features:
1. Uses 8 EMAs (20-55 period) to measure price compression
2. Measures the distance between fastest (20) and slowest (55) EMAs in ATR units
3. Identifies four distinct states:
- PRE-SQZE: Initial convergence of EMAs
- SQZE: Tighter convergence
- EXT-SQZE: Extreme convergence (highest probability of breakout)
- RELEASE: EMAs begin to expand (potential breakout in progress)
Best Used For:
- Identifying potential breakout setups
- Finding periods of low volatility before explosive moves
- Confirming trend strength using higher timeframe analysis
- Trading mean reversion strategies during squeeze states
- Catching momentum moves during release states
The indicator works well on any timeframe but is particularly effective on 15M to 4H charts for most liquid markets. It includes higher timeframe analysis to help confirm the broader market context.
5 Moving Average (Simple / Exponential)Defaults to 1 SMA with 4 EMA bands. 200 SMA is intended to show the trend; 20,40 and 55 EMA show entries; 81 EMA is used as stop/take profit. Defaults are inspired by 'Eric Choe' but you can switch between EMA and SMA as per your own preference. Philakone uses all 5 as EMA 8, 13, 21, 55, 200
Simple Fibonacci EMA StrategyThis script gives a buy signal when the 21 EMA crosses above the 55 EMA and a sell signal when the 55 EMA crosses below the 21 EMA. This strategy works well for cryptocurrencies at all time frames. However, it does not work for stocks or forex. Sometimes, the simple strategies are the best strategies, especially in markets that have not been dominated by institutions.
When editing how much of your balance to trade, attach at least one decimal place. For instance, 12.0, 90.0, and 83.3 would work, but 100, 32, or 70 does not work.
Crypto Quad EMA 8,13,21,55Displays 8,13,21,55 EMAs on a single indicator.
Useful for Crypto trading and reduced the number of indicators needed to view multiple EMAs
When shorter EMAs cross over the longer its a good sign of Bullish/Bearish reversal.
This sentiment is more true at longer timeframes, such as daily candles, as the trend has more momentum.
OathOath consists of 21 and 55 EMA , Commodity Channel Index and Supertrend indicator. It confirms a trend and gives you a signal on a pullback. Original creation worked on 1h EURUSD chart.
Oath is merely a rebrand of my previous Patient Trendfollower strategy. Unlike Patient Trendfollower, Oath has actually a good name and it does not fill your screen with noodles.
►Long setup:
• 21 EMA is above 55 EMA , which is above the Supertrend indicator.
• Commodity Channel Index is an oscillator, which prints into the chart if extreme levels are reached. Green is for a level above 100 or below -100, red is above 140 or below -140 and black is above 180 or below -180.
• If 21 EMA > 55EMA > Supertrend and an oversold signal appear, you can buy into the trend.
• When backtesting on 1h EURUSD , profit target 400 pips worked best with a stop-loss below Supertrend's bottom and the size of your spread. Spread values do not subtract from your profit.
• A picture shows two valid entries.
Further examples can be found in Patient Trendfollower 's description.
Thanks to:
• @everget for providing Supertrend solution.
• Satik FX who hand-tested the system by hand and reported results in this article. He is my main inspiration for creating the complete indicator as one because I want to be able to show and hide it with a single click.
Patient Trendfollower (7)(alpha)Patient Trendfollower consists of 21 and 55 EMA, Commodity Channel Index and Supertrend indicator. It confirms a trend and gives you a signal on a pullback. Original creation worked on 1h EURUSD chart.
►Long setup:
• 21 EMA is above 55 EMA, which is above the Supertrend indicator.
• Commodity Channel Index is an oscillator, which prints into the chart if extreme levels are reached. Green is for a level above 100 or below -100, red is above 140 or below -140 and black is above 180 or below -180.
• If 21 EMA > 55EMA > Supertrend and an oversold signal appear, you can buy into the trend.
• When backtesting on 1h EURUSD, profit target 400 pips worked best with a stop-loss below Supertrend's bottom and the size of your spread.
• A picture shows two valid entries.
: This part still malfunctions and shows red dots over some green ones. It is important to disable red ones in the settings to see green ones.
Some more long signals:
Some short signals:
►Backtesting data with default settings and trading only green CCI signals with mentioned risk management strategy:
• 212 closed trades
• 58.96% profitable with average win trade 348 USD and average loss trade 263 USD when only green signals are followed.
• Profit factor 1.903, Sharpee 0.792
• 20 bars is average for all trades, short trades were 18 bars long on average.
With given data, you can see the strategy is profitable by itself. However, original risk management settings do work only on 1h charts of EURUSD and would need to be adjusted for other instruments based on average volatility.
Even though the profitability is low, you can increase your odds by a great margin, if you properly use price action (impulsive and corrective moves, patterns, bar analysis), if you trade when major exchanges are open, you may also use wave analysis such as Elliot Waves or Market Profiles to predict whether the next day might be a trending day. My backtesting program didn't consider these ideas.
Unfortunately, I won't be making backtesting strategy public with it anytime soon, because it still has some parts that do not work. I am ok with that since I understand the code and know what does malfunction and how. Then, there are parts which I am not sure how to fix yet. This is why the indicator is still considered alpha.
In the future when a strategy is published, you will also be able to set your own overbought/oversold values without entering the code itself and probably some other features. But I am not in a hurry for that. You can give me feedback on UX and try to figure out the best setups for other symbols, it might help to improve the automatic testing script when I know what I should achieve. My main point is to make this public for friends who can already be using it on EURUSD at least.
Close doesn't always have to be 400 pips, you might want to close on a logical level such as strong resistance or a trendline too.
Thanks to:
• @everget for providing Supertrend solution.
• Satik FX who hand-tested the system by hand and reported results in this article . He is my main inspiration for creating the complete indicator as one because I want to be able to show and hide it with a single click. My future scripts will also work as a whole strategy each by itself.
• The number in the script's name comes from Satik's numbering. A mentioned article was his seventh shared strategy.
EMA 9/12/21/55 in one placeBased on --> // Inspired by Philakone's 55 EMA Swing Trading Strategy
- Increased EMA line visibility
- Removed buy/sell arrow
Philakone 5EMA Swing Trading Strategy [Buy&Sell Signals]Fork of the "Philakone 55 EMA Swing Trading Strategy" made by lvynnil
-Added 200EMA
-Changed shape of the arrows and added text of Buy & Sell
All credits go to lvynnil
For more informations about the original script go to:
Dynamic Time Zone EMA with Candle Trend AnalysisCandleTrend TZ is a powerful analytical tool that integrates time zones, exponential moving averages (EMA), and custom candle coloring based on trend direction. This indicator is ideal for traders looking to analyze market trends within specific time sessions effectively.
Key Features:
Time Zones:
Divides the chart into four distinct time intervals, each highlighted with a unique background color.
Fully customizable start and end times for each interval, allowing for adaptation to various trading schedules.
Exponential Moving Averages (EMA):
Displays three EMAs with user-defined lengths:
EMA 200 (blue) for long-term trends.
EMA 50 (green) for medium-term trends.
EMA 20 (red) for short-term trends.
Helps identify trend direction and strength.
Custom Candle Coloring:
Utilizes smoothed Heiken Ashi and Triple EMA (TEMA) calculations for enhanced candle coloring:
Green candles indicate an upward trend.
Red candles signal a downward trend.
Filters out market noise, providing a clear visual representation of market dynamics.
Customization Options:
Time Zones:
Adjustable start and end times for each of the four sessions:
Input hour and minute for start and end times (e.g., Interval 1 Start/End Hour/Minute).
Background colors are pre-defined but can be modified in the code.
EMAs:
User-defined lengths for each EMA:
EMA 200 Length (default: 200)
EMA 50 Length (default: 50)
EMA 20 Length (default: 20)
TEMA Settings:
Parameters for trend smoothing:
TEMA Length (default: 55)
EMA Length (default: 60)
Use Cases:
Intraday Session Analysis:
Use time zones to differentiate between morning, afternoon, and evening market activity.
The background colors make it easy to track session-specific trends.
Trend Trading:
Analyze EMA crossings and their slopes to confirm market direction.
Green candles indicate buying opportunities, while red candles highlight selling signals.
Noise Reduction:
TEMA smoothing removes market noise, allowing you to focus on the primary market trend.
Adaptation to Custom Strategies:
By adjusting time intervals, you can tailor the indicator to specific trading styles or market conditions.
Benefits:
Versatility for both trending and sideways markets.
Intuitive and user-friendly setup.
Suitable for traders of all skill levels, from beginners to professionals.
CandleTrend TZ is an indispensable tool for understanding market dynamics, enhancing your trading precision, and making well-informed decisions. 🚀
EMA & SupertrendStrategy has been built based on the crossover of 21 EMA (EMA 1) and 55 EMA (EMA 2). Along with with strategy, user can alter the period of EMA 1 & EMA 2 based on their suitability.
When EMA 1 crossover EMA2 or when prices closes above EMA 1 and EMA 1 is greater than EMA 2, strategy will generate Buy signal.
Position gets closed when price closes below EMA 2.
200 EMA, 233 EMA and Supertrend has been added for study purpose.
Ruckard TradingLatinoThis strategy tries to mimic TradingLatino strategy.
The current implementation is beta.
Si hablas castellano o espanyol por favor consulta MENSAJE EN CASTELLANO más abajo.
It's aimed at BTCUSDT pair and 4h timeframe.
STRATEGY DEFAULT SETTINGS EXPLANATION
max_bars_back=5000 : This is a random number of bars so that the strategy test lasts for one or two years
calc_on_order_fills=false : To wait for the 4h closing is too much. Try to check if it's worth entering a position after closing one. I finally decided not to recheck if it's worth entering after an order is closed. So it is false.
calc_on_every_tick=false
pyramiding=0 : We only want one entry allowed in the same direction. And we don't want the order to scale by error.
initial_capital=1000 : These are 1000 USDT. By using 1% maximum loss per trade and 7% as a default stop loss by using 1000 USDT at 12000 USDT per BTC price you would entry with around 142 USDT which are converted into: 0.010 BTC . The maximum number of decimal for contracts on this BTCUSDT market is 3 decimals. E.g. the minimum might be: 0.001 BTC . So, this minimal 1000 amount ensures us not to entry with less than 0.001 entries which might have happened when using 100 USDT as an initial capital.
slippage=1 : Binance BTCUSDT mintick is: 0.01. Binance slippage: 0.1 % (Let's assume). TV has an integer slippage. It does not have a percentage based slippage. If we assume a 1000 initial capital, the recommended equity is 142 which at 11996 USDT per BTC price means: 0.011 BTC. The 0.1% slippage of: 0.011 BTC would be: 0.000011 . This is way smaller than the mintick. So our slippage is going to be 1. E.g. 1 (slippage) * 0.01 (mintick)
commission_type=strategy.commission.percent and commission_value=0.1 : According to: binance . com / en / fee / schedule in VIP 0 level both maker and taker fees are: 0.1 %.
BACKGROUND
Jaime Merino is a well known Youtuber focused on crypto trading
His channel TradingLatino
features monday to friday videos where he explains his strategy.
JAIME MERINO STANCE ON BOTS
Jaime Merino stance on bots (taken from memory out of a 2020 June video from him):
'~
You know. They can program you a bot and it might work.
But, there are some special situations that the bot would not be able to handle.
And, I, as a human, I would handle it. And the bot wouldn't do it.
~'
My long term target with this strategy script is add as many
special situations as I can to the script
so that it can match Jaime Merino behaviour even in non normal circumstances.
My alternate target is learn Pine script
and enjoy programming with it.
WARNING
This script might be bigger than other TradingView scripts.
However, please, do not be confused because the current status is beta.
This script has not been tested with real money.
This is NOT an official strategy from Jaime Merino.
This is NOT an official strategy from TradingLatino . net .
HOW IT WORKS
It basically uses ADX slope and LazyBear's Squeeze Momentum Indicator
to make its buy and sell decisions.
Fast paced EMA being bigger than slow paced EMA
(on higher timeframe) advices going long.
Fast paced EMA being smaller than slow paced EMA
(on higher timeframe) advices going short.
It finally add many substrats that TradingLatino uses.
SETTINGS
__ SETTINGS - Basics
____ SETTINGS - Basics - ADX
(ADX) Smoothing {14}
(ADX) DI Length {14}
(ADX) key level {23}
____ SETTINGS - Basics - LazyBear Squeeze Momentum
(SQZMOM) BB Length {20}
(SQZMOM) BB MultFactor {2.0}
(SQZMOM) KC Length {20}
(SQZMOM) KC MultFactor {1.5}
(SQZMOM) Use TrueRange (KC) {True}
____ SETTINGS - Basics - EMAs
(EMAS) EMA10 - Length {10}
(EMAS) EMA10 - Source {close}
(EMAS) EMA55 - Length {55}
(EMAS) EMA55 - Source {close}
____ SETTINGS - Volume Profile
Lowest and highest VPoC from last three days
is used to know if an entry has a support
VPVR of last 100 4h bars
is also taken into account
(VP) Use number of bars (not VP timeframe): Uses 'Number of bars {100}' setting instead of 'Volume Profile timeframe' setting for calculating session VPoC
(VP) Show tick difference from current price {False}: BETA . Might be useful for actions some day.
(VP) Number of bars {100}: If 'Use number of bars (not VP timeframe)' is turned on this setting is used to calculate session VPoC.
(VP) Volume Profile timeframe {1 day}: If 'Use number of bars (not VP timeframe)' is turned off this setting is used to calculate session VPoC.
(VP) Row width multiplier {0.6}: Adjust how the extra Volume Profile bars are shown in the chart.
(VP) Resistances prices number of decimal digits : Round Volume Profile bars label numbers so that they don't have so many decimals.
(VP) Number of bars for bottom VPOC {18}: 18 bars equals 3 days in suggested timeframe of 4 hours. It's used to calculate lowest session VPoC from previous three days. It's also used as a top VPOC for sells.
(VP) Ignore VPOC bottom advice on long {False}: If turned on it ignores bottom VPOC (or top VPOC on sells) when evaluating if a buy entry is worth it.
(VP) Number of bars for VPVR VPOC {100}: Number of bars to calculate the VPVR VPoC. We use 100 as Jaime once used. When the price bounces back to the EMA55 it might just bounce to this VPVR VPoC if its price it's lower than the EMA55 (Sells have inverse algorithm).
____ SETTINGS - ADX Slope
ADX Slope
help us to understand if ADX
has a positive slope, negative slope
or it is rather still.
(ADXSLOPE) ADX cut {23}: If ADX value is greater than this cut (23) then ADX has strength
(ADXSLOPE) ADX minimum steepness entry {45}: ADX slope needs to be 45 degrees to be considered as a positive one.
(ADXSLOPE) ADX minimum steepness exit {45}: ADX slope needs to be -45 degrees to be considered as a negative one.
(ADXSLOPE) ADX steepness periods {3}: In order to avoid false detection the slope is calculated along 3 periods.
____ SETTINGS - Next to EMA55
(NEXTEMA55) EMA10 to EMA55 bounce back percentage {80}: EMA10 might bounce back to EMA55 or maybe to 80% of its complete way to EMA55
(NEXTEMA55) Next to EMA55 percentage {15}: How much next to the EMA55 you need to be to consider it's going to bounce back upwards again.
____ SETTINGS - Stop Loss and Take Profit
You can set a default stop loss or a default take profit.
(STOPTAKE) Stop Loss % {7.0}
(STOPTAKE) Take Profit % {2.0}
____ SETTINGS - Trailing Take Profit
You can customize the default trailing take profit values
(TRAILING) Trailing Take Profit (%) {1.0}: Trailing take profit offset in percentage
(TRAILING) Trailing Take Profit Trigger (%) {2.0}: When 2.0% of benefit is reached then activate the trailing take profit.
____ SETTINGS - MAIN TURN ON/OFF OPTIONS
(EMAS) Ignore advice based on emas {false}.
(EMAS) Ignore advice based on emas (On closing long signal) {False}: Ignore advice based on emas but only when deciding to close a buy entry.
(SQZMOM) Ignore advice based on SQZMOM {false}: Ignores advice based on SQZMOM indicator.
(ADXSLOPE) Ignore advice based on ADX positive slope {false}
(ADXSLOPE) Ignore advice based on ADX cut (23) {true}
(STOPTAKE) Take Profit? {false}: Enables simple Take Profit.
(STOPTAKE) Stop Loss? {True}: Enables simple Stop Loss.
(TRAILING) Enable Trailing Take Profit (%) {True}: Enables Trailing Take Profit.
____ SETTINGS - Strategy mode
(STRAT) Type Strategy: 'Long and Short', 'Long Only' or 'Short Only'. Default: 'Long and Short'.
____ SETTINGS - Risk Management
(RISKM) Risk Management Type: 'Safe', 'Somewhat safe compound' or 'Unsafe compound'. ' Safe ': Calculations are always done with the initial capital (1000) in mind. The maximum losses per trade/day/week/month are taken into account. ' Somewhat safe compound ': Calculations are done with initial capital (1000) or a higher capital if it increases. The maximum losses per trade/day/week/month are taken into account. ' Unsafe compound ': In each order all the current capital is gambled and only the default stop loss per order is taken into account. That means that the maximum losses per trade/day/week/month are not taken into account. Default : 'Somewhat safe compound'.
(RISKM) Maximum loss per trade % {1.0}.
(RISKM) Maximum loss per day % {6.0}.
(RISKM) Maximum loss per week % {8.0}.
(RISKM) Maximum loss per month % {10.0}.
____ SETTINGS - Decimals
(DECIMAL) Maximum number of decimal for contracts {3}: How small (3 decimals means 0.001) an entry position might be in your exchange.
EXTRA 1 - PRICE IS IN RANGE indicator
(PRANGE) Print price is in range {False}: Enable a bottom label that indicates if the price is in range or not.
(PRANGE) Price range periods {5}: How many previous periods are used to calculate the medians
(PRANGE) Price range maximum desviation (%) {0.6} ( > 0 ): Maximum positive desviation for range detection
(PRANGE) Price range minimum desviation (%) {0.6} ( > 0 ): Mininum negative desviation for range detection
EXTRA 2 - SQUEEZE MOMENTUM Desviation indicator
(SQZDIVER) Show degrees {False}: Show degrees of each Squeeze Momentum Divergence lines to the x-axis.
(SQZDIVER) Show desviation labels {False}: Whether to show or not desviation labels for the Squeeze Momentum Divergences.
(SQZDIVER) Show desviation lines {False}: Whether to show or not desviation lines for the Squeeze Momentum Divergences.
EXTRA 3 - VOLUME PROFILE indicator
WARNING: This indicator works not on current bar but on previous bar. So in the worst case it might be VP from 4 hours ago. Don't worry, inside the strategy calculus the correct values are used. It's just that I cannot show the most recent one in the chart.
(VP) Print recent profile {False}: Show Volume Profile indicator
(VP) Avoid label price overlaps {False}: Avoid label prices to overlap on the chart.
EXTRA 4 - ZIGNALY SUPPORT
(ZIG) Zignaly Alert Type {Email}: 'Email', 'Webhook'. ' Email ': Prepare alert_message variable content to be compatible with zignaly expected email content format. ' Webhook ': Prepare alert_message variable content to be compatible with zignaly expected json content format.
EXTRA 5 - DEBUG
(DEBUG) Enable debug on order comments {False}: If set to true it prepares the order message to match the alert_message variable. It makes easier to debug what would have been sent by email or webhook on each of the times an order is triggered.
HOW TO USE THIS STRATEGY
BOT MODE: This is the default setting.
PROPER VOLUME PROFILE VIEWING: Click on this strategy settings. Properties tab. Make sure Recalculate 'each time the order was run' is turned off.
NEWBIE USER: (Check PROPER VOLUME PROFILE VIEWING above!) You might want to turn on the 'Print recent profile {False}' setting. Alternatively you can use my alternate realtime study: 'Resistances and supports based on simplified Volume Profile' but, be aware, it might consume one indicator.
ADVANCED USER 1: Turn on the 'Print price is in range {False}' setting and help us to debug this subindicator. Also help us to figure out how to include this value in the strategy.
ADVANCED USER 2: Turn on the all the (SQZDIVER) settings and help us to figure out how to include this value in the strategy.
ADVANCED USER 3: (Check PROPER VOLUME PROFILE VIEWING above!) Turn on the 'Print recent profile {False}' setting and report any problem with it.
JAIME MERINO: Just use the indicator as it comes by default. It should only show BUY signals, SELL signals and their associated closing signals. From time to time you might want to check 'ADVANCED USER 2' instructions to check that there's actually a divergence. Check also 'ADVANCED USER 1' instructions for your amusement.
EXTRA ADVICE
It's advised that you use this strategy in addition to these two other indicators:
* Squeeze Momentum Indicator
* ADX
so that your chart matches as close as possible to TradingLatino chart.
ZIGNALY INTEGRATION
This strategy supports Zignaly email integration by default. It also supports Zignaly Webhook integration.
ZIGNALY INTEGRATION - Email integration example
What you would write in your alert message:
||{{strategy.order.alert_message}}||key=MYSECRETKEY||
ZIGNALY INTEGRATION - Webhook integration example
What you would write in your alert message:
{ {{strategy.order.alert_message}} , "key" : "MYSECRETKEY" }
CREDITS
I have reused and adapted some code from
'Directional Movement Index + ADX & Keylevel Support' study
which it's from TradingView console user.
I have reused and adapted some code from
'3ema' study
which it's from TradingView hunganhnguyen1193 user.
I have reused and adapted some code from
'Squeeze Momentum Indicator ' study
which it's from TradingView LazyBear user.
I have reused and adapted some code from
'Strategy Tester EMA-SMA-RSI-MACD' study
which it's from TradingView fikira user.
I have reused and adapted some code from
'Support Resistance MTF' study
which it's from TradingView LonesomeTheBlue user.
I have reused and adapted some code from
'TF Segmented Linear Regression' study
which it's from TradingView alexgrover user.
I have reused and adapted some code from
"Poor man's volume profile" study
which it's from TradingView IldarAkhmetgaleev user.
FEEDBACK
Please check the strategy source code for more detailed information
where, among others, I explain all of the substrats
and if they are implemented or not.
Q1. Did I understand wrong any of the Jaime substrats (which I have implemented)?
Q2. The strategy yields quite profit when we should long (EMA10 from 1d timeframe is higher than EMA55 from 1d timeframe.
Why the strategy yields much less profit when we should short (EMA10 from 1d timeframe is lower than EMA55 from 1d timeframe)?
Any idea if you need to do something else rather than just reverse what Jaime does when longing?
FREQUENTLY ASKED QUESTIONS
FAQ1. Why are you giving this strategy for free?
TradingLatino and his fellow enthusiasts taught me this strategy. Now I'm giving back to them.
FAQ2. Seriously! Why are you giving this strategy for free?
I'm confident his strategy might be improved a lot. By keeping it to myself I would avoid other people contributions to improve it.
Now that everyone can contribute this is a win-win.
FAQ3. How can I connect this strategy to my Exchange account?
It seems that you can attach alerts to strategies.
You might want to combine it with a paying account which enable Webhook URLs to work.
I don't know how all of this works right now so I cannot give you advice on it.
You will have to do your own research on this subject. But, be careful. Automating trades, if not done properly,
might end on you automating losses.
FAQ4. I have just found that this strategy by default gives more than 3.97% of 'maximum series of losses'. That's unacceptable according to my risk management policy.
You might want to reduce default stop loss setting from 7% to something like 5% till you are ok with the 'maximum series of losses'.
FAQ5. Where can I learn more about your work on this strategy?
Check the source code. You might find unused strategies. Either because there's not a substantial increases on earnings. Or maybe because they have not been implemented yet.
FAQ6. How much leverage is applied in this strategy?
No leverage.
FAQ7. Any difference with original Jaime Merino strategy?
Most of the times Jaime defines an stop loss at the price entry. That's not the case here. The default stop loss is 7% (but, don't be confused it only means losing 1% of your investment thanks to risk management). There's also a trailing take profit that triggers at 2% profit with a 1% trailing.
FAQ8. Why this strategy return is so small?
The strategy should be improved a lot. And, well, backtesting in this platform is not guaranteed to return theoric results comparable to real-life returns. That's why I'm personally forward testing this strategy to verify it.
MENSAJE EN CASTELLANO
En primer lugar se agradece feedback para mejorar la estrategia.
Si eres un usuario avanzado y quieres colaborar en mejorar el script no dudes en comentar abajo.
Ten en cuenta que aunque toda esta descripción tenga que estar en inglés no es obligatorio que el comentario esté en inglés.
CHISTE - CASTELLANO
¡Pero Jaime!
¡400.000!
¡Tu da mun!
Ultimate Moving Averages (SMA & EMA)Welcome to the Ultimate Moving Average indicator.
Never again spend time looking for EMA / SMA indicators when you can have them all in this single indicator.
Options include :
Daily Chart: Classic Golden / Death Cross - 50/D and 200/D SMA
Daily Chart: 3-day Golden / Death Cross - 150/D and 600/D SMA
Daily Chart: 140/D SMA
Daily Chart: 700/D SMA
Daily Chart: 1458/D SMA
Daily Chart: Golden Ratio Multiplier
Any Chart: Scalping
9 SMA
10 SMA
20 SMA
21 SMA
30 SMA
34 SMA
50 SMA
80 SMA
100 SMA
200 SMA
8 EMA
10 EMA
13 EMA
20 EMA
21 EMA
26 EMA
30 EMA
34 EMA
50 EMA
55 EMA
80 EMA
89 EMA
100 EMA
200 EMA
Forecast 7 EMA's 6 periodsForecast 7 EMA's 6 periods
This script is an upgrade of the existing Triple MA Forecast from Yatrader2
To allow the user to display 7 different EMAs and look 6 candles ahead
Default Value
8 ema
13 ema
21 ema
55 ema
100 ema
128 ema
200 ema
Note:
Best to use on high timeframe, if on low timeframe change the forecast maximum to lower
This was made to forecast the 21 ema on weekly timeframe on the upcomming Bitcoin price
EMA orderly stacked or notThis script plots a green circle on top of the chart when the EMAs are stacked positively, a red circle if they are stacked negatively and gray if neither positively nor negatively stacked.
The EMAs used are:
8 EMA
21 EMA
34 EMA
55 EMA
89 EMA
Useful when you look for a quick and easy way to see if these EMAs are stacked positively or negatively as a confirmation to the Squeeze Pro indicator if going long or short (Squeeze Pro is developed by John Carter at SimplerTrading.com and can be purchased there).
Default 100 bars back, but that can be adjusted.
Remember to do your own research.
Feel free to adjust the script to your liking.
The script is not meant to be, and do not constitute, financial, investment, trading, or other types of advice or recommendations supplied or endorsed by me.
Have fun!
trend Screener downtrendthis is in continuation with - previous trend screener i have published, In this code only downtrend screener is there ,This is type of custom screener I searched and made to screen bulk stocks any one can modify it, other may get help out of it.
you can change or add new symbol in input section.
in my code i have made defined
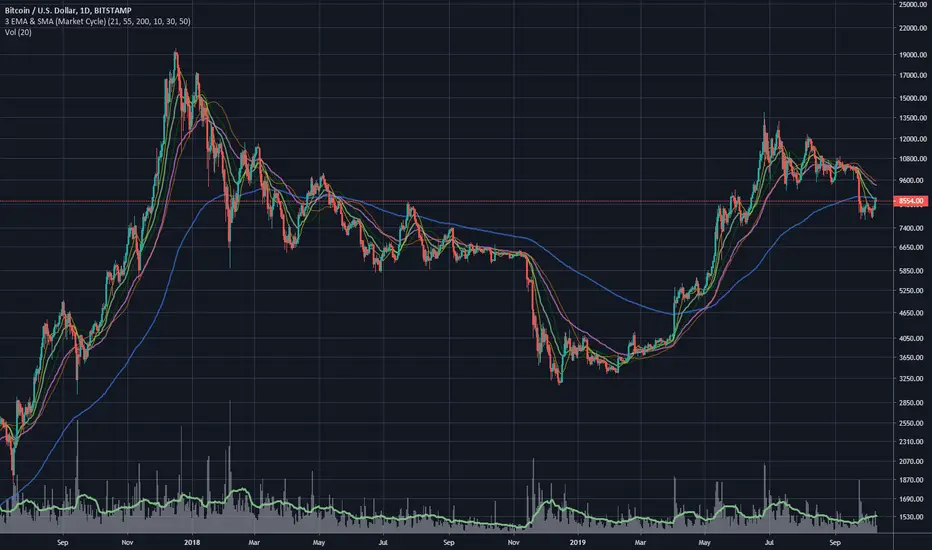
 and printed last close price when downtrend was true.
1. downtrend = ema (close,55)< ema (close,144) and ema (close,144)< ema (close,388) and ema (close,388)<ema(close,576) and close<ema(close,388)
if the indicator is printing DOWNTREND=TRUE or UPTREND=TRUE then the corresponding stock is in currently in that trend out of the stocks listed in the code
in one code only 40 (max) stocks can be called.
to add more stocks I copied same code and changed the stocks in the code, now you can screen 80 stocks at a time.
This code runs on each bar and checks if the stocks is in uptrend or down trend.
you can customize this screener according to your requirement.
[CM]EMA Trend Cross STRATVISUALLY REPRESENTS THE CROSSING OF 8,13,21,55 EMA'S FROM KROWNS TA PROGRAM
Hello everybody! I was curious and wanted to see how the Strat described in one of the modules would look coded. So here we are, a clear cut visual representation of the methods talked about in the course from the EMA Module. Enjoy!
(Instructions)
Whenever the 8,13,21 all cross above the 55ema that constitutes a long signal.
On the flip side, whenever the 8,13,21 all cross below the 55ema that constitutes a short signal.
(Description)
This indicator shows the cross described in the TA program using the EMAS 8,13,21,55.
The Ema's are editable.(Color)
It plots the entry and exit parameters.
This allows for a more visual representation of the ideology described in the course.
This indicator also doesn't leave room for ambiguity in terms of where a cross happens.
The EMA's can be toggled to show certain ones at certain times.
The indicator can be used as a trend analysis tool.
***In terms of an exit, I find it to be better to use your own judgement, taking account the greater trend.
For example, in a bull market I would advise looking for long signals, rather than try to hop on a counter trend play. Vice Versa in a bear market. It's better for jumping in to the greater momentum.
Pino Trend Pack (SMA/EMA + Bollinger)🔹 Pino Trend Pack is a compact trend-following and volatility indicator that includes:
📈 Moving Averages:
- SMA 10, SMA 30
- EMA 21, EMA 55, EMA 89
(All configured for short-term to mid-term trend analysis by default, but fully adjustable for user preference.)
📊 Bollinger Bands:
- Period: 20
- Standard Deviation: 2.0
- Includes Upper Band, Lower Band, and Basis (SMA 20)
This pack is designed for traders who want a clean visual of price dynamics across multiple short-term trend layers, combined with volatility tracking. It helps you identify compression, expansion, and trend shifts at a glance.
🧠 Ideal for swing trading, short- to mid-term setups, or as a supporting tool in any confluence-based strategy.
OBV+EMA HistogramHistogram of the difference between On Balance Volume and an EMA of the On Balance Volume (OBV + EMA).
Using a 55 EMA, on the daily timeframe of BTC, bull/bear trends occur when the histogram is above/below the zero line respectively.
Divergences also have a notable effect.
-- Added alert conditions when OBV crosses EMA to signal a possible trend change, for bullish and bearish cases.
50 & 55 EMA CloudAfter testing thousands of indicators over the years, this simple EMA cloud indicator that I built is still my main weapon. It's always the first one I add to a blank charts and that is not going to change anytime soon.
I find EMAs and MAs are such underrated tools, By observing the price action surrounding these, I can see straight away if it's a good time to get into a trade or not.
As seen here, I also use the 200MA along with the 50/55EMA cloud to find extra strong support and resistances. If price starts to reject both the cloud and the 200MA at the same time/level, then it's a very good indication the price is going to make a big move in that direction as seen here in this chart.