Swing Aurora v7.0 — The ExecutionerSwing Aurora v7.0 — The Executioner
Swing Aurora v7.0 is a multi-engine swing trading framework that combines trend-following, momentum, HTF confluence and SMC/Fibonacci structure in one script.
This version moves from a rigid gate logic to a scoring + state machine engine, so you can see not only if there is a signal, but how strong that signal really is.
🧠 1. Scoring Engine – A-Grade & B-Grade Signals
Instead of a single if (all conditions == true) check, v7.0 builds a score on every bar:
Trend score – position vs Baseline, slope, Supertrend direction.
Momentum score – MACD, RSI-Stoch triggers, ADX, local HH/LL.
HTF score – alignment with higher timeframe Baseline, Bias EMA, EMAs and RSI.
Confluence flags – divergences, ST flip/retest, SMC zones, VDub context.
Results:
A-Grade (Strong) signals → high score, strong trend + momentum + HTF alignment.
B-Grade (Speculative) signals → early/partial setups, clearly marked as higher risk.
You no longer lose good entries just because one minor filter disagrees, but you can clearly distinguish high-quality setups from speculative ones.
🔁 2. Strict Trade Cycle – State Machine
v7.0 uses a simple state machine:
0 = Flat, 1 = Long, -1 = Short.
When you are Long, the script only looks for exits or reversals, not new BUY entries.
Same for Short.
This enforces a clean, disciplined flow:
BUY → Hold → EXIT → wait for next setup, without label spam or conflicting signals while already in a position.
🛡️ 3. Quality Gates & Anti-FOMO Filters
To avoid buying local tops or chopping yourself to death:
RSI Gate – blocks BUY when RSI is already overbought (and vice-versa for SELL).
ATR Over-Extension filter – no entries when price is too far from the Baseline (parabolic moves).
No-Trade / Chop zone – combines ADX, ATR vs ATR-slow, distance to Baseline, Bollinger/Keltner squeeze and volume behavior.
Volume Gate – requires a real volume spike, not just random price wiggle.
Supertrend Gate – entries are synchronized with ST (flip / early / retest — configurable).
HTF Guardrails – optional: blocks entries against the dominant HTF regime.
📈 4. Visual Layer: Trend Map, Labels & Gradient
BUY/SELL labels with confidence percentage.
Background gradient based on trend direction and strength (ADX).
EMA 13/21 + Baseline with dynamic bull/bear colors.
Optional mini-legend showing: TS / RSI / ADX / HTF status at a glance.
🧩 5. Divergences, VDub & Macro Map
Full divergence engine (classic + hidden) on a basket of indicators (RSI, MACD, CCI, OBV, etc.), with optional lines and count labels.
VDub levels & signals – “smart levels” (solid/dotted) and add-on BUY/SELL signals filtered by market regime.
HTF Macro Map – higher timeframe Baseline, Bias EMA, fast EMAs, RSI and slope, using an auto or user-selected higher TF.
🧱 6. SMC Zones & Fibonacci (v7.0 Logic)
The SMC / Fibo component was refined so it is not hard-wired to the current bar’s entry signal:
Automatic HH / HL / LH / LL market structure labelling.
Demand / Supply zones:
derived from BOS with ATR buffer,
auto-update bar-by-bar,
auto-delete when broken or after a user-defined lifetime.
Fibonacci range:
built from the latest valid swing-high / swing-low,
shows 0 / 0.382 / 0.5 / 0.618 / 1 / 1.618 levels plus equilibrium line,
persists while the range is valid (independent of being in a trade).
AI zone boost (v7.0) – optional: zone opacity adapts dynamically to the underlying confidence score, highlighting higher-quality areas.
⚙️ 7. Modes & Configuration
Modes: Aggressive / Balanced / Conservative – adjust score thresholds and confidence requirements.
Risk & Quality: slope filter, min ATR distance, strict anti-chop, volume gate, HTF guardrails.
Visual toggles: labels on/off, baseline & EMAs, gradient, mini-legend, SMC boxes, Fibonacci.
This script does not trade for you – it provides a structured, consistent framework for reading trend, momentum and structure, plus graded signals so you can execute your own risk management and strategy.
Disclaimer
This script is provided strictly for educational and research purposes. It does not constitute financial advice, investment recommendation or any guarantee of profit. Historical performance, backtests and chart examples do not ensure future results.
Always use your own risk management rules, test the script on multiple instruments and timeframes, and never trade with money you cannot afford to lose. The author and contributors accept no responsibility for any trading decisions made based on this indicator.
Cari dalam skrip untuk "BOS"

Forex Knack — Premium Smart Money Indicator📈 Forex Knack — Premium Smart Money Indicator
Developed by Vineesh Rohini
Forex Knack is an invite-only, institutional-grade Smart Money Concepts toolkit built for traders who want clarity, precision and high-quality confluence — without leaking the internal logic.
This indicator combines market structure mapping, dynamic trend shifts, valuation zones and multi-layer confirmation into a clean, professional interface suitable for Forex, XAUUSD (Gold), Crypto and major Indices.
★ Core Benefits
- ✅ Cleaner Market Structure: Live BOS / CHoCH mapping for internal + swing structure.
- ✅ Directional Clarity: Proprietary “Shift” model to identify buy/sell phases.
- ✅ Confluence Signals: Combo confirmations when structure + momentum align.
- ✅ Premium / Discount Zones: Automatic institutional zones for better entries.
- ✅ Order Block Visuals: Internal & swing order block identification.
- ✅ Fair Value Gaps (optional): Imbalance highlighting for tactical entries.
- ✅ Momentum Confirmation: Oscillator-based trend confirmation.
- ✅ Strong / Weak Highs & Lows: Quick strength/weakness view for swing decisions.
🚫 What’s NOT included
- No full strategy code or secret formulas are revealed.
- Not a turnkey “auto-trade” bot — it is a professional decision-support tool.
🔒 Invite-only Access
This script is invite-only: the source code is fully protected and hidden.
You may apply for access; approved users can add the indicator to their charts but **will never** see the source code.
📬 How to request access
1. Follow the author profile on TradingView.
2. Send a message with your TradingView username and the note:
“Requesting access to Forex Knack indicator.”
(Access is granted manually after verification.)
⚠ Disclaimer
For educational purposes only. Not financial advice. Use with proper risk management.
© Vineesh Rohini — Forex Knack

TMT ICT SMC - Hitesh NimjeTMT ICT SMC - Smart Money Concepts
Overview
T
he TMT ICT SMC indicator is a comprehensive, all-in-one toolkit designed for traders utilizing Smart Money Concepts (SMC) and Inner Circle Trader (ICT) methodologies. Developed by Hitesh Nimje (Thought Magic Trading), this script automates the complex task of market structure mapping, order block identification, and liquidity analysis, providing a clear, institutional-grade view of price action.
Whether you are a scalper looking for internal structure shifts or a swing trader analyzing major trend reversals, this tool adapts to your timeframe with precision.
Key Features
1. Market Structure Mapping (Internal & Swing)
* Real-Time Structure: Automatically detects and labels BOS (Break of Structure) and CHoCH (Change of Character).
* Dual-Layer Analysis:
I nternal Structure: Captures short-term momentum and minor shifts for entry refinement.
Swing Structure: Identifies the overarching trend and major pivot points.
* Strong vs. Weak Highs/Lows: visualizes significant swing points to help you identify safe invalidation levels.
* Trend Coloring: Optional feature to color candles based on the active market structure trend.
2. Advanced Order Blocks (OB)
* Auto-Detection: Plots both Internal and Swing Order Blocks automatically.
* Smart Filtering: Includes an ATR or Cumulative Mean Range filter to remove noise and only display significant institutional footprint zones.
* Mitigation Tracking: Choose how order blocks are mitigated (Close vs. High/Low) to keep your chart clean.
3. Liquidity & Gaps
* Fair Value Gaps (FVG): Automatically highlights bullish and bearish imbalances. Includes MTF (Multi-Timeframe) capabilities to see higher timeframe gaps on lower timeframe charts.
* Equal Highs/Lows (EQH/EQL): Marks potential liquidity pools where price often reverses or targets.
4. Multi-Timeframe Levels
* Plots Daily, Weekly, and Monthly High/Low levels directly on your chart to help identify macro support and resistance without switching timeframes.
5. Premium & Discount Zones
* Automatically plots the Fibonacci range of the current price leg to show Premium (expensive), Discount (cheap), and Equilibrium zones, aiding in high-probability entry placement.
Customization
* Style: Switch between a "Colored" vibrant theme or a "Monochrome" minimal theme.
* Control: Every feature can be toggled on/off. Adjust lookback periods, sensitivity thresholds, and colors to match your personal trading style.
* Modes: Choose between "Historical" (for backtesting) and "Present" (for optimized real-time performance).
How to Use
* Trend Confirmation: Use the Swing Structure labels to determine the higher timeframe bias.
* Entry Trigger: Wait for a CHoCH on the Internal Structure within a higher timeframe Order Block or FVG.
* Targeting: Use the Equal Highs/Lows (Liquidity) or opposing Order Blocks as take-profit zones.
Credits
* Author: Hitesh Nimje
* Source: Thought Magic Trading (TMT)
TRADING DISCLAIMER
RISK WARNING
Trading involves substantial risk of loss and is not suitable for all investors. Past performance is not indicative of future results. You should carefully consider whether trading is suitable for you in light of your circumstances, knowledge, and financial resources.
NO FINANCIAL ADVICE
This indicator is provided for educational and informational purposes only. It does not constitute:
* Financial advice or investment recommendations
* Buy/sell signals or trading signals
* Professional investment advice
* Legal, tax, or accounting guidance
LIMITATIONS AND DISCLAIMERS
Technical Analysis Limitations
* Pivot points are mathematical calculations based on historical price data
* No guarantee of accuracy of price levels or calculations
* Markets can and do behave irrationally for extended periods
* Past performance does not guarantee future results
* Technical analysis should be used in conjunction with fundamental analysis
Data and Calculation Disclaimers
* Calculations are based on available price data at the time of calculation
* Data quality and availability may affect accuracy
* Pivot levels may differ when calculated on different timeframes
* Gaps and irregular market conditions may cause level failures
* Extended hours trading may affect intraday pivot calculations
Market Risks
* Extreme market volatility can invalidate all technical levels
* News events, economic announcements, and market manipulation can cause gaps
* Liquidity issues may prevent execution at calculated levels
* Currency fluctuations, inflation, and interest rate changes affect all levels
* Black swan events and market crashes cannot be predicted by technical analysis
USER RESPONSIBILITIES
Due Diligence
* You are solely responsible for your trading decisions
* Conduct your own research before using this indicator
* Verify calculations with multiple sources before trading
* Consider multiple timeframes and confirm levels with other technical tools
* Never rely solely on one indicator for trading decisions
Risk Management
* Always use proper risk management and position sizing
* Set appropriate stop-losses for all positions
* Never risk more than you can afford to lose
* Consider the inherent risks of leverage and margin trading
* Diversify your portfolio and trading strategies
Professional Consultation
* Consult with qualified financial advisors before trading
* Consider your tax obligations and legal requirements
* Understand the regulations in your jurisdiction
* Seek professional advice for complex trading strategies
LIMITATION OF LIABILITY
Indemnification
The creator and distributor of this indicator shall not be liable for:
* Any trading losses, whether direct or indirect
* Inaccurate or delayed price data
* System failures or technical malfunctions
* Loss of data or profits
* Interruption of service or connectivity issues
No Warranty
This indicator is provided "as is" without warranties of any kind:
* No guarantee of accuracy or completeness
* No warranty of uninterrupted or error-free operation
* No warranty of merchantability or fitness for a particular purpose
* The software may contain bugs or errors
Maximum Liability
In no event shall the liability exceed the purchase price (if any) paid for this indicator. This limitation applies regardless of the theory of liability, whether contract, tort, negligence, or otherwise.
REGULATORY COMPLIANCE
Jurisdiction-Specific Risks
* Regulations vary by country and region
* Some jurisdictions prohibit or restrict certain trading strategies
* Tax implications differ based on your location and trading frequency
* Commodity futures and options trading may have additional requirements
* Currency trading may be regulated differently than stock trading
Professional Trading
* If you are a professional trader, ensure compliance with all applicable regulations
* Adhere to fiduciary duties and best execution requirements
* Maintain required records and reporting
* Follow market abuse regulations and insider trading laws
TECHNICAL SPECIFICATIONS
Data Sources
* Calculations based on TradingView data feeds
* Data accuracy depends on broker and exchange reporting
* Historical data may be subject to adjustments and corrections
* Real-time data may have delays depending on data providers
Software Limitations
* Internet connectivity required for proper operation
* Software updates may change calculations or functionality
* TradingView platform dependencies may affect performance
* Third-party integrations may introduce additional risks
MONEY MANAGEMENT RECOMMENDATIONS
Conservative Approach
* Risk only 1-2% of capital per trade
* Use position sizing based on volatility
* Maintain adequate cash reserves
* Avoid over-leveraging accounts
Portfolio Management
* Diversify across multiple strategies
* Don't put all capital into one approach
* Regularly review and adjust trading strategies
* Maintain detailed trading records
FINAL LEGAL NOTICES
Acceptance of Terms
* By using this indicator, you acknowledge that you have read and understood this disclaimer
* You agree to assume all risks associated with trading
* You confirm that you are legally permitted to trade in your jurisdiction
Updates and Changes
* This disclaimer may be updated without notice
* Continued use constitutes acceptance of any changes
* It is your responsibility to stay informed of updates
Governing Law
* This disclaimer shall be governed by the laws of the jurisdiction where the indicator was created
* Any disputes shall be resolved in the appropriate courts
* Severability clause: If any part of this disclaimer is invalid, the remainder remains enforceable
REMEMBER: THERE ARE NO GUARANTEES IN TRADING. THE MAJORITY OF RETAIL TRADERS LOSE MONEY. TRADE AT YOUR OWN RISK.
Contact Information:
* Creator: Hitesh_Nimje
* Phone: Contact@8087192915
* Source: Thought Magic Trading
© HiteshNimje - All Rights Reserved
This disclaimer should be prominently displayed whenever the indicator is shared, sold, or distributed to ensure users are fully aware of the risks and limitations involved in trading.

Structure Breakout - Buy Sell IndicatorStructure Breakout - Buy Sell Indicator
📈 OVERVIEW:
A minimalist indicator that identifies market structure breakouts using swing point analysis.
Displays clear blue buy arrows and red sell arrows when price breaks key swing levels.
🔧 HOW IT WORKS:
1. Identifies swing highs and lows using configurable lookback period
2. Triggers BUY signal (blue arrow) when price closes above previous swing high
3. Triggers SELL signal (red arrow) when price closes below previous swing low
4. Uses clean visual arrows without cluttering the chart
⚙️ KEY FEATURES:
• Clean, uncluttered visual signals
• Customizable sensitivity period
• Blue arrows for buy signals (below bars)
• Red arrows for sell signals (above bars)
• No lagging repainting
• Works on all timeframes
🎯 TRADING APPLICATIONS:
• Swing trading entries
• Breakout confirmation
• Trend continuation signals
• Support/resistance breaks
⚡ SETTINGS:
• Structure Detection Period (default: 20) - Adjust sensitivity of swing detection
⚠️ RISK DISCLAIMER:
This is an educational tool. Always use proper risk management.
Past performance does not guarantee future results.

SMC Pre-Trade Checklist (Mozzys)Here is a **clean, professional description** you can use when publishing your TradingView script.
It clearly explains what the indicator does and why traders use it—perfect for the public library.
---
# **📌 Script Description (for Publishing)**
**SMC Pre-Trade Checklist (Compact Edition)**
This indicator provides a **smart, compact on-chart checklist** designed for traders who use **Smart Money Concepts (SMC)**.
Instead of guessing or rushing entries, the checklist helps you confirm the essential SMC conditions *before* taking a trade.
The checklist displays as a **small 3-column panel** in the corner of your chart, making it easy to scan without covering price action.
All items are controlled through indicator settings, where you can tick each condition as you validate it in your analysis.
---
## **🔥 What This Tool Helps You Do**
This script helps you stay disciplined by verifying the core components of an SMC setup:
### **1. Higher-Timeframe (HTF) Bias**
* Market direction clarity
* Premium vs. discount zones
* HTF POIs and liquidity targets
### **2. Liquidity Conditions**
* Liquidity sweeps
* Liquidity-based take-profit targets
### **3. Market Structure**
* BOS/CHOCH confirmation
* Displacement
* Clean pullback into POI
### **4. Entry Validation**
* Quality POI
* LTF confirmation
* Logical SL/TP and RR
### **5. Risk Management**
* Correct position sizing
* Avoiding high-impact news
* Spread/volatility conditions
### **6. Trader Discipline**
* Trade matches your model
* No revenge or emotional trading
---
## **🎯 Why Traders Love This**
Most losses come from **breaking rules**, not market randomness.
This checklist forces consistency, clarity, and patience—especially in fast environments like FX, indices, and crypto.
* Prevents emotional entries
* Reduces impulsive trades
* Keeps you aligned with your SMC plan
* Works with any strategy or SMC style
* Clean, minimal, non-intrusive layout
---
## **📌 Features**
* Compact 3-column layout
* Customizable from the indicator settings
* Works on all timeframes and assets
* Zero chart clutter
* Perfect for rule-based traders
---
## **🚀 Who This Indicator Is For**
* SMC traders
* ICT-style traders
* Liquidity-based traders
* Anyone who wants more discipline & consistency
* Backtesters who want structured trade evaluation
--

Fibonacci Zones and RejectionsThis tool combines swing structure, Fibonacci retracements and candle-wick rejection logic to highlight high-probability reversal or continuation zones.
What it does
Tracks market structure automatically
Detects swing highs and swing lows based on a user-defined Structure Period.
Marks bullish shifts in structure and bearish shifts with CHoCH labels and Break of Structure (BoS) lines.
Optionally draws a dotted swing trend line between the active swing high and swing low and can show price labels at those swing points.
Draws dynamic Fibonacci retracements on the latest swing
Automatically anchors a Fibonacci retracement between the current swing high and swing low.
Lets you enable/disable individual Fibonacci levels and customize their values, colors and line width.
Can extend Fib levels forward to the latest bar and optionally keep previous Fib structures on the chart for context.
Optionally fills the “Golden Zone” (by default the first two levels, e.g. 0.50 and 0.618) so the core pullback area is visually obvious.
Defines an OTE / “Gold Zone” band from the active Fib levels
Uses the first two Fib lines (by default 0.50 and 0.618 or set another zone such as 61.8% to 78.6%) to form a live “Optimal Trade Entry” band.
Continuously updates this band as new structure forms and swings develop.
Detects rejection candles inside the Fib OTE band
Breaks each candle into upper wick, lower wick, body and total range.
A bullish rejection is a candle where:
Price trades into the OTE band,
The lower wick is a large portion of the bar’s range, and
The body is not tiny (minimum body-to-range ratio is configurable).
A bearish rejection is the mirror condition using the upper wick.
Only candles whose range overlaps the OTE band are considered; this filters for true reactions to the Fib zone.
Plots clear signals and alerts
Bullish OTE rejection is plotted as a large cross at the low of the candle.
Bearish OTE rejection is plotted as a large cross at the high of the candle.
Built-in alertcondition calls allow you to set alerts for:
Bullish OTE Rejection
Bearish OTE Rejection
Optional “debug” markers can show all raw rejection candles and all bars that sit inside the OTE band, to help you understand how the logic behaves.
Use cases
Identify pullback entries into the desired Fib zone after a clear structural move.
Confirm reversals or continuations using wick-based rejection inside a pre-defined Fib discount/premium zone.
Combine with your own higher-timeframe bias or ICT / SMC tools to refine entry timing around key levels.

Price Action Strategy v2.0 [Ista]💎 Overview
Price Action Strategy v2.0 is a comprehensive, all-in-one institutional trading toolkit designed for visual traders who demand precision. Unlike standard indicators, this tool focuses on the narrative of price by combining advanced Market Structure, Institutional Order Flow, and Predictive Analytics into a single, non-cluttered interface.
The core philosophy of this script is "Clean Precision". It filters out noise and presents only the most critical decision-making data via smart chart overlays and a state-of-the-art Analytic Dashboard.
🚀 Key Features
1. 🏛️ Institutional Order Blocks (Origin Scan Engine)
This is not a standard pivot-based OB indicator. We utilize a proprietary "Origin Scan" algorithm that:
Detects the exact origin candle responsible for a structural break (BOS).
Filters out weak blocks, keeping only the most significant institutional footprints.
Smart Management: Limits active blocks to the 3 most recent per side (Support/Resistance) to keep charts clean.
Ghost Mode: When an Order Block is broken, it doesn't just disappear; it turns into a faint "Ghost" level, allowing you to see historical reactions without visual clutter.
2. 🔮 Echo Forecast (Predictive Path)
A powerful forecasting engine based on Pattern Similarity:
Scans historical price action (Evaluation Window) to find patterns mathematically similar to the current market state.
Projects the most likely future path (Forecast Window) directly onto the chart.
Uses a cumulative calculation method to smooth out noise and provide a realistic trajectory.
Visual Coding: The forecast line thickens and changes color based on the Confidence Score (Correlation %). High confidence patterns (>80%) are highlighted in deep green.
3. 📊 ISTA Command Center (Analytic Dashboard)
A professional, compact, and right-aligned dashboard that acts as your trading HUD. It monitors 8 vital market vitals in real-time:
Market Structure: Real-time Swing trend direction.
HTF Trend: Higher Timeframe bias (Price Action based).
Momentum: Current & HTF RSI status (Overbought/Oversold).
MACD: Signal crossover status.
Smart Money Flow (MFI): Detects institutional accumulation/distribution.
Volatility (ATR%): Current market volatility percentage.
Forecast Confidence: The statistical reliability of the current Echo Forecast.
4. 📉 Dynamic EMAs
Includes three key moving averages (20, 200, 1440) with dynamic transparency logic. They fade into the background when not interacting with price, ensuring they are there when you need them but invisible when you don't.
🛠️ How to Use
Identify Trend: Look at the Dashboard. If Structure and HTF Trend align (e.g., both Bullish), look for longs.
Wait for Pullback: Wait for price to return to a Bullish Order Block.
Confirm: Check the Forecast line. Does it suggest a bounce? Check MFI and RSI on the dashboard for oversold conditions.
Execute: Use the Order Block edges for precise entry and invalidation points.
⚙️ Settings
Swing Length: Adjust sensitivity of the structure (Default: 10).
Evaluation Window: How far back the Echo Forecast looks for patterns (Default: 300).
Dashboard: Fully customizable position and size.
Developed by Soheil_kheiri | Ista Web Analytics

Trend Signal MomentumOVERVIEW
Signal Trend Momentum is a hybrid strategy that combines multiple confirmations and filters to obtain better potential trading signals. Each confirmation and filter in Signal Trend Momentum aims to avoid possible false and trap signals.
HYBRID CONCEPTS
Smart Money Concept – This indicator forms market structure and Bullish & Bearish Order Block areas to make it easier to identify market trends and strong areas where price reversals often occur. Its purpose is to simplify recognizing market direction and serve as the first confirmation.
MSS + BOS (Market Structure Shift + Break of Structure) – This indicator serves as additional confirmation for the Smart Money Concept. With the presence of two types of market structure, the market trend direction becomes clearer and more convincing.
RSI Momentum Signal – This indicator becomes the third confirmation. When the Market Trend is clear and convincing, supported by the formation of Bearish and Bullish Order Blocks, the role of the Momentum Signal here becomes crucial as it provides trend momentum based on overbought and oversold areas.
Momentum Position – This indicator becomes the next confirmation based on buyer and seller VOLUME in the market. If buyer volume is higher, the momentum position will be depicted on the chart with an upward arrow, and conversely, if seller volume is higher, it will be depicted with a downward arrow.
SnR (Support and Resistance) – This final indicator is Support and Resistance, which will serve as the last and more convincing confirmation. Support and Resistance will strengthen the Order Block areas formed by the Smart Money Concept indicator. A Bullish Order Block + Support creates a higher possibility for an upward trend in the market, conversely, a Bearish Order Block + Resistance creates a higher possibility for a downward trend in the market.
The combination of these several indicators will provide a strong market direction + persistent buyer and seller areas, as well as depict momentum based on volume + RSI which serve as additional confirmations.
These additional confirmations will produce stronger signals and help avoid false and trap signals in the market.
HOW TO USE
A SHORT SIGNAL will be strong if there is a Downtrend Market Structure + Bearish Order Block + Resistance + Oversold RSI Momentum + Strong Seller Volume Momentum.
A LONG SIGNAL will be strong if there is an Uptrend Market Structure + Bullish Order Block + Support + Overbought RSI Momentum + Strong Buyer Volume Momentum.
CONCLUSION
Signal Trend Momentum is a combination of several powerful indicators designed to produce stronger, clearer, and easier-to-read signals.
This strategy is highly suitable for traders seeking more convincing trade signals based on multiple confirmations from the combined indicators, thereby creating a strong signal with a higher probability.

ICT Complete SuiteICT Complete Suite - Advanced SMC & Liquidity Analysis
A comprehensive indicator combining ICT (Inner Circle Trader) methodology with Smart Money Concepts for professional trading analysis.
🔹 KEY FEATURES:
- Market Structure Detection (MSS, CISD, BOS, CHoCH)
- Smart Money Liquidity Analysis (BSL/SSL Sweeps)
- Premium Discount Arrays (Order Blocks, FVG, Breaker Blocks)
- OTE Zones (0.62-0.79 Fibonacci)
- Session & Killzone Tracking (Asian, London, NY)
- Silver Bullet Time Windows
- Real-time Info Dashboard
- Multi-timeframe Support
🔹 MODULES:
1. Market Structure & Trend Analysis
2. Liquidity Hunter (BSL/SSL Detection)
3. PD Arrays (OB, FVG, Breaker Blocks)
4. Sessions & Killzones
Perfect for traders who follow ICT concepts and Smart Money trading strategies.
⚠️ Best on M15-H1 timeframes
⚠️ Compatible with XAUUSD, EURUSD, GBPUSD, and major pairs

SMC God Mode — PREMIUM v13.0SMC God Mode — Premium v13.0
I developed this script to automate the mechanical parts of Smart Money Concepts (SMC) analysis. Instead of manually drawing structure and zones every morning, this tool calculates them algorithmically based on price action and volatility logic.
How the Algorithm Works:
1. Structure & Trends
The script identifies Swings Highs/Lows based on a pivot system filtered by ATR. It creates a "Clean Structure" view, filtering out minor noise to show true BOS (Break of Structure) and CHoCH (Change of Character).
*Logic:* A breakout is only valid if the candle body closes beyond the pivot with sufficient momentum (Impulse Filter).
2. Quant-Based Order Blocks
Most indicators just highlight the last candle before a move. My algorithm actually **scores** each block (0-100) to find high-probability zones (A+ setups).
Volume & Velocity: It compares the volume of the move against the 20-period average and calculates the "displacement" speed.
Grading: Zones with low volume or weak reactions are filtered out or graded lower (C). Only significant institutional footprints get an "A" grade.
3. Imbalance (FVG) & Liquidity
FVG: Detects gaps where price moved inefficiently. Includes a gradient visual to show the intensity of the gap.
Liquidity Sweeps: The script detects "Stop Hunts" — where price breaks a pivot level but fails to close above/below it, signalling a reversal trap.
Features:
Auto-Fibonacci:
Automatically anchors to the recent structural leg (Premium/Discount zones).
Multi-Timeframe Dashboard:** Shows trend bias from higher timeframes.
Breaker Blocks: Automatically flips failed Order Blocks into Support/Resistance.
Alerts: Fully integrated alerts for CHoCH, Sweeps, and Zone Mitigations.
ACCESS INFORMATION:
This is a private institutional tool (Invite-Only).
To get access, please check the link in my Signature below or visit my profile description.

HTF/CTF High/Low Mitigation with SignalsHTF/CTF High/Low Mitigation with Signals Indicator
Overview
HTF/CTF High/Low Mitigation with Signals (shortened as "H/L Signals+") is an advanced overlay indicator for TradingView, designed to identify and visualize higher timeframe (HTF) and current timeframe (CTF) swing highs/lows, track their mitigation, and generate filtered buy/sell signals using an EMA ribbon trend filter. It incorporates automated trade simulation with risk/reward (RR) visualization, position sizing based on user-defined risk, and a statistics table for performance evaluation. This tool is ideal for multi-timeframe traders focusing on swing trading, breakout strategies, or trend reversals across assets like forex, futures, metals (e.g., XAU/USD, XAG/USD), stocks, or cryptocurrencies.
The "meshup" (mashup) integrates several complementary elements: Multi-timeframe swing level detection (HTF for broader structure, CTF for finer details) with mitigation logic ensures signals align with market structure breaks; an EMA ribbon provides a dynamic trend bias to filter counter-trend trades; risk management automates position sizing and RR calculations for disciplined trading; and built-in backtesting stats offer quick insights into hypothetical performance. This combination reduces noise from isolated indicators—e.g., raw swings can be choppy, EMAs alone lag structure, and manual RR is error-prone—creating a cohesive system for spotting high-probability setups where structure, trend, and risk align. By meshing these, it aims to enhance decision-making in trending or ranging markets, though it's reactive and best used with confirmation. Note: This is a technical tool for educational purposes only; it does not provide financial advice, guarantees of profitability, or trading recommendations. Past performance is not indicative of future results, and users should backtest thoroughly on their specific assets/timeframes, in compliance with TradingView's house rules.
Key Features
• HTF Swing Levels: Detects and draws session highs/lows from a user-selected higher timeframe (e.g., Daily), extends lines until mitigated (by wick or body close), with alerts on mitigation.
• CTF Swing Levels: Identifies local swing highs/lows on the chart timeframe using a pivot candle formation (default 5-candle), with separate limits for unmitigated/mitigated lines.
• EMA Ribbon: A three-EMA system (fast 8, mid 13, slow 21) with gradient fills (green for bullish, red for bearish) to visualize trend strength and filter signals.
• Signal Generation: Buy/sell labels ("BUY"/"SELL") triggered post-mitigation when price aligns with EMA trend (e.g., above slow EMA with stacked bulls for buys).
• Trade Simulation & Risk Management: On signals, calculates stop-loss (SL) from recent extremes, position size based on fixed risk amount (e.g., $100 per trade, adjusted for asset type like futures point value or forex lots), and full take-profit (TP) at user-defined RR level (1-5). Draws RR boxes for visuals.
• Statistics Table: Displays total trades, wins/losses, win rate (%), net R-return, and max consecutive losses in a top-right table.
• Alerts: Customizable alerts for HTF mitigations and new trades (including entry, SL, TP, size).
• Visual Customizations: Toggle lines/ribbon/boxes, adjust colors/styles/widths for unmitigated/mitigated lines (HTF/CTF), min box width.
• Performance Optimization: Automatically cleans up excess lines to stay within max limits (e.g., 15 unmitigated HTF, 5 CTF).
How It Works
• HTF Logic: On new HTF bars (via time(htf_timeframe)), captures session high/low and draws extendable lines. Lines extend rightward until mitigated (high/close > high level for highs, low/close < low level for lows, toggle wick/body). Mitigation sets "waiting" flags for signals and triggers alerts.
• CTF Logic: Scans for pivot highs/lows using a user-defined candle count (e.g., 2 left/right for 5-candle swings). Draws and extends lines similarly, mitigating on wick touches, with separate styles for mitigated (e.g., dotted gray).
• EMA Ribbon Logic: Computes 8/13/21 EMAs; fills mid-slow and fast-mid with bullish green (close > slow EMA) or bearish red gradients.
• Signal Conditions: Post-mitigation (waiting_for_buy/sell true), checks EMA stack—buys require close > slow, fast > mid > slow; sells require close < slow, fast < mid < slow. Signals only on confirmed bars.
• Trade Execution: On signal, sets entry at close, scans back to mitigation bar for tightest SL (lowest low for buys, highest high for sells). Calculates risk points (entry - SL for buys), then position size via helper function (asset-specific: e.g., XAU *100, futures *pointvalue, forex 100000pointvalue). Sets full TP at entry ± (risk * full_tp_level). Draws risk/reward boxes (e.g., long: dark risk below entry, blue reward above) with RR and size text. Alerts with trade details.
• Trade Management: Monitors for SL hit (low <= SL for longs) or TP hit (high >= TP for longs); updates stats (wins if TP, losses if SL, tracks consec losses, net R as +full_tp_level or -1). Places summary label ("Hit TP5 (Win)" or "Stopped Out (Loss)").
• Cleanup: Counts unmitigated/mitigated lines; deletes oldest excess to respect max limits (e.g., max_lines_input=15 for HTF unmitigated, max_mit_lines_ctf=5 for CTF mitigated).
• Why This Meshup?: Standalone tools often fall short—HTF swings ignore local noise, but without CTF, miss entries; EMAs filter trends but overlook structure; manual RR lacks automation. Meshing them creates a "mitigation-to-signal" flow: HTF/CTF provide structural context (e.g., BOS/CHOCH), EMA ensures trend alignment (reducing whipsaws), and RR simulation adds practical risk control with stats for optimization. This holistic approach potentially improves edge in structure-based trading, especially in volatile markets, by combining macro/micro analysis with quantifiable risk—though it may lag in ranges or require tuning.
All logic uses arrays for line management, barstate.isconfirmed for reliability, and syminfo for asset-specific sizing. No repainting, but historical trades simulate based on chart data.
Settings and Customization
Inputs are grouped for usability:
1. Higher Timeframe (HTF) Settings:
o Show HTF Lines: Toggle visibility (default: true).
o Use Wick for Mitigation: True for wick touch, false for body close (default: false; tooltip explains).
o Timeframe: HTF period (default: "D").
o Max Unmitigated HTF Lines: Limit for active lines (default: 15, min 1, max 250).
2. Current Timeframe (CTF) Settings:
o Show CTF Swings: Toggle (default: true).
o CTF Swing Candle Count: Left/right candles for pivot (default: 2, min 1; tooltip: '2' = 5-candle formation).
o Max Unmitigated CTF Lines: (default: 5, min 1, max 250).
o Max Mitigated CTF Lines: (default: 5, min 1, max 250).
3. EMA Settings:
o Show EMA Ribbon: Toggle (default: true).
o Fast/Middle/Slow EMA Length: Defaults 8/13/21.
4. Risk/Reward Settings:
o Risk Amount per Trade ($): Fixed risk (default: 100.0, min 0.1; tooltip: for position sizing).
o Full Take Profit Level (1-5): RR for full win (default: 5; tooltip: counts as win in stats).
o Show Trade Visuals & Stats: Toggle boxes, labels, table (default: true).
5. 🎨 Visuals:
o Draw Risk/Reward Box: Toggle (default: true).
o Minimum Box Width (in bars): (default: 5, min 1).
o Long - Risk/Reward Box Colors: Defaults dark gray (risk), blue (reward).
o Short - Risk/Reward Box Colors: Defaults dark gray (risk), orange (reward).
6. Alert Settings:
o Alert on HTF Level Mitigation: Toggle (default: true).
7. HTF Line Style Settings:
o High (Unmitigated): Color (maroon 20%), width (1).
o High (Mitigated): Color (gray 40%), style (dotted/dashed, default dotted).
o Low (Unmitigated): Color (teal 20%), width (1).
o Low (Mitigated): Color (gray 40%), style (dotted/dashed, default dotted).
8. CTF Line Styles:
o CTF High (Unmitigated): Color (purple #8d198d 25%), width (1), style (Solid/Dotted/Dashed, default Solid).
o CTF High (Mitigated): Color (gray 50%), width (1), style (default Dotted).
o CTF Low (Unmitigated): Color (teal #008080 25%), width (1), style (default Solid).
o CTF Low (Mitigated): Color (gray 50%), width (1), style (default Dotted).
Usage Tips
• Multi-Timeframe Strategy: Use HTF (e.g., D1) for major levels, CTF for entries. Signals post-mitigation with EMA filter—enter on "BUY"/"SELL" labels, use boxes for RR visualization.
• Risk Management: Set risk_amount_per_trade to 1-2% of capital; adjust full_tp_level for strategy (e.g., 3 for conservative). Position size auto-adapts to asset (e.g., smaller for high-vol like XAU).
• Customization: Enable wick mitigation for aggressive setups; increase max lines in trending markets. Tune EMAs for asset (shorter for crypto).
• Alerts Integration: Use for notifications on mitigations or trades; messages include all details for quick action.
• Stats Analysis: Table shows hypothetical results—use for optimization (e.g., aim for >50% win rate, low consec losses). Reset on chart reload.
• Chart Compatibility: Best on candlestick charts; test on lower TFs with higher HTF for confluence.
Limitations
• Reactive Signals: Waits for mitigation + EMA alignment, so may miss early reversals or lag in fast markets.
• Chop in Ranges: Frequent mitigations without trend can generate false signals; EMA helps but not foolproof.
• Simulation Only: Trades are backtested on visible data—no live execution; stats assume full TP or SL hits, ignoring partials or slippage.
• Line Limits: Caps at user max to prevent overload; oldest deleted first.
• Asset Specificity: Position sizing tailored to forex/futures/metals; may need tweaks for others.
• Disclaimer: For informational use only. Trading involves risk of loss; results vary by market, timeframe, and settings. Consult professionals and backtest extensively. No profitability claims per TradingView rules.

SMC & ICTSMC & ICT Concepts
Key Features:
• Real-time Market Structure: MSS (Market Structure Shift), BOS, CHOCH with labels
• Order Blocks (Bullish & Bearish) – auto-mitigation & breaker detection
• Fair Value Gaps (FVG), Implied FVG, Balance Price Range (BPR)
• Liquidity Grabs (Buyside/Sellside pools from equal highs/lows)
• Volume Imbalance (VI) detection
• Displacement candles
• Killzones: New York, London Open/Close, Asian session background highlight
• NWOG (New Week Opening Gap) & NDOG (New Day Opening Gap)
• Automatic Fibonacci Retracement & Extension between latest FVG, OB, Liquidity, or VI
• Two display modes:
→ Present Mode: Shows only recent & relevant structures (clean chart – recommended for live trading)
→ Historical Mode: Shows full structure history
Perfect confluence tool for scalping, day trading, and swing trading.

Forelume (ULTIMATE) Forelume ULTIMATE is the flagship, feature-rich TradingView trade-assistant that combines trend awareness, confirmation-based signals, structured trade planning, and premium-grade chart UI, while keeping everything configurable and clean.
works on all charts of the market
It’s built for traders who want a consistent workflow:
1) identify direction (trend),
2) wait for quality confirmation
3) execute with a mapped plan
CORE SIGNAL ENGINE
• Multi-Mode Signals: run different signal pathways (Classical, structure-enhanced, cross-based, and combined modes), with simple direction filters (Long only / Short only / Both).
• Regime Awareness: optional cross-base
regime logic with visual markers and a “latest cross” summary so you immediately see when market bias shifts.
• Confirmation Controls: optional confirmation style logic (designed to reduce low-quality prints in chop).
• Structured mapping for every signal: Entry, SL, TP1–TP5 presented in a compact, readable format: - RR-based TP/SL mapping options (with configurable risk behavior)
- Optional “Move to Break Even after TP#” logic for cleaner trade management
- Optional OHLC/4 (average) entry mode for consistency across volatility
PREMIUM UI / READABILITY FEATURES
• Compact HUD Panel: quick glance “Latest Trade / Latest Cross” summary with optional signal age so you know if a setup is fresh or late.
• Clean visual system: show/hide labels, signals, EMAs, and overlays to match your trading style.
UNIQUE VISUAL HIGHLIGHTS
• Zone Cloud: a dynamic cloud between regime EMAs that adapts in real time:
- green when the zone expands (strength)
- red when it shrinks (momentum fading)
• Optional 3rd EMA: adds extra context when needed, stays hidden when not.
• Supply & Demand zones with configurable display, sizing, and behavior.
• Optional BOS tooling and structure confirmation controls when you want higher context precision.
NEW: ALERTS
• Dedicated TradingView alert: “New signal detected”
- get notified the moment a fresh setup appears, new signal is detected
- confirm on-chart, execute with mapped levels
WHY ULTIMATE (AND WHY IT’S THE ONE TO BUY)
• Priority Updates: ULTIMATE users receive new systems, refinements, and improvements first.
• Flagship Build: this is the version where new features land before other tiers.
it is one of the most sophisticated well-structured indicators in the market
Whether you're a day trader hunting scalps, a swing trader riding trends, or an investor monitoring long-term regimes, Forelume ULTIMATE delivers actionable intelligence without overwhelming your charts. Backed by real-time calculations and historical performance tracking, it's the ultimate companion for boosting your win rate and confidence.
Elevate your trading game—install Forelume ULTIMATE today and turn market chaos into calculated opportunity.
IMPORTANT
This indicator provides chart-based signals and planning assistance. It is not financial advice. Always test on your symbols/timeframes and use proper risk management.
Works on all markets.

BETradez HTF Order Blocks BETradez HTF Order Blocks identifies and displays order blocks from higher timeframes on your chart. It detects Break of Structure (BOS) events, when price breaks above the highest high or below the lowest low—then scans back up to 200 bars to find the last opposing candle, which becomes the order block zone. The indicator displays up to 5 active order blocks per side (bullish in green, bearish in red), automatically extends them forward in time, and can hide invalidated blocks when price violates them. You can customize the timeframe (use chart or a custom higher timeframe), adjust forward extension, show optional wick lines and center lines, and control label text size. Order blocks often act as support/resistance zones where institutional activity occurred, making them useful for identifying potential entry areas, support/resistance levels, and risk management points in multi-timeframe analysis.

🔥 SMC Reversal Engine v3.5 – Clean FVG + Dashboard“SMC Reversal Engine v3.5 visualises HTF structure (CHoCH / BOS), swing points, FVG zones and a compact dashboard to aid Smart-Money Concept analysis. It’s for charting/education only and does NOT provide buy or sell signals.”

Smart Money Concepts Pro Smart Money Concepts Pro
A professional-grade framework for visualizing institutional price behavior through key Smart Money Concepts. It automatically maps structure shifts, imbalances, and liquidity events so traders can study how price develops around supply and demand.
Core Components
Market Structure (BOS / CHoCH) — Detects continuation and reversal breaks using pivot-based logic with a close-beyond threshold and configurable cooldown.
Order Blocks — Highlights institutional footprints validated by volume and distance filters; zones extend until mitigation.
Fair Value Gaps — Marks three-bar inefficiencies that meet a minimum gap size and optionally auto-remove once filled by a user-defined percentage.
Liquidity Sweeps — Identifies stop-hunt wicks exceeding a configurable extension beyond recent highs or lows.
Premium / Discount Zones — Defines equilibrium and price positioning within recent swing ranges.
Confluence Entries (optional) — Generates neutral BUY / SELL markers only when structure, zone, and directional context align.
Dashboard — Summarizes current structure bias, recent events, zone counts, and directional alignment in real time.
Why it’s distinct
All detections are governed by explicit thresholds—volume multipliers, minimum distances, and fill-percent logic—so each signal results from quantifiable structure rather than heuristic pattern matching. Automatic cleanup ensures charts remain clear as zones are mitigated or gaps filled.
Best use
Applicable across Forex, indices, crypto, and equities. Designed for study on 15 m – 1 D timeframes.
For optimal alignment, pin plots to the Right Scale after adding the script.
Disclaimer: This script is provided for educational and analytical purposes only. It does not constitute financial or investment advice.

ZynIQ Order Block Master Pro v2 - (Pro Plus Pack)Overview
ZynIQ Order Block Master Pro v2 identifies areas where price showed strong displacement and left behind significant zones of interest. It highlights potential reaction areas, continuation blocks and mitigation zones based on structural behaviour and directional flow.
Key Features
• Automatic detection of bullish and bearish order block zones
• Optional refinement filters for higher-quality zones
• Displacement-aware logic to reduce weak signals
• Optional mitigation markers when price revisits a zone
• Configurable sensitivity for different markets and timeframes
• Clean labels and minimal chart clutter
• Complements structure, liquidity and FVG tools
Use Cases
• Highlighting key reaction areas based on previous strong moves
• Tracking potential continuation or reversal zones
• Combining order blocks with BOS/CHOCH and liquidity mapping
• Building confluence with breakout or volume tools
Notes
This tool provides contextual price zones based on displacement and structural movement. It is not a standalone trading system. Use with your own confirmation and risk management.

ZynIQ FVG Master Pro v2 - (Pro Pack)Overview
ZynIQ FVG Master v2 (Pro) identifies fair value gaps and highlights key imbalance zones within price action. It includes detection for standard and extended FVGs, optional mitigation logic and context filters to help traders understand where inefficiencies may be filled.
Key Features
• Detection of regular and extended FVGs
• Optional mitigation and fill markers
• Configurable minimum gap size and sensitivity
• Direction-aware colour coding
• Optional smart filtering to reduce low-quality gaps
• Clean visuals designed for intraday and swing analysis
• Can be used alongside structure and liquidity tools for confluence
Use Cases
• Identifying imbalance zones likely to be revisited
• Spotting high-probability mitigation areas
• Combining FVGs with BOS/CHOCH or liquidity sweeps
• Mapping context for continuation and reversal setups
Notes
This tool provides FVG and imbalance context. It is not a standalone trading system. Use with your preferred confirmation and risk management.

4H EMA 21/30 Cloud on 15mThis indicator displays the 4-hour EMA 21 and EMA 30 as a dynamic cloud directly on the 15-minute chart, providing a clean and reliable higher-timeframe trend filter for intraday and scalping setups.
The cloud turns:
Green when EMA21 > EMA30 → bullish HTF trend
Red when EMA21 < EMA30 → bearish HTF trend
Because the 4H EMA 21/30 combination tracks mid-term momentum and trend structure extremely well, this indicator helps traders avoid counter-trend trades, time pullbacks more effectively, and align entries with dominant higher-timeframe flow.
Perfect for traders using:
Price Action
FVG / Imbalance concepts
CHOCH/BOS structure
Liquidity-based models
ICT-style intraday execution
Use the 4H cloud as your HTF bias anchor, and execute trades using your own entry model on the 15m timeframe.

SignalSquad Lite: SMC Structure Mapper © 2025Free Lite: Map SMC Structure (Pivots + BOS).
Teaser for Premium SignalSquad (Signals + 75% Wins).
Trial: in.tradingview.com

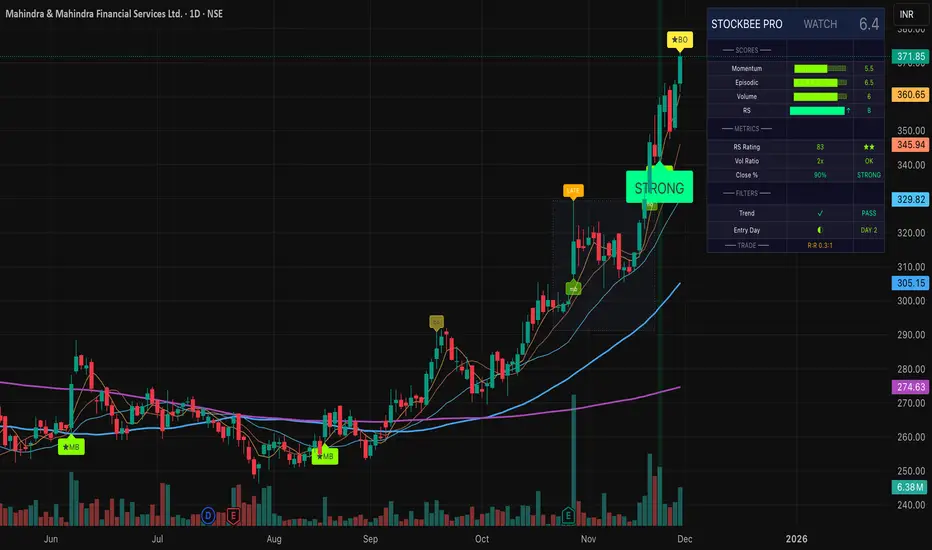
Pradeep Bonde (Stockbee) Momentum Pro TradingView Description for "Pradeep Bonde (Stockbee) Momentum Pro"
-----------------------------------------------------------------------------------------------
Pradeep Bonde (Stockbee) Momentum Pro
The Complete Momentum & Episodic Pivot Trading System
Based on the proven methodology of Pradeep Bonde (Stockbee) — the legendary momentum trader and "Mentor to $100 Million Traders."
----------------------------------------------------------------------------------------------
📈 OVERVIEW
This indicator implements Stockbee's complete momentum trading system, designed to identify high-probability swing trade setups. It combines Episodic Pivots, Momentum Bursts, Anticipation Setups, and IBD-style Relative Strength analysis into a single professional tool.
----------------------------------------------------------------------------------------------
🔥 KEY FEATURES
1. EPISODIC PIVOT DETECTION (EP)
The crown jewel of Stockbee's methodology:
- Detects 10%+ gaps on massive volume (2x+ average) — true catalyst-driven breakouts
- Identifies Delayed EP Breakouts — consolidation after initial gap, then secondary breakout
- Tracks days since EP for optimal entry timing
- PEAD (Post Earnings Announcement Drift) opportunities
2. MOMENTUM BURST SIGNALS
- 4%+ moves on volume 40%+ above average
- Quality filters: Requires narrow range before breakout, close near high of day
- Tiered signals: Momentum Burst → Strong Momentum → Exceptional Momentum
- "Quality" prefix (★) indicates setups with all filters passed
3. ANTICIPATION SETUP DETECTION
Pre-breakout coiling patterns:
- Detects 1-3 week tight consolidations after prior 15-25%+ advances
- Volume dry-up analysis during consolidation (< 60% of prior average)
- Anticipation score helps identify coiled springs before they break out
4. IBD-STYLE RELATIVE STRENGTH
- Custom RS Rating (1-99 scale) weighted by recent performance
- RS New High detection — signals institutional accumulation
- Weighted calculation: 40% Q1, 20% Q2, 20% Q3, 20% Q4 performance
5. BAG HOLDER PROTECTION ⚠️
Stockbee's cardinal rule: "Never buy after 3+ consecutive up days"
- Automatic detection of late entries
- Visual warnings on chart
- Quality score penalty for bag holder territory
6. EXIT SIGNAL SYSTEM
- First down day after 3+ up days = EXIT
- Close below 5-day MA trigger
- Clear visual EXIT labels on chart
Signal Thresholds:
- 🎯 PERFECT: Score ≥ 8.5 (highest probability trades)
- 💪 STRONG BUY: Score ≥ 7.5
- BUY: Score ≥ 6.5
- WATCH: Score 5.0 - 6.5
- ⚠️ LATE ENTRY: High score but in bag holder territory
- BEARISH: Score ≤ 3.0 and below trend MA
----------------------------------------------------------------------------------------------
🎨 VISUAL ELEMENTS
Chart Labels
- 🔥 EP — True Episodic Pivot (10%+ gap)
- ★EM / ★MB — Quality Exceptional/Momentum Burst
- ★BO — Quality Breakout
- ⚡ — Coiling setup (pre-breakout)
- RS↑ — Relative Strength new high
- LATE — Bag holder warning
- EXIT — Exit signal
Chart Elements
- Moving Averages: 5, 10, 20, 50, 200 MA with professional styling
- Consolidation Boxes: Shows prior consolidation range on breakouts
- Stop/Target Lines: Automatic levels on active signals
- Background Colors: Gradient highlighting for signal strength
Dashboard (Top Right)
Professional 3-column display showing:
- Signal status & total score
- Visual score bars for each component
- Key metrics (RS Rating, Volume Ratio, Close Position)
- Filter status (Trend, Entry Day)
- Trade setup (Risk/Reward ratio)
----------------------------------------------------------------------------------------------
⚙️ CUSTOMIZABLE SETTINGS
General
- Show/hide labels, backgrounds, consolidation boxes
- Trend filter (50 MA, 200 MA, or Both)
- Bag holder avoidance toggle
Momentum Burst
- Threshold percentages (4%, 6%, 8%+)
- Require narrow range before breakout
- Close near high threshold
Episodic Pivot
- Consolidation period (20-60 days)
- Consolidation range (5-20%)
- Gap threshold (10%+)
- Volume multiple (2x+)
Narrow Range / Contraction
- Lookback period
- Range threshold
- Days required before breakout
Volume Analysis
- Average period (50 days)
- Spike threshold (1.4x = 40% above average)
- Volume vs previous day requirement
- Dry-up threshold for consolidation
Relative Strength
- Minimum RS rating (80)
- Strong RS rating (90)
- EPS growth minimum filter
Display Options
- Toggle for each signal type
- Debug panel for troubleshooting
- Color customization
----------------------------------------------------------------------------------------------
🔔 ALERTS
Comprehensive alert conditions:
- 🔥 True Episodic Pivot — The most important signal
- 🎯 Perfect Setup
- 💪 Strong Buy Signal
- Buy Signal
- Quality Momentum Burst
- Consolidation Breakout
- RS New High
- ⚠️ Bag Holder Warning
- Exit Signal
- Gap Up/Down
----------------------------------------------------------------------------------------------
📚 STOCKBEE METHODOLOGY SUMMARY
Core Principles:
- Buy Day 1 of breakout, not Day 3+ (bag holder territory)
- Focus on $10-$100 stocks with RS > 80
- Prefer breakouts after tight consolidation or negative day
- Close near high of day on breakout confirms strength
- Volume > previous day volume on breakout
- Exit on first down day after 3+ up days
- Hold 2-5 days typically for 8-40% gains
MAGNA Criteria:
- Massive earnings (100%+ EPS/Sales growth)
- Gap up (4%+ on 100k+ pre-market volume)
- Neglected (low prior volume, minimal institutional ownership)
- Analyst upgrades
----------------------------------------------------------------------------------------------
💡 USAGE TIPS
- For best results: Use on daily timeframe with stocks $10-$100
- Focus on: 🔥 EP and ★ (quality) signals
- Avoid: Entries showing "LATE" warning
- Combine with: Fundamental screening (EPS growth 25%+)
- Use trend filter: Prefer stocks above 50-day MA
----------------------------------------------------------------------------------------------
⚠️ DISCLAIMER
This indicator is for educational purposes. Past performance is not indicative of future results. Always use proper risk management and position sizing. Not financial advice.
----------------------------------------------------------------------------------------------
Based on the research and methodology of Pradeep Bonde at Stockbee.com
Confirmed Pivots + MACD Signals (with BOS Lines)Confirmed Pivots + MACD Signals
This indicator combines confirmed swing highs/lows (pivots) with MACD-based momentum signals to highlight key reversal and continuation points on the chart.
Core Logic
Confirmed Pivots:
The script identifies swing highs and lows using the user-defined pivot confirmation length.
Once a structure is broken beyond the last pivot, that level becomes a confirmed support (CL) or resistance (CH) line.
These levels are plotted as dashed horizontal rays and labeled directly on the chart.
MACD Integration:
The classic MACD crossover/under logic is used:
Bullish Crossover: MACD line crosses above the Signal line.
Bearish Crossunder: MACD line crosses below the Signal line.
Signal Filtering by Proximity:
A Proximity Zone (%) defines how close price must be to an active support or resistance to trigger a signal.
Buy Signal: When price is within the support zone and a bullish MACD crossover occurs.
Sell Signal: When price is within the resistance zone and a bearish MACD crossunder occurs.
Inputs
Pivot Confirmation Length: Bars used to confirm swing points.
MACD Fast/Slow/Signal Lengths: Standard MACD settings.
Proximity Zone (%): Defines zone width (e.g., 1% around active level).
Output
Labels: "CH" (Confirmed High) and "CL" (Confirmed Low) with color-coded dashed lines.
Signals: "BUY" and "SELL" markers appear when both pivot and MACD conditions align.
Tips
Works best on higher timeframes (H1 and above).
Combine with price action or trend filters for confirmation.
Use proximity percentage according to volatility (e.g., smaller % for low-vol assets).
⚠️ Disclaimer:
This script is provided for educational and informational purposes only.
It does not constitute financial or investment advice, and the author is not responsible for any financial losses that may occur from its use.
Always perform your own analysis and use this indicator together with other technical and risk management tools before making trading decisions.
---------------------------------------------------------------------------------------------
سقف و کف تاییدشده + سیگنالهای MACD
این اندیکاتور ترکیبی از شناسایی سقفها و کفهای تاییدشده (Pivot High/Low) به همراه سیگنالهای مومنتوم MACD است که نقاط برگشت یا ادامهی روند را روی چارت مشخص میکند.
🔹 منطق عملکرد
تایید سقف و کفها:
ابتدا سقف و کفهای محلی بر اساس تعداد کندلهای تنظیمشده شناسایی میشوند.
وقتی ساختار قیمتی از آخرین سقف یا کف عبور کند، آن سطح به عنوان حمایت یا مقاومت تاییدشده در نظر گرفته شده و با برچسبهای “CL” (کف تاییدشده) و “CH” (سقف تاییدشده) و خطوط نقطهچین رسم میشود.
ادغام با MACD:
از منطق کلاسیک کراساور/کراسآندر MACD استفاده شده است:
کراس صعودی: عبور خط MACD از بالای خط سیگنال.
کراس نزولی: عبور خط MACD از زیر خط سیگنال.
فیلتر سیگنال با ناحیه مجاور:
با استفاده از درصد ناحیه مجاور (Proximity Zone %)، فقط زمانی سیگنال صادر میشود که قیمت نزدیک حمایت یا مقاومت فعال باشد.
سیگنال خرید: وقتی قیمت در ناحیهی حمایت و همزمان MACD صعودی شود.
سیگنال فروش: وقتی قیمت در ناحیهی مقاومت و همزمان MACD نزولی شود.
تنظیمات ورودی
طول تأیید پیوتها
تنظیمات MACD (Fast, Slow, Signal)
درصد ناحیه مجاور برای فعال شدن سیگنالها
خروجیها
برچسبهای “CL” و “CH” برای سطوح تاییدشده
نشانگرهای “BUY” و “SELL” در محل صدور سیگنال
نکات کاربردی
بهترین عملکرد در تایمفریمهای بالاتر (۱ ساعته به بالا)
برای دقت بیشتر، آن را با فیلتر روند یا پرایساکشن ترکیب کنید
درصد ناحیه مجاور را با توجه به نوسانات دارایی تنظیم کنید

My script//@version=5
indicator("LTF Multi-Condition BUY Signal (v5 clean)", overlay=true, max_labels_count=100, max_lines_count=100)
// ───────────────── INPUTS ─────────────────
pivot_len = input.int(4, "Pivot sensitivity (structure)", minval=2, maxval=12)
range_len = input.int(20, "Range lookback for breakout", minval=5)
htf_tf = input.timeframe("480", "HTF timeframe (8H+)")
reclaim_window = input.int(5, "Reclaim window (bars)", minval=1)
ema_fast_len = input.int(9, "EMA fast length")
ema_slow_len = input.int(21, "EMA slow length")
rsi_len = input.int(14, "RSI length")
rsi_pivot_len = input.int(4, "RSI pivot sensitivity")
rsi_div_lookback = input.int(30, "RSI divergence max lookback (bars)")
daily_vol_mult = input.float(1.0, "Daily volume vs SMA multiplier", step=0.1)
htf_vol_sma_len = input.int(20, "HTF volume SMA length")
require_reclaim = input.bool(true, "Require HTF reclaim")
use_aggressive_HL = input.bool(false, "Aggressive HL detection")
// ───────────────── BASE INDICATORS ─────────────────
emaFast = ta.ema(close, ema_fast_len)
emaSlow = ta.ema(close, ema_slow_len)
rsiVal = ta.rsi(close, rsi_len)
// ───────────────── DAILY CHECKS (VOLUME & OBV) ─────────────────
// Daily OBV and previous value
daily_obv = request.security(syminfo.tickerid, "D",
ta.cum(ta.change(close) > 0 ? volume : ta.change(close) < 0 ? -volume : 0))
daily_obv_prev = request.security(syminfo.tickerid, "D",
ta.cum(ta.change(close) > 0 ? volume : ta.change(close) < 0 ? -volume : 0) )
// Daily volume & SMA
daily_vol = request.security(syminfo.tickerid, "D", volume)
daily_vol_sma = request.security(syminfo.tickerid, "D", ta.sma(volume, 20))
daily_vol_ok = not na(daily_vol) and not na(daily_vol_sma) and daily_vol > daily_vol_sma * daily_vol_mult
daily_obv_ok = not na(daily_obv) and not na(daily_obv_prev) and daily_obv > daily_obv_prev
// ───────────────── HTF SUPPORT / RECLAIM ─────────────────
htf_high = request.security(syminfo.tickerid, htf_tf, high)
htf_low = request.security(syminfo.tickerid, htf_tf, low)
htf_close = request.security(syminfo.tickerid, htf_tf, close)
htf_volume = request.security(syminfo.tickerid, htf_tf, volume)
htf_vol_sma = request.security(syminfo.tickerid, htf_tf, ta.sma(volume, htf_vol_sma_len))
htf_bull_reject = not na(htf_high) and not na(htf_low) and not na(htf_close) and (htf_close - htf_low) > (htf_high - htf_close)
htf_vol_confirm = not na(htf_volume) and not na(htf_vol_sma) and htf_volume > htf_vol_sma
htf_support_level = (htf_bull_reject and htf_vol_confirm) ? htf_low : na
// Reclaim: LTF close back above HTF support within N bars
reclaimed_now = not na(htf_support_level) and close > htf_support_level and ta.barssince(close <= htf_support_level) <= reclaim_window
htf_reclaim_ok = require_reclaim ? reclaimed_now : true
// ───────────────── STRUCTURE: BOS & HL (CoC) ─────────────────
swingHighVal = ta.pivothigh(high, pivot_len, pivot_len)
swingLowVal = ta.pivotlow(low, pivot_len, pivot_len)
swingHighCond = not na(swingHighVal)
swingLowCond = not na(swingLowVal)
lastSwingHigh = ta.valuewhen(swingHighCond, swingHighVal, 0)
prevSwingHigh = ta.valuewhen(swingHighCond, swingHighVal, 1)
lastSwingLow = ta.valuewhen(swingLowCond, swingLowVal, 0)
prevSwingLow = ta.valuewhen(swingLowCond, swingLowVal, 1)
bos_bull = not na(prevSwingHigh) and close > prevSwingHigh
hl_confirm = not na(lastSwingLow) and not na(prevSwingLow) and lastSwingLow > prevSwingLow and ta.barssince(swingLowCond) <= 30
if use_aggressive_HL
hl_confirm := hl_confirm or (low > low and ta.barssince(swingLowCond) <= 12)
// ───────────────── RSI BULLISH DIVERGENCE ─────────────────
rsiLowVal = ta.pivotlow(rsiVal, rsi_pivot_len, rsi_pivot_len)
rsiLowCond = not na(rsiLowVal)
priceAtRsiLowA = ta.valuewhen(rsiLowCond, low , 0)
priceAtRsiLowB = ta.valuewhen(rsiLowCond, low , 1)
rsiLowA = ta.valuewhen(rsiLowCond, rsiVal , 0)
rsiLowB = ta.valuewhen(rsiLowCond, rsiVal , 1)
rsi_div_ok = not na(priceAtRsiLowA) and not na(priceAtRsiLowB) and not na(rsiLowA) and not na(rsiLowB) and
(priceAtRsiLowA < priceAtRsiLowB) and (rsiLowA > rsiLowB) and ta.barssince(rsiLowCond) <= rsi_div_lookback
// ───────────────── RANGE BREAKOUT ─────────────────
range_high = ta.highest(high, range_len)
range_breakout = ta.crossover(close, range_high)
// ───────────────── EMA CROSS / TREND ─────────────────
ema_cross_happened = ta.crossover(emaFast, emaSlow)
ema_trend_ok = emaFast > emaSlow
// ───────────────── FINAL BUY CONDITION ─────────────────
all_price_checks = bos_bull and hl_confirm and rsi_div_ok and range_breakout
all_filter_checks = ema_trend_ok and ema_cross_happened and daily_vol_ok and daily_obv_ok and htf_reclaim_ok
buy_condition = all_price_checks and all_filter_checks
// ───────────────── PLOTS & ALERT ─────────────────
plotshape(
buy_condition,
title = "BUY Signal",
location = location.belowbar,
style = shape.labelup,
text = "BUY",
textcolor = color.white,
color = color.green,
size = size.small)
plot(htf_support_level, title="HTF Support", color=color.new(color.green, 0), linewidth=2, style=plot.style_linebr)
alertcondition(buy_condition, title="LTF BUY Signal", message="LTF BUY Signal on {{ticker}} ({{interval}}) — all conditions met")
