Fractal Pullback Market StructureFractal Pullback Market Structure
Author: The_Forex_Steward
License: Mozilla Public License 2.0
The Fractal Pullback Market Structure indicator is a sophisticated price action tool designed to visualize internal structure shifts and break-of-structure (BoS) events with high accuracy. It leverages fractal pullback logic to identify market swing points and confirm whether a directional change has occurred.
This indicator detects swing highs and lows based on fractal behavior, drawing zigzag lines to connect these key pivot points. It classifies and labels each structural point as either a Higher High (HH), Higher Low (HL), Lower High (LH), or Lower Low (LL). Internal shifts are marked using triangle symbols on the chart, distinguishing bullish from bearish developments.
Break of Structure events are confirmed when price closes beyond the most recent swing high or low, and a horizontal line is drawn at the breakout level. This helps traders validate when a structural trend change is underway.
Users can configure the lookback period that defines the sensitivity of the pullback detection, as well as a timeframe multiplier to align the logic with higher timeframes such as 4H or Daily. There are visual customization settings for the zigzag lines and BoS markers, including color, width, and style (solid, dotted, or dashed).
Alerts are available for each key structural label—HH, HL, LH, LL—as well as for BoS events. These alerts are filtered through a selectable alert mode that separates signals by timeframe category: Low Timeframe (LTF), Medium Timeframe (MTF), and High Timeframe (HTF). Each mode allows the user to receive alerts only when relevant to their strategy.
This indicator excels in trend confirmation and reversal detection. Traders can use it to identify developing structure, validate internal shifts, and anticipate breakout continuation or rejection. It is particularly useful for Smart Money Concept (SMC) traders, swing traders, and those looking to refine entries and exits based on price structure rather than lagging indicators.
Visual clarity, adaptable timeframe logic, and precise structural event detection make this tool a valuable addition to any price action trader’s toolkit.
Cari dalam skrip untuk "BOS"

Rally/Drop Market Structure (Multi-Timeframe)Rally/Drop Market Structure
Supply and Demand Zones from Bullish/Bearish Breaks
Overview:
The Rally/Drop Market Structure indicator is a powerful price action tool that identifies key structural turning points in the market by detecting bullish and bearish breaks . After each confirmed break, it plots either a demand zone (following a bullish break or rally) or a supply zone (following a bearish break or drop). These zones represent institutional footprints — areas where price is likely to react due to imbalance or unfilled orders.
The indicator is based on synthetic higher timeframe (HTF) candles to provide a more stable and smoothed structural map, improving clarity and signal quality over raw candles.
How It Works:
- A bullish break is defined when price makes a higher high and a higher low (or closes above the previous high depending on your selected mode).
- A bearish break is defined when price makes a lower high and a lower low (or closes below the previous low).
- After a bullish break, the indicator plots a demand zone based on the low and high of the most recent bearish candle — representing where demand stepped in.
- After a bearish break, the indicator plots a supply zone from the most recent bullish candle — indicating where supply took control.
- Optional mitigation logic marks zones as mitigated (or deletes them) once price trades into the opposing side.
- Internal shift detection highlights swing highs and lows , labels structural points (HH, HL, LH, LL), and identifies potential liquidity sweeps .
Features:
- Dynamic plotting of rally-based demand zones and drop-based supply zones
- Toggle to use Highs/Lows or Close-based breaks for structure
- Support for LTF, MTF, and HTF analysis (with selectable timeframe)
- Zone mitigation logic with optional automatic cleanup
- Labeling of key swing points: HH , HL , LH , LL , and LS (Liquidity Sweep)
- Zigzag visualization for structure flow
- Alert-ready for internal shifts, BoS, and zone creation
- Separate styling options for BoS lines, internal shift shapes, and zone colors
How to Use:
- Set your desired HTF candle source (e.g., 1H or 4H) depending on your trading style.
- Use Highs/Lows mode for pure price action structure or Close mode for more conservative signals.
- Observe when a bullish break occurs — a demand zone will form where price previously dropped before rallying. Look for long opportunities if price revisits this zone.
- After a bearish break , a supply zone forms where the rally failed — use this to scout short entries on retests.
- Use BoS lines to confirm structure shifts and validate entry triggers or trend direction.
- Monitor mitigated zones for reduced reliability or avoid them completely by enabling automatic deletion.
- Use alerts to stay notified about key changes without watching the chart constantly.
Recommended Strategies:
- Smart money or ICT-style trading : identify institutional footprints and mitigation setups
- Reversal trading : catch price rejecting off unmitigated zones after structure break
- Trend continuation : enter in the direction of internal structure after pullbacks into zones
- Liquidity sweep confirmation : filter out false breaks using HH/LL with LS detection
Tips:
- Combine this indicator with a higher timeframe bias tool (e.g., moving average, higher timeframe market structure).
- For scalping, use tighter HTFs and reduce the zone duration.
- For swing trading, use larger HTFs (1H, 4H, Daily) and increase zone persistence.
Summary:
The Rally/Drop Market Structure indicator gives you an actionable framework for understanding price structure, market intent, and supply/demand imbalances. Whether you're looking for precision entries, trend confirmation, or smart money concepts, this tool helps simplify complex price behavior into clean, usable structure and zones.

Alpha - Combined BreakoutThis Pine Script indicator, "Alpha - Combined Breakout," is a combination between Smart Money Breakout Signals and UT Bot Alert, The UT Bot Alert indicator was initially developer by Yo_adriiiiaan
The idea of original code belongs HPotter.
This Indicator helps you identify potential trading opportunities by combining two distinct strategies: Smart Money Breakout and a modified UT Bot (likely a variation of the Ultimate Trend Bot). It provides visual signals, draws lines for potential take profit (TP) and stop loss (SL) levels, and includes a dashboard to track performance metrics.
Tutorial:
Understanding and Using the "Alpha - Combined Breakout" Indicator
This indicator is designed for traders looking for confirmation of market direction and potential entry/exit points by blending structural analysis with a trend-following oscillator.
How it Works (General Concept)
The indicator combines two main components:
Smart Money Breakout: This part identifies significant breaks in market structure, which "smart money" traders often use to gauge shifts in supply and demand. It looks for higher highs/lows or lower highs/lows and flags when these structural points are broken.
UT Bot: This is a trend-following component that generates buy and sell signals based on price action relative to an Average True Range (ATR) based trailing stop.
You can choose to use these signals independently or combined to generate trading alerts and visual cues on your chart. The dashboard provides a quick overview of how well the signals are performing based on your chosen settings and display mode.
Parameters and What They Do
Let's break down each input parameter:
1. Smart Money Inputs
These settings control how the indicator identifies market structure and breakouts.
swingSize (Market Structure Time-Horizon):
What it does: This integer value defines the number of candles used to identify significant "swing" (pivot) points—highs and lows.
Effect: A larger swingSize creates a smoother market structure, focusing on longer-term trends. This means signals might appear less frequently and with some delay but could be more reliable for higher timeframes or broader market movements. A smaller swingSize will pick up more minor market structure changes, leading to more frequent but potentially noisier signals, suitable for lower timeframes or scalping.
Analogy: Think of it like a zoom level on your market structure map. Higher values zoom out, showing only major mountain ranges. Lower values zoom in, showing every hill and bump.
bosConfType (BOS Confirmation Type):
What it does: This string input determines how a Break of Structure (BOS) is confirmed. You have two options:
'Candle Close': A breakout is confirmed only if a candle's closing price surpasses the previous swing high (for bullish) or swing low (for bearish).
'Wicks': A breakout is confirmed if any part of the candle (including its wick) surpasses the previous swing high or low.
Effect: 'Candle Close' provides stronger, more conservative confirmation, as it implies sustained price movement beyond the structure. 'Wicks' provides earlier, more aggressive signals, as it captures momentary breaches of the structure.
Analogy: Imagine a wall. 'Candle Close' means the whole person must get over the wall. 'Wicks' means even a finger touching over the top counts as a breach.
choch (Show CHoCH):
What it does: A boolean (true/false) input to enable or disable the display of "Change of Character" (CHoCH) labels. CHoCH indicates the first structural break against the current dominant trend.
Effect: When true, it helps identify early signs of a potential trend reversal, as it marks where the market's "character" (its tendency to make higher highs/lows or lower lows/highs) first changes.
BULL (Bullish Color) & BEAR (Bearish Color):
What they do: These color inputs allow you to customize the visual appearance of bullish and bearish signals and lines drawn by the Smart Money component.
Effect: Purely cosmetic, helps with visual identification on the chart.
sm_tp_sl_multiplier (SM TP/SL Multiplier (ATR)):
What it does: A float value that acts as a multiplier for the Average True Range (ATR) to calculate the Take Profit (TP) and Stop Loss (SL) levels specifically when you're in "Smart Money Only" mode. It uses the ATR calculated by the UT Bot's nLoss_ut as its base.
Effect: A higher multiplier creates wider TP/SL levels, potentially leading to fewer trades but larger wins/losses. A lower multiplier creates tighter TP/SL levels, potentially leading to more frequent but smaller wins/losses.
2. UT Bot Alerts Inputs
These parameters control the behavior and sensitivity of the UT Bot component.
a_ut (UT Key Value (Sensitivity)):
What it does: This integer value adjusts the sensitivity of the UT Bot.
Effect: A higher value makes the UT Bot less sensitive to price fluctuations, resulting in fewer and potentially more reliable signals. A lower value makes it more sensitive, generating more signals, which can include more false signals.
Analogy: Like a noise filter. Higher values filter out more noise, keeping only strong signals.
c_ut (UT ATR Period):
What it does: This integer sets the look-back period for the Average True Range (ATR) calculation used by the UT Bot. ATR measures market volatility.
Effect: This period directly influences the calculation of the nLoss_ut (which is a_ut * xATR_ut), thus defining the distance of the trailing stop loss and take profit levels. A longer period makes the ATR smoother and less reactive to sudden price spikes. A shorter period makes it more responsive.
h_ut (UT Signals from Heikin Ashi Candles):
What it does: A boolean (true/false) input to determine if the UT Bot calculations should use standard candlestick data or Heikin Ashi candlestick data.
Effect: Heikin Ashi candles smooth out price action, often making trends clearer and reducing noise. Using them for UT Bot signals can lead to smoother, potentially delayed signals that stay with a trend longer. Standard candles are more reactive to raw price changes.
3. Line Drawing Control Buttons
These crucial boolean inputs determine which type of signals will trigger the drawing of TP/SL/Entry lines and flags on your chart. They act as a priority system.
drawLinesUtOnly (Draw Lines: UT Only):
What it does: If checked (true), lines and flags will only be drawn when the UT Bot generates a buy/sell signal.
Effect: Isolates UT Bot signals for visual analysis.
drawLinesSmartMoneyOnly (Draw Lines: Smart Money Only):
What it does: If checked (true), lines and flags will only be drawn when the Smart Money Breakout logic generates a bullish/bearish breakout.
Effect: Overrides drawLinesUtOnly if both are checked. Isolates Smart Money signals.
drawLinesCombined (Draw Lines: UT & Smart Money (Combined)):
What it does: If checked (true), lines and flags will only be drawn when both a UT Bot signal AND a Smart Money Breakout signal occur on the same bar.
Effect: Overrides both drawLinesUtOnly and drawLinesSmartMoneyOnly if checked. Provides the strictest entry criteria for line drawing, looking for strong confluence.
Dashboard Metrics Explained
The dashboard provides performance statistics based on the lines drawing control button selected. For example, if "Draw Lines: UT Only" is active, the dashboard will show stats only for UT Bot signals.
Total Signals: The total number of buy or sell signals generated by the selected drawing mode.
TP1 Win Rate: The percentage of signals where the price reached Take Profit 1 (TP1) before hitting the Stop Loss.
TP2 Win Rate: The percentage of signals where the price reached Take Profit 2 (TP2) before hitting the Stop Loss.
TP3 Win Rate: The percentage of signals where the price reached Take Profit 3 (TP3) before hitting the Stop Loss. (Note: TP1, TP2, TP3 are in order of distance from entry, with TP3 being furthest.)
SL before any TP rate: This crucial metric shows the number of times the Stop Loss was hit / the percentage of total signals where the stop loss was triggered before any of the three Take Profit levels were reached. This gives you a clear picture of how often a trade resulted in a loss without ever moving into profit target territory.
Short Tutorial: How to Use the Indicator
Add to Chart: Open your TradingView chart, go to "Indicators," search for "Alpha - Combined Breakout," and add it to your chart.
Access Settings: Once added, click the gear icon next to the indicator name on your chart to open its settings.
Choose Your Signal Mode:
For UT Bot only: Uncheck "Draw Lines: Smart Money Only" and "Draw Lines: UT & Smart Money (Combined)". Ensure "Draw Lines: UT Only" is checked.
For Smart Money only: Uncheck "Draw Lines: UT Only" and "Draw Lines: UT & Smart Money (Combined)". Ensure "Draw Lines: Smart Money Only" is checked.
For Combined Signals: Check "Draw Lines: UT & Smart Money (Combined)". This will override the other two.
Adjust Parameters:
Start with default settings. Observe how the signals appear on your chosen asset and timeframe.
Refine Smart Money: If you see too many "noisy" market structure breaks, increase swingSize. If you want earlier breakouts, try "Wicks" for bosConfType.
Refine UT Bot: Adjust a_ut (Sensitivity) to get more or fewer UT Bot signals. Change c_ut (ATR Period) if you want larger or smaller TP/SL distances. Experiment with h_ut to see if Heikin Ashi smoothing suits your trading style.
Adjust TP/SL Multiplier: If using "Smart Money Only" mode, fine-tune sm_tp_sl_multiplier to set appropriate risk/reward levels.
Interpret Signals & Lines:
Buy/Sell Flags: These indicate the presence of a signal based on your selected drawing mode.
Entry Line (Blue Solid): This is where the signal was generated (usually the close price of the signal candle).
SL Line (Red/Green Solid): Your calculated stop loss level.
TP Lines (Dashed): Your three calculated take profit levels (TP1, TP2, TP3, where TP3 is the furthest target).
Smart Money Lines (BOS/CHoCH): These lines indicate horizontal levels where market structure breaks occurred. CHoCH labels might appear at the first structural break against the prior trend.
Monitor Dashboard: Pay attention to the dashboard in the top right corner. This dynamically updates to show the win rates for each TP and, crucially, the "SL before any TP rate." Use these statistics to evaluate the effectiveness of the indicator's signals under your current settings and chosen mode.
*
Set Alerts (Optional): You can set up alerts for any of the specific signals (UT Bot Long/Short, Smart Money Bullish/Bearish, or the "Line Draw" combined signals) to notify you when they occur, even if you're not actively watching the chart.
By following this tutorial, you'll be able to effectively use and customize the "Alpha - Combined Breakout" indicator to suit your trading strategy.

Smart Money Breakout Signals [AlgoAlpha]Introducing the Smart Money Breakout Signals, a cutting-edge trading indicator designed to identify key structural shifts and breakout opportunities in the market. This tool leverages a blend of smart money concepts like Break of Structure (BOS) and Change of Character (CHoCH) to provide traders with actionable insights into market direction and potential entry or exit points.
Key Features :
✨ Market Structure Analysis : Automatically detects and labels BOS and CHoCH for trend confirmation and reversals.
🎨 Customizable Visualization : Tailor bullish and bearish colors for breakout lines and signals to suit your preferences.
📊 Dynamic Take-Profit Targets : Displays three tiered take-profit levels based on breakout volatility.
🔔 Real-Time Alerts : Stay ahead of the game with notifications for bullish and bearish breakouts.
📋 Performance Dashboard : Monitor signal statistics, including win rates and total signals, directly on your chart.
How to Use :
Add the Indicator : Add the script to your favourites ⭐ and customize settings like market structure horizon and confirmation type.
Monitor Breakouts : Observe BOS and CHoCH labels to identify potential trend shifts. Use the breakout lines and tiered take-profit levels to plan trades effectively.
Set Alerts : Enable alerts for bullish or bearish breakouts to act on opportunities without constant monitoring.
How It Works :
The indicator identifies market structure by analyzing pivot highs and lows over a user-defined time horizon. A breakout is confirmed based on either candle closes or wicks surpassing previous pivot points. Upon detection, the script generates signals with breakout lines and calculates take-profit targets based on the distance from the breakout level. A built-in dashboard tracks performance metrics like total signals and win rates, giving traders real-time feedback on strategy effectiveness.

Volumetric Rejection Blocks [UAlgo]The Volumetric Rejection Blocks is designed to help traders identify and visualize key price levels where volumetric rejections occur, which may indicate a shift in market sentiment. These rejections can signal potential trend reversals or areas where price action is likely to face support or resistance. By drawing rejection blocks based on volumetric strength, the indicator allows users to observe where significant buying or selling pressure has been exerted, which can be used as a reference point for future price action.
Also indicator dynamically calculates swing highs and lows, analyzes bullish and bearish strengths based on volume-weighted price movements, and displays rejection blocks on the chart. Each rejection block represents an area where the price attempted to move beyond a certain level but faced rejection, either on a close or wick basis. This can be particularly useful for traders who rely on market structure and order flow to make informed decisions about entering or exiting trades.
🔶 Key Features
Swing Length Customization: Allows users to define the swing length, helping tailor the sensitivity of the swing high and low detection to the specific market conditions.
Rejection Block Visualization: Displays up to the last 10 rejection blocks based on user settings, clearly marking areas of significant bullish or bearish rejections.
Volumetric Strength Analysis: The indicator calculates bullish and bearish strength for each rejection block, based on volume-weighted price movements over the last few bars, giving insight into the intensity of the rejection.
Violation Check Type: Offers two options for violation detection—"Close" and "Wick". This allows traders to specify whether a price level is considered broken only if it closes beyond the level or if any wick breaches it.
Bullish and Bearish Block Coloring: Rejection blocks are colored to represent bullish (green) and bearish (red) rejection areas. The color transparency can be adjusted for clear visibility overlaid on the price chart.
Market Structure Labels: Labels and lines marking "Market Structure Shift" (MSS) and "Break of Structure" (BOS) are displayed, giving traders context about significant market structure changes.
🔶 Interpreting the Indicator
Rejection Blocks: These colored blocks on the chart indicate areas where the price faced significant buying or selling pressure. A green block suggests a bullish rejection (support zone), where buyers absorbed the sell-off, potentially pushing the price upward. Conversely, a red block indicates a bearish rejection (resistance zone), where sellers overpowered buyers, potentially driving the price lower.
Strength Analysis: The width of the green and red sections within a rejection block represents the relative bullish and bearish strengths. A wider green section indicates stronger bullish support, while a wider red section suggests more robust bearish resistance. This helps traders gauge the likelihood of price holding or breaching these levels.
Market Structure Shift (MSS) and Break of Structure (BOS): The indicator automatically detects and labels significant changes in market structure. An "MSS" label indicates the first break, suggesting a potential shift in trend direction. A "BOS" label indicates a subsequent confirmation in trend direction, allowing traders to recognize potential trend continuations.
Violation Check: Traders can choose how to interpret breaks of these rejection blocks. Using the "Close" option provides a more conservative approach, requiring a close beyond the level for confirmation. The "Wick" option is more aggressive, treating any wick beyond the level as a break.
🔶 Disclaimer
Use with Caution: This indicator is provided for educational and informational purposes only and should not be considered as financial advice. Users should exercise caution and perform their own analysis before making trading decisions based on the indicator's signals.
Not Financial Advice: The information provided by this indicator does not constitute financial advice, and the creator (UAlgo) shall not be held responsible for any trading losses incurred as a result of using this indicator.
Backtesting Recommended: Traders are encouraged to backtest the indicator thoroughly on historical data before using it in live trading to assess its performance and suitability for their trading strategies.
Risk Management: Trading involves inherent risks, and users should implement proper risk management strategies, including but not limited to stop-loss orders and position sizing, to mitigate potential losses.
No Guarantees: The accuracy and reliability of the indicator's signals cannot be guaranteed, as they are based on historical price data and past performance may not be indicative of future results.

SMC Order Block & Liquidity EntryThe SMC Order Block and Liquidity Trap Entry Strategy script uses Smart Money Concepts (SMC), which analyze institutional actions in the market, to assist traders in identifying high-probability trades. In order to help traders match their entry with institutional activity, this script highlights important regions of interest, including order blocks, liquidity zones, and indications for Break of Structure (BOS) or Change of Character (CHoCH).
The fundamental ideas of this approach, which focuses on regions where institutions frequently make sizable orders or sweep liquidity, are based on SMC principles. Order blocks, which are frequently important support or resistance zones when institutions are involved, are the final bullish or bearish candle before a significant price move in the other direction. There are liquidity zones that show where retail stop-loss orders build up (above recent highs or below recent lows), such as Buy-Side Liquidity (BSL) and Sell-Side Liquidity (SSL). Before changing the direction of the price, institutions could target these zones, giving traders possible chances.
The script depicts liquidity levels above or below recent highs and lows, automatically finds order blocks within a specified lookback time, and looks for BOS (a continuation signal) or CHoCH (a reversal signal). When liquidity retests inside an order block coincide with BOS or CHoCH circumstances, entry signals are produced. While short entries are triggered when the price breaks below the order block and SSL, long entry alerts are triggered when the price breaks above the order block and BSL.

Smart Money Concepts IndicatorBEST ICT AND SMC INDICATOR
The **Smart Money Concepts Indicator** is designed to enhance trading decisions by incorporating key principles from Smart Money Concepts (SMC), focusing on the detection of market structure changes, liquidity zones, order flow, and order blocks. This indicator is particularly useful for traders looking to understand market dynamics and make informed trading decisions based on advanced market analysis.
#### Key Features:
1. **Break of Structure (BOS)**:
- Identifies upward and downward breaks in market structure, indicating potential trend reversals.
- Visual markers on the chart help traders spot these critical levels.
2. **Change of Character (CHOCH)**:
- Detects significant changes in market direction, highlighting potential shifts in momentum.
- Clearly labeled signals indicate when the market may be changing its character.
3. **Order Blocks**:
- Highlights order blocks, which are key areas where significant buying or selling has occurred.
- Provides visual cues for potential support and resistance zones.
4. **Liquidity Zones**:
- Marks liquidity zones, indicating areas where buy-side or sell-side liquidity may be targeted.
- Helps traders understand where the market might draw liquidity.
5. **Dynamic Take Profit and Stop Loss Levels**:
- Calculates and plots take profit (TP) and stop loss (SL) levels based on the Average True Range (ATR) for adaptive risk management.
- Customizable multipliers allow traders to adjust levels based on their risk tolerance.
6. **Order Flow Analysis**:
- Displays bullish and bearish order flow signals based on candle close relative to open.
- Provides insights into market sentiment and potential future price action.
#### How to Use:
- **Identifying Entry and Exit Points**: Use BOS and CHOCH signals to find potential entry points, while leveraging TP and SL levels for risk management.
- **Market Analysis**: Analyze order blocks and liquidity zones to make informed decisions on market behavior.
- **Visual Confirmation**: The clear visual cues provided by the indicator make it easier to interpret market movements and align trades with institutional behavior.
#### Conclusion:
The Smart Money Concepts Indicator is an invaluable tool for traders looking to enhance their understanding of market structure and make more informed trading decisions. By integrating advanced concepts like BOS, CHOCH, and liquidity analysis, this indicator helps traders navigate the complexities of the market with greater confidence.

ICT Panther (By Obicrypto) V1 ICT Panther Indicator: Full and Detailed Description
The ICT Panther Indicator, created by Obicrypto, is an advanced technical analysis tool designed specifically for traders looking to identify key price action events based on institutional trading techniques, particularly in the context of the Inner Circle Trader (ICT) methodology. This indicator helps traders spot market structure breaks, order blocks, and potential trade opportunities driven by institutional behaviors in the market. Here's a detailed breakdown of its features and how it works:
What Does the ICT Panther Indicator Do?
1. Market Structure Breaks (MSB) Identification:
The ICT Panther identifies critical points where the market changes direction, commonly referred to as a break of structure (BoS). When the price breaks above or below certain key levels (based on highs and lows or opens and closes), it signals a potential shift in market sentiment. These break-of-structure points are essential for traders to determine whether the market is likely to continue its trend or reverse.
2. Order Blocks Visualization:
The indicator plots demand (bullish) and supply (bearish) boxes, which represent areas where institutional traders might place significant buy or sell orders. These zones, known as order blocks, are areas where the price tends to pause or reverse, giving traders key insights into potential entry and exit points. The indicator shows these areas graphically as colored boxes on the chart, which can be used to plan trades based on market structure and price action.
3. Pivot Point Detection:
The ICT Panther identifies important pivot points by tracking higher highs and lower lows. These pivot points are critical in determining the strength of a trend and can help traders confirm the direction of the market. The indicator uses a unique algorithm to detect two levels of pivot points:
- First-Order Pivots: Major pivot points where the price makes notable highs and lows.
- Second-Order Pivots: Smaller pivot points, useful for detecting microtrends within the larger market structure.
4. Bullish and Bearish Break of Structure Lines:
When a significant market structure break (BoS) occurs, the indicator will automatically draw red lines (for bearish break of structure) and green lines (for bullish break of structure) at key price levels. These lines help traders quickly see where institutional moves have occurred in the past and where potential future price moves could originate from.
5. Tested and Filled Boxes:
The ICT Panther also has a built-in mechanism to dim previously tested order blocks. When the price tests an order block (returns to a previous demand or supply zone), the box's color dims to indicate that the area has already been tested, reducing its significance. If the price fully fills an order block, the box stops plotting, providing a clear and clutter-free chart.
Key Features
1. Market Structure Break (MSB) Trigger:
- The indicator allows users to select between highs/lows or opens/closes as the trigger for market structure breaks. This flexibility lets traders adjust the indicator to suit their personal trading style or the behavior of specific assets.
2. Order Block Detection and Visualization:
- The tool automatically plots bullish and bearish demand and supply boxes, representing institutional order blocks on the chart. These boxes provide visual cues for areas of potential price action, where institutional traders might be active.
3. Second-Order Pivot Highlighting:
- The ICT Panther offers an option to plot second-order pivots, highlighting smaller pivot points within the larger market structure. These pivots can be helpful for short-term traders who need to react to smaller price movements while still keeping the larger trend in mind.
4. Box Test and Fill Delays:
- Users can configure delays for box tests and box fills, meaning the indicator will only mark a box as tested or filled after a certain number of bars. This prevents false signals and helps confirm that a zone is truly significant in the market.
5. Customization and Visual Clarity:
- The indicator is highly customizable, allowing users to turn on or off various features like:
- Displaying second-order pivots.
- Highlighting candles that broke structure.
- Plotting market structure broke lines.
- Showing or hiding tested and filled demand boxes.
- Setting custom delays for box testing and filling to suit different market conditions.
6. Tested and Filled Order Block Visualization:
- The indicator visually adjusts the tested and filled order blocks, dimming tested zones and removing filled zones to avoid clutter on the chart. This ensures that traders can focus on active trading opportunities without distractions from historical data.
How Does It Work?
1. Detecting Market Structure Breaks (BoS):
- The indicator continuously tracks the market for key price action signals. When the price breaks through previous highs or lows (or opens and closes, depending on your selection), the indicator marks this as a break of structure. This is a critical signal used by institutional traders and retail traders alike to determine potential future price movements.
2. Order Block Identification:
- Whenever a bullish break of structure occurs, the indicator plots a green demand box to show the area where institutional buyers might have placed significant orders. Similarly, for a bearish break of structure, it plots a red supply box representing areas where institutional sellers are active.
3. Pivot Analysis and Tracking:
- As the market moves, the indicator continuously updates first-order and second-order pivot points based on highs and lows. These points help traders identify whether the market is trending or consolidating. Traders can use these pivot points in combination with the order blocks to make informed trading decisions.
4. Box Testing and Filling:
- When the price retests an existing order block, the box dims to show it has been tested. If the price fully fills the box, it is no longer shown, which helps traders focus on the most relevant, untested order blocks.
Benefits for Traders
- Improved Decision-Making: With clear visuals and advanced logic based on institutional trading strategies, this indicator provides a deeper understanding of market structure and price action.
- Reduced Clutter: The indicator intelligently manages the display of order blocks and pivot points, ensuring that traders focus only on the most relevant information.
- Adaptability: Whether you are a swing trader or a day trader, the ICT Panther can be adjusted to fit your trading style, offering robust and flexible tools for tracking market structure and order blocks.
- Institutional Edge: By identifying institutional-level order blocks and market structure breaks, traders using this indicator can trade in line with the strategies of large market participants.
Who Should Use the ICT Panther Indicator?
This indicator is ideal for:
- Crypto, Forex, and Stock Traders who want to incorporate institutional trading concepts into their strategies.
- Technical Analysts looking for precise tools to measure the market structure and price action.
- ICT Traders who follow the Inner Circle Trader methodology and want an advanced tool to automate and enhance their analysis.
- Price Action Traders seeking a reliable indicator to track pivot points, order blocks, and market structure breaks.
The ICT Panther Indicator is a powerful, versatile tool that brings institutional trading techniques to the fingertips of retail traders. Whether you are looking to identify key market structure breaks, order blocks, or crucial pivot points, this indicator offers detailed visualizations and customizable options to help you make more informed trading decisions. With its ability to track the activities of institutional traders, the ICT Panther Indicator equips traders with the insights needed to stay ahead of the market and trade with confidence.
With the ICT Panther Indicator, traders can follow the movements of institutional money, making it easier to predict market direction and capitalize on high-probability trading opportunities.
Enjoy it and share it with your friends!

Price Action Volumetric Breaker Blocks [UAlgo]The Price Action Volumetric Breaker Blocks indicator is designed to identify and visualize significant price levels in the market. It combines concepts of price action, volume analysis, and market structure to provide traders with a comprehensive view of potential support and resistance areas. This indicator identifies "breaker blocks," which are price zones where the market has shown significant interest in the past.
These blocks are created based on swing highs and lows, and are further analyzed using volume data to determine their strength. The indicator also tracks market structure shifts, providing additional context to price movements.
By visualizing these key levels and market structure changes, traders can gain insights into potential areas of price reversal or continuation, helping them make more informed trading decisions.
🔶 Key Features
Dynamic Breaker Block Identification: The indicator automatically detects and draws breaker blocks based on swing highs and lows. These blocks represent areas of potential support and resistance.
Volume-Weighted Strength Analysis: Each breaker block is analyzed using volume data to determine its bullish and bearish strength. This is visually represented by the proportion of green (bullish) and red (bearish) coloring within each block.
Market Structure Break (MSB) and Break of Structure (BOS): The indicator identifies and labels Market Structure Breaks (MSB) and Break of Structure (BOS) events, providing context to larger market trends.
Customizable Settings:
- Adjustable swing length for identifying pivot points
- Option to show a specific number of recent breaker blocks
- Choice between wick or close price for violation checks
- Toggle to hide overlapping blocks for cleaner analysis
Violation Detection: Automatically detects when a breaker block has been violated (broken through), either by wick or close price, depending on user settings.
Overlap Control: Provides an option to hide overlapping order blocks, ensuring that the chart remains clean and easy to read when multiple blocks are detected in close proximity.
🔶 Interpreting Indicator
Breaker Blocks:
Breaker blocks are key areas where the price moves through and invalidates a previously identified order block. The indicator detects a breaker block when the price violates an order block by exceeding its high or low (depending on whether it's a bullish or bearish block). This violation is determined by either the wick or the close of a candle, depending on the user's selection in the "Violation Check" setting. When a breaker block is detected, the indicator removes the violated order block from the chart, signaling that the zone is no longer relevant for future price action.
Bullish Breaker Block: This occurs when a bearish order block (red) is violated by the price closing above the block’s top boundary or when the wick surpasses this level. It signals that a prior bearish structure has been invalidated, and the market may shift to a bullish trend.
Bearish Breaker Block: This occurs when a bullish order block (teal) is violated by the price closing below the block’s bottom boundary or when the wick drops below it. It suggests that a previous bullish structure has been broken, indicating potential bearish momentum.
Market Structure Labels:
"MSB" (Market Structure Break) labels indicate a potential change in trend direction.
"BOS" (Break of Structure) labels confirm the continuation of the current trend after breaking a significant level.
Block Strength:
A block with more green indicates stronger bullish interest.
A block with more red indicates stronger bearish interest.
The relative sizes of the green and red portions show the balance of power between buyers and sellers at that level.
🔶 Disclaimer
Use with Caution: This indicator is provided for educational and informational purposes only and should not be considered as financial advice. Users should exercise caution and perform their own analysis before making trading decisions based on the indicator's signals.
Not Financial Advice: The information provided by this indicator does not constitute financial advice, and the creator (UAlgo) shall not be held responsible for any trading losses incurred as a result of using this indicator.
Backtesting Recommended: Traders are encouraged to backtest the indicator thoroughly on historical data before using it in live trading to assess its performance and suitability for their trading strategies.
Risk Management: Trading involves inherent risks, and users should implement proper risk management strategies, including but not limited to stop-loss orders and position sizing, to mitigate potential losses.
No Guarantees: The accuracy and reliability of the indicator's signals cannot be guaranteed, as they are based on historical price data and past performance may not be indicative of future results.

Pure Price Action ICT Tools [LuxAlgo]The Pure Price Action ICT Tools indicator is designed for pure price action analysis, automatically identifying real-time market structures, liquidity levels, order & breaker blocks, and liquidity voids.
Its unique feature lies in its exclusive reliance on price patterns, without being constrained by any user-defined inputs, ensuring a robust and objective analysis of market dynamics.
🔶 MARKET STRUCTURES
A Market Structure Shift, also known as a Change of Character (CHoCH), is a pivotal event in price action analysis indicating a potential change in market sentiment or direction. An MSS occurs when the price reverses from an established trend, signaling that the prevailing trend may be losing momentum and a reversal might be underway. This shift is often identified by key technical patterns, such as a higher low in a downtrend or a lower high in an uptrend, which indicate a weakening of the current trend's strength.
A Break of Structure typically indicates the continuation of the current market trend. This event occurs when the price decisively moves beyond a previous swing high or low, confirming the strength of the prevailing trend. In an uptrend, a BOS is marked by the price breaking above a previous high, while in a downtrend, it is identified by the price breaking below a previous low.
While a Market Structure Shift (MSS) can indicate a potential trend reversal and a Break of Structure (BOS) often confirms trend continuation, they do not assure a complete reversal or continuation. MSS and BOS levels can also function as liquidity zones or areas of price consolidation rather than definitively signaling a change in market direction. Traders should approach these signals cautiously and validate them with additional factors before making trading decisions. For further details on other components of the tool, please refer to the following sections.
🔶 ORDER & BREAKER BLOCKS
Order and Breaker Blocks are key concepts in price action analysis that help traders identify significant levels in the market structure.
Order Blocks are specific price zones where significant buying or selling activity has occurred. These zones often represent the actions of large institutional traders or market makers, who execute substantial orders that impact the market.
Breaker Blocks are specific price zones where a strong reversal occurs, causing a break in the prevailing market structure. These blocks indicate areas where the price encountered significant resistance or support, leading to a reversal.
In summary, Order and Breaker Blocks are essential tools in price action analysis, providing insights into significant market levels influenced by institutional trading activities. These blocks help traders make informed decisions about potential support and resistance levels, trend reversals, and breakout confirmations.
🔶 BUYSIDE & SELLSIDE LIQUIDITY
Both buy-side and sell-side liquidity zones are critical for identifying potential turning points in the market. These zones are where significant buying or selling interest is concentrated, influencing future price movements.
In summary, buy-side and sell-side liquidity provide crucial insights into market demand and supply dynamics, helping traders make informed decisions based on the availability of orders at different price levels.
🔶 LIQUIDITY VOIDS
Liquidity voids are gaps or areas on a price chart where there is a lack of trading activity. These voids represent zones with minimal to no buy or sell orders, often resulting in sharp price movements when the market enters these areas.
In summary, liquidity voids are crucial areas on a price chart characterized by a lack of trading activity. These voids can lead to rapid price movements and increased volatility, making them essential considerations for traders in their analysis and decision-making processes.
🔶 SWING POINTS
Reversal price points are commonly referred to as swing points. Traders often analyze historical swing points to discern market trends and pinpoint potential trade entry and exit points.
Do note that in this script these are subject to backpainting, that is they are not located where they are detected.
The detection of swing points and the unique feature of this script rely exclusively on price action, eliminating the need for numerical user-defined settings. The process begins with detecting short-term swing points:
Short-Term Swing High (STH): Identified as a price peak surrounded by lower highs on both sides.
Short-Term Swing Low (STL): Recognized as a price trough surrounded by higher lows on both sides.
Intermediate-term and long-term swing points are detected using the same approach but with a slight modification. Instead of directly analyzing price candles, previously detected short-term swing points are utilized. For intermediate-term swing points, short-term swing points are analyzed, while for long-term swing points, intermediate-term ones are used.
This method ensures a robust and objective analysis of market dynamics, offering traders reliable insights into market structures. Detected swing points serve as the foundation for identifying market structures, buy-side/sell-side liquidity levels, and order and breaker blocks presented with this tool.
In summary, swing points are essential elements in technical analysis, helping traders identify trends, support, and resistance levels, and optimal entry and exit points. Understanding swing points allows traders to make informed decisions based on the natural price movements in the market.
🔶 SETTINGS
🔹 Market Structures
Market Structures: Toggles the visibility of the market structures, both shifts and breaks.
Detection: An option that allows users to detect market structures based on the significance of swing levels, including short-term, intermediate-term, and long-term.
Market Structure Labels: Controls the visibility of labels that highlight the type of market structure.
Line Style: Customizes the style of the lines representing the market structure.
🔹 Order & Breaker Blocks
Order & Breaker Blocks: Toggles the visibility of the order & breaker blocks.
Detection: An option that allows users to detect order & breaker blocks based on the significance of swing levels, including short-term, intermediate-term, and long-term.
Last Bullish Blocks: Number of the most recent bullish order/breaker blocks to display on the chart.
Last Bearish Blocks: Number of the most recent bearish order/breaker blocks to display on the chart.
Use Candle Body: Allows users to use candle bodies as order block areas instead of the full candle range.
🔹 Buyside & Sellside Liquidity
Buyside & Sellside Liquidity: Toggles the visibility of the buyside & sellside liquidity levels.
Detection: An option that allows users to detect buy-side & sell-side liquidity based on the significance of swing levels, including short-term, intermediate-term, and long-term.
Margin: Sets margin/sensitivity for a liquidity level detection.
Visible Levels: Controls the amount of the liquidity levels/zones to be visualized.
🔹 Liquidity Voids
Liquidity Voids: Enable display of both bullish and bearish liquidity voids.
Threshold Multiplier: Defines the multiplier for the threshold, which is hard-coded to the 200-period ATR range.
Mode: Controls the lookback length for detection and visualization. Present considers the last X bars specified in the option, while Historical includes all available data.
Label: Enable display of a label indicating liquidity voids.
🔹 Swing Highs/Lows
Swing Highs/Lows: Toggles the visibility of the swing levels.
Detection: An option that allows users to detect swing levels based on the significance of swing levels, including short-term, intermediate-term, and long-term.
Label Size: Control the size of swing level labels.
🔶 RELATED SCRIPTS
Pure-Price-Action-Structures.
Market-Structures-(Intrabar).
Buyside-Sellside-Liquidity.
Order-Breaker-Blocks.

Pure Price Action Structures [LuxAlgo]The Pure Price Action Structures indicator is a pure price action analysis tool designed to automatically identify real-time market structures.
The indicator identifies short-term, intermediate-term, and long-term swing highs and lows, forming the foundation for real-time detection of shifts and breaks in market structure.
Its distinctive/unique feature lies in its reliance solely on price patterns, without being limited by any user-defined input, ensuring a robust and objective analysis of market dynamics.
🔶 USAGE
Market structure is a crucial aspect of understanding price action. The script automatically identifies real-time market structure, enabling traders to comprehend market trends more easily. It assists traders in recognizing both trend changes and continuations.
Market structures are constructed from three sets of swing points, short-term swings, intermediary swings, and long-term swings. Market structures associated with longer-term swing points are indicative of longer-term trends.
A market structure shift (MSS), also known as a change of character (CHoCH), is a significant event in price action analysis that may signal a potential shift in market sentiment or direction. Conversely, a break of structure (BOS) is another significant event in price action analysis that typically indicates a continuation of the prevailing trend.
However, it's important to note that while an MSS can be the first indication of a trend reversal and a BOS signifies a continuation of the prevailing trend, they do not guarantee a complete reversal or continuation of the trend.
In some cases, MSS and BOS levels may also act as liquidity zones or areas of price consolidation, rather than indicating a definitive change in market direction or continuation. Traders should approach them with caution and consider additional factors to confirm the validity of the signal before making trading decisions.
🔶 DETAILS
🔹 Market Structures
Market structures are based on the analysis of price action and aim to identify key levels and patterns in the market, where swing point detection is one of the core concepts within ICT trading methodologies and teachings.
Swing points are automatically detected solely based on market movements, without any reliance on user-defined input.
🔹 Utilizing Swing Points
Swing points are not identified in real time as they occur. While short-term swing points may be displayed with a delay of at most one bar, the identification of intermediate and long-term swing points depends entirely on market movements. Furthermore, detection is not limited by any user-defined input but relies solely on pure price action. Consequently, swing points are not typically utilized in real-time trading scenarios.
Traders often analyze historical swing points to discern market trends and pinpoint potential entry and exit points for their trades. By identifying swing highs and lows, traders can:
Recognize Trends: Swing highs and lows help traders identify the direction of the trend. Higher swing highs and higher swing lows indicate an uptrend, while lower swing highs and lower swing lows indicate a downtrend.
Identify Support and Resistance Levels: Swing highs often serve as resistance levels, known in ICT terminology as Buyside Liquidity Levels, while swing lows function as support levels, also referred to in ICT terminology as Sellside Liquidity Levels. Traders can utilize these levels to strategize entry and exit points for their trades.
Spot Reversal Patterns: Swing points can form various reversal patterns, such as double tops or bottoms, head and shoulders patterns, and triangles. Recognizing these patterns can signal potential trend reversals, allowing traders to adjust their strategies accordingly.
Set Stop Loss and Take Profit Levels: In the context of ICT teachings, swing levels represent specific price levels where a concentration of buy or sell orders is anticipated. Traders can target these liquidity levels/pools to accumulate or distribute their positions, essentially using swing points to establish stop loss and take profit levels for their trades.
Overall, swing points provide valuable information about market dynamics and can assist traders in making more informed trading decisions.
🔶 SETTINGS
🔹 Structures
Swings and Size: Toggles the visibility of the structure's highs and lows, assigns an icon corresponding to the structures, and controls the size of the icons.
Market Structures: Toggles the visibility of the market structures.
Market Structure Labels: Controls the visibility of labels that highlight the type of market structure.
Line Style and Width: Customizes the style and width of the lines representing the market structure.
Swing and Line Colors: Customizes colors for the icons representing highs and lows, and the lines and labels representing the market structure.
🔶 RELATED SCRIPTS
Market-Structures-(Intrabar).
Buyside-Sellside-Liquidity.

Time - Bar StatusCandlestick analysis
The Indicator "Bar Status" will display the current open candle state and the last three close candles state based on the logic below.
Abbreviations.
OC = Open Candle (if in no state listed below)
FB = False Break
BO = Break Out
IN = Inside Bar
FBR = False Break Reversal
Logic:
OC = This is the current open candle yet to close. Its status will change as it progresses through time until close.
Green False Break Revers (FBR) = bar Close is higher than previous bar Close AND bar High is higher than previous bar High AND bar Low is lower than previous bar Low.
Green False Break (FB) = bar Close is lower than previous bar High AND bar High is higher than previous bar High.
Green Breakout (BO) = bar Close is higher than previous bar Close AND bar High is higher than previous bar High.
Green Inside Bar (IN) = bar High is lower than previous bar High AND bar Low is higher than previous bar Low.
Red False Break Revers (FBR) = bar Close is lower than previous bar Close AND bar Low is lower than previous bar Low AND bar High is Higher than previous bar High.
Red False Break (FB) = bar Close is higher than previous bar Low AND bar Low is lower than previous bar Low.
Red Breakout (BO) = bar Close is lower than previous bar Close AND bar Low is lower than previous bar Low.
Red Inside Bar (IN) = bar High is lower than previous bar High AND bar Low is higher than previous bar Low.
The end column is the current open candle/bar.
The second from the end column is the last closed candle/bar.
The third from the end column is the second closed candle/bar.
The forth from the end column is the third closed candle/bar.
=============================================================
Also Includes candle countdown timer, of various candles. i.e. 4 hour, 1 hour, 15min, 5 min.

Smart Money Setup 01 [TradingFinder]Double Order Blocks Proof🔵 Introduction
The Price Action, styled as the "Smart Money Concept" or "SMC," was introduced by Mr. David J. Crouch in 2000 and is one of the most modern technical styles in the financial world. In financial markets, Smart Money refers to capital controlled by major market players (central banks, funds, etc.), and these traders can accurately predict market trends and achieve the highest profits.
In the "Smart Money" style, various types of "order blocks" can be traded. This indicator uses a type of "order block" originating from "BoS" (Breakout of Structure). The most important feature of this indicator is the confirmation of two order blocks.
🟣 Important
For example, after the first "BoS" and the formation of the first Order Block, if a second "BoS" occurs before touching the price of the first Order Block and the formation of the second Order Block, a trading setup with 2 order blocks is formed, which confirms the dominant market trend.
For a better understanding of this subject, see the explanations in the following two images.
Bullish Setup Details :
Bearish Setup Details :
🔵 How to Use
After adding the indicator to the chart, you should wait for the formation of the trading setup. You can observe different trading positions by changing the "Time Frame" and "Pivot Period." Generally, the higher the "Time Frame" and "Pivot Period," the more valid the formed setup is.
Bullish Setup Details on Chart :
Bearish Setup Details on Chart :
You can access the "Pivot Period" input through the settings.

ICT Donchian Smart Money Structure (Expo)█ Concept Overview
The Inner Circle Trader (ICT) methodology is focused on understanding the actions and implications of the so-called "smart money" - large institutions and professional traders who often influence market movements. Key to this is the concept of market structure and how it can provide insights into potential price moves.
Over time, however, there has been a notable shift in how some traders interpret and apply this methodology. Initially, it was designed with a focus on the fractal nature of markets. Fractals are recurring patterns in price action that are self-similar across different time scales, providing a nuanced and dynamic understanding of market structure.
However, as the ICT methodology has grown in popularity, there has been a drift away from this fractal-based perspective. Instead, many traders have started to focus more on pivot points as their primary tool for understanding market structure.
Pivot points provide static levels of potential support and resistance. While they can be useful in some contexts, relying heavily on them could provide a skewed perspective of market structure. They offer a static, backward-looking view that may not accurately reflect real-time changes in market sentiment or the dynamic nature of markets.
This shift from a fractal-based perspective to a pivot point perspective has significant implications. It can lead traders to misinterpret market structure and potentially make incorrect trading decisions.
To highlight this issue, you've developed a Donchian Structure indicator that mirrors the use of pivot points. The Donchian Channels are formed by the highest high and the lowest low over a certain period, providing another representation of potential market extremes. The fact that the Donchian Structure indicator produces the same results as pivot points underscores the inherent limitations of relying too heavily on these tools.
While the Donchian Structure indicator or pivot points can be useful tools, they should not replace the original, fractal-based perspective of the ICT methodology. These tools can provide a broad overview of market structure but may not capture the intricate dynamics and real-time changes that a fractal-based approach can offer.
It's essential for traders to understand these differences and to apply these tools correctly within the broader context of the ICT methodology and the Smart Money Concept Structure. A well-rounded approach that incorporates fractals, along with other tools and forms of analysis, is likely to provide a more accurate and comprehensive understanding of market structure.
█ Smart Money Concept - Misunderstandings
The Smart Money Concept is a popular concept among traders, and it's based on the idea that the "smart money" - typically large institutional investors, market makers, and professional traders - have superior knowledge or information, and their actions can provide valuable insight for other traders.
One of the biggest misunderstandings with this concept is the belief that tracking smart money activity can guarantee profitable trading.
█ Here are a few common misconceptions:
Following Smart Money Equals Guaranteed Success: Many traders believe that if they can follow the smart money, they will be successful. However, tracking the activity of large institutional investors and other professionals isn't easy, as they use complex strategies, have access to information not available to the public, and often intentionally hide their moves to prevent others from detecting their strategies.
Instantaneous Reaction and Results: Another misconception is that market movements will reflect smart money actions immediately. However, large institutions often slowly accumulate or distribute positions over time to avoid moving the market drastically. As a result, their actions might not produce an immediate noticeable effect on the market.
Smart Money Always Wins: It's not accurate to assume that smart money always makes the right decisions. Even the most experienced institutional investors and professional traders make mistakes, misjudge market conditions, or are affected by unpredictable events.
Smart Money Activity is Transparent: Understanding what constitutes smart money activity can be quite challenging. There are many indicators and metrics that traders use to try and track smart money, such as the COT (Commitments of Traders) reports, Level II market data, block trades, etc. However, these can be difficult to interpret correctly and are often misleading.
Assuming Uniformity Among Smart Money: 'Smart Money' is not a monolithic entity. Different institutional investors and professional traders have different strategies, risk tolerances, and investment horizons. What might be a good trade for a long-term institutional investor might not be a good trade for a short-term professional trader, and vice versa.
█ Market Structure
The Smart Money Concept Structure deals with the interpretation of price action that forms the market structure, focusing on understanding key shifts or changes in the market that may indicate where 'smart money' (large institutional investors and professional traders) might be moving in the market.
█ Three common concepts in this regard are Change of Character (CHoCH), and Shift in Market Structure (SMS), Break of Structure (BMS/BoS).
Change of Character (CHoCH): This refers to a noticeable change in the behavior of price movement, which could suggest that a shift in the market might be about to occur. This might be signaled by a sudden increase in volatility, a break of a trendline, or a change in volume, among other things.
Shift in Market Structure (SMS): This is when the overall structure of the market changes, suggesting a potential new trend. It usually involves a sequence of lower highs and lower lows for a downtrend, or higher highs and higher lows for an uptrend.
Break of Structure (BMS/BoS): This is when a previously defined trend or pattern in the price structure is broken, which may suggest a trend continuation.
A key component of this approach is the use of fractals, which are repeating patterns in price action that can give insights into potential market reversals. They appear at all scales of a price chart, reflecting the self-similar nature of markets.
█ Market Structure - Misunderstandings
One of the biggest misunderstandings about the ICT approach is the over-reliance or incorrect application of pivot points. Pivot points are a popular tool among traders due to their simplicity and easy-to-understand nature. However, when it comes to the Smart Money Concept and trying to follow the steps of professional traders or large institutions, relying heavily on pivot points can create misconceptions and lead to confusion. Here's why:
Delayed and Static Information: Pivot points are inherently backward-looking because they're calculated based on the previous period's data. As such, they may not reflect real-time market dynamics or sudden changes in market sentiment. Furthermore, they present a static view of market structure, delineating pre-defined levels of support and resistance. This static nature can be misleading because markets are fundamentally dynamic and constantly changing due to countless variables.
Inadequate Representation of Market Complexity: Markets are influenced by a myriad of factors, including economic indicators, geopolitical events, institutional actions, and market sentiment, among others. Relying on pivot points alone for reading market structure oversimplifies this complexity and can lead to a myopic understanding of market dynamics.
False Signals and Misinterpretations: Pivot points can often give false signals, especially in volatile markets. Prices might react to these levels temporarily but then continue in the original direction, leading to potential misinterpretation of market structure and sentiment. Also, a trader might wrongly perceive a break of a pivot point as a significant market event, when in fact, it could be due to random price fluctuations or temporary volatility.
Over-simplification: Viewing market structure only through the lens of pivot points simplifies the market to static levels of support and resistance, which can lead to misinterpretation of market dynamics. For instance, a trader might view a break of a pivot point as a definite sign of a trend, when it could just be a temporary price spike.
Ignoring the Fractal Nature of Markets: In the context of the Smart Money Concept Structure, understanding the fractal nature of markets is crucial. Fractals are self-similar patterns that repeat at all scales and provide a more dynamic and nuanced understanding of market structure. They can help traders identify shifts in market sentiment or direction in real-time, providing more relevant and timely information compared to pivot points.
The key takeaway here is not that pivot points should be entirely avoided or that they're useless. They can provide valuable insights and serve as a useful tool in a trader's toolbox when used correctly. However, they should not be the sole or primary method for understanding the market structure, especially in the context of the Smart Money Concept Structure.
█ Fractals
Instead, traders should aim for a comprehensive understanding of markets that incorporates a range of tools and concepts, including but not limited to fractals, order flow, volume analysis, fundamental analysis, and, yes, even pivot points. Fractals offer a more dynamic and nuanced view of the market. They reflect the recursive nature of markets and can provide valuable insights into potential market reversals. Because they appear at all scales of a price chart, they can provide a more holistic and real-time understanding of market structure.
In contrast, the Smart Money Concept Structure, focusing on fractals and comprehensive market analysis, aims to capture a more holistic and real-time view of the market. Fractals, being self-similar patterns that repeat at different scales, offer a dynamic understanding of market structure. As a result, they can help to identify shifts in market sentiment or direction as they happen, providing a more detailed and timely perspective.
Furthermore, a comprehensive market analysis would consider a broader set of factors, including order flow, volume analysis, and fundamental analysis, which could provide additional insights into 'smart money' actions.
█ Donchian Structure
Donchian Channels are a type of indicator used in technical analysis to identify potential price breakouts and trends, and they may also serve as a tool for understanding market structure. The channels are formed by taking the highest high and the lowest low over a certain number of periods, creating an envelope of price action.
Donchian Channels (or pivot points) can be useful tools for providing a general view of market structure, and they may not capture the intricate dynamics associated with the Smart Money Concept Structure. A more nuanced approach, centered on real-time fractals and a comprehensive analysis of various market factors, offers a more accurate understanding of 'smart money' actions and market structure.
█ Here is why Donchian Structure may be misleading:
Lack of Nuance: Donchian Channels, like pivot points, provide a simplified view of market structure. They don't take into account the nuanced behaviors of price action or the complex dynamics between buyers and sellers that can be critical in the Smart Money Concept Structure.
Limited Insights into 'Smart Money' Actions: While Donchian Channels can highlight potential breakout points and trends, they don't necessarily provide insights into the actions of 'smart money'. These large institutional traders often use sophisticated strategies that can't be easily inferred from price action alone.
█ Indicator Overview
We have built this Donchian Structure indicator to show that it returns the same results as using pivot points. The Donchian Structure indicator can be a useful tool for market analysis. However, it should not be seen as a direct replacement or equivalent to the original Smart Money concept, nor should any indicator based on pivot points. The indicator highlights the importance of understanding what kind of trading tools we use and how they can affect our decisions.
The Donchian Structure Indicator displays CHoCH, SMS, BoS/BMS, as well as premium and discount areas. This indicator plots everything in real-time and allows for easy backtesting on any market and timeframe. A unique candle coloring has been added to make it more engaging and visually appealing when identifying new trading setups and strategies. This candle coloring is "leading," meaning it can signal a structural change before it actually happens, giving traders ample time to plan their next trade accordingly.
█ How to use
The indicator is great for traders who want to simplify their view on the market structure and easily backtest Smart Money Concept Strategies. The added candle coloring function serves as a heads-up for structure change or can be used as trend confirmation. This new candle coloring feature can generate many new Smart Money Concepts strategies.
█ Features
Market Structure
The market structure is based on the Donchian channel, to which we have added what we call 'Structure Response'. This addition makes the indicator more useful, especially in trending markets. The core concept involves traders buying at a discount and selling or shorting at a premium, depending on the order flow. Structure response enables traders to determine the order flow more clearly. Consequently, more trading opportunities will appear in trending markets.
Structure Candles
Structure Candles highlight the current order flow and are significantly more responsive to structural changes. They can provide traders with a heads-up before a break in structure occurs
-----------------
Disclaimer
The information contained in my Scripts/Indicators/Ideas/Algos/Systems does not constitute financial advice or a solicitation to buy or sell any securities of any type. I will not accept liability for any loss or damage, including without limitation any loss of profit, which may arise directly or indirectly from the use of or reliance on such information.
All investments involve risk, and the past performance of a security, industry, sector, market, financial product, trading strategy, backtest, or individual's trading does not guarantee future results or returns. Investors are fully responsible for any investment decisions they make. Such decisions should be based solely on an evaluation of their financial circumstances, investment objectives, risk tolerance, and liquidity needs.
My Scripts/Indicators/Ideas/Algos/Systems are only for educational purposes!

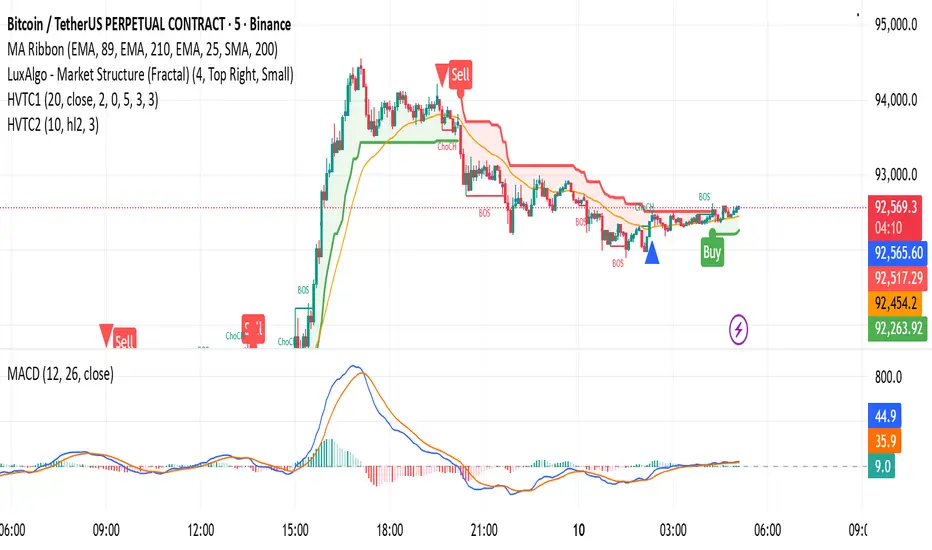
HVTC 1HVTC – SMC Market Structure & Trend Indicator
HVTC is a Smart Money Concepts–based tool that helps traders visualize market structure and trend direction with clarity.
Features:
CHoCH & BOS Detection
Automatically identifies structural shifts using true SMC logic and labels them directly on the chart.
Trend Filter
Confirms bullish or bearish conditions using an internal trend system to keep trades aligned with the major direction.
EMA 25 Guide
EMA 25 acts as dynamic support/resistance, helping define momentum and bias.
Alerts (Optional)
Notify traders when CHoCH/BOS or key retests occur—ideal for those who don’t monitor charts continuously.
Use Cases:
Works for Crypto, Forex, Gold, Indices, and Stocks across all timeframes. Helps improve entries, exits, and overall market understanding based on institutional structure.
Not financial advice. Use with proper risk management.
Smart Money Concepts [MHA Finverse]A comprehensive Smart Money Concepts (SMC) indicator designed to identify institutional trading behavior and market structure shifts. This tool helps traders align with "smart money" by detecting key supply and demand zones, structural breaks, and liquidity patterns.
Core Features
Market Structure Analysis
- Real-time Internal Structure: Detects short-term BOS (Break of Structure) and CHoCH (Change of Character) with customizable filters
- Swing Structure: Identifies major trend shifts and structural breaks on higher timeframes
- Adjustable pivot detection with customizable swing point visualization
- Strong/Weak High/Low identification for bias confirmation
Order Blocks (OB)
- Internal and Swing Order Blocks with independent control
- Volume-based metrics showing OB strength and percentage contribution
- Two filtering methods: ATR-based and Cumulative Mean Range
- Flexible mitigation options (Close or High/Low)
- Display up to 20 order blocks per type with auto-cleanup on mitigation
- Color-coded zones with transparency control
Liquidity Detection
- Equal Highs (EQH) and Equal Lows (EQL) identification
- Threshold-based detection using ATR calculation
- Visual confirmation lines connecting equal levels
- Adjustable sensitivity and bar confirmation settings
Fair Value Gaps (FVG)
- Multi-timeframe FVG detection
- Auto-threshold calculation based on price momentum
- Bullish and Bearish gap visualization
- Extendable gap boxes for tracking unfilled imbalances
Premium & Discount Zones
- Automated premium, equilibrium, and discount zone plotting
- Based on current swing range extremes
- Visual representation of optimal entry zones
- Helps identify potential reversal and continuation areas
Multi-Timeframe Levels
- Previous Daily, Weekly, and Monthly High/Low levels
- Customizable line styles (solid, dashed, dotted)
- Independent color controls for each timeframe
- Auto-adjusted labels (PDH, PDL, PWH, PWL, PMH, PML)
Display Modes
- Historical Mode: Shows all past structures and maintains drawing history
- Present Mode: Displays only current active structures for cleaner charts
Visual Themes
- Colored: Full color customization for all elements
- Monochrome: Clean grey-scale design for minimal distraction
Smart Features
- Confluence filter for internal structure to reduce noise
- Automatic candle coloring based on market bias
- 16 pre-configured alert conditions for all major signals
- Efficient rendering with automatic cleanup of broken structures
- Independent control over each feature for modular usage
Use Cases
- Identify institutional entry and exit points through order blocks
- Spot potential reversals at premium/discount zones
- Confirm trend direction with BOS and CHoCH signals
- Find liquidity grabs at equal highs and lows
- Trade imbalances at fair value gaps
- Align entries with multi-timeframe key levels
Settings Organization
All features are neatly organized into logical groups:
- Smart Money Concepts (general settings)
- Real Time Internal Structure
- Real Time Swing Structure
- Order Blocks
- EQH/EQL
- Fair Value Gaps
- Highs & Lows MTF
- Premium & Discount Zones
Note: This indicator works on all timeframes and instruments. For optimal results, combine multiple SMC concepts together to find high-probability setups with confluence.
Credits
Special thanks to Dau_tu_hieu_goc and BigBeluga for their code examples and inspiration that contributed to the development of this indicator.
Disclaimer
This indicator is for educational purposes only and does not constitute financial advice. Trading involves substantial risk of loss. Past performance does not guarantee future results. Always use proper risk management and conduct your own analysis before making trading decisions. The developer is not responsible for any trading losses incurred.
Happy Trading

Smart Money Concepts by Rakesh Sharma🎯 SMART MONEY CONCEPTS - TRADE WITH INSTITUTIONS
Reveal where banks, hedge funds, and institutional traders enter the market. Trade alongside smart money, not against them!
✨ FEATURES:
- Order Blocks (OB) - Institutional buying/selling zones
- Fair Value Gaps (FVG) - Market inefficiencies to exploit
- Break of Structure (BOS) - Trend continuation signals
- Change of Character (ChoCh) - Early reversal detection
- Liquidity Sweeps - Stop hunt identification
- Premium/Discount Zones - Buy cheap, sell expensive
- Live Dashboard - Real-time market structure
🎯 HOW TO USE:
✓ BUY in Discount Zone at Bullish Order Blocks
✓ SELL in Premium Zone at Bearish Order Blocks
✓ Wait for ChoCh or BOS confirmation
✓ Follow institutional footprints for high-probability setups
📊 PERFECT FOR:
All markets - Nifty, Bank Nifty, Stocks, Forex, Crypto
All timeframes - 5m (scalping), 15m (intraday), Daily (swing)
⚡ TRADING EDGE:
Stop trading like retail. Start trading like institutions. See where smart money accumulates and distributes. Catch reversals early with ChoCh signals.
Created by: Rakesh Sharma | Version 1.0

LiqVision Institutional Suite v6.2 – Hybrid ModeLiqVision Institutional Suite v6.2 — Hybrid Mode (Lightning Edition)
Een ultra-geoptimaliseerde Smart Money-indicator gebaseerd op institutionele principes: Liquidity, Market Structure, Order Blocks, FVG’s en Model 1/2 setups.
Dit script combineert meerdere professionele SMC-concepten in één engine:
🔷 Functionaliteiten
1. Liquidity Engine
Automatische detectie van EQH, EQL en Liquidity Sweeps
Dynamische lijnprojectie met smart cleanup
Slimme sweep-detectie voor high-probability entries
2. Market Structure Engine
BOS & CHOCH detectie
Trend continuatie- en reversalsignalen
Swing-based pivot logic
3. Order Block Engine
Automatische OB-detectie met displacement filtering
Bullish & Bearish macro Order Blocks
HTF glow overlay (nieuw in v6.2)
4. FVG Engine
Major Fair Value Gap detection
Up/Down imbalance visual engine
HTF-based color restoration (v6.2 fix)
5. Model 1 & Model 2 Signal Engine
Trend continuation entries (Model 1)
Reversal setups gebaseerd op HTF liquidity & displacement (Model 2)
Auto-tapping logic geïntegreerd met OB/FVG
6. Hybrid Mode Rendering
Slimme shading afhankelijk van timeframe:
LTF → Hide OB/FVG
MTF → White overlays
HTF → Premium glow visuals
🔷 Alerts
Volledige alert-ondersteuning voor:
Model 1 Buy/Sell
Model 2 Buy/Sell
Liquidity Sweep
BOS Up/Down
CHOCH Up/Down
OB Tap
FVG Tap
Any alert() function call
Geschikt voor Telegram, Discord, bots en externe signal pipelines.
🔷 Gebruik
Voeg de indicator toe
Kies timeframe (1m–4h aanbevolen)
Activeer alerts via “Any alert() function call”
Volg Model 1/2 entries voor optimaal resultaat
⚡ DISCLAIMER
Dit script is uitsluitend bedoeld voor educatieve doeleinden. Geen financieel advies. Resultaten uit het verleden geven geen garantie voor de toekomst.

Smart Money Concepts [Modern Neon V2]This is a visually overhauled version of the popular Smart Money Concepts (SMC) indicator, designed specifically for traders who prefer Dark Mode, High Contrast, and Maximum Visibility.
While the underlying logic preserves the robust structure detection of the original LuxAlgo script, the visual presentation has been completely modernized. The default "dull" colors have been replaced with a vibrant Cyberpunk Neon palette, and text labels have been significantly upscaled to ensure market structure is readable at a glance, even on high-resolution monitors.
🎨 Visual & Style Enhancements:
Neon Palette:
Bullish: Electric Cyan (#00F5FF)
Bearish: Neon Hot Pink (#FF007F)
Neutral/Levels: Bright Gold (#FFD700)
High Visibility Text: Market Structure labels (BOS, CHoCH, HH/LL) have been upgraded from "Tiny" to Normal size. Key Swing Points (Strong High/Low) are set to Large.
Modern "Solid" Blocks: Order Blocks and FVGs feature reduced transparency (60%) for a bolder, solid look that doesn't get washed out on dark backgrounds.
Decluttered: Removed unnecessary "Small" elements and dotted lines to focus on price action.
🛠 Key Features:
Real-Time Structure: Automatic detection of Internal and Swing structure (BOS & CHoCH) with trend coloring.
Order Blocks: Highlights Bullish and Bearish Order Blocks with new mitigation logic.
Fair Value Gaps (FVG): Auto-threshold detection for high-probability gaps.
Premium & Discount Zones: Automatically plots equilibrium zones for better entry targeting.
Multi-Timeframe Levels: Display Daily, Weekly, and Monthly highs/lows.
Trend Dashboard: (If you added the dashboard code) A clean panel displaying the current Internal and Swing trend bias.
CREDITS & LICENSE: This script is a modification of the "Smart Money Concepts " indicator.
Original Author: © LuxAlgo
License: Attribution-NonCommercial-ShareAlike 4.0 International (CC BY-NC-SA 4.0)
creativecommons.org

LETHINH-Swing pa,smc🟦 📌 Title (English)
Swing High / Swing Low – 3-Candle Fractal (5-Bar Pivot) | Auto Alerts
⸻
🟩 📌 Short Description
A clean and reliable swing high / swing low detector based on the classic 3-candle (5-bar) fractal pivot. Automatically marks SH/SL and triggers alerts when a swing is confirmed. No repainting after confirmation.
⸻
🟧 📌 Full Description (for TradingView Publishing)
🔶 Swing High / Swing Low – 3-Candle Fractal (5-Bar Pivot)
This indicator identifies Swing Highs (SH) and Swing Lows (SL) using the classic 3-candle fractal pattern, also known as the 5-bar pivot.
It marks swing points only after full confirmation, making it highly reliable and suitable for structure-based trading.
⸻
🔶 📍 How It Works
A swing is confirmed when the center candle is higher (or lower) than the two candles on each side:
Swing High (SH)
high > high , high , high
Swing Low (SL)
low < low , low , low
The confirmation occurs after 2 right candles close, so the indicator does not repaint once a swing is identified.
⸻
🔶 📍 Key Features
• Detects clean and accurate swings
• Uses pure price action — no indicators, no lag
• Marks swing high (SH) and swing low (SL) directly on the chart
• Non-repainting after confirmation
• Works on all timeframes and all markets
• Extremely lightweight and fast
• Includes alert conditions for both SH and SL
Perfect for traders using:
• Market Structure (BOS / CHoCH)
• Order Blocks (OB)
• Smart Money Concepts (SMC)
• Liquidity hunts
• Wyckoff
• Support/Resistance
• Price Action entries
⸻
🔶 📍 Why This Indicator Is Useful
Swing points are the foundation of market structure.
Accurately detecting them helps traders:
• Identify trend shifts
• Spot BOS / CHoCH correctly
• Find key zones (OB, liquidity levels, supply/demand)
• Time entries more precisely
• Avoid fake structure breaks
This indicator ensures swings are plotted only when fully confirmed, reducing noise and confusion.
⸻
🔶 📍 Alerts
You can create alerts for both conditions:
• Swing High Confirmed
• Swing Low Confirmed
Recommended settings:
• Once per bar close
• Open-ended alert
With alerts enabled, TradingView will automatically notify you every time a new swing forms.
⸻
🔶 📍 No Repainting
Once a swing is confirmed and plotted, it will not change or disappear.
This makes the indicator reliable for real-time alerts and backtesting.
⸻
🔶 📍 Pine Script (v5)
Paste your indicator code here if you want it visible.
Or leave the code hidden if you are publishing as protected.
⸻
🔶 📍 Final Notes
• This indicator focuses on confirmation, not prediction
• It is designed for clean structure reading
• All markets supported: Forex, Crypto, Stocks, Indexes, Commodities
• Suitable for scalping, intraday, swing, and even higher-timeframe trading
If you find this tool helpful, feel free to give it a like and add it to your favorites ❤️
Your support helps me share more tools with the community!

FPT - Key Levels with VWAP🔶 FPT – Key Levels with VWAP
This indicator combines multi-session VWAP, higher-timeframe key levels, market structure (HH/HL/LH/LL), and liquidity zones into one clean intraday tool.
Designed for scalping, day-trading, and session-based strategies such as Asia → London → New York flows.
🔵 Features
1. Multi-Session VWAP
Asia VWAP
London VWAP
New York VWAP
Daily reset
Optional deviations & clean mode
2. Key Levels (HTF SR Zones)
Automatically detects:
Previous Day High / Low
4H / 1H Key Levels
Session High / Low
Midpoints
Equal Highs & Equal Lows (liquidity lines)
3. Market Structure Engine
Swing points (HH, HL, LH, LL)
Break of Structure (BOS)
Market Structure Shift (MSS)
Optional minimal mode showing only breaks
4. Liquidity Tools
Buyside & sellside liquidity zones
Range high / low liquidity
Optional void / imbalance zones
5. Clean Visualization Mode
Removes unnecessary text
Shows only the essential levels
Perfect for chart posting or backtesting
🟩 Use Cases
Intraday key level mapping
VWAP deviation → mean reversion setups
Liquidity sweep → BOS/MSS setups
Session volatility filtering
Scalping and fast execution planning
⚠️ Disclaimer
This script does not provide financial advice.
It is for educational and analytical purposes only.
All trading decisions are solely your responsibility.

Smart Money Decoded [GOLD]Title: Smart Money Decoded
Description:
Introduction
Smart Money Decoded is a comprehensive, institutional-grade visualization suite designed to simplify the complex world of Smart Money Concepts (SMC). While many indicators flood the chart with noise, this tool focuses on clarity, precision, and high-probability structure.
This script is built for traders who follow the "Inner Circle Trader" (ICT) methodologies but struggle to identify valid Zones, Displacement, and Liquidity Sweeps in real-time.
💎 Key Features & Logic
1. Refined Market Structure (BOS & CHoCH)
Instead of marking every minor pivot, this script uses a filtered Swing High/Low detection system.
HH/LL/LH/HL Labels: Only significant structure points are mapped.
BOS (Break of Structure): Marks trend continuations in the direction of the bias.
CHoCH (Change of Character): Marks potential trend reversals.
2. Advanced Order Blocks (with "Strict Mode")
Not all down-candles before an up-move are Order Blocks. This script separates the weak from the strong.
Standard OBs: Visualized with standard transparency.
⚡ SWEEP OBs (High Probability): Order Blocks that explicitly swept liquidity (Stop Hunt) before the reversal are highlighted with a thicker border, brighter color, and a ⚡ symbol. These are your high-probability "Turtle Soup" entries.
Strict Mode Toggle: In the settings, you can choose to hide all weak OBs and only see the ones that swept liquidity.
3. Dynamic Breaker Blocks
A true ICT Breaker is a failed Order Block that trapped liquidity.
This script automatically detects when a valid OB is mitigated (broken through) and projects it forward as a Breaker Block.
This ensures you are trading off valid flipped zones (Support becomes Resistance, Resistance becomes Support).
4. Fair Value Gaps (FVG)
Automatically detects Imbalances (Imbalance/Inefficiency).
Includes an ATR Filter to ignore tiny, insignificant gaps, keeping your chart clean.
Option to show the Consequent Encroachment (50% CE) level for precision entries.
5. Liquidity Zones (BSL / SSL)
Automatically plots Buy Side Liquidity (BSL) and Sell Side Liquidity (SSL) at key swing points.
Once price sweeps these levels, the zone is removed or marked as "Swept," helping you identify when the draw on liquidity has been met.
6. Institutional Data Panel
A dashboard in the top right corner displays:
Market Bias: Bullish/Bearish/Neutral based on structure.
Premium/Discount: Tells you if price is in the expensive (Premium) or cheap (Discount) part of the current dealing range.
Active Zones: Counts of current open arrays.
⚙️ How To Use This Indicator
Identify Bias: Look at the Structure Labels (HH/LL) and the Panel. Are we making Higher Highs?
Wait for the Trap: Look for a Liquidity Sweep (BSL/SSL taken) or a ⚡ Sweep OB.
Entry Confirmation: Watch for a return to a Fair Value Gap (FVG) or a retest of a Breaker Block (BRK).
Manage Risk: Use the visuals to place stops above/below invalidation points.
Customization:
Go to the settings to toggle "Strict Mode" for Order Blocks, change colors to match your theme, or adjust the lookback periods to fit your specific asset (Forex, Crypto, or Indices).
📚 Credits & Acknowledgments
This script is an educational tool based on the public teachings of Michael J. Huddleston (The Inner Circle Trader - ICT).
Concepts used: Order Blocks, Breakers, FVGs, Market Structure, Liquidity Pools.
Credit is fully given to ICT for originating these concepts and sharing them with the world.
⚠️ Disclaimer
This script is NOT affiliated with, endorsed by, or connected to Michael J. Huddleston (ICT) in any way. It is an independent coding project intended for educational purposes and visual assistance.
Trading involves substantial risk. This indicator does not guarantee profits. Always use proper risk management. Trust your analysis first, and use indicators as confluence.
#Smart Money Concepts, #SMC, #ICT,#Liquidity, #Market Structure, #Trend, #Price Action.

BifaneiroSinaleiro V3 ULTIMATEBifaneiroSinaleiro V3 ULTIMATE - Complete ICT Analysis System & Signal Generator
This isn't just an indicator - it's your 24/7 ICT analyst that does the manual work for you.
━━━━━━━━━━━━━━━━━━━━━━━━━━━━━━━━━━━━━━
🔥 WHAT IT DOES FOR YOU:
━━━━━━━━━━━━━━━━━━━━━━━━━━━━━━━━━━━━━━
✅ Marks ALL ICT Concepts Automatically:
- Fair Value Gaps (LTF + HTF with priority)
- Market Structure (BOS/CHoCH in real-time)
- Breaker Blocks (validated with volume + killzone)
- Liquidity Sweeps (Asian High/Low runs)
- Premium/Discount Arrays + OTE Zones
- Institutional Sessions (London, NY Silver Bullets)
✅ Advanced Pattern Recognition:
- Turtle Soup (sweep + reversal)
- Unicorn Model (sweep → BOS → FVG)
- SMT Divergences (monitors correlated pairs)
- PO3/AMD Phases (Accumulation → Manipulation → Distribution)
✅ Intelligent Scoring System:
- 12+ confluence factors analyzed
- Minimum score 12 for signals (configurable)
- Score 20+ = EXTREME (enables 2nd trade in session)
- Visual score display on every signal
✅ Professional Trade Management:
- 1 trade per session (London, NY AM, NY PM) = max 3/day
- EXTREME mode: 2 trades per session = max 6/day
- Automatic stop loss (session range-based)
- Dynamic take profit (score-adjusted multiplier)
- Auto breakeven after 2.5x move
- EOD close (23:59) with P&L label
- Weekend close (Fri 23:55) with P&L label
✅ 100% ICT Pure Methodology:
- NO EMAs, NO ATR, NO lagging indicators
- Pure price action: High/Low/Range only
- HTF confirmation via Premium/Discount (not EMAs!)
- Stop loss via Asian Range (not ATR!)
━━━━━━━━━━━━━━━━━━━━━━━━━━━━━━━━━━━━━━
⚡ WHY IT'S DIFFERENT:
━━━━━━━━━━━━━━━━━━━━━━━━━━━━━━━━━━━━━━
Traditional indicators show 1-2 concepts. This shows 10+ simultaneously.
Manual ICT takes 2-3 hours per session. This does it in milliseconds.
Other systems guess. This scores with objective confluence.
You save hours daily. You trade better. You profit more consistently.
━━━━━━━━━━━━━━━━━━━━━━━━━━━━━━━━━━━━━━
📊 WHAT YOU GET:
━━━━━━━━━━━━━━━━━━━━━━━━━━━━━━━━━━━━━━
- Real-time dashboard (scores, confluences, structure)
- Precision signals (only in killzones, only with confluences)
- Trade tracking (win rate, RR, P&L by session)
- Multi-timeframe analysis (automatic)
- News block filter (configurable)
- Full customization (colors, thresholds, sessions)
- Comprehensive alerts (8+ types)
Works on: Forex, Indices, Commodities, Crypto
Best on: 1m-5m for execution, 15m+ for swing
Timezone: Configured for CET (UTC+1), easily adjustable
⚠️ This is a professional tool requiring ICT/SMC understanding.
Not magic - it's methodology, automated.
🚀 Stop drawing. Start trading. Add to chart now.
