Trading Channel Index (TCI)Overview:
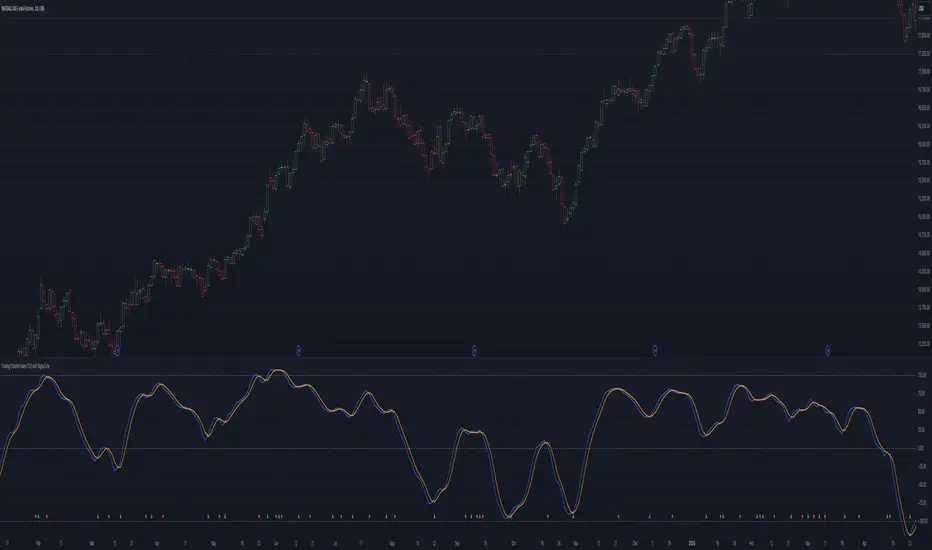
The Trading Channel Index (TCI) is a technical analysis tool designed to identify cyclical trends in financial markets by smoothing out price movements and reducing volatility compared to traditional oscillators, like the Commodity Channel Index (CCI). The TCI helps traders pinpoint overbought and oversold conditions, as well as gauge the strength and direction of market trends.
Calculation:
The TCI is calculated through a multi-step process:
Typical Price (Xt): The typical price is computed as the average of the high, low, and close prices for each bar:
Xt = (High + Low + Close) / 3
Exponential Average (Et): This step smooths the typical price over a specified number of bars (TCI Channel Length) using an exponential moving average (EMA). The smoothing factor alpha is derived from the channel length:
Et = alpha * Xt + (1 - alpha) * Et
Where alpha = 2 / (TCI Channel Length + 1).
Average Deviation (Dt): The average deviation measures how much the typical price deviates from the exponential average over time. This is also smoothed using the EMA:
Dt = alpha * abs(Et - Xt) + (1 - alpha) * Dt
Channel Index (CI): The Channel Index is calculated by normalizing the difference between the typical price and the exponential average by the average deviation:
CI = (Xt - Et) / (0.15 * Dt)
Trading Channel Index (TCI): Finally, the TCI is generated by applying additional smoothing to the Channel Index using another EMA over the specified number of bars (TCI Average Length). The smoothing factor beta is derived from the average length:
TCI = beta * CI + (1 - beta) * TCI
Indicator Variables:
TCI Channel Length:
- Description: This variable sets the number of historical bars used to calculate the Channel Index (CI). A shorter length results in a more sensitive CI that responds quickly to price changes, while a longer length produces a smoother and less volatile CI.
- Default Value: 21
TCI Average Length:
-Description: This variable determines the number of bars over which the Channel Index (CI) is smoothed to produce the TCI. A shorter length makes the TCI more responsive to recent price changes, whereas a longer length further smooths the TCI, reducing its sensitivity to short-term fluctuations.
-Default Value: 10
Usage:
Overbought and Oversold Conditions: The TCI often uses levels such as +100 and -100 to identify potential reversal points. When the TCI crosses above +100, it might indicate an overbought condition, signaling a potential sell. Conversely, when it crosses below -100, it could indicate an oversold condition, suggesting a potential buy.
Trend Identification: Sustained values above 0 typically indicate a bullish trend, while values below 0 suggest a bearish trend. The TCI's smoothness helps traders stay in trends longer by reducing the impact of short-term market noise.
Conclusion:
The Trading Channel Index (TCI) is a versatile and powerful tool for traders who wish to capture cyclical price movements with a reduced level of noise. By adjusting the TCI Channel Length and TCI Average Length, traders can tailor the indicator to suit different market conditions, making it applicable across various timeframes and asset classes.
Cari dalam skrip untuk "CCI"
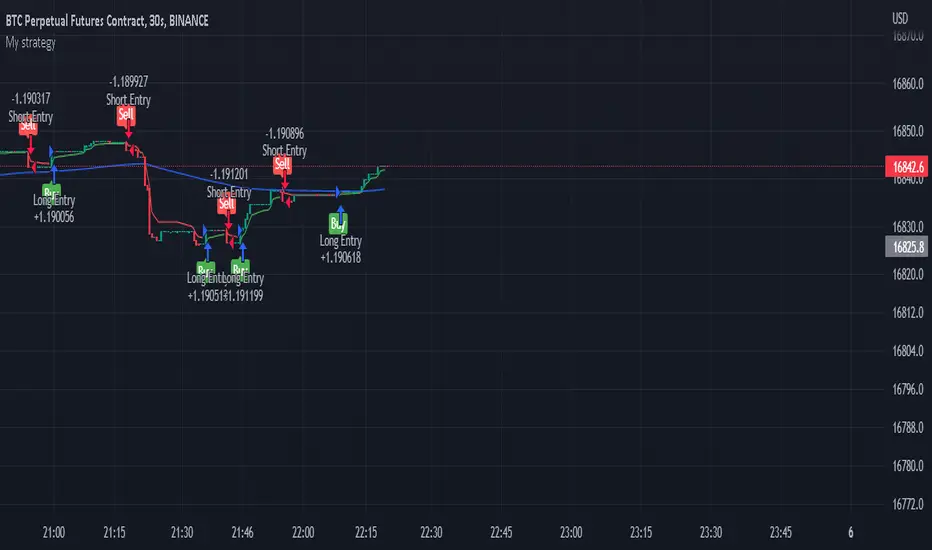
All Divergences with trend / SL - Uncle SamThanks to the main inspiration behind this strategy and the hard work of:
"Divergence for many indicators v4 by LonesomeTheBlue"
The "All Divergence" strategy is a versatile approach for identifying and acting upon various divergences in the market. Divergences occur when price and an indicator move in opposite directions, often signaling potential reversals. This strategy incorporates both regular and hidden divergences across multiple indicators (MACD, Stochastics, CCI, etc.) for a comprehensive analysis.
Key Features:
Comprehensive Divergence Analysis: The strategy scans for regular and hidden divergences across a variety of indicators, increasing the probability of identifying potential trade setups.
Trend Filter: To enhance accuracy, a moving average (MA) trend filter is integrated. This ensures trades align with the overall market trend, reducing the risk of false signals.
Customizable Risk Management: Users can adjust parameters for long/short stop-loss and take-profit levels to match their individual risk tolerance.
Additional Risk Management (Optional): An experimental MA-based risk management feature can be enabled to close positions if the market shows consecutive closes against the trend.
Clear Visuals: The script plots pivot points, divergence lines, and stop-loss levels on the chart for easy reference.
Strategy Settings (Defaults):
Enable Long/Short Strategy: True
Long/Short Stop Loss %: 2%
Long/Short Take Profit %: 5%
Enable MA Trend: True
MA Type: HMA (Hull Moving Average)
MA Length: 500
Use MA Risk Management: False (Experimental)
MA Risk Exit Candles: 2 (If enabled)
Pivot Period: 9
Source for Pivot Points: Close
Backtest Details (Example):
The strategy has been backtested on XAUUSD 1H (Goold/USD 1 hour timeframe) with a starting capital of $1,000. The backtest period covers around 2 years. A commission of 0.02% per trade and a 0.1% slippage per trade were factored in to simulate real-world trading costs.
Disclaimer:
This strategy is for educational and informational purposes only. Backtested results are not indicative of future performance. Use this strategy at your own risk. Always conduct your own analysis and consider consulting a financial professional before making any trading decisions.
Important Notes:
The default settings are a good starting point, but feel free to experiment to find optimal parameters for your specific trading style and market.
The MA-based risk management is an experimental feature. Use it with caution and thoroughly test it before deploying in live trading.
Backtest results can vary depending on the market, timeframe, and specific settings used. Always consider slippage and commission fees when evaluating a strategy's potential profitability.

Flush Percent RangeFans of Woodies CCI may recognize the approach to this one. This is my attempt at using the same methods but for taking the highs and lows into account without the standard deviation of the CCI. The smoothness of other oscillators may not be ideal however the Williams Percent Range is a fast stochastic that also operates within a channel. This provides an alternative yet still complex view for the virtuoso. A unique feature is total utilization of the weighted moving average, from the standard to the more complex. A fun fact is the Hull Moving Average is actually calculated using weighted moving averages.
How to use:
The base length is for accuracy, the fast length is for catching all the moves(even the wrong ones sometimes.)
The bars back option will not flip the histogram/base trend to its bullish/bearish alternative until the base plot remains on the latter half of the oscillator for a certain number of bars. This can be set to zero if desired.
The factor controls the chop on the various levels. A higher number will increase it.
The oscillator levels are measuring slope, price relative to the average, and a summation of percent changes between the two. Both the baseline/histogram and the levels have color coding for bullishness, bearishness, and indecision(depending on the factor.) The fast line matches the indecision color by default. This is all customizable.
There are many potential ways to trade with this indicator. From hooks back toward the trend and range line crossovers to divergence and reversals. It's important to note the current performance of the oscillator levels. Time cycles may come in handy along with other forecasting tools.
Lastly, there are optional linear regression lines plotted on the chart. They're synchronized to the lengths in the oscillator. This is an additional visual aid to provide context to the direction of the channel.
Overall the Flush Percent Range is for analyzing multiple regression models within a single price channel. No smoothing, fast averages, and specified timeframes of highs/lows. Credit to Larry Williams for the original calculation and Ken Woods for design/methodology inspiration.

Market Sentiment Technicals [LuxAlgo]The Market Sentiment Technicals indicator synthesizes insights from diverse technical analysis techniques, including price action market structures, trend indicators, volatility indicators, momentum oscillators, and more.
The indicator consolidates the evaluated outputs from these techniques into a singular value and presents the combined data through an oscillator format, technical rating, and a histogram panel featuring the sentiment of each component alongside the overall sentiment.
🔶 USAGE
The Market Sentiment Technicals indicator is a tool able to swiftly and easily gauge market sentiment by consolidating the individual sentiment from multiple technical analysis techniques applied to market data into a single value, allowing users to asses if the market is uptrending, consolidating, or downtrending.
The tool includes various components and presentation formats, each described in the sub-sections below.
🔹Indicators Sentiment Panel
The indicators sentiment panel provides normalized sentiment scores for each supported indicator, along with a synthesized representation derived from the average of all individual normalized sentiments.
🔹Market Sentiment Meter
The market sentiment meter is obtained from the synthesized representation derived from the average of all individual normalized sentiments. It allows users to quickly and easily gauge the overall market sentiment.
🔹Market Sentiment Oscillator
The market sentiment oscillator provides a visual means to monitor the current and historical strength of the market. It assists in identifying the trend direction, trend momentum, and overbought and oversold conditions, aiding in the anticipation of potential trend reversals.
Divergence occurs when there is a difference between what the price action is indicating and what the market sentiment oscillator is indicating, helping traders assess changes in the price trend.
🔶 DETAILS
The indicator employs a range of technical analysis techniques to interpret market data. Each group of indicators provides valuable insights into different aspects of market behavior.
🔹Momentum Indicators
Momentum indicators assess the speed and change of price movements, often indicating whether a trend is strengthening or weakening.
Relative Strength Index (RSI): Measures the magnitude of recent price changes to evaluate overbought or oversold conditions.
Stochastic %K: Compares the closing price to the range over a specified period to identify potential reversal points.
Stochastic RSI Fast: Combines features of Stochastic oscillators and RSI to gauge both momentum and overbought/oversold levels efficiently.
Commodity Channel Index (CCI): Measures the deviation of an asset's price from its statistical average to determine trend strength and overbought and oversold conditions.
Bull Bear Power: Evaluates the strength of buying and selling pressure in the market.
🔹Trend Indicators
Trend indicators help traders identify the direction of a market trend.
Moving Averages: Provides a smoothed representation of the underlying price data, aiding in trend identification and analysis.
Bollinger Bands: Consists of a middle band (typically a simple moving average) and upper and lower bands, which represent volatility levels of the market.
Supertrend: A trailing stop able to identify the current direction of the trend.
Linear Regression: Fits a straight line to past data points to predict future price movements and identify trend direction.
🔹Market Structures
Market Structures: Analyzes the overall pattern of price movements, including Break of Structure (BOS), Market Structure Shifts (MSS), also referred to as Change of Character (CHoCH), aiding in identifying potential market turning and continuation points.
🔹The Normalization Technique
The normalization technique employed for trend indicators relies on buy-sell signals. The script tracks price movements and normalizes them based on these signals.
normalize(buy, sell, smooth)=>
var os = 0
var float max = na
var float min = na
os := buy ? 1 : sell ? -1 : os
max := os > os ? close : os < os ? max : math.max(close, max)
min := os < os ? close : os > os ? min : math.min(close, min)
ta.sma((close - min)/(max - min), smooth) * 100
In this Pine Script snippet:
The variable os tracks market sentiment, taking a value of 1 for buy signals and -1 for sell signals, indicating bullish and bearish sentiments, respectively.
max and min are used to identify extremes in sentiment and are updated based on changes in os . When market sentiment shifts from buying to selling (or vice versa), max and min adjust accordingly.
Normalization is achieved by comparing current price levels to historical extremes in sentiment. The result is smoothed by default using a 3-period simple moving average. Users have the option to customize the smoothing period via the script settings input menu.
🔶 SETTINGS
🔹Generic Settings
Timeframe: This option selects the timeframe for calculating sentiment. If a timeframe lower than the chart's is chosen, calculations will be based on the chart's timeframe.
Horizontal Offset: Determines the distance at which the visual components of the indicator will be displayed from the primary chart.
Gradient Colors: Allows customization of gradient colors.
🔹Indicators Sentiment Panel
Indicators Sentiment Panel: Toggle the visibility of the indicators sentiment panel.
Panel Height: Determines the height of the panel.
🔹Market Sentiment Meter
Market Sentiment Meter: Toggle the visibility of the market sentiment meter (technical ratings in the shape of a speedometer).
🔹Market Sentiment Oscillator
Market Sentiment Oscillator: Toggle the visibility of the market sentiment oscillator.
Show Divergence: Enables detection of divergences based on the selected option.
Oscillator Line Width: Customization option for the line width.
Oscillator Height: Determines the height of the oscillator.
🔹Settings for Individual Components
In general,
Source: Determines the data source for calculations.
Length: The period to be used in calculations.
Smoothing: Degree of smoothness of the evaluated values.
🔹Normalization Settings - Trend Indicators
Smoothing: The period used in smoothing normalized values, where normalization is applied to moving averages, Bollinger Bands, Supertrend, VWAP bands, and market structures.
🔶 LIMITATIONS
Like any technical analysis tool, the Market Sentiment Technicals indicator has limitations. It's based on historical data and patterns, which may not always accurately predict future market movements. Additionally, market sentiment can be influenced by various factors, including economic news, geopolitical events, and market psychology, which may not be fully captured by technical analysis alone.

RSI-HeatmapThis unique indicator is a comprehensive tool designed for traders seeking to gain an edge in the market. It consists of three main components: a revised RSI, a dynamic heatmap, and an integrated alert system.
1.Modified RSI:
Unlike the traditional RSI that calculates delta as the difference between the current price and the previous price (Δ = {price} - {previous price}), this version computes delta by comparing the current price with the price n periods ago (Δ = {price} - {n-th previous price}). This delta is then smoothed using a Volume Weighted Moving Average (VWMA) with a short length to preserve the RSI's core characteristics while adapting it to capture longer-term momentum shifts more effectively.
2.Heatmap:
The heatmap feature introduces a novel approach to visualize market conditions, with 5 high levels and 5 low levels identified around the current price. When the price crosses these thresholds, the RSI-based heatmap changes colors, ranging from blue (indicative of oversold conditions) to red (signaling overbought conditions). This visual tool helps traders quickly gauge the strength and potential reversal points in the market.
3.Alert:
The Alert system employs MACD (Moving Average Convergence Divergence) and CCI (Commodity Channel Index) indicators to signal potential buy or sell opportunities. It categorizes alerts into four color-coded recommendations:
Green and Lighter Green: Strong buy signal, suggesting favorable conditions for entering buy positions.
Blue and Lighter Blue: Moderate buy signal, indicating less robust but potentially profitable buy conditions.
Red and Lighter Red: Strong sell signal, advising traders to consider taking sell positions.
Orange and Lighter Orange: Moderate sell signal, hinting at sell conditions that are not as compelling as those indicated by red.

Targets For Many Indicators [LuxAlgo]The Targets For Many Indicators is a useful utility tool able to display targets for many built-in indicators as well as external indicators. Targets can be set for specific user-set conditions between two series of values, with the script being able to display targets for two different user-set conditions.
Alerts are included for the occurrence of a new target as well as for reached targets.
🔶 USAGE
Targets can help users determine the price limit where the price might start deviating from an indication given by one or multiple indicators. In the context of trading, targets can help secure profits/reduce losses of a trade, as such this tool can be useful to evaluate/determine user take profits/stop losses.
Due to these essentially being horizontal levels, they can also serve as potential support/resistances, with breakouts potentially confirming new trends.
In the above example, we set targets 3 ATR's away from the closing price when the price crosses over the script built-in SuperTrend indicator using ATR period 10 and factor 3. Using "Long Position Target" allows setting a target above the price, disabling this setting will place targets below the price.
Users might be interested in obtaining new targets once one is reached, this can be done by enabling "New Target When Reached" in the target logic setting section, resulting in more frequent targets.
Lastly, users can restrict new target creation until current ones are reached. This can result in fewer and longer-term targets, with a higher reach rate.
🔹 Dashboard
A dashboard is displayed on the top right of the chart, displaying the amount, reach rate of targets 1/2, and total amount.
This dashboard can be useful to evaluate the selected target distances relative to the selected conditions, with a higher reach rate suggesting the distance of the targets from the price allows them to be reached.
🔶 DETAILS
🔹 Indicators
Besides 'External' sources, each source can be set at 1 of the following Build-In Indicators :
ACCDIST : Accumulation/distribution index
ATR : Average True Range
BB (Middle, Upper or Lower): Bollinger Bands
CCI : Commodity Channel Index
CMO : Chande Momentum Oscillator
COG : Center Of Gravity
DC (High, Mid or Low): Donchian Channels
DEMA : Double Exponential Moving Average
EMA : Exponentially weighted Moving Average
HMA : Hull Moving Average
III : Intraday Intensity Index
KC (Middle, Upper or Lower): Keltner Channels
LINREG : Linear regression curve
MACD (macd, signal or histogram): Moving Average Convergence/Divergence
MEDIAN : median of the series
MFI : Money Flow Index
MODE : the mode of the series
MOM : Momentum
NVI : Negative Volume Index
OBV : On Balance Volume
PVI : Positive Volume Index
PVT : Price-Volume Trend
RMA : Relative Moving Average
ROC : Rate Of Change
RSI : Relative Strength Index
SMA : Simple Moving Average
STOCH : Stochastic
Supertrend
TEMA : Triple EMA or Triple Exponential Moving Average
VWAP : Volume Weighted Average Price
VWMA : Volume-Weighted Moving Average
WAD : Williams Accumulation/Distribution
WMA : Weighted Moving Average
WVAD : Williams Variable Accumulation/Distribution
%R : Williams %R
Each indicator is provided with a link to the Reference Manual or to the Build-In Indicators page.
The latter contains more information about each indicator.
Note that when "Show Source Values" is enabled, only values that can be logically found around the price will be shown. For example, Supertrend , SMA , EMA , BB , ... will be made visible. Values like RSI , OBV , %R , ... will not be visible since they will deviate too much from the price.
🔹 Interaction with settings
This publication contains input fields, where you can enter the necessary inputs per indicator.
Some indicators need only 1 value, others 2 or 3.
When several input values are needed, you need to separate them with a comma.
You can use 0 to 4 spaces between without a problem. Even an extra comma doesn't give issues.
The red colored help text will guide you further along (Only when Target is enabled)
Some examples that work without issues:
Some examples that work with issues:
As mentioned, the errors won't be visible when the concerning target is disabled
🔶 SETTINGS
Show Target Labels: Display target labels on the chart.
Candle Coloring: Apply candle coloring based on the most recent active target.
Target 1 and Target 2 use the same settings below:
Enable Target: Display the targets on the chart.
Long Position Target: Display targets above the price a user selected condition is true. If disabled will display the targets below the price.
New Target Condition: Conditional operator used to compare "Source A" and "Source B", options include CrossOver, CrossUnder, Cross, and Equal.
🔹 Sources
Source A: Source A input series, can be an indicator or external source.
External: External source if 'External" is selected in "Source A".
Settings: Settings of the selected indicator in "Source A", entered settings of indicators requiring multiple ones must be comma separated, for example, "10, 3".
Source B: Source B input series, can be an indicator or external source.
External: External source if 'External" is selected in "Source B".
Settings: Settings of the selected indicator in "Source B", entered settings of indicators requiring multiple ones must be comma separated, for example, "10, 3".
Source B Value: User-defined numerical value if "value" is selected in "Source B".
Show Source Values: Display "Source A" and "Source B" on the chart.
🔹 Logic
Wait Until Reached: When enabled will not create a new target until an existing one is reached.
New Target When Reached: Will create a new target when an existing one is reached.
Evaluate Wicks: Will use high/low prices to determine if a target is reached. Unselecting this setting will use the closing price.
Target Distance From Price: Controls the distance of a target from the price. Can be determined in currencies/points, percentages, ATR multiples, ticks, or using multiple of external values.
External Distance Value: External distance value when "External Value" is selected in "Target Distance From Price".

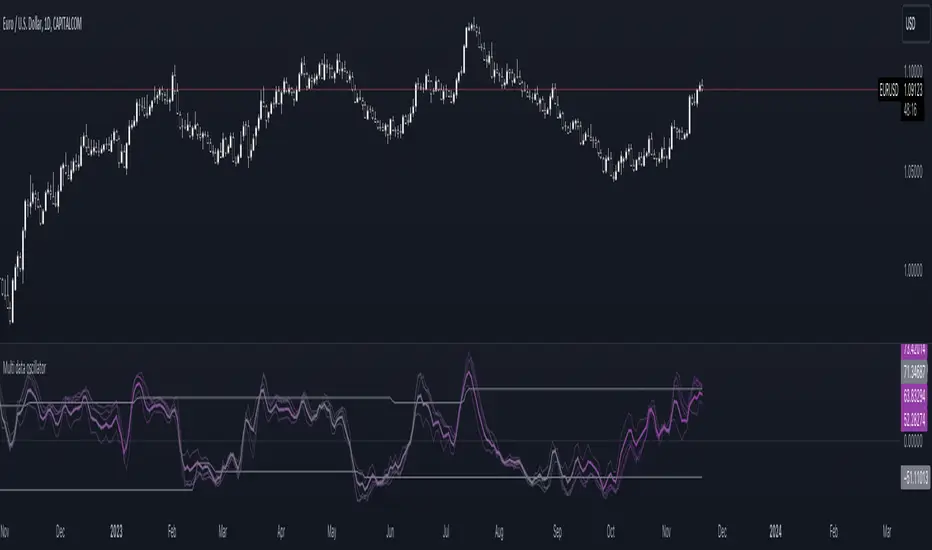
Multi-data oscillatorThe multi-data oscillator is a tool created to help traders visualize clearly how an oscillator works and moves considering different input parameters.
In this tool, you can choose to visualize the script as the RSI, the CCI, the LOC indicator, a custom-created formula that simply shows the location of the data considering X past values, or the average of all of these three indicators.
In the settings, you can choose both the length of the indicator and the smoothing factor.
Additionally, the indicator has a gradient color that changes considering the deviation and the variance of the different lines used to calculate the average line, displayed with more thickness.
Oscillator Volume Profile [Trendoscope®]The Oscillator Volume Profile indicator is designed to construct a volume profile based on predefined oscillator levels. It integrates volume data with oscillator readings to offer a unique perspective on market dynamics.
🎲 Selectable Oscillators:
Users can select from an array of oscillator options for the basis of the volume profile, including:
Relative Strength Index (RSI)
Chande Momentum Oscillator (CMO)
Center of Gravity (COG)
Money Flow Index (MFI)
Rate of Change (ROC)
Commodity Channel Index (CCI)
Stochastic Oscillator (Stoch)
True Strength Index (TSI)
Williams %R (WPR)
The length parameters - Length, Fast Length, Slow Length allows users to define the period over which the chosen oscillator is calculated, tailoring the sensitivity of the indicator to their trading strategy.
🎲 Dynamic Overbought/Oversold Ranges:
This indicator enhances traditional concepts by introducing dynamic overbought and oversold levels. These adaptable thresholds are calculated using various methods, including:
🎯 Highest/Lowest Range Method : This method establishes the range based on the highest and lowest values of the oscillator within the last N bars.
🎯 Moving Average Range Method : The range is derived from a moving average of the oscillator, providing a smoothed threshold that reflects more recent market conditions.
In addition to these methods, the indicator incorporates a unique 'Sticky Border' feature:
🎯 Sticky Border: With this option enabled, the dynamic ranges maintain their levels until the oscillator breaks out of the range. Once a breakout occurs, the levels are recalculated and updated. This mechanism ensures that the borders remain consistent and relevant, only adjusting to significant market movements that warrant a recalculation.
Users can select their preferred method for determining dynamic ranges, allowing for a customized approach that aligns with their analysis and trading strategy. The sticky border feature further refines this functionality, offering continuity until a decisive market move occurs.
🎲 Volume Profile Calculation Parameters:
🎯 Trend Filter: The indicator provides a versatile trend filter with four selectable options:
Uptrend: The volume profile is calculated when the oscillator indicates an uptrend.
Downtrend: The volume profile is calculated when the oscillator indicates a downtrend.
Any: The volume profile is calculated regardless of the trend.
External: Users can input values from an external indicator. The volume profile is then calculated only when the external indicator's value is non-zero, integrating external analysis into the volume profile construction.
🎯 Precision: Users have the option to define the precision for calculating the volume profile, which is crucial due to the varying scales of different oscillators (e.g., some oscillators range from 0 to 100, while others from -1 to 1). Selecting an appropriate precision ensures that the volume profile is accurately aligned with the minimal price range significant to the chosen oscillator. This setting requires user intervention for optimal configuration, as automatic calculation is not feasible due to the diverse nature of oscillator ranges.
🎯 Number of Bars: Users can select a specific number of bars for volume profile calculation, or opt to include all available historical bars for a comprehensive profile.
🎲 Selecting the right precision:
Users must select the right precision based on their choice of indicator. For example, RSI values range from 0-100. Hence, the default precision of 1 work fine on RSI as the volume profiles are plotted from 0 to 100 at the interval of 0.1
But, the default precision of 1 will not be ok on TSI because TSI values range from -1 to 1. Hence, using 1 as precision will result in very less volume profile lines as shown below.
Due to this, it is necessary to increase the precision for oscillators such as TSI where the range between highest and lowest value is far less. Once we set the precision to 2, we can see more appropriate volume profile division.
🎲 Note of thanks:
This publication uses polyline feature for drawing volume profiles. The advantage of using polyline is that we can overcome max 500 lines issue that we face by using the regular line objects. More details of polyline can be found in the tradingview blog post
Further, using polyline for display of volume profiles is inspired by the publications of fikira and KioseffTrading

Auto Fibo on IndicatorsThis drawing tool aims to draw auto Fibonacci Retracement Levels on desired indicators.
Users can define the target indicator to draw Auto Fibo Lines, from the "settings tab":
There are six commonly used indicators below the charts that can be selected to draw Fibonacci Retracement lines on:
RSI : Relative Strength Index
CCI : Commodity Channel Index
MFI : Money Flow Index
STOCHASTIC : Stochastic Oscillator
CMF : Chaikin Money Flow
CMO : Chande Momentum Oscillator
Fibonacci Retracement Levels will appear automatically after applying the indicator.
The "Auto Fibo on Indicators" tool looks back. It checks the indicator levels for a desired number of bars and then draws the Fibonacci Levels automatically in the right way, considering the final movements of the indicator.
There are five commonly used Fibonacci Levels added between the Highest and Lowest values such as:
%23.6
%38.2
%50 (Not precisely a Fibonacci Level, indeed)
%61.8 (Golden Ratio)
%78.6
Four extra levels can be added from the settings tab by checking their boxes:
%127.2 (adjustable level)
%161.8
%261.8
%361.8
Default lookback bars of Auto Fibo Levels: 144 (which is also a Fibonacci number)
Default Indicator: RSI
Default Indicator length: 14
Default data source: CLOSE
Users can also define and show overbought and oversold levels by unchecking the "Do not Show Indicator Overbought / Oversold Levels?" button from the settings menu.
In technical analysis, Fibonacci Levels on price can guide valuable trading signals for investors.
Levels can be significant support and resistance levels for breakouts and turning points.
This drawing tool aims to follow those necessary levels on indicators to observe critical levels and breakouts.

Divergences RefurbishedJust as "a butterfly can flap its wings over a flower in China and cause a hurricane in the Caribbean" (Edward Lorenz), small divergences in markets can signal big trading opportunities.
█Introduction
This is a script forked from LonesomeTheBlue's Divergence for Many Indicators v4.
It is a script that checks for divergence between price and many indicators.
In this version, I added more indicators and also added 40 symbols to check for divergences.
More info on the original script can be found here:
█ Improvements
The following improvements have been implemented over v4:
1. Added parameters to customize indicators.
2. Added new indicators:
- Stoch RSI
- Volume Oscillator
- PVT (Price Volume Trend)
- Ultimate Oscillator
- Fisher Transform
- Z-Score/T-Score
3. Now there is the possibility of using 2 external indicators.
4. New option to show tooltips inside labels.
This allows you to save space on the screen if you choose the option to only show the number of divergences or just the abbreviations.
5. New option to show additional text next to the indicator name.
This allows for grouping of indicators and symbols and better visualization, whether through emojis, for example.
6. Added 40 customizable symbols to check for divergences.
7. Option "show only the first letter" of the indicator replaced by: "show the abbreviation of the indicator".
Reason: the indicator abbreviation is more informative and easier to read.
8. Script converted to PineScript version 5.
█ CONCEPTS
Below I present a brief description of the available indicators.
1. Moving Average Convergence/Divergence (MACD):
Shows the difference between short-term and long-term exponential moving averages.
2. MACD Histogram:
Shows the difference between MACD and its signal line.
3. Relative Strength Index (RSI):
Measures the relative strength of recent price gains to recent price losses of an asset.
4. Stochastic Oscillator (Stoch):
Compares the current price of an asset to its price range over a specified time period.
5. Stoch RSI:
Stochastic of RSI.
6. Commodity Channel Index (CCI):
Measures the relationship between an asset's current price and its moving average.
7. Momentum: Shows the difference between the current price and the price a few periods ago.
Shows the difference between the current price and the price of a certain period in the past.
8. Chaikin Money Flow (CMF):
A variation of A/D that takes into account the daily price variation and weighs trading volume accordingly. Accumulation/Distribution (A/D) identifies buying and selling pressure by tracking the flow of money into and out of an asset based on volume patterns.
9. On-Balance Volume (OBV):
Identify divergences between trading volume and an asset's price.
Sum of trading volume when the price rises and subtracts volume when the price falls.
10. Money Flow Index (MFI):
Measures volume pressure in a range of 0 to 100.
Calculates the ratio of volume when the price goes up and when the price goes down.
11. Volume Oscillator (VO):
Identify divergences between trading volume and an asset's price. Ratio of change of volume, from a fast period in relation to a long period.
12. Price-Volume Trend (PVT):
Identify the strength of an asset's price trend based on its trading volume. Cumulative change in price with volume factor. The PVT calculation is similar to the OBV calculation, but it takes into account the percentage price change multiplied by the current volume, plus the previous PVT value.
13. Ultimate Oscillator (UO):
Combines three different time periods to help identify possible reversal points.
14. Fisher Transform (FT):
Normalize prices into a Gaussian normal distribution.
15. Z-Score/T-Score: Shows the difference between the current price and the price a few periods ago. I is a statistical measurement that indicates how many standard deviations a data point is from the mean of a data set.
When to use t-score instead of z-score? When the sample size is small (length < 30).
Here, the use of z-score or t-score is chosen automatically based on the length parameter.
█ What to look for
The operation is simple. The script checks for divergences between the price and the selected indicators.
Now with the possibility of using multiple symbols, it is possible to check divergences between different assets.
A well-described view on divergences can be found in this cheat sheet:
◈ Examples with SPY ETF versus indicators:
1. Regular bullish divergence with external indicator:
1. Regular bearish divergence with Fisher Transform:
1. Positive hidden divergence with Momentum indicator:
1. Negative hidden divergence with RSI:
◈ Examples with SPY ETF versus other symbols:
1. Regular bearish divergence with European Stoch Market:
2. Regular bearish divergence with DXY inverted:
3. Regular bullish divergence with Taiwan Dollar:
4. Regular bearish divergence with US10Y (10-Year US Treasury Note):
5. Regular bullish divergence with QQQ ETF (Nasdaq 100):
6. Regular bullish divergence with ARKK ETF (ARK Innovation):
7.Positive hidden divergence with RSP ETF (S&P 500 Equal Weight):
8. Negative hidden divergence with EWZ ETF (Brazil):
◈ Examples with BTCUSD versus other symbols:
1. Regular bearish divergence with BTCUSDLONGS from Bitfinex:
2. Regular bearish divergence with BLOK ETF (Amplify Transformational Data Sharing):
3. Negative hidden divergence with NATGAS (Natural Gas):
4. Positive hidden divergence with TOTALDEFI (Total DeFi Market Cap):
█ Conclusion
The symbols available to check divergences were chosen in such a way as to cover the main markets, in the most generic way possible.
You can adjust them according to your needs.
A trader in the American market, for example, could add more ETFs, American stocks, and sectoral indices, such as the XLF (Financial Select Sector SPDR Fund), the XLK (Technology Select Sector SPDR), etc.
On the other hand, a cryptocurrency trader could add more currency pairs and sector indicators, such as BTCUSDSHORTS (Bitfinex), USDT.D (Tether Dominance), etc.
If the chart becomes too cluttered, you can use the option to show only the number of divergences or only the indicator abbreviations.
Or even disable certain indicators and symbols, if they are not of interest to you.
I hope this script is useful.
Don't forget to support LonesomeTheBlue's work too.

DIY Custom Strategy Builder [ZP] - v1DISCLAIMER:
This indicator as my first ever Tradingview indicator, has been developed for my personal trading analysis, consolidating various powerful indicators that I frequently use. A number of the embedded indicators within this tool are the creations of esteemed Pine Script developers from the TradingView community. In recognition of their contributions, the names of these developers will be prominently displayed alongside the respective indicator names. My selection of these indicators is rooted in my own experience and reflects those that have proven most effective for me. Please note that the past performance of any trading system or methodology is not necessarily indicative of future results. Always conduct your own research and due diligence before using any indicator or tool.
===========================================================================
Introducing the ultimate all-in-one DIY strategy builder indicator, With over 30+ famous indicators (some with custom configuration/settings) indicators included, you now have the power to mix and match to create your own custom strategy for shorter time or longer time frames depending on your trading style. Say goodbye to cluttered charts and manual/visual confirmation of multiple indicators and hello to endless possibilities with this indicator.
What it does
==================
This indicator basically help users to do 2 things:
1) Strategy Builder
With more than 30 indicators available, you can select any combination you prefer and the indicator will generate buy and sell signals accordingly. Alternative to the time-consuming process of manually confirming signals from multiple indicators! This indicator streamlines the process by automatically printing buy and sell signals based on your chosen combination of indicators. No more staring at the screen for hours on end, simply set up alerts and let the indicator do the work for you.
Available indicators that you can choose to build your strategy, are coded to seamlessly print the BUY and SELL signal upon confirmation of all selected indicators:
EMA Filter
2 EMA Cross
3 EMA Cross
Range Filter (Guikroth)
SuperTrend
Ichimoku Cloud
SuperIchi (LuxAlgo)
B-Xtrender (QuantTherapy)
Bull Bear Power Trend (Dreadblitz)
VWAP
BB Oscillator (Veryfid)
Trend Meter (Lij_MC)
Chandelier Exit (Everget)
CCI
Awesome Oscillator
DMI ( Adx )
Parabolic SAR
Waddah Attar Explosion (Shayankm)
Volatility Oscillator (Veryfid)
Damiani Volatility ( DV ) (RichardoSantos)
Stochastic
RSI
MACD
SSL Channel (ErwinBeckers)
Schaff Trend Cycle ( STC ) (LazyBear)
Chaikin Money Flow
Volume
Wolfpack Id (Darrellfischer1)
QQE Mod (Mihkhel00)
Hull Suite (Insilico)
Vortex Indicator
2) Overlay Indicators
Access the full potential of this indicator using the SWITCH BOARD section! Here, you have the ability to turn on and plot up to 14 of the included indicators on your chart. Simply select from the following options:
EMA
Support/Resistance (HeWhoMustNotBeNamed)
Supply/ Demand Zone ( SMC ) (Pmgjiv)
Parabolic SAR
Ichimoku Cloud
Superichi (LuxAlgo)
SuperTrend
Range Filter (Guikroth)
Average True Range (ATR)
VWAP
Schaff Trend Cycle ( STC ) (LazyBear)
PVSRA (TradersReality)
Liquidity Zone/Vector Candle Zone (TradersReality)
Market Sessions (Aurocks_AIF)
How it does it
==================
To explain how this indictor generate signal or does what it does, its best to put in points.
I have coded the strategy for each of the indicator, for some of the indicator you will see the option to choose strategy variation, these variants are either famous among the traders or its the ones I found more accurate based on my usage. By coding the strategy I will have the BUY and SELL signal generated by each indicator in the backend.
Next, the indicator will identify your selected LEADING INDICATOR and the CONFIRMATION INDICATOR(s).
On each candle close, the indicator will check if the selected LEADING INDICATOR generates signal (long or short).
Once the leading indicator generates the signal, then the indicator will scan each of the selected CONFIRMATION INDICATORS on candle close to check if any of the CONFIRMATION INDICATOR generated signal (long or short).
Until this point, all the process is happening in the backend, the indicator will print LONG or SHORT signal on the chart ONLY if LEADING INDICATOR and all the selected CONFIRMATION INDICATORS generates signal on candle close. example for long signal, the LEADING INDICATOR and all selected CONFIRMATION INDICATORS must print long signal.
The dashboard table will show your selected LEADING and CONFIRMATION INDICATORS and if LEADING or the CONFIRMATION INDICATORS have generated signal. Signal generated by LEADING and CONFIRMATION indicator whether long or short, is indicated by tick icon ✔. and if any of the selected CONFIRMATION or LEADING indicator does not generate signal on candle close, it will be indicated with cross symbol ✖.
how to use this indicator
==============================
Using the indicator is pretty simple, but it depends on your goal, whether you want to use it for overlaying the available indicators or using it to build your strategy or for both.
To use for Building your strategy: Select your LEADING INDICATOR, and then select your CONFIRMATION INDICATOR(s). if on candle close all the indicators generate signal, then this indicator will print SHORT or LONG signal on the chart for your entry. There are plenty of indicators you can use to build your strategy, some indicators are best for longer time frame setups while others are responsive indicators that are best for short time frame.
To use for overlaying the indicators: Open the setting of this indicator and scroll to the SWITCHBOARD section, from there you can select which indicator you want to plot on the chart.
For each of the listed indicators, you have the flexibility to customize the settings and configurations to suit your preferences. simply open indicator setting and scroll down, you will find configuration for each of the indicators used.
I will also release the Strategy Backtester for this indicator soon.

Multiple Percentile Ranks (up to 5 sources at a time)This indicator is a visual percentile rank indicator that can display 1 to 5 sources at one time.
The options:
“Sources”
Choose the number of sources you would like to display. The minimum is 1, the maximum is 5.
“Label percent position”
The label for the current percentage of where the source candle ranks.
“Label position”
This displays the source/s you’ve selected, and the chosen bottom rank % and top rank %.
“Label text size”
Displays the text size of all labels.
“Display current % labels”
Switches the labels on/off only for the current percentage rank of each source.
Source options:
ATR: Average True Range
CCI: Commodity Channel Index
COG: Centre of Gravity
Close: closing price
Close Percent: close percentage from previous close
Dollar Value: volume * (high * low * close / 3)
EOM: Ease of Movement: how much volume it takes to move the price in a certain direction
OBV: On-Balance Volume
RANGE: percentage range of the close price
RSI: Relative Strength Index
RVI: Relative Vigor Index
Time Close: if you select the 1 second timeframe it will provide the gap of time between each 1 second close
Volume: each bar’s volume
Volume (MA): volume moving average
Source # where # is the number of the source. Selects the source you’d like.
Ma Length is the number of previous candles to consider when calculating the moving average of the source. Note, the “MA Length” only applies to sources that have the “(MA)” at the end of their name.
Bottom % is the bottom percentage rank of the source you’ve selected. This is a filter to display the candle line graph in red once the percentage rank is equal to the percentage you’ve chosen or below.
Top % is the top percentage rank of the source you’ve selected. This is a filter to display the candle line graph in green once the percentage rank is equal to the percentage you’ve chosen or higher.
A simple example of how to use the indicator:
Select the dropdown menu for source 1 and select volume.
As the candles populate, it will look at previous candles and assign a percentage rank of where the candles are in relation to previous candles.
*Note, the way Tradingview works is it will populate the first candle the chart was active, and continue on. So, let’s say the 3rd candle was the highest volume day. This candle will show up as 100%. If the next day, the 4th candle has an even higher volume, it will show up as 100% also, the previous candles won’t “repaint” to other values and are instead set based on when they were confirmed. So, this indicator works best when there are a lot of previous candles to compare itself to.
To use the bottom % rank filter enter a percentage such as 5%. As it comes across a candle that is 5% or less compared to previous volume candles, then the line graph will shade in red.
The same can be said for the top % rank. So, if you want to see the line graph change to green when it comes across the top 99th percentile rank of volume bars, then set the top % rank to 1% and it will give you extremely high-volume bars in green instead of blue.

Swing Point Oscillator with Trend Filter [Quantigenics]The "Swing Point Oscillator with Trend Filter" is a sophisticated trading oscillator designed to enhance trading decisions by adapting to market conditions. Oscillators typically signal overbought/oversold market states, often yielding false signals in strong trends. This trend indicator addresses this by implementing a 'Trend Filter' which changes color in strong trends, alerting traders to avoid typical oscillator reversals. In strong trends (when the trend Filter is red), mid-high or mid-low levels can be used for pullback entries. In more neutral markets (when the trend Filter is close to blue), extreme high and low levels (top and bottom) can be used, as a true 'over bought / over sold' oscillator. The oscillator combines components of the Stochastic Oscillator and the CCI, then normalizes the result, providing a unique, adaptive signal. The color-coded lines and Trend Filter offer clear visual cues, making this a comprehensive tool for various market scenarios.
Caution: Always use the indicator in conjunction with other tools and analysis methods to confirm trading decisions. Avoid trading solely based on this indicator.
GOLD 4HR
CL1! 4HR
How to Use:
Swing Point Oscillator: Displays the momentum of the price relative to its recent high and low.
Trend Filter: Highlights the general direction of the market trend.
Zones: Visual representation to categorize oscillator values (Up Zone and Down Zone).
Interpretation:
Oscillator:
When the oscillator moves upward and approaches or enters the Up Zone, it indicates increasing bullish momentum.
When the oscillator moves downward and approaches or enters the Down Zone, it suggests increasing bearish momentum.
Values near the middle (around zero) often indicate indecision or consolidation in the market.
Trend Filter:
A trend filter line above the Mid-High or below the Mid-Low suggests a strong trend.
When the trend filter is between the Mid-High and Mid-Low, it might indicate a weaker or sideways trend.
Its color will change based on its position relative to the zones. For instance, it turns red when indicating a stronger trend.
Zones:
Up Zone: The area between the Top Line and the Mid-High. Indicates strong bullish momentum when the oscillator is within this zone.
Down Zone: The area between the Mid-Low and the Bottom Line. Indicates strong bearish momentum when the oscillator is in this zone.
Trading Tips:
Bullish Scenario: Consider long positions when the oscillator is rising, and the trend filter indicates a strong upward trend.
Bearish Scenario: Consider short positions when the oscillator is falling, and the trend filter indicates a strong downward trend.

Relative Strength Volume ComparisonThe Relative Strength Volume Comparison is a powerful tool that can help traders identify the current trend based on volume pressure and potential reversals.
This oscillator is made of two lines and the overbought and oversold levels. Each of these two lines is a relative-strength formula that contains both the famous RSI and CCI formulas, smoothed by a Hull moving average.
The two lines are different for input. The colored line is based just on price and changes color based on the relation with the other line. The second line uses as input an average of three different popular volume indicators: The OBV, the Accumulation/Distribution, and the PVT.
Thanks to this tool, which uses 6 different formulas combined, traders can:
- Identify the current trend direction, based on the color of the area fill and the first colored line
- Identify potential reversal areas thanks to the overbought and oversold levels, customizable in the input section alongside the length and smoothing parameters.

EMA Power BandsHello!
Today, I am delighted to introduce you to the "EMA Power Bands" indicator, designed to assist in identifying buying and selling points for assets moving in the markets.
Key Features of the Indicator:
EMA Bands: "EMA Power Bands" utilizes Exponential Moving Average (EMA) to create trend lines. These bands automatically expand or contract based on the price trend, adapting to market conditions.
ATR-Based Volatility: The indicator measures price volatility using the Average True Range (ATR) indicator, adjusting the width of the EMA bands accordingly. As a result, wider bands form during periods of increased volatility, while they narrow during lower volatility.
RSI-Based Buy-Sell Signals: "EMA Power Bands" uses the Relative Strength Index (RSI) to identify overbought and oversold zones. Entering the overbought zone generates a sell signal, while entering the oversold zone produces a buy signal.
Trend Direction Identification: The indicator assists in determining the price trend direction by analyzing the slope of the EMA bands. This allows you to identify periods of uptrends and downtrends.
Visualization of Buy-Sell Signals: "EMA Power Bands" visually marks the buy and sell signals:
- When RSI enters the overbought zone, it displays a sell signal (🪫).
- When RSI enters the oversold zone, it indicates a buy signal (🔋).
- When a candle closes above the emaup line, it displays a bearish signal (🔨).
- When a candle closes below the emadw line, it indicates a bullish signal (🚀).
By using the "EMA Power Bands" (EMA Güç Bantları) indicator, especially in trend-following strategies and periods of volatility, you can make more informed and disciplined trading decisions. However, I recommend using it in conjunction with other technical analysis tools and fundamental data.
*You can also use it with CCI as an example.
With this indicator, you can identify potential trend reversals in advance and strengthen your risk management strategies.
So, go ahead and try the "EMA Power Bands" (EMA Güç Bantları) indicator to enhance your technical analysis skills and make more informed trading decisions!

Ultimate Balance StrategyThe Ultimate Balance Oscillator Strategy harnesses the power of the Ultimate Balance Oscillator to deliver a comprehensive and disciplined approach to trading. By combining the insights of the Rate of Change (ROC), Relative Strength Index (RSI), Commodity Channel Index (CCI), Williams Percent Range, and Average Directional Index (ADX) from TradingView, this strategy offers traders a systematic way to navigate the markets with precision.
The core principle of this strategy lies in its ability to identify optimal entry and exit points based on the movement of the Ultimate Balance Oscillator. When the oscillator line crosses below the 0.75 level, a buy signal is generated, indicating a potential opportunity for a bullish trend reversal. Conversely, when the oscillator line crosses above the 0.25 level, it triggers an exit signal, suggesting a possible end to a bullish trend.
Key Features:
1. Objective Market Analysis: The Ultimate Balance Oscillator Strategy provides a disciplined and objective approach to market analysis. By relying on the quantified insights of multiple indicators, it helps traders cut through market noise and focus on key signals, improving decision-making and reducing emotional biases.
2. Enhanced Timing and Precision: This strategy's entry and exit signals are based on the specific thresholds of the Ultimate Balance Oscillator. By waiting for confirmation through the crossing of these levels, traders can potentially enter trades at opportune moments and exit with greater precision, maximizing profit potential and minimizing risk exposure.
3. Customizability and Adaptability: The strategy offers flexibility, allowing traders to customize the parameters to fit their preferred trading style and timeframes. Whether you're a short-term trader or a long-term investor, the Ultimate Balance Oscillator Strategy can be adjusted to suit your specific needs, making it adaptable to various market conditions.
4. Real-time Alerts: Stay informed and never miss a potential trade opportunity with the strategy's built-in alert system. Set personalized alerts for buy and exit signals to receive timely notifications, ensuring you're always aware of the latest developments in the market.
5. Backtesting and Optimization: Before applying the strategy to live trading, it's recommended to conduct thorough backtesting and optimization. By testing the strategy's performance over historical data and fine-tuning the parameters, you can gain insights into its strengths and weaknesses, enabling you to make informed adjustments and increase its effectiveness.
Trading involves risk. Use the Ultimate Balance Oscillator Strategy at your own discretion. Past performance is not indicative of future results.

Ultimate Balance OscillatorIntroducing the Ultimate Balance Oscillator: A Powerful Trading Indicator
Built upon the renowned Rate of Change (ROC), Relative Strength Index (RSI), Commodity Channel Index (CCI), Williams Percent Range, and Average Directional Index (ADX) from TradingView, this indicator equips traders with an unparalleled understanding of market dynamics.
What sets the Ultimate Balance Oscillator apart is its meticulous approach to weighting. Each component is assigned a weight that reflects its individual significance, while carefully mitigating the influence of highly correlated signals. This strategic weighting methodology ensures an unbiased and comprehensive representation of market sentiment, eliminating dominance by any single indicator.
Key Features and Benefits:
1. Comprehensive Market Analysis: The Ultimate Balance Oscillator provides a comprehensive view of market conditions, enabling traders to discern price trends, evaluate momentum shifts, identify overbought or oversold levels, and gauge the strength of prevailing trends. This holistic perspective empowers traders to make well-informed decisions based on a thorough understanding of the market.
2. Enhanced Signal Accuracy: With its refined weighting approach, the Ultimate Balance Oscillator filters out noise and emphasizes the most relevant information. This results in heightened signal accuracy, providing traders with a distinct advantage in identifying optimal entry and exit points. Say goodbye to unreliable signals and welcome a more precise and dependable trading experience.
3. Adaptability to Various Trading Scenarios: The Ultimate Balance Oscillator transcends the constraints of specific markets or timeframes. It seamlessly adapts to diverse trading scenarios, accommodating both short-term trades and long-term investments. Traders can customize this indicator to suit their preferred trading style and effortlessly navigate ever-changing market conditions.
4. Simplicity and Ease of Use: The Ultimate Balance Oscillator simplifies trading analysis by providing a single line on the chart. Its straightforward interpretation and seamless integration into trading strategies make decision-making effortless. By observing bullish or bearish crossovers with the moving average, recognizing overbought or oversold levels, and tracking the overall trend of the oscillator, traders can make well-informed decisions with confidence.
5. Real-time Alerts: Stay ahead of the game with the Ultimate Balance Oscillator's customizable alert system. Traders can set up personalized alerts for bullish or bearish crossovers, breaches of overbought or oversold thresholds, or any specific events that align with their trading strategy. Real-time notifications enable timely action, ensuring traders never miss lucrative trading opportunities.
The Ultimate Balance Oscillator is a robust trading companion, empowering traders to make shrewd and calculated decisions. Embrace its power and elevate your trading endeavors to new heights of precision and success. Discover the potential of the Ultimate Balance Oscillator and unlock a world of trading possibilities.

Matrix Momentum Expansion [IkkeOmar]The indicator consists of several features:
Candlestick chart: The indicator plots a candlestick chart based on the input parameters of the user. The candlesticks are colored blue or orange depending on whether the closing price is above or below the upper and lower bands.
Support and Resistance levels: The indicator also plots support and resistance levels based on the CCI (Commodity Channel Index) of the asset's price. These levels are dynamic and change based on the user's input parameters.
Momentum: The indicator calculates the momentum of the market based on the smoothed and standard deviation of the asset's price. It uses this momentum to calculate upper and lower bands that are plotted on the chart.
Warning signals: The indicator can also be used to identify potential warning signals. When the closing price of the asset moves above the upper band, it could indicate that the market is overbought and a potential reversal could occur. Conversely, when the closing price moves below the lower band, it could indicate that the market is oversold and a potential reversal could occur.
Contractions and expansions in the bands can provide important information to traders about potential price movements.
When the bands contract, it indicates that the market is experiencing low volatility and the price is likely to move sideways. During these periods, traders may look for other signals, such as support and resistance levels or price patterns, to determine potential entry and exit points.
On the other hand, when the bands expand, it indicates that the market is experiencing high volatility and the price is likely to move in a particular direction. Traders can use this information to identify potential trend reversals or continuation patterns. When the upper and lower bands move further apart, it indicates that the trend is becoming stronger, while when they move closer together, it indicates that the trend may be weakening.
When the price moves outside of the bands, it can also provide important information to traders. If the price moves above the upper band, it could indicate that the market is overbought and a potential reversal could occur. Conversely, if the price moves below the lower band, it could indicate that the market is oversold and a potential reversal could occur.
Very important note!
When you see contractions, please understand that it's a wonderful opportunity to pivot into position to catch a good trade because we will see an expansion after!

Divergence for Many [Dimkud - v5]Strategy is based on "Divergence for Many Indicators v4 ST" strategy by CannyTolany01
which is based on "Divergence for Many Indicator" indicator by LonesomeTheBlue
This strategy is searching for divergences on 18 indicators which you can select and optimise one by one.
Additionally you can connect any other External Indicator value. (just add this indicator the the chart and select option in settings)
To the original indicator/strategy I have added 9 additional indicators:
( Money Flow Index, Williams_Vix, Stochastic RSI , SMI Ergodic Oscillator, Volume Weighted MACD , Bull Bear Power, Balance of Power , Relative Volatility Index , Logistic Settings).
Converted strategy to v5 of Pine Script.
Added Static SL/TP in percents (%).
Added filters to filter enters:
1. Volume Weighted MACD - Multi-TimeFrame Filter
(It checks for histogram to falling or rising for a set periods of bars)
2. Money Flow Index - Multi-TimeFrame Filter
(It checks if MFI Oscillator is in the set diapason.
Also It checks if MFI is falling or rising for a set periods of bars )
3. ATR filter
(check changes in fast ATR to slow ATR )
Strategy shows good backtest results on many crypto tokens on 45m - 1h periods. (with parameters optimisation for every indicator)
To find best parameters - you can enable indicators one-by one, and optimise best parameters for each of them.
Then enable all indicators with successful results.
Optimise SL/TP.
Then try to enable and optimise filters (channels etc.)
The better is to optimise parameters separately for Short and Long trading. And run two separate bots (in settings enable only Long or only Short.)
Updates:
- Added visualisation for open trades (SL/TP)
- Added Volatility filter by ATR with many options for tests.
- Fixed some small bugs.
- Added second RSI filter (you can use two RSIs with different TF or settings)
- Updated ATR volatility and MFI filter. Removed non-effective options
- Added CCI filter
- Added option to Enable/Disable visualisation of TP/SL on chart
- Fixed one small quick bug. ("ATR filter short" was not working)
- Added Super Trend filter
- Added Momentum filter
- Added Volume Filter
- All "request.security" MultiTimeFrame calls changed to 100% non-repait function "f_security()"

Multi indicators tableThis is a comprehensive trading tool that presents an overview of the market in a tabular format. It consists of five distinct categories of trading indicators : Volatility, Trend, Momentum, Reversal, and Volume. Each category includes a series of indicators that are widely used in the trading communauty.
The Volatility category includes the Average True Range (ATR) and Bollinger Bands indicators. The Trend category comprises the Average Directional Index (ADX), four Exponential Moving Averages (EMAs), Aroon, Parabolic SAR, and the Supertrend. The Momentum category includes the Stochastic Relative Strength Index (StochRSI), Money Flow Index (MFI), Williams %R, Relative Strength Index (RSI), and Commodity Channel Index (CCI). The Reversal category includes Parabolic SAR, Moving Average Convergence Divergence (MACD), and PP Supertrend. Finally, the Volume category includes the Volume Exponential Moving Average (EMA) indicator.
The indicators states are easily readable, the indicator case is colored based on his actual state. A bullish color (green by default), a bearish color (red by default),
a very bullish color (dark green by default), a very bearish color (dark red by default) and a neutral color (gray by default) displayed when the indicator doesn't give us a clear signal. Some indicators do not have a very bullish or very bearish state. Concerning volatility indicators, the bullish color indicates high volatility, the bearish color indicates low volatility, and the neutral color indicates normal volatility.
Most of the indicators displayed in the table are customizable, and traders can choose to hide the categories they don't want to use. The Indicator provides a quick and easily readable view on the market and allows traders to reduce the number of indicators on their chart making it lighter and more readable.

Intrabar Analyzer [Kioseff Trading]Hello!
This indicator (Intrabar Analyzer) presents intrabar data in various derivative forms.
On-Chart Features
Traditional price data down to 1 min.
Heikin-Ashi price data down to 1 min.
Kagi price data down to 1 min.
Point & Figure price data down to 1 min.
Renko price data down to 1 min.
Linebreak price data down to 1 min.
LinReg channel
SMA
EMA
ALMA
Echomorphic Average (A @kaigouthro special!)
HMA
RMA
WMA
VWMA
VWAP
SWMA
SAR
Supertrend
On-Chart Features
Price x Volume graph
Intrabar technical rating
Positive volume index
Negative volume index
Price volume trend
RSI
%k
ROC
MFI
MFC
OBV
CCI
BBW
CMO
COG
KCW
MOM
RANGE
%r
Let's look at the objects populated by the indicator!
The image above shows what data correlates to the populated graphs!
Let's dial in on the price x volume graph.
The image above provides an example/explanation of the price x volume graph. All data is sourced from a lower timeframe (configurable - default = 1 minute).
Colors are configurable; the plot characters are configurable.
The numbers above show an alternative view of the price x volume graph!
Price graph
The price graph can populate 6 variations of price data: traditional, heikin-ashi, renko, point & figure, line break, and kagi.
The subsequent images will show all available forms of price data, in addition to a randomly selected, on-chart technical indicator!
Kagi + LinReg
Traditional + EMA
Renko + SAR
Point & Figure + ALMA
Heikin-Ashi + Supertrend
Line Break + VWAP
You can display up to three indicators concomitantly - all calculated using intrabar data!
Lastly, the indicator displays the TradingView calculated technical rating for the intrabar.
The technical ratings are multiplied by x100 and oriented left & right of the price box. Left values are negative; right values are positive. The "0" value is not shown; therefore, if the technical rating isn't highlighted then the rating is "0".
The image above shows the technical rating system in action (:
That's it!
This was a fun project and I'm certainly willing to add more - let me know if there's anything you'd like included.
Additionally, a future feature involves compatibility with any custom indicator! Stay tuned; thank you for checking this out (:
Thank you to @kaigouthro, TradingView and @PineCoders for providing some cool libraries to play with!

TechnicalRating█ OVERVIEW
This library is a Pine Script™ programmer’s tool for incorporating TradingView's well-known technical ratings within their scripts. The ratings produced by this library are the same as those from the speedometers in the technical analysis summary and the "Rating" indicator in the Screener , which use the aggregate biases of 26 technical indicators to calculate their results.
█ CONCEPTS
Ensemble analysis
Ensemble analysis uses multiple weaker models to produce a potentially stronger one. A common form of ensemble analysis in technical analysis is the usage of aggregate indicators together in hopes of gaining further market insight and reinforcing trading decisions.
Technical ratings
Technical ratings provide a simplified way to analyze financial markets by combining signals from an ensemble of indicators into a singular value, allowing traders to assess market sentiment more quickly and conveniently than analyzing each constituent separately. By consolidating the signals from multiple indicators into a single rating, traders can more intuitively and easily interpret the "technical health" of the market.
Calculating the rating value
Using a variety of built-in TA functions and functions from our ta library, this script calculates technical ratings for moving averages, oscillators, and their overall result within the `calcRatingAll()` function.
The function uses the script's `calcRatingMA()` function to calculate the moving average technical rating from an ensemble of 15 moving averages and filters:
• Six Simple Moving Averages and six Exponential Moving Averages with periods of 10, 20, 30, 50, 100, and 200
• A Hull Moving Average with a period of 9
• A Volume-Weighted Moving Average with a period of 20
• An Ichimoku Cloud with a conversion line length of 9, base length of 26, and leading span B length of 52
The function uses the script's `calcRating()` function to calculate the oscillator technical rating from an ensemble of 11 oscillators:
• RSI with a period of 14
• Stochastic with a %K period of 14, a smoothing period of 3, and a %D period of 3
• CCI with a period of 20
• ADX with a DI length of 14 and an ADX smoothing period of 14
• Awesome Oscillator
• Momentum with a period of 10
• MACD with fast, slow, and signal periods of 12, 26, and 9
• Stochastic RSI with an RSI period of 14, a %K period of 14, a smoothing period of 3, and a %D period of 3
• Williams %R with a period of 14
• Bull Bear Power with a period of 50
• Ultimate Oscillator with fast, middle, and slow lengths of 7, 14, and 28
Each indicator is assigned a value of +1, 0, or -1, representing a bullish, neutral, or bearish rating. The moving average rating is the mean of all ratings that use the `calcRatingMA()` function, and the oscillator rating is the mean of all ratings that use the `calcRating()` function. The overall rating is the mean of the moving average and oscillator ratings, which ranges between +1 and -1. This overall rating, along with the separate MA and oscillator ratings, can be used to gain insight into the technical strength of the market. For a more detailed breakdown of the signals and conditions used to calculate the indicators' ratings, consult our Help Center explanation.
Determining rating status
The `ratingStatus()` function produces a string representing the status of a series of ratings. The `strongBound` and `weakBound` parameters, with respective default values of 0.5 and 0.1, define the bounds for "strong" and "weak" ratings.
The rating status is determined as follows:
Rating Value Rating Status
< -strongBound Strong Sell
< -weakBound Sell
-weakBound to weakBound Neutral
> weakBound Buy
> strongBound Strong Buy
By customizing the `strongBound` and `weakBound` values, traders can tailor the `ratingStatus()` function to fit their trading style or strategy, leading to a more personalized approach to evaluating ratings.
Look first. Then leap.
█ FUNCTIONS
This library contains the following functions:
calcRatingAll()
Calculates 3 ratings (ratings total, MA ratings, indicator ratings) using the aggregate biases of 26 different technical indicators.
Returns: A 3-element tuple: ( [(float) ratingTotal, (float) ratingOther, (float) ratingMA ].
countRising(plot)
Calculates the number of times the values in the given series increase in value up to a maximum count of 5.
Parameters:
plot : (series float) The series of values to check for rising values.
Returns: (int) The number of times the values in the series increased in value.
ratingStatus(ratingValue, strongBound, weakBound)
Determines the rating status of a given series based on its values and defined bounds.
Parameters:
ratingValue : (series float) The series of values to determine the rating status for.
strongBound : (series float) The upper bound for a "strong" rating.
weakBound : (series float) The upper bound for a "weak" rating.
Returns: (string) The rating status of the given series ("Strong Buy", "Buy", "Neutral", "Sell", or "Strong Sell").

supertrend with multiple filter strategythis indicator filters buy and sell signal from the supertrend base on various condition that the user can manually select.
as of now the following filter are included
buy and sell filter;
-Macd
-CCI
-EMA200
-LUX TRAMA
-Stochastic rsi
-MFI
EXIT SIGNAL CAN BE CHOSE BETWEEN ATR BAND OR BOLLINGER BAND
i am planning on keeping to add filters so if you have suggestion fell free to message me.