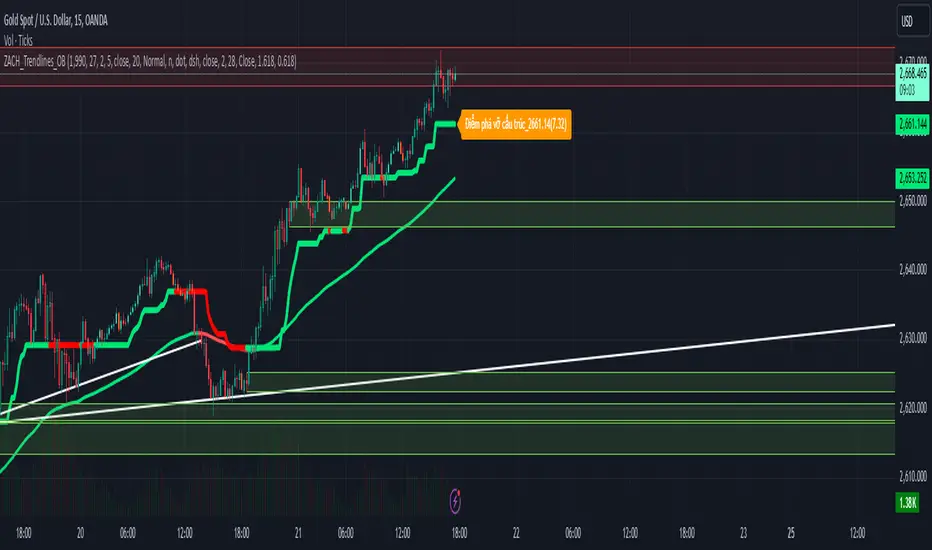
ZACH_Trendlines_OBThe Pine Script you've shared appears to be a comprehensive indicator that combines various strategies and tools for technical analysis in TradingView. It includes functionalities such as:
Trendlines (Support/Resistance):
The script calculates pivot points and draws trendlines connecting them.
Implements both bullish and bearish trendlines with customizable styles, colors, and extensions.
Magic Trend (ATR-based):
Plots a trendline derived from ATR (Average True Range) and CCI (Commodity Channel Index) to identify trend directions.
Order Blocks (OB):
Identifies bullish and bearish order blocks based on price momentum and sensitivity settings.
Order blocks are drawn as rectangles and extended in the chart with configurable border and background colors.
Uses ROC (Rate of Change) to identify key price levels where order blocks might form.
Alerts:
Includes alert conditions for breakouts and interactions with order blocks.
Customizable Inputs:
Allows users to modify key parameters such as ATR period, CCI period, pivot length, and sensitivity for order blocks.
Key Features Summary:
Trendlines:
Bullish/Bearish trendlines with detection for breakout points.
Option to enable/disable upper/lower lines and extend them.
Magic Trend:
Visualizes directional trends using ATR and CCI.
Order Blocks:
Detection and plotting of order blocks based on momentum.
Configurable OB mitigation type (Close or Wick).
Alerts:
Triggers alerts for specific events (e.g., order block breaches).
Suggestions for Further Refinements:
Performance Optimization:
The nested loops, especially in order block creation, might impact performance on larger datasets or lower timeframes. Consider optimizing these for better responsiveness.
Commenting and Documentation:
Add comments to describe the purpose and logic behind each section to make the script more maintainable.
Validation:
Check for edge cases (e.g., when there are insufficient data points for pivot calculation).
If you'd like assistance debugging specific parts of this script or optimizing any component, feel free to point it out!
Cari dalam skrip untuk "CCI"
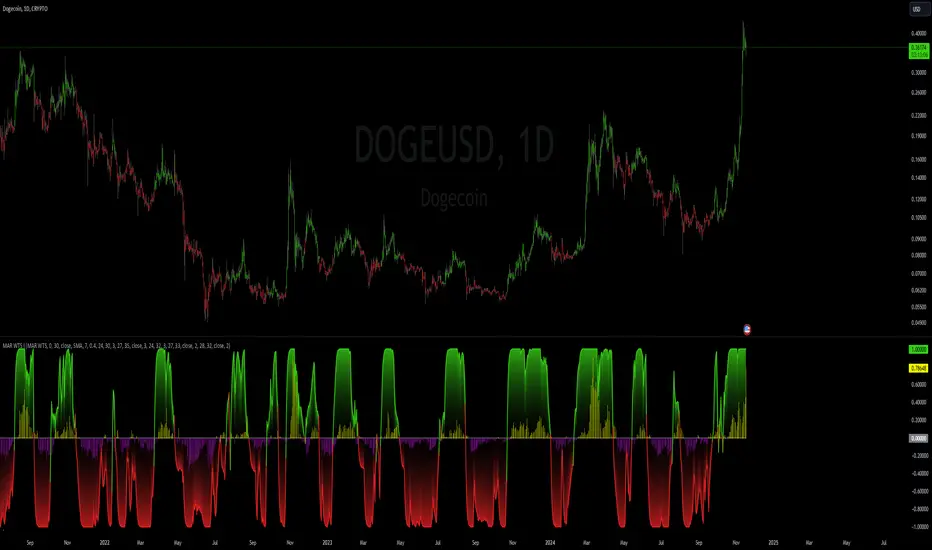
MA Ratio Weighted Trend System I [InvestorUnknown]The MA Ratio Weighted Trend System I combines slow and fast indicators to identify stable trends and capture potential market turning points. By dynamically adjusting the weight of fast indicators based on the Moving Average Ratio (MAR), the system aims to provide timely entry and exit signals while maintaining overall trend stability through slow indicators.
Slow and Fast Indicators with Dynamic Weighting
Slow Indicators: Designed for stable trend identification, these indicators maintain a constant weight in the overall signal calculation. They include:
DMI For Loop (Directional Movement Index)
CCI For Loop (Commodity Channel Index)
Aroon For Loop
Fast Indicators: Aim to detect rapid market changes and potential turning points. Their weights are dynamically adjusted based on the absolute value of the Moving Average Ratio (MAR). Fast indicators include:
ZLEMA For Loop (Zero-Lag Exponential Moving Average)
IIRF For Loop (Infinite Impulse Response Filter)
Dynamic Weighting Mechanism:
Moving Average Ratio (MAR) is calculated as the ratio of the price to its moving average, minus one (for simplicity and visualization).
Weight Calculation
Fast indicator weights are determined based on the absolute value of MAR, possibly with an offset to avoid scenarios where MAR follows rapid price reversals too closely:
// Function to calculate weights based on MAR
f_mar_weights(series float mar, simple int offset, simple float weight_thre) =>
o_mar = math.abs(mar )
float fast_weight = 0
float slow_weight = 1
if o_mar != 0
if weight_thre > 0
if o_mar <= weight_thre
fast_weight := o_mar
else
fast_weight := o_mar
Threshold-Based vs. Continuous Weighting:
Threshold-Based: Fast indicators receive weight only when the absolute MAR exceeds a user-defined threshold (weight_thre).
Continuous: By setting weight_thre to zero, fast indicators always receive some weight, though this may increase false signals.
Offset Mechanism
The offset parameter shifts the MAR used for weighting by a certain number of bars. This helps avoid situations where the MAR follows sudden price movements too closely, preventing fast indicators from failing to provide timely exit signals.
Signal Calculation
The final signal is a weighted average of the slow and fast indicators:
// Calculate Signal (as weighted average)
float sig = math.round(((DMI*slow_w) + (CCI*slow_w) + (Aroon*slow_w) + (ZLEMA*fast_w) + (IIRF*fast_w)) / (3*slow_w + 2*fast_w), 2)
Backtesting and Performance Metrics
Enables users to test the indicator's performance over historical data, comparing it to a buy-and-hold strategy.
Alerts
Set up alerts for when the signal crosses above or below the thresholds.
alertcondition(long_alert, "LONG (MAR Weighted Trend System)", "MAR Weighted Trend System flipped ⬆LONG⬆")
alertcondition(short_alert, "SHORT (MAR Weighted Trend System)", "MAR Weighted Trend System flipped ⬇Short⬇")
Important Notes
Customization: Due to the experimental nature of this indicator, users are strongly encouraged to adjust and calibrate the settings to align with their trading strategies and market conditions.
Default Settings Disclaimer: The default settings are not optimized or recommended for any specific use and serve only as placeholders for the indicator's publication.
Backtest Results Disclaimer: Historical backtest results are not indicative of future performance. Market conditions change, and past results do not guarantee future outcomes.
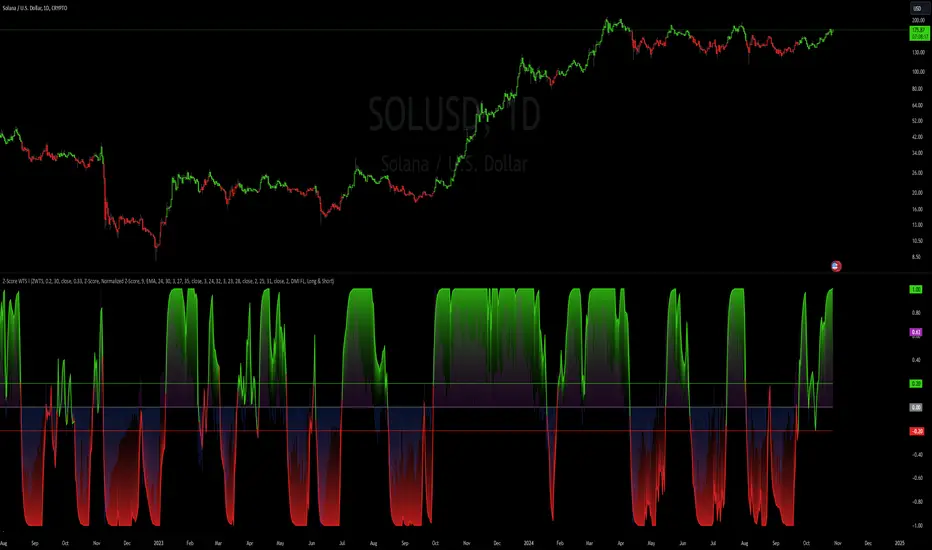
Z-Score Weighted Trend System I [InvestorUnknown]The Z-Score Weighted Trend System I is an advanced and experimental trading indicator designed to utilize a combination of slow and fast indicators for a comprehensive analysis of market trends. The system is designed to identify stable trends using slower indicators while capturing rapid market shifts through dynamically weighted fast indicators. The core of this indicator is the dynamic weighting mechanism that utilizes the Z-score of price , allowing the system to respond effectively to significant market movements.
Dynamic Z-Score-Based Weighting System
The Z-Score Weighted Trend System I utilizes the Z-score of price to assign weights dynamically to fast indicators. This mechanism is designed to capture rapid market shifts at potential turning points, providing timely entry and exit signals.
Traders can choose from two primary weighting mechanisms:
Threshold-Based Weighting: The fast indicators are given weight only when the absolute Z-score exceeds a user-defined threshold. Below this threshold, fast indicators have no impact on the final signal.
Continuous Weighting: By setting the threshold to zero, fast indicators always contribute to the final signal, regardless of Z-score levels. However, this increases the likelihood of false signals during ranging or low-volatility markets
// Calculate weight for Fast Indicators based on Z-Score (Slow Indicator weight is kept to 1 for simplicity)
f_zscore_weights(series float z, simple float weight_thre) =>
float fast_weight = na
float slow_weight = na
if weight_thre > 0
if math.abs(z) <= weight_thre
fast_weight := 0
slow_weight := 1
else
fast_weight := 0 + math.sqrt(math.abs(z))
slow_weight := 1
else
fast_weight := 0 + math.sqrt(math.abs(z))
slow_weight := 1
Choice of Z-Score Normalization
Traders have the flexibility to select different Z-score processing methods to better suit their trading preferences:
Raw Z-Score or Moving Average: Traders can opt for either the raw Z-score or a moving average of the Z-score to smooth out fluctuations.
Normalized Z-Score (ranging from -1 to 1) or Z-Score Percentile: The normalized Z-score is simply the raw Z-score divided by 3, while the Z-score percentile utilizes a normal distribution for transformation.
f_zscore_perc(series float zscore_src, simple int zscore_len, simple string zscore_a, simple string zscore_b, simple string ma_type, simple int ma_len) =>
z = (zscore_src - ta.sma(zscore_src, zscore_len)) / ta.stdev(zscore_src, zscore_len)
zscore = switch zscore_a
"Z-Score" => z
"Z-Score MA" => ma_type == "EMA" ? (ta.ema(z, ma_len)) : (ta.sma(z, ma_len))
output = switch zscore_b
"Normalized Z-Score" => (zscore / 3) > 1 ? 1 : (zscore / 3) < -1 ? -1 : (zscore / 3)
"Z-Score Percentile" => (f_percentileFromZScore(zscore) - 0.5) * 2
output
Slow and Fast Indicators
The indicator uses a combination of slow and fast indicators:
Slow Indicators (constant weight) for stable trend identification: DMI (Directional Movement Index), CCI (Commodity Channel Index), Aroon
Fast Indicators (dynamic weight) to identify rapid trend shifts: ZLEMA (Zero-Lag Exponential Moving Average), IIRF (Infinite Impulse Response Filter)
Each indicator is calculated using for-loop methods to provide a smoothed and averaged view of price data over varying lengths, ensuring stability for slow indicators and responsiveness for fast indicators.
Signal Calculation
The final trading signal is determined by a weighted combination of both slow and fast indicators. The slow indicators provide a stable view of the trend, while the fast indicators offer agile responses to rapid market movements. The signal calculation takes into account the dynamic weighting of fast indicators based on the Z-score:
// Calculate Signal (as weighted average)
float sig = math.round(((DMI*slow_w) + (CCI*slow_w) + (Aroon*slow_w) + (ZLEMA*fast_w) + (IIRF*fast_w)) / (3*slow_w + 2*fast_w), 2)
Backtest Mode and Performance Metrics
The indicator features a detailed backtesting mode, allowing traders to compare the effectiveness of their selected settings against a traditional Buy & Hold strategy. The backtesting provides:
Equity calculation based on signals generated by the indicator.
Performance metrics comparing Buy & Hold metrics with the system’s signals, including: Mean, positive, and negative return percentages, Standard deviations, Sharpe, Sortino, and Omega Ratios
// Calculate Performance Metrics
f_PerformanceMetrics(series float base, int Lookback, simple float startDate, bool Annualize = true) =>
// Initialize variables for positive and negative returns
pos_sum = 0.0
neg_sum = 0.0
pos_count = 0
neg_count = 0
returns_sum = 0.0
returns_squared_sum = 0.0
pos_returns_squared_sum = 0.0
neg_returns_squared_sum = 0.0
// Loop through the past 'Lookback' bars to calculate sums and counts
if (time >= startDate)
for i = 0 to Lookback - 1
r = (base - base ) / base
returns_sum += r
returns_squared_sum += r * r
if r > 0
pos_sum += r
pos_count += 1
pos_returns_squared_sum += r * r
if r < 0
neg_sum += r
neg_count += 1
neg_returns_squared_sum += r * r
float export_array = array.new_float(12)
// Calculate means
mean_all = math.round((returns_sum / Lookback), 4)
mean_pos = math.round((pos_count != 0 ? pos_sum / pos_count : na), 4)
mean_neg = math.round((neg_count != 0 ? neg_sum / neg_count : na), 4)
// Calculate standard deviations
stddev_all = math.round((math.sqrt((returns_squared_sum - (returns_sum * returns_sum) / Lookback) / Lookback)) * 100, 2)
stddev_pos = math.round((pos_count != 0 ? math.sqrt((pos_returns_squared_sum - (pos_sum * pos_sum) / pos_count) / pos_count) : na) * 100, 2)
stddev_neg = math.round((neg_count != 0 ? math.sqrt((neg_returns_squared_sum - (neg_sum * neg_sum) / neg_count) / neg_count) : na) * 100, 2)
// Calculate probabilities
prob_pos = math.round((pos_count / Lookback) * 100, 2)
prob_neg = math.round((neg_count / Lookback) * 100, 2)
prob_neu = math.round(((Lookback - pos_count - neg_count) / Lookback) * 100, 2)
// Calculate ratios
sharpe_ratio = math.round((mean_all / stddev_all * (Annualize ? math.sqrt(Lookback) : 1))* 100, 2)
sortino_ratio = math.round((mean_all / stddev_neg * (Annualize ? math.sqrt(Lookback) : 1))* 100, 2)
omega_ratio = math.round(pos_sum / math.abs(neg_sum), 2)
// Set values in the array
array.set(export_array, 0, mean_all), array.set(export_array, 1, mean_pos), array.set(export_array, 2, mean_neg),
array.set(export_array, 3, stddev_all), array.set(export_array, 4, stddev_pos), array.set(export_array, 5, stddev_neg),
array.set(export_array, 6, prob_pos), array.set(export_array, 7, prob_neu), array.set(export_array, 8, prob_neg),
array.set(export_array, 9, sharpe_ratio), array.set(export_array, 10, sortino_ratio), array.set(export_array, 11, omega_ratio)
// Export the array
export_array
//}
Calibration Mode
A Calibration Mode is included for traders to focus on individual indicators, helping them fine-tune their settings without the influence of other components. In Calibration Mode, the user can visualize each indicator separately, making it easier to adjust parameters.
Alerts
The indicator includes alerts for long and short signals when the indicator changes direction, allowing traders to set automated notifications for key market events.
// Alert Conditions
alertcondition(long_alert, "LONG (Z-Score Weighted Trend System)", "Z-Score Weighted Trend System flipped ⬆LONG⬆")
alertcondition(short_alert, "SHORT (Z-Score Weighted Trend System)", "Z-Score Weighted Trend System flipped ⬇Short⬇")
Important Note:
The default settings of this indicator are not optimized for any particular market condition. They are generic starting points for experimentation. Traders are encouraged to use the calibration tools and backtesting features to adjust the system to their specific trading needs.
The results generated from the backtest are purely historical and are not indicative of future results. Market conditions can change, and the performance of this system may differ under different circumstances. Traders and investors should exercise caution and conduct their own research before using this indicator for any trading decisions.
Trend Magic with EMA, SMA, and Auto-TradingRelease Notes
Strategy Name: Trend Magic with EMA, SMA, and Auto-Trading
Purpose: This strategy is designed to capture entry and exit points in the market using the Trend Magic indicator and three moving averages (EMA45, SMA90, and SMA180). Specifically, it uses the perfect order of the moving averages and the color changes in Trend Magic to identify trend reversals and potential trading opportunities.
Uniqueness and Usefulness
Uniqueness: The strategy utilizes the Trend Magic indicator, which is based on price and volatility, along with three moving averages to assess the strength of trends. The signals are generated only when the moving averages are in perfect order, and the Trend Magic color changes, ensuring that the entry is made during established trends. This combination provides a higher degree of reliability compared to strategies that rely solely on price action or single indicators.
Usefulness: This strategy is particularly useful for traders looking to capture trends over longer periods. It is effective at reducing noise in the market, only providing signals when the moving averages align and the Trend Magic indicator confirms a trend reversal. It works well in both trending and volatile markets.
Entry Conditions
Long Entry:
Condition: A perfect order (EMA45 > SMA90 > SMA180) is established, and Trend Magic changes color from red to blue.
Signal: A buy signal is generated, indicating the start of an uptrend.
Short Entry:
Condition: A perfect order (EMA45 < SMA90 < SMA180) is established, and Trend Magic changes color from blue to red.
Signal: A sell signal is generated, indicating the start of a downtrend.
Exit Conditions
Exit Strategy:
This strategy automatically enters and exits trades based on signals, but traders are encouraged to manage exits manually according to their own risk management preferences. The strategy includes stop loss and take profit settings based on risk-to-reward ratios for better risk management.
Risk Management
The strategy includes built-in risk management by using the SMA90 level at the time of entry as the stop-loss point and setting the take profit at a 1:1.5 risk-to-reward ratio. The stop-loss level is fixed at the entry point and does not move as the market progresses. Traders are advised to implement additional risk management, such as trailing stops, for added protection.
Account Size: ¥100,000
Commissions and Slippage: Assumes 94 pips for commissions and 1 pip for slippage per trade
Risk per Trade: 10% of account equity (adjust this based on personal risk tolerance)
Configurable Options
Configurable Options:
CCI Period: Set the period for the CCI used to calculate the Trend Magic indicator (default is 21).
ATR Multiplier: Set the multiplier for ATR used in the Trend Magic calculation (default is 1.0).
EMA/SMA Periods: The periods for the three moving averages (default is EMA45, SMA90, and SMA180).
Signal Display Control: An option to toggle the display of buy and sell signals on the chart.
Adequate Sample Size
To ensure the robustness and reliability of this strategy, it is recommended to backtest it with a sufficiently long period of historical data. Testing across different market conditions, including high and low volatility periods, is also advised.
Credits
Acknowledgments:
This strategy is based on the Trend Magic indicator combined with moving averages and draws on contributions from the technical analysis and trading community.
Clean Chart Description
Chart Appearance:
To maintain a clean and simple chart, this strategy includes options to turn off the display of Trend Magic, moving averages, and entry signals. Traders can adjust these display settings as needed to minimize visual clutter and focus on effective trend analysis.
Addressing the House Rule Violations
Omissions and Unrealistic Claims
Clarification:
This strategy does not make any unrealistic or unsupported claims about its performance. All signals are intended for educational purposes only and do not guarantee future results. It is important to note that past performance does not guarantee future outcomes, and proper risk management is crucial.

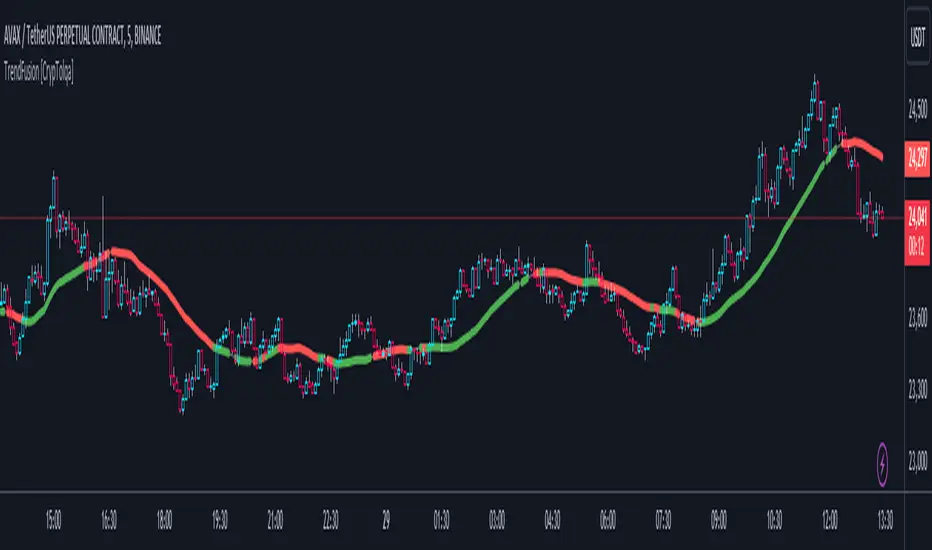
TrendFusion [CrypTolqa]This code colors the SMA line red when the RSI is below 50 and the CCI is below 0, and green when the RSI is above 50 and the CCI is above 0. For cases that do not meet the specified details, the line is displayed in gray.
Multiple Oscillator Conditions Final [siulian] v2This tool is created to gather multiple oscilators condition under the same umbrela and back-test your idea.
Basically the only intention of this tool is to used in combination with a back-tester indicator ( or manually ) where you get the entry based on the cumulative signals provided by this tool.
For example you can to combine RSI , MACD, CCI, Keltner Channels or whatever indicator you think it might give you an edge for an entry signal.
You can combine up to 7 indicators either by comparing them with a static value or with another indicator (for example you can compare RSI with RSI MA, Volume with Volume MA, etc)
There are two lines which will be printed.
1) Result(blue line) - it will print 1 when all the condition are met ( the same can be used for back-testing tools)
2) Condition Met count(yellow line) - which will count how many conditions from the ones selected are triggered ( for example you have 6 indicators that are matching the conditions and you still want to take a trade even if the condition number 7 is not met)
Alarms can be setup to check if more than defined conditions are present.
As a demo in the above image i have put several condition in order to possible catch bottoms.
Please understand this is just an example on how to integrate multiple condition into a single entity and should not be used as is.
1) price should close below KC
2) CCI < - 100
3) RSI < 30
4) Vol > Vol MA
Past performance do not guarantee future performance.

Hybrid Overbought/Oversold OverlayIntroduction
This is a new representation of my well-known oscillator Hybrid Overbought/Oversold Detector overlaid on the chart. The script utilizes the following 12 different oscillators to bring forth a new indicator which I call it Hybrid OB/OS .
Utilized Oscillators
The utilized oscillators here are:
Bollinger Bands %B
Chaikin Money Flow (CMF)
Chande Momentum Oscillator (CMO)
Commodity Channel Index (CCI)
Disparity Index (DIX)
Keltner Channel %K
Money Flow Index (MFI)
Rate Of Change (ROC)
Relative Strength Index (RSI)
Relative Vigor Index (RVI/RVGI)
Stochastic
Twiggs Money Flow (TMF)
The challenging part of utilizing mentioned oscillators was that some of their formulas range are not similar and some of them does not have a mathematical range at all. So I used a normalization function to normalize all their output values to (0, 100) interval.
Overbought/Oversold Levels Calculation
I noticed that the levels which considered as OB/OS level by various traders for each of the utilized oscillators are so different, e.g., many traders consider 30 as OS level and 70 as OB level for RSI and some others take 20 and 80 as the levels, or some traders consider 20 and 80 as OS/OB levels for Stochastic oscillator. Also these levels could be different on different assets, e.g., OB/OS levels for CCI on EURUSD chart might be 80 and 20 while the levels on BTCUSDT chart might be 75 and 25, and so on.
So I decided to make a routine to automate the calculation of these levels using historical data. By this feature, my indicator would calculate the corresponding levels for the oscillators on current chart and then decide about the overbought/oversold situation of each one, which leads to a more accurate Hybrid OB/OS indication.
As the result, if all 12 individual oscillators say it's overbought/oversold, the Hybrid OB/OS shows 100% overbought/oversold, vice versa, if none of them say it's overbought/oversold, the Hybrid OB/OS shows 0, and so on.
The Overlaying Oscillator Problem!
A programming-related challenge here was that Pine Script assigns two separate spaces to the oscillators and the overlaid indicators, and the programmers are limited to use just one of them in each of their codes.
Knowing this, I was forced to simulate the oscillator space on the chart and display my oscillator as a diagram somehow. Of course it won't be as nice as the oscillator itself, because the relation between the main chart bars and the oscillator bars could not be obtained, but it's better than nothing!
Settings and Usage
The indicator settings contain some options about the calculations, the diagram display and the signals appearance. By default they are fine, but you could change them as you prefer.
This indicator is better to be used alongside other indicators as a confirmation (specially in counter-trend strategies I believe). Also it generates an external signal which you could use it in your own designed indicators as well.
Feel free to test it and also the former form of the Hybrid OB/OS . Good Luck!
Trend Tide Oscillator [UAlgo]🔶 Description:
The "Trend Tide Oscillator " is a technical analysis tool designed to identify potential trend reversals and overbought/oversold conditions in the market. It calculates an oscillator based on the Commodity Channel Index (CCI) and then applies smoothing techniques to provide a clearer view of market momentum.
🔶 Key Features:
Oscillator Calculation : The indicator calculates an oscillator based on the Commodity Channel Index (CCI), which is a momentum-based oscillator used to identify overbought and oversold conditions.
Smoothing : Smoothing techniques are applied to the oscillator to reduce noise and provide a clearer view of market momentum. This helps traders in identifying trends more effectively.
Support and Resistance Zones : The indicator plots support and resistance zones based on the highest and lowest values of the oscillator over a specified lookback (default 50) period. These zones can help traders identify potential areas of price reversal. The indicator considers volatility when plotting the support and resistance zones. This aims to create more adaptable levels that account for fluctuating market conditions.
Visualization : The indicator visually represents overbought and oversold conditions with shapes (⚠️), aiding traders in quickly identifying potential entry or exit points.
Customization : Users can adjust parameters such as oscillator length, smoothing, and overbought/oversold levels, support and resistance lookbacks according to their trading preferences.
🔶 Disclaimer :
This indicator is provided for informational and educational purposes only and should not be considered as financial advice. Trading in the financial markets involves risk, and users should conduct their own research and analysis before making any investment decisions.

Pro Divergence Adaptive [regular + hidden] by TradingClue🔴 Overview 🔴
ProDivergence Adaptive is a versatile tool designed to identify regular and hidden divergences , including regular divergences from higher timeframes , on any given chart.
This indicator combines two major approaches of identifying divergences:
- Using price-action , identification of higher-highs, higher-lows etc.
- Using a statistical model (linear regression) to determine the direction of movements
To be more sensitive to the current market conditions, both were implemented in an adaptive way.
🔴 How the mechanics and calculations work 🔴
✅ short recap on what divergences are
Regular divergences occur when the price moves opposite to a selected oscillator, signaling potential trend reversals. They can be spotted on higher timeframes, providing stronger confirmation for potential reversals when aligned with signals on the current timeframe.
Hidden divergences indicate trend continuation. Combining these on various timeframes provides a more comprehensive analysis for traders to identify entry or exit points in the market
✅ Price Action
A regular bullish divergence happens when the price of an asset is forming lower lows, while the oscillator is forming higher lows.
A regular bearish divergence occurs when the price of an asset is forming higher highs, while the oscillator is forming lower highs
A hidden bullish divergence happens when the price of an asset is making higher lows during an uptrend, but the oscillator is making lower lows.
A hidden bearish divergence occurs when the price of an asset is making lower highs during a downtrend, but the oscillator is making higher highs.
"Lows" are signaled by a minimum value that is surrounded by higher low values.
"Highs" are signaled by a maximum value that is surrounded by lower high values.
Since there is no smoothing involved, there is only minimal lag.
✅ Statistical Model
When using linear regression to identify divergences between the price of an asset and an oscillator, we apply a statistical approach to find trends in the data. This method allows for a more nuanced detection of divergences, as it considers the overall direction of price points and oscillator values rather than individual highs and lows.
Regular Bullish Divergence: Occurs when the linear regression of the asset's price shows a downward trend while the linear regression of the oscillator indicates an upward trend.
Regular Bearish Divergence: Happens when the linear regression of the asset's price is upward but the linear regression of the oscillator is downward.
Hidden Bullish Divergence: Identified when, during an uptrend, the linear regression of the price is upward, but the linear regression of the oscillator trends downward.
Hidden Bearish Divergence: Occurs when, during a downtrend, the linear regression of the price trends downward, but the linear regression of the oscillator is upward.
Using linear regression smooths out fluctuations and focuses on the overall trend direction of both price and oscillator, reducing the impact of short-term volatility and providing a clearer view of the market's momentum.
✅ Adaptive Approach
Traditional oscillator settings do not account for changes in market volatility, leading to potential misalignment with current market conditions. This can result in either too many false signals during high volatility periods or missed opportunities in lower volatility settings due to the oscillator's static nature.
The adaptive approach adjusts the oscillator's settings based on the Average True Range (ATR), a measure of market volatility. By dynamically altering the oscillator length in relation to the current ATR value compared to its historical range, the settings become responsive to the market's volatility.
This adaptive method enhances the detection of meaningful divergences between price and oscillator movements by ensuring the oscillator is finely tuned to the current market environment. It results in a more accurate identification of potential reversal points, crucial for the success of divergence-based trading strategies.
🔴 Key Features 🔴
Identifies regular and hidden divergences
Multi-Timeframe Analysis
Adaptive Oscillator Configuration, level of adaptiveness can be adjusted
Supported Oscillators: CCI, Momentum, RSI
Boundaries for the dynamic length of the oscillator can be applied
Works for all kinds of assets (Forex, Stocks, Crypto, Commodities, Futures, ...)
Works on all timeframes
🔴 Examples 🔴
✅ Canadian Dollar / Japanese Yen, 4H Chart, FX:CADJPY
Divergences of Price vs CCI. The adaptive/ dynamic length of the CCI can range between 5 and 12.
✅ Bitcoin / U.S. Dollar, 2H Chart BITSTAMP:BTCUSD
Divergences of Price vs Momentum. The adaptive/ dynamic length of the Momentum can range between 4 and 13.
Caution: Trading carries a significant risk of financial loss, and past performance does not guarantee future results. Signals may be conflicting or ambiguous. Employ risk reduction techniques, such as setting stop losses, to mitigate potential losses.

Machine Learning: Multiple Logistic Regression
Multiple Logistic Regression Indicator
The Logistic Regression Indicator for TradingView is a versatile tool that employs multiple logistic regression based on various technical indicators to generate potential buy and sell signals. By utilizing key indicators such as RSI, CCI, DMI, Aroon, EMA, and SuperTrend, the indicator aims to provide a systematic approach to decision-making in financial markets.
How It Works:
Technical Indicators:
The script uses multiple technical indicators such as RSI, CCI, DMI, Aroon, EMA, and SuperTrend as input variables for the logistic regression model.
These indicators are normalized to create categorical variables, providing a consistent scale for the model.
Logistic Regression:
The logistic regression function is applied to the normalized input variables (x1 to x6) with user-defined coefficients (b0 to b6).
The logistic regression model predicts the probability of a binary outcome, with values closer to 1 indicating a bullish signal and values closer to 0 indicating a bearish signal.
Loss Function (Cross-Entropy Loss):
The cross-entropy loss function is calculated to quantify the difference between the predicted probability and the actual outcome.
The goal is to minimize this loss, which essentially measures the model's accuracy.
// Error Function (cross-entropy loss)
loss(y, p) =>
-y * math.log(p) - (1 - y) * math.log(1 - p)
// y - depended variable
// p - multiple logistic regression
Gradient Descent:
Gradient descent is an optimization algorithm used to minimize the loss function by adjusting the weights of the logistic regression model.
The script iteratively updates the weights (b1 to b6) based on the negative gradient of the loss function with respect to each weight.
// Adjusting model weights using gradient descent
b1 -= lr * (p + loss) * x1
b2 -= lr * (p + loss) * x2
b3 -= lr * (p + loss) * x3
b4 -= lr * (p + loss) * x4
b5 -= lr * (p + loss) * x5
b6 -= lr * (p + loss) * x6
// lr - learning rate or step of learning
// p - multiple logistic regression
// x_n - variables
Learning Rate:
The learning rate (lr) determines the step size in the weight adjustment process. It prevents the algorithm from overshooting the minimum of the loss function.
Users can set the learning rate to control the speed and stability of the optimization process.
Visualization:
The script visualizes the output of the logistic regression model by coloring the SMA.
Arrows are plotted at crossover and crossunder points, indicating potential buy and sell signals.
Lables are showing logistic regression values from 1 to 0 above and below bars
Table Display:
A table is displayed on the chart, providing real-time information about the input variables, their values, and the learned coefficients.
This allows traders to monitor the model's interpretation of the technical indicators and observe how the coefficients change over time.
How to Use:
Parameter Adjustment:
Users can adjust the length of technical indicators (rsi_length, cci_length, etc.) and the Z score length based on their preference and market characteristics.
Set the initial values for the regression coefficients (b0 to b6) and the learning rate (lr) according to your trading strategy.
Signal Interpretation:
Buy signals are indicated by an upward arrow (▲), and sell signals are indicated by a downward arrow (▼).
The color-coded SMA provides a visual representation of the logistic regression output by color.
Table Information:
Monitor the table for real-time information on the input variables, their values, and the learned coefficients.
Keep an eye on the learning rate to ensure a balance between model adjustment speed and stability.
Backtesting and Validation:
Before using the script in live trading, conduct thorough backtesting to evaluate its performance under different market conditions.
Validate the model against historical data to ensure its reliability.

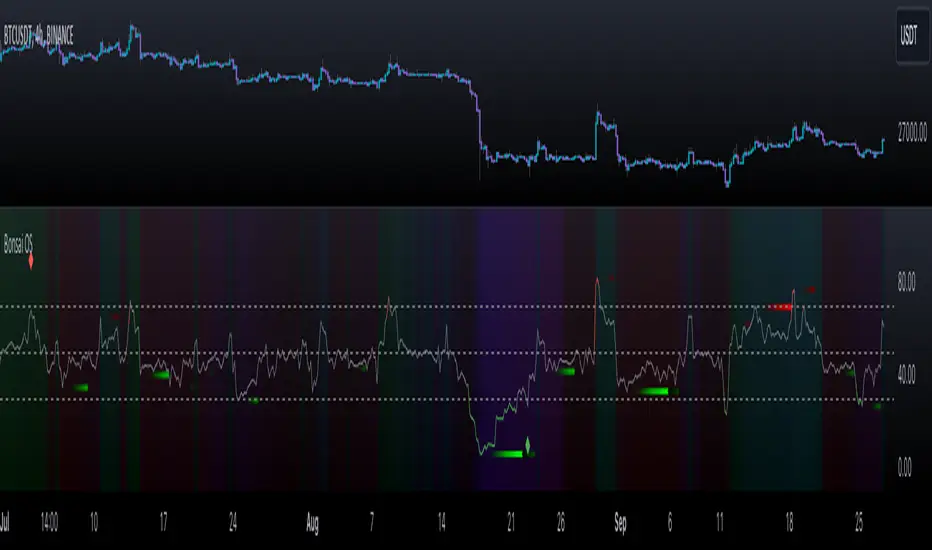
Bonsai OS (Oscillators)Bonsai OS combines four oscillators (RSI, CCI, Stochastic, MACD) in one interface. Features divergence detection, color-intensity, and insights into divergences. Assists traders in spotting potential pivot points.
═════════════════════════════════════════════════════════════════════════
🌳 Bonsai OS 🌳 Advanced Oscillator Suite
📘 Overview
Bonsai OS is a tool tailored for traders focusing on reversal strategies and those keen on identifying market divergences. Combining multiple oscillators into one unified interface, it aids traders in pinpointing potential pivot reversal points.
📌 Algorithm Logic
• Multi-Oscillator Integration: Bonsai OS calculates and integrates the values from four standard oscillators: RSI, CCI, Stochastic, and MACD. Each oscillator's value is derived from its respective mathematical formula, analyzing historical data points.
• Divergence Detection: The tool runs a series of comparisons between price action and oscillator values. When discrepancies (divergences) are observed, they are highlighted, suggesting potential market reversals.
• Price Strength Visualization: A gradient background that is determined by an average of the oscillator values in relation to their historical norms, thereby providing a visual cue about the current price strength, whether it is strong or weak.
• Alerts: Users can set up notifications based on specific divergence insights. Once set criteria are met, alerts are triggered.
🎯 Purpose
• For Professionals: Bonsai OS offers integrated oscillator readings, allowing a more in-depth market analysis.
• For Beginners: Simplified readings and visual cues make it easier for newcomers to understand oscillator indicators and market conditions.
🛠 Distinctive Elements
• Oscillator Fusion: Bonsai OS goes beyond just grouping oscillators. It looks for matching divergences across them, aiming to find stronger signals for market reversals.
• Divergence Indicators: Bonsai OS identifies divergence patterns between price trends and oscillator readings, highlighting their intensity with color variations.
• Insight into Failed Divergences: Recognizing not all divergences lead to reversals, Bonsai OS provides markers for potential false signals, helping traders exercise caution and fine-tune their strategies.
Getting Bullish/Bearish and Divergences
📊 Features
• Data Source Customization: Users have the flexibility to choose between default data inputs or adjust to their preferred price points (like High & Low).
• Combined Divergence Signals: Beyond individual oscillator divergences, Bonsai OS identifies instances when several oscillators indicate divergence at the same time.
• Adaptable Outputs: Outputs like 'Bullish Divergence ▲', 'Getting Bullish ▲', 'Getting Bearish ▼' and 'Bearish Divergence ▼' are plotted as non-displayable 1 or 0 for seamless integration into other custom indicators, ensuring a harmonious integration.
Here's an example of a custom indicator that can be used for inputting data from external sources:
//@version=5
indicator("My Script Template", overlay = true)
group_name = "External Source"
external = input.source(title = "Source", defval = close, inline = "external", group = group_name)
val = input.int(title = ">", defval = 0, inline = "external", group = group_name)
// Your logic follows here...
Bonsai OS as External Source
🎛 How To Use Bonsai OS
1. Select the desired oscillator.
2. Monitor the color changes for market condition insights.
3. Look out for divergence markers to anticipate potential market shifts.
4. If required, set up alerts for real-time updates.
Indicator Settings Menu
📜 Feedback & Continual Development
We welcome your feedback. It's essential for the continuous improvement of Bonsai OS and to better serve the TradingView community.
❗️ Disclaimer
Trading involves risks. Bonsai OS aims to provide an analytical tool to support traders, but it's essential to complement its insights with other research. Always seek advice from financial professionals and trade responsibly.
InteliTrend StableFXThis appealing little tool is a derivation of the CCI indicator and was developed in 2023 by Mario Jemic for MT4. It has additional settings that the conventional CCI indicator does not have. Furthermore, it is combined with moving averages to create signals. This is lines crossing confirmation type indicator. Look for the orange line to cross the moving average (red line).
Differences from the original:
1. Though it was coded in 2023, the original is for people who are still running Windows 95 and would like to do technical analysis on MT4.
2. The original had an additional stochastic moving average that was not particularly useful and made the indicator busy.
3. All of the moving average options have been ported over with 2 additional choices. (Hull and Arnaud Legoux added).
4. The default options are set as the tweaks that were discovered by StoneHill Forex (stonehillforex.com). You can also download the original from them.
I will probably add a few more features and options in the near future such as visuals for crossovers etc.
Enjoy!
d1g1talshad0w

Algorganic Buy / Sell / X-Exit Signal [UOI]The " Algorganic Buy / Sell / X-Exit Signal " indicator is an Algorithmic Machine Learning-based superpack indicator that generates buy and sell signals for trading in financial markets. It is packed with conditional statemnets and filters to avoid false signals and utilizes Nearest Neighbors Model (NNM) algorithm with a distance metric to determine the direction of the price movement and make predictions according to the next past 12 bars for the next 4 to 8 bars in whatever chart frame the trader is using. Ideal time frames are 2, 3, 5 and 15 minutes for option traders and scalpers can use it on the 1 minute chart.
The indicator takes into account various technical indicators such as Relative Strength Index (RSI), Average Directional Index (ADX), CCI, Stochastic, ATR and major EMAs and has two optimizer for confirmation. These indicators are used as features to train the Machine Learning model and at the same time to provide better buy and sell signals with multiple "if" conditions.
The NNM algorithm calculates the distance between the current data point and historical data points. It works like a mixture of ATR and ADX. By considering the nearest neighbors, the model predicts the direction of future price movement. The predictions are filtered using additional criteria, including volatility, trend detection, and, ATR and ADX values.
The indicator provides visual signals on the chart, indicating when to enter a long (buy) or short (sell) position but traders should also be mindful of support and resistance levels and oversold and overbought conditions and the higher timeframe signal. It also offers options for dynamic exits based on specific conditions or fixed exits after a predefined number of bars.
Additionally, the indicator includes filters based on EMA (Exponential Moving Average), SMA (Simple Moving Average), and a kernel regression technique. These filters help to refine the signals and reduce noise in the predictions.
The indicator also includes alert functionalities to notify traders of entry and exit points.
The Algorganic is a versatile trading indicator that provides buy and sell signals based on the analysis of various popular technical indicators in combination with Machine Learning techniques with technical analysis and support and resistance levels to generate trading signals, helping traders make informed decisions. This powerful tool overlays on your price chart and can be used across different markets and timeframes.
Key Features:
1. Dynamic EMA Support and Resistance Levels: You can define the top and bottom lines as either 'Support' or 'Resistance'. These levels are calculated using an Exponential Moving Average (EMA) and Average True Range (ATR) inputs.
2. Exponential Moving Average (EMA): The EMA is calculated based on the EMA length input provided by the user, with a default setting of 21 periods.
3. Average True Range (ATR): The ATR is calculated with a default length of 14 periods and is used in determining the support and resistance levels.
4. Buy/Sell Signals: The indicator provides buy and sell signals when the price hits the defined support or resistance levels. These signals are represented by X-shapes plotted on the chart, with green indicating a hit on support (buy signal), and red indicating a hit on resistance (sell signal).
5. Trend Strength Analysis: It uses a unique combination of technical indicators like MACD, RSI, Velocity, CCI, Stochastic, and a custom trend strength indicator. The settings for each of these indicators can be customized according to user preference.
6. Bull/Bear Tug of War: This feature paints the little triangles green if the majority of the indicators are bullish, and red if the majority are bearish. This is a powerful feature to visualize the overall market sentiment.
7. Buy/Sell Alert: The script generates alerts for potential buy and sell signals. Alerts contain information about the signal type, ticker symbol, and current price.
8. Plot EMA Line: This indicator includes an option to display an additional EMA line on the chart, which can be toggled on or off as per the user's choice.
How to use it:
You basically need to master riding this machine. There are a lot of conditions that have been added to make sure novice traders do not make a mistake. The image below shows how to use the indicator. Pay attention to colors:
Longer time frame you should pay attention to the EMA lines and over bought and oversold levels in the optimizers. here is an example:
And another example on 15 min timeframe:
On top of all the above, this indicator has a built-in advanced support and resistance tool that dynamically identifies pivot points and their corresponding support and resistance zones based on the historical data of a given asset. So what this means is that you should ignore a buy signal very close to a resistance and only enter when the resistance is broken.
Here are the configurable support and resistance parameters:
1. Pivot Period : The period considered for pivot detection. The range is between 4 to 30 days with a default value of 25.
2. Source: The price point to be used as the source for pivot detection. You can choose between 'High/Low' and 'Close/Open'.
3. Maximum Number of Pivot: This defines the maximum number of pivot points that the algorithm will store. This can be anywhere from 5 to 100, with 45 as the default value.
4. Maximum Channel Width % : This sets the maximum width of the support/resistance channel as a percentage. Minimum value is 1, with a default value of 10. Higher numbers capture longer timeframe and lower number shorter timeframes. For scalping use 5 or 8 for swing use 12 or 14.
5. Maximum Number of Lines: This sets the maximum number of support/resistance lines displayed on the chart. It ranges from 1 to 15 with a default of 10.
6. Minimum Strength: This is the minimum strength of the support or resistance line, defined by the number of times price touches it. It ranges from 1 to 10 with a default of 2.
7. Line Style: This option allows the user to choose the line style between 'Solid', 'Dotted', and 'Dashed'.
8. Line Width: This allows users to choose the width of the line ranging from 1 to 4.
9. Resistance Color and Support Color: These define the colors for the resistance and support lines.
The script also includes functions to calculate if the price has crossed over or under a support or resistance line.
The S/R assist uses these inputs to calculate pivot highs and lows, create support and resistance zones, and plot these on the chart. When the price crosses a support or resistance line, the script can identify this as a possible trading signal. The lines' strengths are also calculated, and only those with strengths above the user-defined minimum are drawn on the chart.

D-Bot Alpha All in One BarsThis indicator, known as "D-Bot Alpha All in One Bars," combines various technical analysis methodologies. It amalgamates a range of oscillator-based and moving average-based measures to determine the 'strength' or 'effectiveness' of a particular bar. This could potentially provide investors with an idea of the direction the market is moving.
Each indicator (such as RSI, Stochastic, WPR, MFI, CCI, ADX, RVI, and Volatility) measures a different market condition, and these conditions are combined to form an overall 'bar strength' value. This value is color-coded based on set threshold values (Lower Threshold and Upper Threshold) to indicate a bullish (green) and bearish (red) market condition.
4h
*The indicator works best on timeframes of 4 hours and below. For higher timeframes, you'll need to perform optimization.
The strength of this indicator lies in its ability to provide a broad market view by combining a range of analytical methods. However, its weakness is that each measurement carries equal weight, which can sometimes result in misleading signals.
15m
This indicator is typically used in conjunction with other technical analysis tools. For example, tools that provide a broader market structure, such as trend lines, support and resistance levels, or Fibonacci retracement levels, can be used alongside this indicator.
5m
An example trading strategy could involve monitoring the bar strength of the indicator and making buy trades during green (bullish) bars and sell trades during red (bearish) bars. However, as always, it's important to thoroughly test any trading strategy before implementing it.
***Please follow my profile to access indicators full of original ideas. Happy trading...
1m
Türkçe açıklama:
"D-Bot Alpha All in One Bars" indikatörü çok çeşitli teknik analiz metodolojilerini bir araya getiriyor. İndikatör, bir dizi farklı osilatör ve hareketli ortalama tabanlı ölçütü birleştirerek, belirli bir barın 'gücünü' veya 'etkililiğini' belirlemek için kullanılıyor. Bu, potansiyel olarak yatırımcılara marketin hangi yönde ilerlemek istediğine dair bir fikir verebilir.
Her bir gösterge (RSI, Stokastik, WPR, MFI, CCI, ADX, RVI ve volatilite gibi) kendi başına farklı bir piyasa durumunu ölçüyor ve bu durumlar birleştirilerek genel bir 'bar gücü' değeri elde ediliyor. Bu değer, belirlenen eşik değerlere (Lower Threshold ve Upper Threshold) göre renklendirilerek piyasada bir yükseliş (yeşil) veya düşüş (kırmızı) durumu gösteriyor.
Bu indikatörün güçlü yönleri, bir dizi farklı analitik yöntemi bir araya getirerek geniş bir piyasa görünümü sağlamasıdır. Ancak zayıf yanı, her bir ölçütün ağırlığının eşit olduğu ve bazen yanıltıcı sinyaller verebilecek olmasıdır.
Bu indikatör genellikle diğer teknik analiz araçlarıyla birlikte kullanılmalıdır. Örneğin, eğilim çizgileri, destek ve direnç seviyeleri veya Fibonacci retracement seviyeleri gibi daha genel piyasa yapısı araçları bu indikatörle birlikte kullanılabilir.
Örnek bir işlem stratejisi olarak, indikatörün bar gücünü gözlemleyebilir ve yeşil (yükseliş) barlar sırasında alım, kırmızı (düşüş) barlar sırasında satış yapabilirsiniz. Ancak, her zaman olduğu gibi, herhangi bir trade stratejisi belirlenmeden önce dikkatli bir şekilde test etmek önemlidir.
Sniffer
╭━━━╮╱╱╱╱╭━╮╭━╮
┃╭━╮┃╱╱╱╱┃╭╯┃╭╯
┃╰━━┳━╮╭┳╯╰┳╯╰┳━━┳━╮
╰━━╮┃╭╮╋╋╮╭┻╮╭┫┃━┫╭╯
┃╰━╯┃┃┃┃┃┃┃╱┃┃┃┃━┫┃
╰━━━┻╯╰┻╯╰╯╱╰╯╰━━┻╯
Overview
A vast majority of modern data analysis & modelling techniques rely upon the idea of hidden patterns, wether it is some type of visualisation tool or some form of a complex machine learning algorithm, the one thing that they have in common is the belief, that patterns tell us what’s hidden behind plain numbers. The same philosophy has been adopted by many traders & investors worldwide, there’s an entire school of thought that operates purely based on chart patterns. This is where Sniffer comes in, it is a tool designed to simplify & quantify the job of pattern recognition on any given price chart, by combining various factors & techniques that generate high-quality results.
This tool analyses bars selected by the user, and highlights bar clusters on the chart that exhibit similar behaviour across multiple dimensions. It can detect a single candle pattern like hammers or dojis, or it can handle multiple candles like morning/evening stars or double tops/bottoms, and many more. In fact, the tool is completely independent of such specific candle formations, instead, it works on the idea of vector similarity and generates a degree of similarity for every single combination of candles. Only the top-n matches are highlighted, users get to choose which patterns they want to analyse and to what degree, by customising the feature-space.
Background
In the world of trading, a common use-case is to scan a price chart for some specific candlestick formations & price structures, and then the chart is further analysed in reference to these events. Traders are often trying to answer questions like, when was the last time price showed similar behaviour, what are the instances similar to what price is doing right now, what happens when price forms a pattern like this, what were some of other indicators doing when this happened last(RSI, CCI, ADX etc), and many other abstract ideas to have a stronger confluence or to confirm a bias.Having such a context can be vital in making better informed decisions, but doing this manually on a chart that has thousands of candles can have many disadvantages. It’s tedious, human errors are rather likely, and even if it’s done with pin-point accuracy, chances are that we’ll miss out on many pieces of information. This is the thought that gave birth to Sniffer .
Sniffer tries to provide a general solution for pattern-based analysis by deploying vector-similarity computation techniques, that cover the full-breadth of a price chart and generate a list of top-n matches based on the criteria selected by the user. Most of these techniques come from the data science space, where vector similarity is often implemented to solve classification & clustering problems. Sniffer uses same principles of vector comparison, and computes a degree of similarity for every single candle formation within the selected range, and as a result generates a similarity matrix that captures how similar or dissimilar a set of candles is to the input set selected by the user.
How It Works
A brief overview of how the tool is implemented:
- Every bar is processed, and a set of features are mapped to it.
- Bars selected by the user are captured, and saved for later use.
- Once the all the bars have been processed, candles are back-tracked and degree of similarity is computed for every single bar(max-limit is 5000 bars).
- Degree of similarity is computed by comparing attributes like price range, candle breadth & volume etc.
- Similarity matrix is sorted and top-n results are highlighted on the chart through boxes of different colors.
A brief overview of the features space for bars:
- Range: Difference between high & low
- Body: Difference between close & open
- Volume: Traded volume for that candle
- Head: Upper wick for green candles & lower wick for red candles
- Tail: Lower wick for green candles & upper wick for red candles
- BTR: Body to Range ratio
- HTR: Head to Range ratio
- TTR: Tail to Range ratio
- HTB: Head to Body ratio
- TTB: Tail to Body ratio
- ROC: Rate of change for HL2 for four different periods
- RSI: Relative Strength Index
- CCI: Commodity Channel Index
- Stochastic: Stochastic Index
- ADX: DMI+, DMI- & ADX
A brief overview of how degree of similarity is calculated:
- Each bar set is compared to the inout bar set within the selected feature space
- Features are represented as vectors, and distance between the vectors is calculated
- Shorter the distance, greater the similarity
- Different distance calculation methods are available to choose from, such as Cosine, Euclidean, Lorentzian, Manhattan, & Pearson
- Each method is likely to generate slightly different results, users are expected to select the method & the feature space that best fits their use-case
How To Use It
- Usage of this tool is relatively straightforward, users can add this indicator to their chart and similar clusters will be highlighted automatically
- Users need to select a time range that will be treated as input, and bars within that range become the input formation for similarity calculations
- Boxes will be draw around the clusters that fit the matching criteria
- Boxes are color-coded, green color boxes represent the top one-third of the top-n matches, yellow boxes represent the middle third, red boxes are for bottom third, and white box represents user-input
- Boxes colors will be adjusted as you adjust input parameters, such as number of matches or look-back period
User Settings
Users can configure the following options:
- Select the time-range to set input bars
- Select the look-back period, number of candles to backtrack for similarity search
- Select the number of top-n matches to show on the chart
- Select the method for similarity calculation
- Adjust the feature space, this enables addition of custom features, such as pattern recognition, technical indicators, rate of change etc
- Toggle verbosity, shows degree of similarity as a percentage value inside the box
Top Features
- Pattern Agnostic: Designed to work with variable number of candles & complex patterns
- Customisable Feature Space: Users get to add custom features to each bar
- Comprehensive Comparison: Generates a degree of similarity for all possible combinations
Final Note
- Similarity matches will be shown only within last 4500 bars.
- In theory, it is possible to compute similarity for any size candle formations, indicator has been tested with formations of 50+ candles, but it is recommended to select smaller range for faster & cleaner results.
- As you move to smaller time frames, selected time range will provide a larger number of candles as input, which can produce undesired results, it is advised to adjust your selection when you change time frames. Seeking suggestions on how to directly receive bars as user input, instead of time range.
- At times, users may see array index out of bound error when setting up this indicator, this generally happens when the input range is not properly configured. So, it should disappear after you select the input range, still trying to figure out where it is coming from, suggestions are welcome.
Credits
- @HeWhoMustNotBeNamed for publishing such a handy PineScript Logger, it certainly made the job a lot easier.

Typical Price Difference - TPD © with reversal zones and signalsv1.0 NOTE: The maths have been tested only for BTC and weekly time frame.
This is a concept that I came through after long long hours of VWAP trading and scalping.
The idea is pretty simple:
1) Typical Price is calculated by (h+l+c) / 3. If we take this price and adjust it to volume we get the VWAP value. The difference between this value and the close value, i call it " Typical Price Difference - TPD ".
2) We get the Historical Volatility as calculated by TradingView script and we add it up to TPD and divide it by two (average). This is what I call " The Source - TS ".
3) We apply the CCI formula to TS .
4) We calculate the Rate of Change (roc) of the CCI formula.
5) We apply the VIX FIX of Larry Williams (script used is from ChrisMoody - CM_Williams_Vix_Fix Finds Market Bottoms) *brilliant script!!!
How to use it:
a) When the (3) is over the TPD we have a bullish bias (green area). When it's under we have a bearish bias (red area).
b) If the (1) value goes over or under a certain value (CAUTION!!! it varies in different assets or timeframes) we get a Reversal Zone (RZ). Red/Green background.
c) If we are in a RZ and the VIX FIX gives a strong value (look for green bars in histogram) and roc (4) goes in the opposite direction, we get a reversal signal that works for the next week(s).
I applied this to BTC on a weekly time frame and after some corrections, it gives pretty good reversal zones and signals. Especially bottoms. Also look for divergences in the zones/signals.
As I said I have tested and confirmed it only on BTC/weekly. I need more time with the maths and pine to automatically adjust it to other time frames. You can play with it in different assets or time frames to find best settings by hand.
Feel free to share your thoughts or ideas on this.
P.S. I realy realy realy try to remember when or how or why I came up with the idea to combine typical price with historical volatility and CCI. I can't! It doesn't make any sense LOL

Lorentzian ML [Sublime Traders]Lorentzian ML
Context: The whole idea of this indicator is to use the Lorentzian Classifier (a popular machine learning model suited for analyzing data in a time series) , add some oscillators and filter them with volume averages in order to get precise swing move indications.
The Lorentzian ML indicator uses the Lorenzian Classifier (LDC) algorithm that takes into account the Commodity Channel Index (CCI) and Relative Strength Index (RSI) signals as raw material to provide buy and sell signals. The indicator is accompanied by take profit , stop loss and entry lines based on the Average True Range (ATR).
Features:
1. Lorentzian Classifier:
Uses the difference between the current and previous values of CCI and RSI to generate buy and sell signals.
The classifier threshold can be adjusted using the input parameter.
2. ATR-based Take Profit Line:
A horizontal take profit line is plotted when buy or sell signals occur.
The line is based on the ATR value and a user-defined multiplier.
3. VMA filtering
Using the simple switches: Scalper, Swing or Holder , the users can easily filter the frequency of the signals in addition to the lookback and threshold filters. This will affect the used VMA lines that use data gathered from multiple timeframes.
Visual Representation:
The indicator plots green candles for buy signals and red candles for sell signals.
Buy and sell labels are displayed on the chart to mark the points where signals occur.
The ATR-based take profit line is displayed in a user-defined color and line width.
Visual representation of the VMA lines : Red - bearish , Blue - uncertain , Green - bullish
Changes and features to come
Fix "holder" switch on sell side that sometimes bugs the whole chart.
Add more intuitive filtering methods.
Add two more oscillators to the Lorentzian pool.
Create switches for Lorentzian source.
MA (%) - Moving Average Percentage [HODLER]This indicator computes and indicates the average distance between the source and moving average, based on previous uptrend and downtrend reversals.
Firstly, this indicator offers three inputs: ma type, length, and source. These inputs allow you to customize the length, type, and source of the moving average used in the calculation.
Following this, you can select an offset percentage and a lookback value. The offset percentage enables you to fine-tune the automatically calculated distances, and only operates if the above and below percentages have not been set manually. The lookback value determines the number of highs and lows that are taken into account when calculating the averages.
Lastly, to filter out noise in the results, you can enable and adjust the Commodity Channel Index (CCI). The CCI has been normalized between 0 and 100 and oscillates around a zero line, making it a valuable tool for filtering out noise and more accurately depicting the average percentage changes within the overbought and oversold conditions.
The indicator plots the average distances in blue when the conditions of the settings are met. If the average is below, it is shown in blue, and if it is above, it is shown in yellow. The green and red colors represent whether the trend, based on the moving average, is rising or falling.
The attached chart is merely an example, and the indicator can be fully optimized when you have selected the appropriate moving average and offset percentages. These values may differ across different timeframes, and it is essential to set the right values for each timeframe.
It is worth noting that this indicator is specifically designed to identify tops and bottoms. However, it is important to keep in mind that no indicator can guarantee 100% accuracy, and the market can always behave unpredictably with unexpected price movements. Despite this, the indicator can be a useful tool when utilized in combination with other indicators.
Please don't hesitate to reach out if you have any questions or suggestions regarding this indicator.

Trend Indicator with RSI and Fibbonacci Band 0.702 crossingsToday we have a new Indicator set, which I created using inspiration from the Trend Magic Indicator from KivancOzbilgic and adding several new aspects to it and a slightly modified calculation of the trend indicator itself.
You can change the inputs by changing the pre set values in the settings, but I found the current settings quite accurate. Feel free to experiment to fine tune the indicators.
Here are the details of the script:
Trend indicated within candles and as a line
- bullish and bearish trends are now also indicated within the candle based on the CCI calculation.
- Bullish is indicated by a green circle below the candle or as one may call it a "dot"
- bearish trend is indicated by a red circle above the candle
Entry Signal based on RSI crossing its EMA
- my motivation was to have a clearer entry signal besides highlighting a trend, which can not really be used to identify a good entry but to give confidence or when loosing trend to give an exit signal.
- after studiying the RSI and how it works together with its EMA it looks quite interesting as an entry or exit signal. But be cautios if the EMA and RSI values are moving in a narrow area we get a lot of crosses and therefore signals which should rather be ignored rather to be act on. So the the range where the cross happens is also quite important. But this aspect is not yet reflected as a rule/ logic.
But I am thinking of adding something.. or alternativly best to switch to another timeframe to get some better data
RSI overbought and oversold as Diamonds
- I also added key indications of oversold or overbought as Blue and Pink diamonds, can be considered as additional information to maybe identify a short term top or bottom.. but its not very accurate.
Entry signal based on crossing Fibbonachi Band 0.702
- So far the 0.702 seems to be quite an interesting retracement level which seems to be met a lot of times
- based on the assumption the price will evantually hit the 0.702 either direction I wanted to get a signal when this happens
- BUT! a big but, unfortunalty the Fibbonachi bands tend to bloat up in case of high volatility so it is not easy to find the crossing on higher timeframes
Here are the standard value which I found quite accurate for the assets I use this indicator set:
CCI Period = 5
ATR Multiplier = 1
ATR Period = 1
Source = High Low Close (hlc3 average value of the candle
Here the inputs used for the RSI Crossing signal (here you should play around a little to see which entry would have been best..)
RSI Length = 14
RSI Oversold = 25 (to be used for the "golden" entry signal based on the FBB crossing)
RSI Overbought = 80 (to be used for the "golden" entry signal based on the FBB crossing)
RSI Moving Average Length
In future versions I will add options to activate or deactive some of the plotting and espacially this golden dot when the fibbonachi band is being crossed needs some fine tuning..
And lets see if there is a way to fix the bloating of those bands..
DANIEL AGA INDICATOR BBThis is a custom trading indicator that combines several popular technical indicators such as EMA (exponential moving average), CCI (commodity channel index), RSI (relative strength index), MFI (money flow index), High-Low Bars, and ATR (average true range). This indicator can be used to identify buying and selling opportunities in the digital currency market. The code presented is an implementation of this indicator in the PineScript programming language, used on trading platforms. Users can customize the indicator by entering different values for different parameters (such as the EMA period, CCI, RSI, MFI thresholds, etc.). The indicator will display buy or sell signals through rectangle labels and can be set to generate alerts if trading opportunities are detected.

MLExtensionsLibrary "MLExtensions"
normalizeDeriv(src, quadraticMeanLength)
Returns the smoothed hyperbolic tangent of the input series.
Parameters:
src : The input series (i.e., the first-order derivative for price).
quadraticMeanLength : The length of the quadratic mean (RMS).
Returns: nDeriv The normalized derivative of the input series.
normalize(src, min, max)
Rescales a source value with an unbounded range to a target range.
Parameters:
src : The input series
min : The minimum value of the unbounded range
max : The maximum value of the unbounded range
Returns: The normalized series
rescale(src, oldMin, oldMax, newMin, newMax)
Rescales a source value with a bounded range to anther bounded range
Parameters:
src : The input series
oldMin : The minimum value of the range to rescale from
oldMax : The maximum value of the range to rescale from
newMin : The minimum value of the range to rescale to
newMax : The maximum value of the range to rescale to
Returns: The rescaled series
color_green(prediction)
Assigns varying shades of the color green based on the KNN classification
Parameters:
prediction : Value (int|float) of the prediction
Returns: color
color_red(prediction)
Assigns varying shades of the color red based on the KNN classification
Parameters:
prediction : Value of the prediction
Returns: color
tanh(src)
Returns the the hyperbolic tangent of the input series. The sigmoid-like hyperbolic tangent function is used to compress the input to a value between -1 and 1.
Parameters:
src : The input series (i.e., the normalized derivative).
Returns: tanh The hyperbolic tangent of the input series.
dualPoleFilter(src, lookback)
Returns the smoothed hyperbolic tangent of the input series.
Parameters:
src : The input series (i.e., the hyperbolic tangent).
lookback : The lookback window for the smoothing.
Returns: filter The smoothed hyperbolic tangent of the input series.
tanhTransform(src, smoothingFrequency, quadraticMeanLength)
Returns the tanh transform of the input series.
Parameters:
src : The input series (i.e., the result of the tanh calculation).
smoothingFrequency
quadraticMeanLength
Returns: signal The smoothed hyperbolic tangent transform of the input series.
n_rsi(src, n1, n2)
Returns the normalized RSI ideal for use in ML algorithms.
Parameters:
src : The input series (i.e., the result of the RSI calculation).
n1 : The length of the RSI.
n2 : The smoothing length of the RSI.
Returns: signal The normalized RSI.
n_cci(src, n1, n2)
Returns the normalized CCI ideal for use in ML algorithms.
Parameters:
src : The input series (i.e., the result of the CCI calculation).
n1 : The length of the CCI.
n2 : The smoothing length of the CCI.
Returns: signal The normalized CCI.
n_wt(src, n1, n2)
Returns the normalized WaveTrend Classic series ideal for use in ML algorithms.
Parameters:
src : The input series (i.e., the result of the WaveTrend Classic calculation).
n1
n2
Returns: signal The normalized WaveTrend Classic series.
n_adx(highSrc, lowSrc, closeSrc, n1)
Returns the normalized ADX ideal for use in ML algorithms.
Parameters:
highSrc : The input series for the high price.
lowSrc : The input series for the low price.
closeSrc : The input series for the close price.
n1 : The length of the ADX.
regime_filter(src, threshold, useRegimeFilter)
Parameters:
src
threshold
useRegimeFilter
filter_adx(src, length, adxThreshold, useAdxFilter)
filter_adx
Parameters:
src : The source series.
length : The length of the ADX.
adxThreshold : The ADX threshold.
useAdxFilter : Whether to use the ADX filter.
Returns: The ADX.
filter_volatility(minLength, maxLength, useVolatilityFilter)
filter_volatility
Parameters:
minLength : The minimum length of the ATR.
maxLength : The maximum length of the ATR.
useVolatilityFilter : Whether to use the volatility filter.
Returns: Boolean indicating whether or not to let the signal pass through the filter.
backtest(high, low, open, startLongTrade, endLongTrade, startShortTrade, endShortTrade, isStopLossHit, maxBarsBackIndex, thisBarIndex)
Performs a basic backtest using the specified parameters and conditions.
Parameters:
high : The input series for the high price.
low : The input series for the low price.
open : The input series for the open price.
startLongTrade : The series of conditions that indicate the start of a long trade.`
endLongTrade : The series of conditions that indicate the end of a long trade.
startShortTrade : The series of conditions that indicate the start of a short trade.
endShortTrade : The series of conditions that indicate the end of a short trade.
isStopLossHit : The stop loss hit indicator.
maxBarsBackIndex : The maximum number of bars to go back in the backtest.
thisBarIndex : The current bar index.
Returns: A tuple containing backtest values
init_table()
init_table()
Returns: tbl The backtest results.
update_table(tbl, tradeStatsHeader, totalTrades, totalWins, totalLosses, winLossRatio, winrate, stopLosses)
update_table(tbl, tradeStats)
Parameters:
tbl : The backtest results table.
tradeStatsHeader : The trade stats header.
totalTrades : The total number of trades.
totalWins : The total number of wins.
totalLosses : The total number of losses.
winLossRatio : The win loss ratio.
winrate : The winrate.
stopLosses : The total number of stop losses.
Returns: Updated backtest results table.

MAGISTR Binary 3 EURUSD 1min The indicator is designed for use in binary options trading.
Designed for TF 1 minute, EURUSD pair (tested on Currency.com exchange instrument).
When the rules of the internal algorithm are triggered, the indicator generates a signal with the probable movement of the instrument on the next bar:
if a green bar appears at the bottom of the bar, it means that the indicator assumes that the next bar should close at a positive price growth value (it will be green) and vice versa, if a red bar appears at the bottom of the bar, then the indicator assumes that the next bar should close at a negative price growth value( will be red), the indicator also generates appropriate alerts about the expected price movement on the next bar.
In addition, the indicator counts the signals issued by it and the success of its processing for the period of time available in TradingView.
This indicator uses a set of values of such basic indicators as:
- Stochastic RSI;
- Bollinger Bands;
- Profile of Volumes;
- CCI;
- ADX;
- momentum;
and others.
I left all the settings "open", so it is quite possible, by slightly changing the parameters, to adjust it to another pair or time frame.
==========================================================================================================================
Индикатор разработан для применения в торговле на бинарных опционах.
Разработан для ТФ 1 минута, пара EURUSD (оттестирован на показателях инструмента биржи Currency.com).
При сработке правил внутреннего алгоритма - индикатор выдает сигнал с вероятным движением инструмента на следующем баре :
если появилась зеленая полоса внизу бара - значит индикатор предполагает, что следующий бар должен закрыться в положительном значении роста цены ( будет зеленым) и наоборот, если появилась красная полоса внизу бара - значит индикатор предполагает, что следующий бар должен закрыться в отрицательном значении роста цены( будет красным) , также индикатор выдает соответствующее оповещения о предполагаемом им движении цены на следующем баре.
Кроме того индикатором ведется подсчета выданных им сигналов и и успеха его отработки за доступный в TradingView период времени.
В данном индикаторе используются комплекс значений таких базовых индикаторов, как:
- Stochastic RSI;
- Bollindgers Bands;
- Profile of Volumes;
- CCI ;
- ADX;
- Momentum ;
и прочие.
Все настройки оставил "открытыми", так что его вполне можно, немного изменив параметры, подстроить под другую пару или тайм-фрейм.

Commodity Channel Relative StrengthNew concept(I think atleast) I've joined the Standard RSI and CCI at the hip with another plotcandle, which gives a picture of a larger candle With more interesting movement imo. Includes Fib Retracement Levels, High/Low and a couple of coppock curves for more confirmation. Broadening candles seem to indicate a weakening of trend strength (from what i've seen atleast) although exceptions do occur. Vice versa for tapering to a lesser degree I imagine. RSI has been shifted down to 0 to align the center point with the CCI , so the usual 30/70 RSI Levels are now -20/20 (although I have 30/-30 instead for the hlines).
