[Mustang Algo] Channel Strategy# Mustang Algo Channel Strategy - Universal Market Sentiment Oscillator
## 🎯 ORIGINAL CONCEPT
This strategy employs a unique market sentiment oscillator that works on ALL financial assets. It uses Bitcoin supply dynamics combined with stablecoin market capitalization as a macro sentiment indicator to generate universal timing signals across stocks, forex, commodities, indices, and cryptocurrencies.
## 🌐 UNIVERSAL APPLICATION
- **Any Asset Class:** Stocks, Forex, Commodities, Indices, Crypto, Bonds
- **Market-Wide Timing:** BTC/Stablecoin ratio serves as a global risk sentiment gauge
- **Cross-Market Signals:** Trade any instrument using macro liquidity conditions
- **Ecosystem Approach:** One oscillator for all financial markets
## 🧮 METHODOLOGY
**Core Calculation:** BTC Supply / (Combined Stablecoin Market Cap / BTC Price)
- **Data Sources:** DAI + USDT + USDC market capitalizations
- **Signal Generation:** RSI(14) applied to the ratio, double-smoothed with WMA
- **Timing Logic:** Crossover signals filtered by overbought/oversold zones
- **Multi-Timeframe:** Configurable timeframe analysis (default: Daily)
## 📈 TRADING STRATEGY
**LONG Entries:** Bullish crossover when market sentiment is oversold (<48)
**SHORT Entries:** Bearish crossover when market sentiment is overbought (>55)
**Universal Timing:** These macro signals apply to trading any financial instrument
## ⚙️ FLEXIBLE RISK MANAGEMENT
**Three SL/TP Calculation Modes:**
- **Percentage Mode:** Traditional % based (4% SL, 12% TP default)
- **Ticks Mode:** Precise tick-based calculation (50/150 ticks default)
- **Pips Mode:** Forex-style pip calculation (50/150 pips default)
**Realistic Parameters:**
- Commission: 0.1% (adjustable for different asset classes)
- Slippage: 2 ticks
- Position sizing: 10% of equity (conservative)
- No pyramiding (single position management)
## 📊 KEY ADVANTAGES
✅ **Universal Application:** One strategy for all asset classes
✅ **Macro Foundation:** Based on global liquidity and risk sentiment
✅ **False Signal Filtering:** Overbought/oversold zones reduce noise
✅ **Flexible Risk Management:** Multiple SL/TP calculation methods
✅ **No Lookahead Bias:** Clean backtesting with realistic results
✅ **Cross-Market Correlation:** Captures broad market risk cycles
## 🎛️ CONFIGURATION GUIDE
1. **Asset Selection:** Apply to stocks, forex, commodities, indices, crypto
2. **Timeframe Setup:** Daily recommended for swing trading
3. **Sentiment Bounds:** Adjust 48/55 levels based on market volatility
4. **Risk Management:** Choose appropriate SL/TP mode for your asset class
5. **Direction Filter:** Select Long Only, Short Only, or Both
## 📋 BACKTESTING STANDARDS
**Compliant with TradingView Guidelines:**
- ✅ Realistic commission structure (0.1% default)
- ✅ Appropriate slippage modeling (2 ticks)
- ✅ Conservative position sizing (10% equity)
- ✅ Sustainable risk ratios (1:3 SL/TP)
- ✅ No lookahead bias (proper historical simulation)
- ✅ Sufficient sample size potential (100+ trades possible)
## 🔬 ORIGINAL RESEARCH
This strategy introduces a revolutionary approach to financial markets by treating the BTC/Stablecoin ratio as a global risk sentiment gauge. Unlike traditional indicators that analyze individual asset price action, this oscillator captures macro liquidity flows that affect ALL financial markets - from stocks to forex to commodities.
## 🎯 MARKET APPLICATIONS
**Stocks & Indices:** Risk-on/risk-off sentiment timing
**Forex:** Global liquidity flow analysis for major pairs
**Commodities:** Risk appetite for inflation hedges
**Bonds:** Flight-to-safety vs. risk-seeking behavior
**Crypto:** Native application with direct correlation
## ⚠️ RISK DISCLOSURE
- Designed for intermediate to long-term trading across all timeframes
- Market sentiment can remain extreme longer than expected
- Always use appropriate position sizing for your specific asset class
- Adjust commission and slippage settings for different markets
- Past performance does not guarantee future results
## 🚀 INNOVATION SUMMARY
**What makes this strategy unique:**
- First to use BTC/Stablecoin ratio as universal market sentiment indicator
- Applies macro-economic principles to technical analysis across all assets
- Single oscillator provides timing signals for entire financial ecosystem
- Bridges traditional finance with digital asset insights
- Combines fundamental liquidity analysis with technical precision
Cari dalam skrip untuk "Cycle"

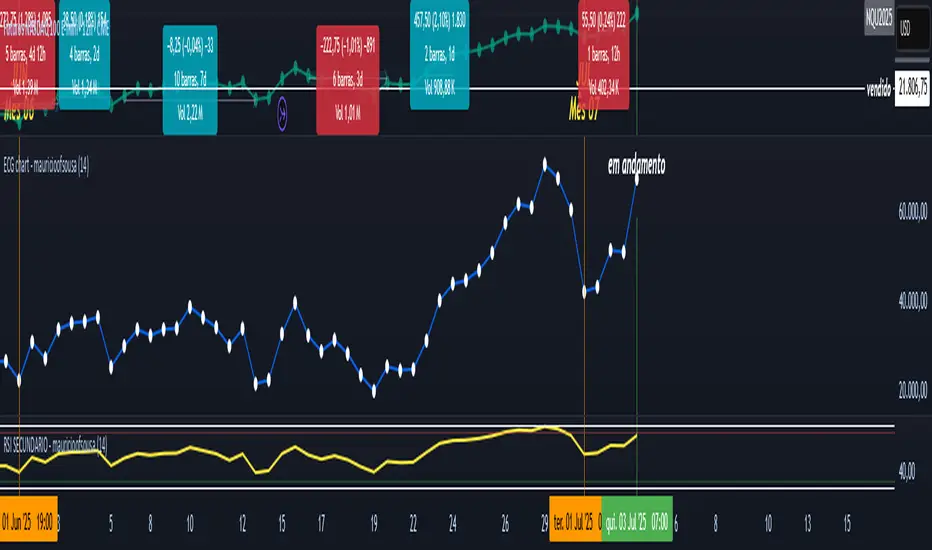
RSI - PRIMARIO -mauricioofsousa
MGO Primary – Matriz Gráficos ON
The Blockchain of Trading applied to price behavior
The MGO Primary is the foundation of Matriz Gráficos ON — an advanced graphical methodology that transforms market movement into a logical, predictable, and objective sequence, inspired by blockchain architecture and periodic oscillatory phenomena.
This indicator replaces emotional candlestick reading with a mathematical interpretation of price blocks, cycles, and frequency. Its mission is to eliminate noise, anticipate reversals, and clearly show where capital is entering or exiting the market.
What MGO Primary detects:
Oscillatory phenomena that reveal the true behavior of orders in the book:
RPA – Breakout of Bullish Pivot
RPB – Breakout of Bearish Pivot
RBA – Sharp Bullish Breakout
RBB – Sharp Bearish Breakout
Rhythmic patterns that repeat in medium timeframes (especially on 12H and 4H)
Wave and block frequency, highlighting critical entry and exit zones
Validation through Primary and Secondary RSI, measuring the real strength behind movements
Who is this indicator for:
Traders seeking statistical clarity and visual logic
Operators who want to escape the subjectivity of candlesticks
Anyone who values technical precision with operational discipline
Recommended use:
Ideal timeframes: 12H (high precision) and 4H (moderate intensity)
Recommended assets: indices (e.g., NASDAQ), liquid stocks, and futures
Combine with: structured risk management and macro context analysis
Real-world performance:
The MGO12H achieved a 92% accuracy rate in 2025 on the NASDAQ, outperforming the average performance of major global quantitative strategies, with a net score of over 6,200 points for the year.
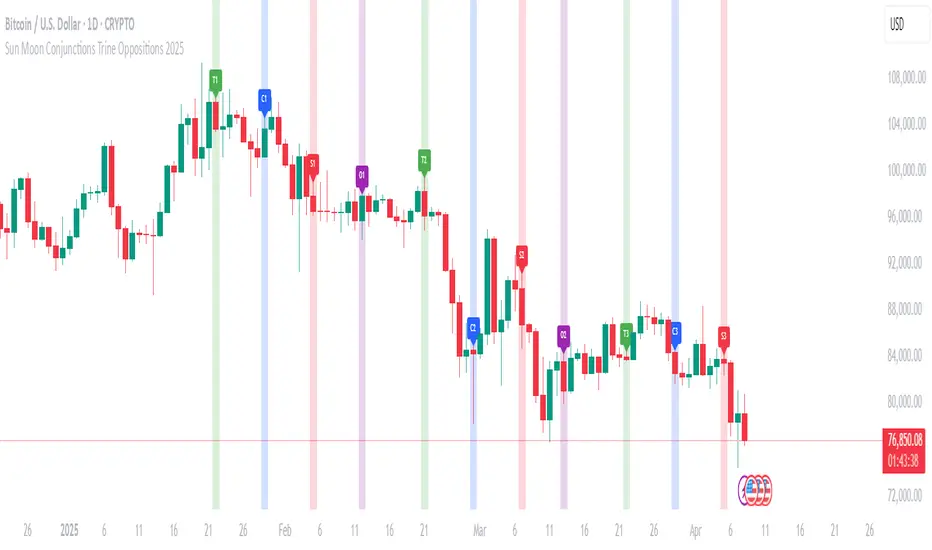
Sun Moon Conjunctions Trine Oppositions 2025this script is an astrological tool designed to overlay significant Sun-Moon aspect events for 2025 on a Bitcoin chart. It highlights key lunar phases and aspects—Conjunctions (New Moon) in blue, Squares in red, Oppositions (Full Moon) in purple, and Trines in green—using background colors and labeled markers. Users can toggle visibility for each aspect type and adjust label sizes via customizable inputs. The script accurately marks events from January through December 2025, with labels appearing once per event, making it a valuable resource for exploring potential correlations between lunar cycles and Bitcoin price movements.
Planetary Retrograde DashboardThe Retrograde Dashboard offers a quick overview of all planets and their historical and current retrograde statuses across various time frames.
How This Indicator Works
Custom Overlay: The indicator displays its own overlay, plotting the periods of planetary retrograde. This enables users to visually track all planetary retrogrades over time, both historically and in real-time.
When a planet is in retrograde, its symbol will show the ℞ retrograde symbol next to it.
When a planet is in direct motion, only the planetary symbol is visible.
The indicator adapts to different timeframes, allowing you to analyze whether a planet was in retrograde at any specific moment.
What is Retrograde Motion?
In astrology and astro-finance, retrograde motion occurs when a planet seems to move backward in the sky from Earth's perspective. Although this is an optical illusion due to differences in orbital speeds, many traders and analysts believe that planetary retrogrades can influence market behavior. Retrogrades are often linked with reassessment, reversals, and shifts in momentum, making them valuable for both historical and predictive market analysis.
Research & Discovery – Compare planetary retrograde cycles with historical market behavior to identify potential correlations.
Created using Astrolib by @BarefootJoey

[COG] Adaptive Squeeze Intensity 📊 Adaptive Squeeze Intensity (ASI) Indicator
🎯 Overview
The Adaptive Squeeze Intensity (ASI) indicator is an advanced technical analysis tool that combines the power of volatility compression analysis with momentum, volume, and trend confirmation to identify high-probability trading opportunities. It quantifies the degree of price compression using a sophisticated scoring system and provides clear entry signals for both long and short positions.
⭐ Key Features
- 📈 Comprehensive squeeze intensity scoring system (0-100)
- 📏 Multiple Keltner Channel compression zones
- 📊 Volume analysis integration
- 🎯 EMA-based trend confirmation
- 🎨 Proximity-based entry validation
- 📱 Visual status monitoring
- 🎨 Customizable color schemes
- ⚡ Clear entry signals with directional indicators
🔧 Components
1. 📐 Squeeze Intensity Score (0-100)
The indicator calculates a total squeeze intensity score based on four components:
- 📊 Band Convergence (0-40 points): Measures the relationship between Bollinger Bands and Keltner Channels
- 📍 Price Position (0-20 points): Evaluates price location relative to the base channels
- 📈 Volume Intensity (0-20 points): Analyzes volume patterns and thresholds
- ⚡ Momentum (0-20 points): Assesses price momentum and direction
2. 🎨 Compression Zones
Visual representation of squeeze intensity levels:
- 🔴 Extreme Squeeze (80-100): Red zone
- 🟠 Strong Squeeze (60-80): Orange zone
- 🟡 Moderate Squeeze (40-60): Yellow zone
- 🟢 Light Squeeze (20-40): Green zone
- ⚪ No Squeeze (0-20): Base zone
3. 🎯 Entry Signals
The indicator generates entry signals based on:
- ✨ Squeeze release confirmation
- ➡️ Momentum direction
- 📊 Candlestick pattern confirmation
- 📈 Optional EMA trend alignment
- 🎯 Customizable EMA proximity validation
⚙️ Settings
🔧 Main Settings
- Base Length: Determines the calculation period for main indicators
- BB Multiplier: Sets the Bollinger Bands deviation multiplier
- Keltner Channel Multipliers: Three separate multipliers for different compression zones
📈 Trend Confirmation
- Four customizable EMA periods (default: 21, 34, 55, 89)
- Optional trend requirement for entry signals
- Adjustable EMA proximity threshold
📊 Volume Analysis
- Customizable volume MA length
- Adjustable volume threshold for signal confirmation
- Option to enable/disable volume analysis
🎨 Visualization
- Customizable bullish/bearish colors
- Optional intensity zones display
- Status monitor with real-time score and state information
- Clear entry arrows and background highlights
💻 Technical Code Breakdown
1. Core Calculations
// Base calculations for EMAs
ema_1 = ta.ema(close, ema_length_1)
ema_2 = ta.ema(close, ema_length_2)
ema_3 = ta.ema(close, ema_length_3)
ema_4 = ta.ema(close, ema_length_4)
// Proximity calculation for entry validation
ema_prox_raw = math.abs(close - ema_1) / ema_1 * 100
is_close_to_ema_long = close > ema_1 and ema_prox_raw <= prox_percent
```
### 2. Squeeze Detection System
```pine
// Bollinger Bands setup
BB_basis = ta.sma(close, length)
BB_dev = ta.stdev(close, length)
BB_upper = BB_basis + BB_mult * BB_dev
BB_lower = BB_basis - BB_mult * BB_dev
// Keltner Channels setup
KC_basis = ta.sma(close, length)
KC_range = ta.sma(ta.tr, length)
KC_upper_high = KC_basis + KC_range * KC_mult_high
KC_lower_high = KC_basis - KC_range * KC_mult_high
```
### 3. Scoring System Implementation
```pine
// Band Convergence Score
band_ratio = BB_width / KC_width
convergence_score = math.max(0, 40 * (1 - band_ratio))
// Price Position Score
price_range = math.abs(close - KC_basis) / (KC_upper_low - KC_lower_low)
position_score = 20 * (1 - price_range)
// Final Score Calculation
squeeze_score = convergence_score + position_score + vol_score + mom_score
```
### 4. Signal Generation
```pine
// Entry Signal Logic
long_signal = squeeze_release and
is_momentum_positive and
(not use_ema_trend or (bullish_trend and is_close_to_ema_long)) and
is_bullish_candle
short_signal = squeeze_release and
is_momentum_negative and
(not use_ema_trend or (bearish_trend and is_close_to_ema_short)) and
is_bearish_candle
```
📈 Trading Signals
🚀 Long Entry Conditions
- Squeeze release detected
- Positive momentum
- Bullish candlestick
- Price above relevant EMAs (if enabled)
- Within EMA proximity threshold (if enabled)
- Sufficient volume confirmation (if enabled)
🔻 Short Entry Conditions
- Squeeze release detected
- Negative momentum
- Bearish candlestick
- Price below relevant EMAs (if enabled)
- Within EMA proximity threshold (if enabled)
- Sufficient volume confirmation (if enabled)
⚠️ Alert Conditions
- 🔔 Extreme squeeze level reached (score crosses above 80)
- 🚀 Long squeeze release signal
- 🔻 Short squeeze release signal
💡 Tips for Usage
1. 📱 Use the status monitor to track real-time squeeze intensity and state
2. 🎨 Pay attention to the color gradient for trend direction and strength
3. ⏰ Consider using multiple timeframes for confirmation
4. ⚙️ Adjust EMA and proximity settings based on your trading style
5. 📊 Use volume analysis for additional confirmation in liquid markets
📝 Notes
- 🔧 The indicator combines multiple technical analysis concepts for robust signal generation
- 📈 Suitable for all tradable markets and timeframes
- ⭐ Best results typically achieved in trending markets with clear volatility cycles
- 🎯 Consider using in conjunction with other technical analysis tools for confirmation
⚠️ Disclaimer
This technical indicator is designed to assist in analysis but should not be considered as financial advice. Always perform your own analysis and risk management when trading.

INTELLECT_city - US Presidential Elections Dates (USA)(EN)
It is interesting to compare Halvings Cycles and Presidential elections.
This indicator shows all presidential elections in the USA from the period 2008, and future ones to the date 2044. The indicator will automatically show all future dates of presidential elections.
--
To apply it to your chart it is very easy:
Select:
1) Exchange: BITSTAMP
2) Pair BTC \ USD (Without "T" at the end)
3) Timeframe 1 day
4) In the Browser, switch the chart to Logarithmic (on the right bottom, click the "L" button)
or on mobile, switch to "Logarithmic" we look on the chart: "Gear" - and switch to "Logarithmic"
------------------
(RU)
Интересно сопоставить Циклы Halvings и Президентские выборы.
Данный индикатор показывает все президентские выборы в США с периода 2008 года, и будущие к дате 2044 года. Индикатор будет автоматически показывать все будущие даты .
--
Что бы применить у себя на графике это очень легко:
Выберите:
1) Биржа: BITSTAMP
2) Пара BTC \ USD (Без "T" в конце)
3) Timeframe 1 дневной
4) В Браузере переключить график на Логарифмический (с право внизу кнопка "Л")
или на мобильно переключить на "Логарифмический" ищем на графике: "Шестеренку" — и переключаем на "Логарифмический"
-------------------
(DE)
Es ist interessant, die Halbierungszyklen und die Präsidentschaftswahlen zu vergleichen.
Dieser Indikator zeigt alle US-Präsidentschaftswahlen seit 2008 und zukünftige bis zum Datum 2044. Der Indikator zeigt automatisch alle zukünftigen Präsidentschaftswahltermine an.
--
Es ist sehr einfach, dies auf Ihr Diagramm anzuwenden:
Wählen:
1) Austausch: BITSTAMP
2) Paar BTC \ USD (Ohne das „T“ am Ende)
3) Zeitrahmen 1 Tag
4) Schalten Sie im Browser das Diagramm auf Logarithmisch um (die Schaltfläche „L“ unten rechts).
oder auf dem Mobilgerät auf „Logarithmisch“ umschalten, in der Grafik nach „Getriebe“ suchen – und auf „Logarithmisch“ umschalten

Vlad Waves█ CONCEPT
Acceleration Line (Blue)
The Acceleration Line is calculated as the difference between the 8-period SMA and the 20-period SMA.
This line helps to identify the momentum and potential turning points in the market.
Signal Line (Red)
The Signal Line is an 8-period SMA of the Acceleration Line.
This line smooths out the Acceleration Line to generate clearer signals.
Long-Term Average (Green)
The Long-Term Average is a 200-period SMA of the Acceleration Line.
This line provides a broader context of the market trend, helping to distinguish between long-term and short-term movements.
█ SIGNALS
Buy Mode
A buy signal occurs when the Acceleration Line crosses above the Signal Line while below the Long-Term Average. This indicates a potential bullish reversal in the market.
When the Signal Line crosses the Acceleration Line above the Long-Term Average, consider placing a stop rather than reversing the position to protect gains from potential pullbacks.
Sell Mode
A sell signal occurs when the Acceleration Line crosses below the Signal Line while above the Long-Term Average. This indicates a potential bearish reversal in the market.
When the Signal Line crosses the Acceleration Line below the Long-Term Average, consider placing a stop rather than reversing the position to protect gains from potential pullbacks.
█ UTILITY
This indicator is not recommended for standalone buy or sell signals. Instead, it is designed to identify market cycles and turning points, aiding in the decision-making process.
Entry signals are most effective when they occur away from the Long-Term Average, as this helps to avoid sideways movements.
Use larger timeframes, such as daily or weekly charts, for better accuracy and reliability of the signals.
█ CREDITS
The idea for this indicator came from Fabio Figueiredo (Vlad).

3x MTF MACD v3.0MACD's on 3 different Time Frames
Indicator Information
- Each Time Frame shows start of Trend and end of trend of the MACD vs the Signal Cross
- They are labled 1,2,3 with respective up or down triangle for possible direction.
User Inputs
- configure the indicator by specifying various inputs. These inputs include colors for bullish
and bearish conditions, the time frame to use, whether to show a Simple Moving Average
(SMA) line, and other parameters.
- Users can choose time frames for analysis (like 30 minutes, 1 hour, etc.)
but they must be in mintues.
- The code also allows users to customize how the indicator looks on the chart by providing
options for position and color.
Main Calculations
- The script calculates the Simple Moving Average (SMA) based on the user-defined time
frame.
- It then determines the color of the plot (line) based on certain conditions, such as whether
the SMA is rising or falling. These conditions help users quickly identify market trends.
Label Creation
- The code creates labels that can be displayed on the chart.
These labels indicate whether there's a bullish or bearish signal.
Level Detection
- The script determines and labels key levels or points of interest in the chart based on
certain conditions.
- It can show labels like "①" and "▲" for bullish conditions and "▼" for bearish conditions.
Table Display
- There's an option to show a table on the chart that displays information about the MACD
indicator Chosen and the NUmber Bubble assocated with that time frame
- The table can include information like which time frame is being analyzed, whether the SMA
line is shown, and other relevant data.
Plotting on the Chart
- The script plots the Simple Moving Average (SMA) on the chart. The color of this line
changes based on the calculated trend conditions.
ATR (Average True Range)
- The script also plots the Average True Range (ATR) on the chart. ATR is used to measure
market volatility.
"In essence, this script is a highly customizable MACD and SMA indicator for traders. It assists traders in comprehending market trends, offering insights into different MACD cycles concerning various timeframes.
Users can configure it to match their trading strategies, and it presents information in a user-friendly manner with colors, labels, and tables.
This simplifies market analysis, allowing traders to make more informed decisions without the distraction of multiple indicators."

Time Cycles IndicatorThis script is used to analyze the seasonality of any asset (commodities, stocks, indices).
To use the script select a timeframe D or W and select the months you are interested in the script settings. You will see all the candles that are part of those months highlighted in the chart.
You can use this script to understand if assets have a cyclical behavior in certain months of the year.

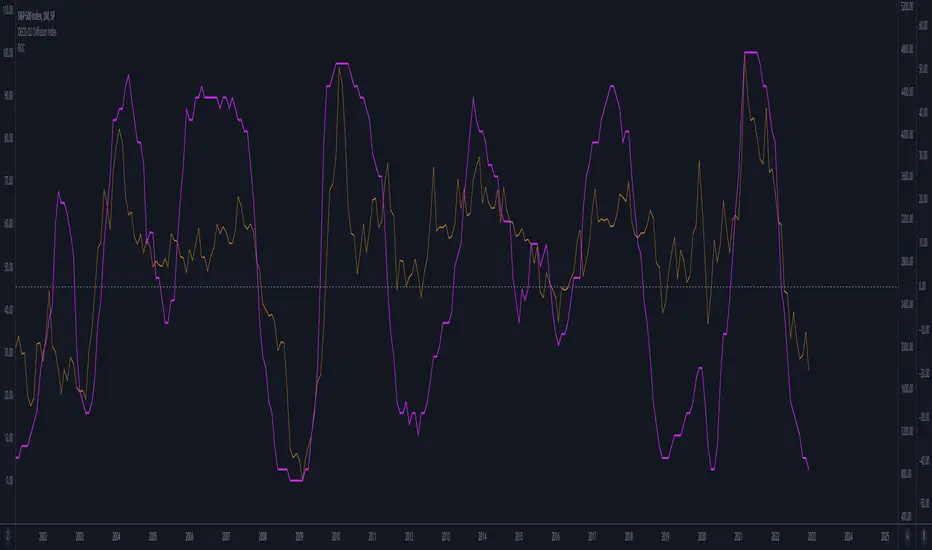
OECD CLI Diffusion IndexWhat does the indicator measure?
This is a macro indicator. It uses OECD's composite leading indicator - see details about the CLI below.
What it does it calculate YoY changes for CLI of 38 countries that are members or are associated with the OECD. Then it measures a percent of countries which CLI is rising.
How this can be used?
The positive slope of the curve means that there probably will be an economic growth among those countries within next 6 - 9 months. The negative slope means there probably will be an economic contraction.
Forward-looking economic growth is correlated with positive S&P 500 YoY growth (equity markets are also forward looking). The chart above presents the CLI diffusion index with overlayed S&P500 YoY rate of change.
The CLI is also correlated with ISM PMI - see example below:
What is a CLI?
"The OECD system of Composite Leading Indicators (CLIs) is designed to provide early signals of turning points in business cycles - fluctuation in the output gap, i.e. fluctuation of the economic activity around its long term potential level. This approach, focusing on turning points (peaks and troughs), results in CLIs that provide qualitative rather than quantitative information on short-term economic movements."
Trend Identifier StrategyTrend Identifier Strategy for 1D BTC.USD
The indicator smoothens a closely following moving average into a polynomial like plot and assumes 4 staged cycles based on the first and the second derivatives. This is an optimized strategy for long term buying and selling with a Sortino Ratio above 3. It is designed to be a more profitable alternative to HODLing. It can be combined with 'Accumulation/Distribution Bands & Signals' and 'Exponential Top and Bottom Finder'.

Cyclical Phases of the Market🧭 Overview
“Cyclical Phases of the Market” automatically detects major market cycles by connecting swing lows and measuring the average number of bars between them.
Once it learns the rhythm of past cycles, it projects the next expected cycle (in time and price) using a dashed orange line and a forecast label.
In simple terms:
The indicator shows where the next potential low is statistically expected to occur, based on the timing and depth of previous cycles.
⚙️ Core Logic – Step by Step
1️⃣ Pivot Detection
The script uses the built-in ta.pivotlow() and ta.pivothigh() functions to find local turning points:
pivotLow marks a local swing low, defined by pivotLeft and pivotRight bars on each side.
Only confirmed lows are used to define the major cycle points.
Each new pivot low is stored in two arrays:
cycleLows → price level of the low
cycleBars → bar index where the low occurred
2️⃣ Cycle Identification and Drawing
Every time two consecutive swing lows are found, the indicator:
Calculates the number of bars between them (cycle length).
If that distance is greater than or equal to minCycleBars, it draws a teal line connecting the two lows — visually representing one complete cycle.
These teal lines form the historical cycle structure of the market.
3️⃣ Average Cycle Length
Once there are at least three completed cycles, the script calculates the average duration (mean number of bars between lows).
This value — avgCycleLength — represents the dominant periodicity or cycle rhythm of the market.
4️⃣ Forecasting the Next Cycle
When a valid average cycle length exists, the model projects the next expected cycle:
Time projection:
Adds avgCycleLength to the last cycle’s ending bar index to find where the next low should occur.
Price projection:
Estimates the vertical amplitude by taking the difference between the last two cycle lows (priceDiff).
Adds this same difference to the last low price to forecast the next probable low level.
The result is drawn as an orange dashed line extending into the future, representing the Next Expected Cycle.
5️⃣ Forecast Label
An orange label 🔮 appears at the projected future point showing:
Text:
🔮 Upcoming Cycle Forecast
Price:
The label marks the probable area and timing of the next cyclical low.
(Note: the date/time calculation currently multiplies bar count by 7 days, so it’s designed mainly for daily charts. On other timeframes, that conversion can be adapted.)
📊 How to Read It on the Chart
Visual Element Meaning Interpretation
Teal lines Completed historical cycles (low to low) Show actual periodic rhythm of the market
Orange dashed line Projection of the next expected cycle Anticipated path toward the next cyclical low
Orange label 🔮 Upcoming Cycle Forecast Displays expected price and bar location
Average cycle length Internal variable (bars between lows) Represents the dominant cycle period
📈 Interpretation
When teal segments show consistent spacing, the market is following a stable rhythm → cycles are predictable.
When cycle spacing shortens, the market is accelerating (volatility rising).
When it widens, the market is slowing down or entering accumulation.
The orange dashed line represents the next expected low zone:
If the market drops near this line → cyclical pattern confirmed.
If the market breaks well below → cycle amplitude has increased (trend weakening).
If the market rises above and delays → a new longer cycle may be forming.
🧠 Practical Use
Combine with oscillators (e.g., RSI or TSI) to confirm momentum alignment near projected lows.
Use in conjunction with volume to identify accumulation or exhaustion near the expected turning point.
Compare across timeframes: weekly cycles confirm long-term rhythm; daily cycles refine short-term entries.
⚡ Summary
Aspect Description
Purpose Detect and forecast recurring market cycles
Cycle basis Low-to-Low pivot analysis
Visuals Teal historical cycles + Orange forecast line
Forecast Next expected low (price and time)
Ideal timeframe Daily
Main outputs Average cycle length, next projected cycle, visual cycle map

Ehlers Band-Pass FilterHeyo,
This indicator is an original translation from Ehlers' book "Cycle Analytics for Traders Advanced".
First, I describe the indicator as usual and later you can find a very insightful quote of the book.
Key Features
Signal Line: Represents the output of the band-pass filter, highlighting the dominant cycle in the data.
Trigger Line: A leading indicator derived from the signal line, providing early signals for potential market reversals.
Dominant Cycle: Measures the dominant cycle period by counting the number of bars between zero crossings of the band-pass filter output.
Calculation:
The band-pass filter is implemented using a combination of high-pass and low-pass filters.
The filter's parameters, such as period and bandwidth, can be adjusted to tune the filter to specific market cycles.
The signal line is normalized using an Automatic Gain Control (AGC) to provide consistent amplitude regardless of price swings.
The trigger line is derived by applying a high-pass filter to the signal line, creating a leading
waveform.
Usage
The indicator is effective in identifying peaks and valleys in the market data.
It works best in cyclic market conditions and may produce false signals during trending periods.
The dominant cycle measurement helps traders understand the prevailing market cycle length, aiding in better decision-making.
Quoted from the Book
Band-Pass Filters
“A little of the data narrowly passed,” said Tom broadly.
Perhaps the least appreciated and most underutilized filter in technical analysis is the band-pass filter. The band-pass filter simultaneously diminishes the amplitude at low frequencies, qualifying it as a detrender, and diminishes the amplitude at high frequencies, qualifying it as a data smoother.
It passes only those frequency components from input to output in which the trader is interested. The filtering produced by a band-pass filter is superior because the rejection in the stop bands is related to its bandwidth. The degree of rejection of undesired frequency components is called selectivity. The band-stop filter is the dual of the band-pass filter. It rejects a band of frequency components as a notch at the output and passes all other frequency components virtually unattenuated. Since the bandwidth of the deep rejection in the notch is relatively narrow and since the spectrum of market cycles is relatively broad due to systemic noise, the band-stop filter has little application in trading.
Measuring the Cycle Period
The band-pass filter can be used as a relatively simple measurement of the dominant cycle.
A cycle is complete when the waveform crosses zero two times from the last zero crossing. Therefore, each successive zero crossing of the indicator marks a half cycle period. We can establish the dominant cycle period as twice the spacing between successive zero crossings.
When we measure the dominant cycle period this way, it is best to widen the pass band of the band-pass filter to avoid distorting the measurement simply due to the selectivity of the filter. Using an input bandwidth of 0.7 produces an octave-wide pass band. For example, if the center period of the filter is 20 and the relative bandwidth is 0.7, the bandwidth is 14. That means the pass band of the filter extends from 13-bar periods to 27-bar periods.
That is, roughly an octave exists because the longest period is twice the shortest period of the pass band. It is imperative that a high-pass filter is tuned one octave below the half-bandwidth edge of the band-pass filter to ensure a nominal zero mean of the filtered output. Without a zero mean, the zero crossings can have a substantial error.
Since the measurement of the dominant cycle can vary dramatically from zero crossing to zero
crossing, the code limits the change between measurements to be no more than 25 percent.
While measuring the changing dominant cycle period via zero crossings of the band-pass waveform is easy, it is not necessarily the most accurate method.
Best regards,
simwai
Good Luck with your trading! 🙌

MERV: Market Entropy & Rhythm Visualizer [BullByte]The MERV (Market Entropy & Rhythm Visualizer) indicator analyzes market conditions by measuring entropy (randomness vs. trend), tradeability (volatility/momentum), and cyclical rhythm. It provides traders with an easy-to-read dashboard and oscillator to understand when markets are structured or choppy, and when trading conditions are optimal.
Purpose of the Indicator
MERV’s goal is to help traders identify different market regimes. It quantifies how structured or random recent price action is (entropy), how strong and volatile the movement is (tradeability), and whether a repeating cycle exists. By visualizing these together, MERV highlights trending vs. choppy environments and flags when conditions are favorable for entering trades. For example, a low entropy value means prices are following a clear trend line, whereas high entropy indicates a lot of noise or sideways action. The indicator’s combination of measures is original: it fuses statistical trend-fit (entropy), volatility trends (ATR and slope), and cycle analysis to give a comprehensive view of market behavior.
Why a Trader Should Use It
Traders often need to know when a market trend is reliable vs. when it is just noise. MERV helps in several ways: it shows when the market has a strong direction (low entropy, high tradeability) and when it’s ranging (high entropy). This can prevent entering trend-following strategies during choppy periods, or help catch breakouts early. The “Optimal Regime” marker (a star) highlights moments when entropy is very low and tradeability is very high, typically the best conditions for trend trades. By using MERV, a trader gains an empirical “go/no-go” signal based on price history, rather than guessing from price alone. It’s also adaptable: you can apply it to stocks, forex, crypto, etc., on any timeframe. For example, during a bullish phase of a stock, MERV will turn green (Trending Mode) and often show a star, signaling good follow-through. If the market later grinds sideways, MERV will shift to magenta (Choppy Mode), warning you that trend-following is now risky.
Why These Components Were Chosen
Market Entropy (via R²) : This measures how well recent prices fit a straight line. We compute a linear regression on the last len_entropy bars and calculate R². Entropy = 1 - R², so entropy is low when prices follow a trend (R² near 1) and high when price action is erratic (R² near 0). This single number captures trend strength vs noise.
Tradeability (ATR + Slope) : We combine two familiar measures: the Average True Range (ATR) (normalized by price) and the absolute slope of the regression line (scaled by ATR). Together they reflect how active and directional the market is. A high ATR or strong slope means big moves, making a trend more “tradeable.” We take a simple average of the normalized ATR and slope to get tradeability_raw. Then we convert it to a percentile rank over the lookback window so it’s stable between 0 and 1.
Percentile Ranks : To make entropy and tradeability values easy to interpret, we convert each to a 0–100 rank based on the past len_entropy periods. This turns raw metrics into a consistent scale. (For example, an entropy rank of 90 means current entropy is higher than 90% of recent values.) We then divide by 100 to plot them on a 0–1 scale.
Market Mode (Regime) : Based on those ranks, MERV classifies the market:
Trending (Green) : Low entropy rank (<40%) and high tradeability rank (>60%). This means the market is structurally trending with high activity.
Choppy (Magenta) : High entropy rank (>60%) and low tradeability rank (<40%). This is a mostly random, low-momentum market.
Neutral (Cyan) : All other cases. This covers mixed regimes not strongly trending or choppy.
The mode is shown as a colored bar at the bottom: green for trending, magenta for choppy, cyan for neutral.
Optimal Regime Signal : Separately, we mark an “optimal” condition when entropy_norm < 0.3 and tradeability > 0.7 (both normalized 0–1). When this is true, a ★ star appears on the bottom line. This star is colored white when truly optimal, gold when only tradeability is high (but entropy not quite low enough), and black when neither condition holds. This gives a quick visual cue for very favorable conditions.
What Makes MERV Stand Out
Holistic View : Unlike a single-oscillator, MERV combines trend, volatility, and cycle analysis in one tool. This multi-faceted approach is unique.
Visual Dashboard : The fixed on-chart dashboard (shown at your chosen corner) summarizes all metrics in bar/gauge form. Even a non-technical user can glance at it: more “█” blocks = a higher value, colors match the plots. This is more intuitive than raw numbers.
Adaptive Thresholds : Using percentile ranks means MERV auto-adjusts to each market’s character, rather than requiring fixed thresholds.
Cycle Insight : The rhythm plot adds information rarely found in indicators – it shows if there’s a repeating cycle (and its period in bars) and how strong it is. This can hint at natural bounce or reversal intervals.
Modern Look : The neon color scheme and glow effects make the lines easy to distinguish (blue/pink for entropy, green/orange for tradeability, etc.) and the filled area between them highlights when one dominates the other.
Recommended Timeframes
MERV can be applied to any timeframe, but it will be more reliable on higher timeframes. The default len_entropy = 50 and len_rhythm = 30 mean we use 30–50 bars of history, so on a daily chart that’s ~2–3 months of data; on a 1-hour chart it’s about 2–3 days. In practice:
Swing/Position traders might prefer Daily or 4H charts, where the calculations smooth out small noise. Entropy and cycles are more meaningful on longer trends.
Day trader s could use 15m or 1H charts if they adjust the inputs (e.g. shorter windows). This provides more sensitivity to intraday cycles.
Scalpers might find MERV too “slow” unless input lengths are set very low.
In summary, the indicator works anywhere, but the defaults are tuned for capturing medium-term trends. Users can adjust len_entropy and len_rhythm to match their chart’s volatility. The dashboard position can also be moved (top-left, bottom-right, etc.) so it doesn’t cover important chart areas.
How the Scoring/Logic Works (Step-by-Step)
Compute Entropy : A linear regression line is fit to the last len_entropy closes. We compute R² (goodness of fit). Entropy = 1 – R². So a strong straight-line trend gives low entropy; a flat/noisy set of points gives high entropy.
Compute Tradeability : We get ATR over len_entropy bars, normalize it by price (so it’s a fraction of price). We also calculate the regression slope (difference between the predicted close and last close). We scale |slope| by ATR to get a dimensionless measure. We average these (ATR% and slope%) to get tradeability_raw. This represents how big and directional price moves are.
Convert to Percentiles : Each new entropy and tradeability value is inserted into a rolling array of the last 50 values. We then compute the percentile rank of the current value in that array (0–100%) using a simple loop. This tells us where the current bar stands relative to history. We then divide by 100 to plot on .
Determine Modes and Signal : Based on these normalized metrics: if entropy < 0.4 and tradeability > 0.6 (40% and 60% thresholds), we set mode = Trending (1). If entropy > 0.6 and tradeability < 0.4, mode = Choppy (-1). Otherwise mode = Neutral (0). Separately, if entropy_norm < 0.3 and tradeability > 0.7, we set an optimal flag. These conditions trigger the colored mode bars and the star line.
Rhythm Detection : Every bar, if we have enough data, we take the last len_rhythm closes and compute the mean and standard deviation. Then for lags from 5 up to len_rhythm, we calculate a normalized autocorrelation coefficient. We track the lag that gives the maximum correlation (best match). This “best lag” divided by len_rhythm is plotted (a value between 0 and 1). Its color changes with the correlation strength. We also smooth the best correlation value over 5 bars to plot as “Cycle Strength” (also 0 to 1). This shows if there is a consistent cycle length in recent price action.
Heatmap (Optional) : The background color behind the oscillator panel can change with entropy. If “Neon Rainbow” style is on, low entropy is blue and high entropy is pink (via a custom color function), otherwise a classic green-to-red gradient can be used. This visually reinforces the entropy value.
Volume Regime (Dashboard Only) : We compute vol_norm = volume / sma(volume, len_entropy). If this is above 1.5, it’s considered high volume (neon orange); below 0.7 is low (blue); otherwise normal (green). The dashboard shows this as a bar gauge and percentage. This is for context only.
Oscillator Plot – How to Read It
The main panel (oscillator) has multiple colored lines on a 0–1 vertical scale, with horizontal markers at 0.2 (Low), 0.5 (Mid), and 0.8 (High). Here’s each element:
Entropy Line (Blue→Pink) : This line (and its glow) shows normalized entropy (0 = very low, 1 = very high). It is blue/green when entropy is low (strong trend) and pink/purple when entropy is high (choppy). A value near 0.0 (below 0.2 line) indicates a very well-defined trend. A value near 1.0 (above 0.8 line) means the market is very random. Watch for it dipping near 0: that suggests a strong trend has formed.
Tradeability Line (Green→Yellow) : This represents normalized tradeability. It is colored bright green when tradeability is low, transitioning to yellow as tradeability increases. Higher values (approaching 1) mean big moves and strong slopes. Typically in a market rally or crash, this line will rise. A crossing above ~0.7 often coincides with good trend strength.
Filled Area (Orange Shade) : The orange-ish fill between the entropy and tradeability lines highlights when one dominates the other. If the area is large, the two metrics diverge; if small, they are similar. This is mostly aesthetic but can catch the eye when the lines cross over or remain close.
Rhythm (Cycle) Line : This is plotted as (best_lag / len_rhythm). It indicates the relative period of the strongest cycle. For example, a value of 0.5 means the strongest cycle was about half the window length. The line’s color (green, orange, or pink) reflects how strong that cycle is (green = strong). If no clear cycle is found, this line may be flat or near zero.
Cycle Strength Line : Plotted on the same scale, this shows the autocorrelation strength (0–1). A high value (e.g. above 0.7, shown in green) means the cycle is very pronounced. Low values (pink) mean any cycle is weak and unreliable.
Mode Bars (Bottom) : Below the main oscillator, thick colored bars appear: a green bar means Trending Mode, magenta means Choppy Mode, and cyan means Neutral. These bars all have a fixed height (–0.1) and make it very easy to see the current regime.
Optimal Regime Line (Bottom) : Just below the mode bars is a thick horizontal line at –0.18. Its color indicates regime quality: White (★) means “Optimal Regime” (very low entropy and high tradeability). Gold (★) means not quite optimal (high tradeability but entropy not low enough). Black means neither condition. This star line quickly tells you when conditions are ideal (white star) or simply good (gold star).
Horizontal Guides : The dotted lines at 0.2 (Low), 0.5 (Mid), and 0.8 (High) serve as reference lines. For example, an entropy or tradeability reading above 0.8 is “High,” and below 0.2 is “Low,” as labeled on the chart. These help you gauge values at a glance.
Dashboard (Fixed Corner Panel)
MERV also includes a compact table (dashboard) that can be positioned in any corner. It summarizes key values each bar. Here is how to read its rows:
Entropy : Shows a bar of blocks (█ and ░). More █ blocks = higher entropy. It also gives a percentage (rounded). A full bar (10 blocks) with a high % means very chaotic market. The text is colored similarly (blue-green for low, pink for high).
Rhythm : Shows the best cycle period in bars (e.g. “15 bars”). If no calculation yet, it shows “n/a.” The text color matches the rhythm line.
Cycle Strength : Gives the cycle correlation as a percentage (smoothed, as shown on chart). Higher % (green) means a strong cycle.
Tradeability : Displays a 10-block gauge for tradeability. More blocks = more tradeable market. It also shows “gauge” text colored green→yellow accordingly.
Market Mode : Simply shows “Trending”, “Choppy”, or “Neutral” (cyan text) to match the mode bar color.
Volume Regime : Similar to tradeability, shows blocks for current volume vs. average. Above-average volume gives orange blocks, below-average gives blue blocks. A % value indicates current volume relative to average. This row helps see if volume is abnormally high or low.
Optimal Status (Large Row) : In bold, either “★ Optimal Regime” (white text) if the star condition is met, “★ High Tradeability” (gold text) if tradeability alone is high, or “— Not Optimal” (gray text) otherwise. This large row catches your eye when conditions are ripe.
In short, the dashboard turns the numeric state into an easy read: filled bars, colors, and text let you see current conditions without reading the plot. For instance, five blue blocks under Entropy and “25%” tells you entropy is low (good), and a row showing “Trending” in green confirms a trend state.
Real-Life Example
Example : Consider a daily chart of a trending stock (e.g. “AAPL, 1D”). During a strong uptrend, recent prices fit a clear upward line, so Entropy would be low (blue line near bottom, perhaps below the 0.2 line). Volatility and slope are high, so Tradeability is high (green-yellow line near top). In the dashboard, Entropy might show only 1–2 blocks (e.g. 10%) and Tradeability nearly full (e.g. 90%). The Market Mode bar turns green (Trending), and you might see a white ★ on the optimal line if conditions are very good. The Volume row might light orange if volume is above average during the rally. In contrast, imagine the same stock later in a tight range: Entropy will rise (pink line up, more blocks in dashboard), Tradeability falls (fewer blocks), and the Mode bar turns magenta (Choppy). No star appears in that case.
Consolidated Use Case : Suppose on XYZ stock the dashboard reads “Entropy: █░░░░░░░░ 20%”, “Tradeability: ██████████ 80%”, Mode = Trending (green), and “★ Optimal Regime.” This tells the trader that the market is in a strong, low-noise trend, and it might be a good time to follow the trend (with appropriate risk controls). If instead it reads “Entropy: ████████░░ 80%”, “Tradeability: ███▒▒▒▒▒▒ 30%”, Mode = Choppy (magenta), the trader knows the market is random and low-momentum—likely best to sit out until conditions improve.
Example: How It Looks in Action
Screenshot 1: Trending Market with High Tradeability (SOLUSD, 30m)
What it means:
The market is in a clear, strong trend with excellent conditions for trading. Both trend-following and active strategies are favored, supported by high tradeability and strong volume.
Screenshot 2: Optimal Regime, Strong Trend (ETHUSD, 1h)
What it means:
This is an ideal environment for trend trading. The market is highly organized, tradeability is excellent, and volume supports the move. This is when the indicator signals the highest probability for success.
Screenshot 3: Choppy Market with High Volume (BTC Perpetual, 5m)
What it means:
The market is highly random and choppy, despite a surge in volume. This is a high-risk, low-reward environment, avoid trend strategies, and be cautious even with mean-reversion or scalping.
Settings and Inputs
The script is fully open-source; here are key inputs the user can adjust:
Entropy Window (len_entropy) : Number of bars used for entropy and tradeability (default 50). Larger = smoother, more lag; smaller = more sensitivity.
Rhythm Window (len_rhythm ): Bars used for cycle detection (default 30). This limits the longest cycle we detect.
Dashboard Position : Choose any corner (Top Right default) so it doesn’t cover chart action.
Show Heatmap : Toggles the entropy background coloring on/off.
Heatmap Style : “Neon Rainbow” (colorful) or “Classic” (green→red).
Show Mode Bar : Turn the bottom mode bar on/off.
Show Dashboard : Turn the fixed table panel on/off.
Each setting has a tooltip explaining its effect. In the description we will mention typical settings (e.g. default window sizes) and that the user can move the dashboard corner as desired.
Oscillator Interpretation (Recap)
Lines : Blue/Pink = Entropy (low=trend, high=chop); Green/Yellow = Tradeability (low=quiet, high=volatile).
Fill : Orange tinted area between them (for visual emphasis).
Bars : Green=Trending, Magenta=Choppy, Cyan=Neutral (at bottom).
Star Line : White star = ideal conditions, Gold = good but not ideal.
Horizontal Guides : 0.2 and 0.8 lines mark low/high thresholds for each metric.
Using the chart, a coder or trader can see exactly what each output represents and make decisions accordingly.
Disclaimer
This indicator is provided as-is for educational and analytical purposes only. It does not guarantee any particular trading outcome. Past market patterns may not repeat in the future. Users should apply their own judgment and risk management; do not rely solely on this tool for trading decisions. Remember, TradingView scripts are tools for market analysis, not personalized financial advice. We encourage users to test and combine MERV with other analysis and to trade responsibly.
-BullByte

Continuous Partial Buying Signals v7.1🇬🇧 English Description: Continuous Partial Buying Signals v7.1
This indicator is built on a long-term accumulation philosophy , not a traditional buy-sell strategy. Its main purpose is to systematically increase your position in an asset you believe in by identifying significant price drops as buying opportunities. It is a tool designed for long-term investors who want to automate the "buy the dip" or "Dollar Cost Averaging (DCA)" mindset.
How It Works
The logic follows a simple but powerful cycle: Find a Peak -> Wait for a Drop -> Signal a Buy -> Wait for a New Peak.
1. Identifies a Significant Peak: Instead of reacting to minor price spikes, the indicator looks back over a user-defined period (e.g., the last 200 candles) to find the highest price. This stable peak (marked with an orange circle) becomes the reference point for the current cycle.
2. Waits for a Pullback: The indicator then calculates the percentage drop from this locked-in peak.
3. Generates Buy Signals: When the price drops by the percentages you define (e.g., -5% and -10%), it plots a "BUY" signal on the chart. It will only signal once per level within the same cycle.
4. Resets the Cycle: This is the key. If the price recovers and establishes a new significant peak higher than the previous one, the entire cycle resets. The new peak becomes the new reference, and the buy signals are re-armed, allowing the indicator to perpetually find new buying opportunities in a rising market.
How to Get the Most Out of This Indicator
* Timeframe: It is highly recommended to use this on higher timeframes (4H, Daily, Weekly) to align with its long-term accumulation philosophy.
* Peak Lookback Period:
* Higher values (200, 300): Create more stable and less frequent signals. Ideal for long-term, patient investors.
* Lower values (50, 100): More sensitive to recent price action, resulting in more frequent cycles.
* Drop Percentages: Adjust these based on the asset's volatility.
* Volatile assets (Crypto): Consider larger percentages like 10%, 20%.
* Less volatile assets (Stocks, Indices): Smaller percentages like 3%, 5%, 8% might be more appropriate.
This indicator is a tool for disciplined, emotion-free accumulation. It does not provide sell signals.

Cyclic Reversal Engine [AlgoPoint]Overview
Most indicators focus on price and momentum, but they often ignore a critical third dimension: time. Markets move in rhythmic cycles of expansion and contraction, but these cycles are not fixed; they speed up in trending markets and slow down in choppy conditions.
The Cyclic Reversal Engine is an advanced analytical tool designed to decode this rhythm. Instead of relying on static, lagging formulas, this indicator learns from past market behavior to anticipate when the current trend is statistically likely to reach its exhaustion point, providing high-probability reversal signals.
It achieves this by combining a sophisticated time analysis with a robust price-action confirmation.
How It Works: The Core Logic
The indicator operates on a multi-stage process to identify potential turning points in the market.
1. Market Regime Analysis (The Brain): Before analyzing any cycles, the indicator first diagnoses the current "personality" of the market. Using a combination of the ADX, Choppiness Index, and RSI, it classifies the market into one of three primary regimes:
- Trending: Strong, directional movement.
- Ranging: Sideways, non-directional chop.
- Reversal: An over-extended state (overbought/oversold) where a turn is imminent.
2. Adaptive Cycle Learning (The "Machine Learning" Aspect): This is the indicator's smartest feature. It constantly analyzes past cycles by measuring the bar-count between significant swing highs and swing lows. Crucially, it learns the average cycle duration for each specific market regime. For example, it learns that "in a strong trending market, a new swing low tends to occur every 35 bars," while "in a ranging market, this extends to 60 bars."
3. The Countdown & Timing Signal: The indicator identifies the last major swing high or low and starts a bar-by-bar countdown. Based on the current market regime, it selects the appropriate learned cycle length from its memory. When the bar count approaches this adaptive target, the indicator determines that a reversal is "due" from a timing perspective.
4. Price Confirmation (The Trigger): A signal is never generated based on timing alone. Once the timing condition is met (the cycle is "due"), the indicator waits for a final price-action confirmation. The default confirmation is the RSI entering an extreme overbought or oversold zone, signaling momentum exhaustion. The signal is only triggered when Time + Price Confirmation align.
How to Use This Indicator
- The Dashboard: The panel in the bottom-right corner is your command center.
- Market Regime: Shows the current market personality analyzed by the engine.
- Adaptive Cycle / Bar Count: This is the core of the indicator. It shows the target cycle length for the current regime (e.g., 50) and the current bar count since the last swing point (e.g., 45). The background turns orange when the bar count enters the "due zone," indicating that you should be on high alert for a reversal.
- BUY/SELL Signals: A label appears on the chart only when the two primary conditions are met:
The timing is right (Bar Count has reached the Adaptive Cycle target).
The price confirms exhaustion (RSI is in an extreme zone).
A BUY signal suggests a downtrend cycle is likely complete, and a SELL signal suggests an uptrend cycle is likely complete.
Key Settings
- Pivot Lookback: Controls the sensitivity of the swing point detection. Higher values will identify more significant, longer-term cycles.
- Market Regime Engine: The ADX, Choppiness, and RSI settings can be fine-tuned to adjust how the indicator classifies the market's personality.
- Require Price Confirmation: You can toggle the RSI confirmation on or off. It is highly recommended to keep it enabled for higher-quality signals.

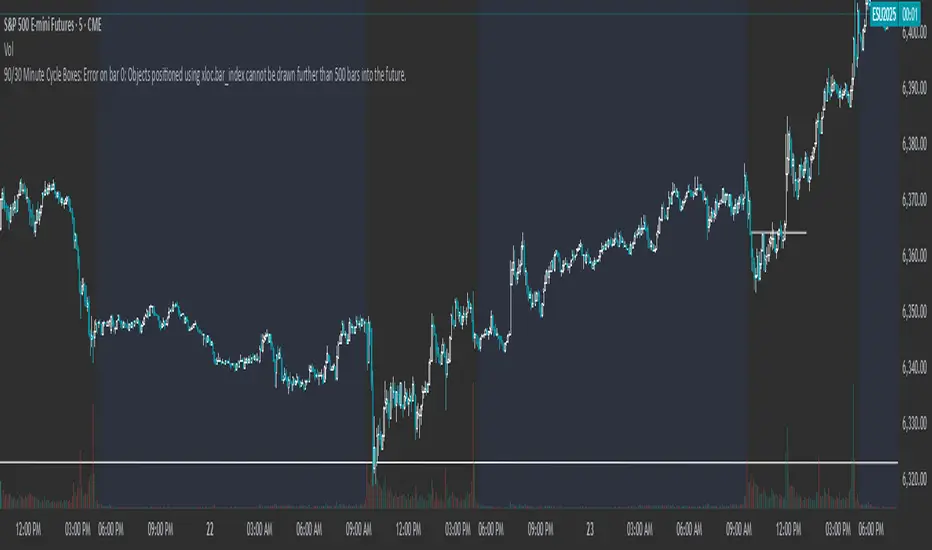
90/30 Minute Cycle BoxesThis indicator automatically draws time-based cycle boxes to help visualize market structure and cyclical behavior.
Features:
90-Minute Primary Cycles: Highlights each 90-minute interval with a colored box, showing the high and low of that period.
30-Minute Sub-Cycles: Each 90-minute box is divided into 3 sub-boxes representing 30-minute phases.
Multi-Timeframe Compatible: Works on all timeframes, adapting dynamically to your chart.
Visual Clarity: Alternating box colors make it easy to track price action within and across cycles.
This tool is ideal for traders who use time cycles in their analysis, especially those applying ICT, Smart Money Concepts, or time-based market theories.
Ehlers Dominant Cycle Stochastic RSIEhlers Enhanced Cycle Stochastic RSI
OVERVIEW
The Ehlers Enhanced Cycle Stochastic RSI is a momentum oscillator that automatically adjusts its lookback periods based on the dominant market cycle. Unlike traditional Stochastic RSI which uses fixed periods, this indicator detects the current cycle length and scales its calculations—making it responsive in fast markets and stable in slow ones.
The indicator combines John Ehlers' digital signal processing research with the classic Stochastic RSI indicator, then adds a confirmation system to ensure cycle measurements are reliable.
THE THEORY
Traditional oscillators use fixed lookback periods (ie, 14-bar RSI). This creates a fundamental problem: markets don't move in fixed cycles. A 14-period RSI might capture the rhythm perfectly during one market phase, then completely miss it when conditions change.
Ehlers' research demonstrated that price data contains measurable cyclical components. If you can detect the dominant cycle length, you can tune your indicators to match it—like tuning a radio to the right frequency.
This indicator takes that concept further by using three independent cycle detection methods and only trusting the measurement when they agree:
Hilbert Transform — A mathematical technique from signal processing that extracts cycle period from the phase relationship between price and its derivative. It is fast but can be noisy.
Autocorrelation Periodogram — Measures how similar the price series is to lagged versions of itself. The lag with highest correlation reveals the dominant cycle. More stable than Hilbert, but slightly slower to adapt.
Goertzel Algorithm (DFT) — A frequency-domain approach that calculates spectral power at each candidate period. Identifies which frequencies contain the most energy.
When all three methods converge on similar period estimates, confidence is high. When they disagree, the market may be in a non-cyclical or in transition.
HOW IT CHANGES THE STOCHASTIC RSI
Standard Stochastic RSI:
1. Calculate RSI with fixed period (14 bars)
2. Apply Stochastic formula over fixed period (14 bars)
3. Smooth with fixed periods
Ehlers Enhanced Cycle Stochastic RSI:
1. Detect dominant cycle using three methods
2. Confirm cycle measurement (methods must agree)
3. Calculate RSI with period scaled to the detected cycle
4. Apply Stochastic formula with cycle-scaled lookback
5. Smooth adaptively
The result: when the market is cycling quickly (say, 15-bar cycles), the indicator uses shorter periods and responds faster. When the market stretches into longer cycles (such as 40-bar cycles), it automatically extends its lookback to avoid whipsaws.
The Period Multipliers let you fine-tune this relationship:
• 1.0 = Use the full detected cycle (smoother, fewer signals)
• 0.5 = Use half the cycle (more responsive, catches turns earlier)
INTERPRETATION
Reading the Oscillator:
• K Line (Blue) — The main signal line. Moves between 0 and 100.
• D Line (Orange) — Smoothed version of K. Use for confirmation.
• Above 80 — Overbought. Momentum stretched to upside.
• Below 20 — Oversold. Momentum stretched to downside.
• Crossovers — K crossing above D suggests bullish momentum shift; K crossing below D suggests bearish.
Spectral Dilation (optional):
When enabled, applies a bandpass filter before cycle detection. This isolates the frequency band of interest and reduces noise. Useful for:
• Very noisy instruments
• Lower timeframes
• When confidence stays persistently low

Orderflow Label with OffsetThis Pine Script automatically displays orderflow labels on the chart to visualize the current market structure and potential breakout or reversal zones.
It compares the current candle’s high and low with those of the previous cycle (e.g., 90 minutes) and places descriptive labels that highlight possible bullish or bearish behavior.
Functionality & Logic (Step-by-step explanation)
Inputs:
cycleLength: Defines the duration of one “cycle” in minutes (for example, 90 minutes).
labelXOffset: Moves the label a few bars to the right, so it doesn’t overlap the current candle.
labelStyleOffset: Controls whether labels appear pointing to the right or left side of the chart.
Previous Cycle:
The script uses request.security to retrieve the high and low from the previous cycle timeframe.
These act as reference points (similar to key levels or market structure highs/lows).
Current Candle:
The script reads the current bar’s high, low, and close values for comparison.
Orderflow Conditions:
bullSupport: The current high and close are both above the previous high → bullish breakout (strong continuation).
bullReject: The high breaks above the previous high but closes below → bullish rejection / possible top.
bearRes: The low and close are both below the previous low → bearish breakdown (continuation to downside).
bearReclaim: The low goes below the previous low but closes above → bearish reclaim / possible reversal.
Label Logic:
Before creating a new label, the previous one is deleted (label.delete(flowLbl)) to avoid clutter.
The label’s X position is shifted using xPos = bar_index + labelXOffset.
The style (left/right) is set based on the user’s preference.
Displayed Labels:
🟢 Bullish Breakout → price closes above the previous cycle high.
🟠 Bullish Rejection → fake breakout or possible top.
🔴 Bearish Breakdown → price closes below the previous cycle low.
🟡 Bearish Reclaim → failed breakdown or potential trend reversal.
⚪ Neutral (Wait) → no clear signal, advises patience and watching for setups (like CHoCH or FVGs).
Visual Behavior:
The labels appear slightly to the right of the bar for better visibility.
The color and text alignment dynamically adjust depending on whether the label is pointing left or right.

Quarterly Theory ICT 01 [TradingFinder] XAMD + Q1-Q4 Sessions🔵 Introduction
The Quarterly Theory ICT indicator is an advanced analytical system based on the concepts of ICT (Inner Circle Trader) and fractal time. It divides time into quarterly periods and accurately determines entry and exit points for trades by using the True Open as the starting point of each cycle. This system is applicable across various time frames including annual, monthly, weekly, daily, and even 90-minute sessions.
Time is divided into four quarters: in the first quarter (Q1), which is dedicated to the Accumulation phase, the market is in a consolidation state, laying the groundwork for a new trend; in the second quarter (Q2), allocated to the Manipulation phase (also known as Judas Swing), sudden price changes and false moves occur, marking the true starting point of a trend change; the third quarter (Q3) is dedicated to the Distribution phase, during which prices are broadly distributed and price volatility peaks; and the fourth quarter (Q4), corresponding to the Continuation/Reversal phase, either continues or reverses the previous trend.
By leveraging smart algorithms and technical analysis, this system identifies optimal price patterns and trading positions through the precise detection of stop-run and liquidity zones.
With the division of time into Q1 through Q4 and by incorporating key terms such as Quarterly Theory ICT, True Open, Accumulation, Manipulation (Judas Swing), Distribution, Continuation/Reversal, ICT, fractal time, smart algorithms, technical analysis, price patterns, trading positions, stop-run, and liquidity, this system enables traders to identify market trends and make informed trading decisions using real data and precise analysis.
♦ Important Note :
This indicator and the "Quarterly Theory ICT" concept have been developed based on material published in primary sources, notably the articles on Daye( traderdaye ) and Joshuuu . All copyright rights are reserved.
🔵 How to Use
The Quarterly Theory ICT strategy is built on dividing time into four distinct periods across various time frames such as annual, monthly, weekly, daily, and even 90-minute sessions. In this approach, time is segmented into four quarters, during which the phases of Accumulation, Manipulation (Judas Swing), Distribution, and Continuation/Reversal appear in a systematic and recurring manner.
The first segment (Q1) functions as the Accumulation phase, where the market consolidates and lays the foundation for future movement; the second segment (Q2) represents the Manipulation phase, during which prices experience sudden initial changes, and with the aid of the True Open concept, the real starting point of the market’s movement is determined; in the third segment (Q3), the Distribution phase takes place, where prices are widely dispersed and price volatility reaches its peak; and finally, the fourth segment (Q4) is recognized as the Continuation/Reversal phase, in which the previous trend either continues or reverses.
This strategy, by harnessing the concepts of fractal time and smart algorithms, enables precise analysis of price patterns across multiple time frames and, through the identification of key points such as stop-run and liquidity zones, assists traders in optimizing their trading positions. Utilizing real market data and dividing time into Q1 through Q4 allows for a comprehensive and multi-level technical analysis in which optimal entry and exit points are identified by comparing prices to the True Open.
Thus, by focusing on keywords like Quarterly Theory ICT, True Open, Accumulation, Manipulation, Distribution, Continuation/Reversal, ICT, fractal time, smart algorithms, technical analysis, price patterns, trading positions, stop-run, and liquidity, the Quarterly Theory ICT strategy acts as a coherent framework for predicting market trends and developing trading strategies.
🔵b]Settings
Cycle Display Mode: Determines whether the cycle is displayed on the chart or on the indicator panel.
Show Cycle: Enables or disables the display of the ranges corresponding to each quarter within the micro cycles (e.g., Q1/1, Q1/2, Q1/3, Q1/4, etc.).
Show Cycle Label: Toggles the display of textual labels for identifying the micro cycle phases (for example, Q1/1 or Q2/2).
Table Display Mode: Enables or disables the ability to display cycle information in a tabular format.
Show Table: Determines whether the table—which summarizes the phases (Q1 to Q4)—is displayed.
Show More Info: Adds additional details to the table, such as the name of the phase (Accumulation, Manipulation, Distribution, or Continuation/Reversal) or further specifics about each cycle.
🔵 Conclusion
Quarterly Theory ICT provides a fractal and recurring approach to analyzing price behavior by dividing time into four quarters (Q1, Q2, Q3, and Q4) and defining the True Open at the beginning of the second phase.
The Accumulation, Manipulation (Judas Swing), Distribution, and Continuation/Reversal phases repeat in each cycle, allowing traders to identify price patterns with greater precision across annual, monthly, weekly, daily, and even micro-level time frames.
Focusing on the True Open as the primary reference point enables faster recognition of potential trend changes and facilitates optimal management of trading positions. In summary, this strategy, based on ICT principles and fractal time concepts, offers a powerful framework for predicting future market movements, identifying optimal entry and exit points, and managing risk in various trading conditions.

Wavemeter [theEccentricTrader]█ OVERVIEW
This indicator is a representation of my take on price action based wave cycle theory. The indicator counts the number of confirmed wave cycles, keeps a rolling tally of the average wave length, wave height and frequency, and displays the statistics in a table. The indicator also displays the current wave measurements as an optional feature.
█ CONCEPTS
Green and Red Candles
• A green candle is one that closes with a high price equal to or above the price it opened.
• A red candle is one that closes with a low price that is lower than the price it opened.
Swing Highs and Swing Lows
• A swing high is a green candle or series of consecutive green candles followed by a single red candle to complete the swing and form the peak.
• A swing low is a red candle or series of consecutive red candles followed by a single green candle to complete the swing and form the trough.
Peak and Trough Prices (Basic)
• The peak price of a complete swing high is the high price of either the red candle that completes the swing high or the high price of the preceding green candle, depending on which is higher.
• The trough price of a complete swing low is the low price of either the green candle that completes the swing low or the low price of the preceding red candle, depending on which is lower.
Historic Peaks and Troughs
The current, or most recent, peak and trough occurrences are referred to as occurrence zero. Previous peak and trough occurrences are referred to as historic and ordered numerically from right to left, with the most recent historic peak and trough occurrences being occurrence one.
Wave Cycles
A wave cycle is here defined as a complete two-part move between a swing high and a swing low, or a swing low and a swing high. As can be seen in the example above, the first swing high or swing low will set the course for the sequence of wave cycles that follow; a chart that begins with a swing low will form its first complete wave cycle upon the formation of the first complete swing high and vice versa.
Wave Length
Wave length is here measured in terms of bar distance between the start and end of a wave cycle. For example, if the current wave cycle ends on a swing low the wave length will be the difference in bars between the current swing low and current swing high. In such a case, if the current swing low completes on candle 100 and the current swing high completed on candle 95, we would simply subtract 95 from 100 to give us a wave length of 5 bars.
Average wave length is here measured in terms of total bars as a proportion as total waves. The average wavelength is calculated by dividing the total candles by the total wave cycles.
Wave Height
Wave height is here measured in terms of current range. For example, if the current peak price is 100 and the current trough price is 80, the wave height will be 20.
Amplitude
Amplitude is here measured in terms of current range divided by two. For example if the current peak price is 100 and the current trough price is 80, the amplitude would be calculated by subtracting 80 from 100 and dividing the answer by 2 to give us an amplitude of 10.
Frequency
Frequency is here measured in terms of wave cycles per second (Hertz). For example, if the total wave cycle count is 10 and the amount of time it has taken to complete these 10 cycles is 1-year (31,536,000 seconds), the frequency would be calculated by dividing 10 by 31,536,000 to give us a frequency of 0.00000032 Hz.
Range
The range is simply the difference between the current peak and current trough prices, generally expressed in terms of points or pips.
█ FEATURES
Inputs
Show Sample Period
Start Date
End Date
Position
Text Size
Show Current
Show Lines
Table
The table is colour coded, consists of two columns and, as many as, nine rows. Blue cells display the total wave cycle count and average wave measurements. Green cells display the current wave measurements. And the final row in column one, coloured black, displays the sample period. Both current wave measurements and sample period cells can be hidden at the user’s discretion.
Lines
For a visual aid to the wave cycles, I have added a blue line that traces out the waves on the chart. These lines can be hidden at the user’s discretion.
█ HOW TO USE
The indicator is intended for research purposes, strategy development and strategy optimisation. I hope it will be useful in helping to gain a better understanding of the underlying dynamics at play on any given market and timeframe.
For example, the indicator can be used to compare the current range and frequency with the average range and frequency, which can be useful for gauging current market conditions versus historic and getting a feel for how different markets and timeframes behave.
█ LIMITATIONS
Some higher timeframe candles on tickers with larger lookbacks such as the DXY , do not actually contain all the open, high, low and close (OHLC) data at the beginning of the chart. Instead, they use the close price for open, high and low prices. So, while we can determine whether the close price is higher or lower than the preceding close price, there is no way of knowing what actually happened intra-bar for these candles. And by default candles that close at the same price as the open price, will be counted as green. You can avoid this problem by utilising the sample period filter.
The green and red candle calculations are based solely on differences between open and close prices, as such I have made no attempt to account for green candles that gap lower and close below the close price of the preceding candle, or red candles that gap higher and close above the close price of the preceding candle. I can only recommend using 24-hour markets, if and where possible, as there are far fewer gaps and, generally, more data to work with. Alternatively, you can replace the scenarios with your own logic to account for the gap anomalies, if you are feeling up to the challenge.
It is also worth noting that the sample size will be limited to your Trading View subscription plan. Premium users get 20,000 candles worth of data, pro+ and pro users get 10,000, and basic users get 5,000. If upgrading is currently not an option, you can always keep a rolling tally of the statistics in an excel spreadsheet or something of the like.

WD Gann: Vertical Lines for Predefined Days/Bars AgoThis Pine Script draws vertical lines on the chart at specific time intervals, inspired by WD Gann’s theories of time cycles . WD Gann, a famous trader, believed that market movements were influenced by predictable time cycles. This script enables traders to visualize these key time cycles on the chart by placing vertical lines at predefined intervals (in bars ago), helping to identify potential turning points in the market.
The time intervals used in this script are inspired by Gann’s work, as well as astrological and numerological principles , which many traders believe influence market behavior . You can customize which time intervals (such as 3, 7, 9, 21, etc.) you want to track by enabling or disabling specific vertical lines on the chart.
Key Features:
Time Cycles Based on Gann’s Theory: Draws vertical lines at significant time intervals such as 3, 7, 9, 21, 27 bars ago, which are commonly used by Gann traders.
Astrological & Numerological Significance: The predefined intervals also align with key numerological and astrological values, allowing for a broader perspective on market cycles.
Customizable Intervals: You can choose which time intervals to display by enabling or disabling checkboxes for each cycle, allowing flexibility in chart analysis.
Visual Labels: Each vertical line is labeled with its corresponding "bars ago" value, providing clear reference points for the selected time cycles.
What Users Can Do:
Track and analyze market movements based on time cycles that are significant to Gann’s theory, as well as numerological and astrological influences.
Enable or disable vertical lines for specific cycles, like the 3-bar cycle, 9-bar cycle, or 365-bar cycle, depending on the intervals that align with your trading strategy.
Combine with other technical analysis tools and Gann techniques (e.g., Gann Angles, Gann Fans, or Square of Nine) for a more comprehensive trading approach.
This tool is designed for traders who believe in the power of time cycles to influence market behavior, and is especially useful for predicting turning points or key price movements based on these cycles.

CAP - CSICSI is a Digital Signal Processing (DSP) tool based on the principles of Lars von Thienen’s "Dynamic Cycles." Unlike traditional momentum oscillators, the CSI uses a recursive dual-thrust processor to isolate cyclic price action, helping traders identify hidden rhythms in the market rather than just static overbought or oversold levels.
How to Read the Indicator
This script focuses on four primary technical components:
Dynamic Band Pivots: The indicator calculates a "cyclic memory" (default 34 periods) to create high and low bands. When the CSI moves outside these bands and begins to pivot, it signals a potential cycle exhaustion point.
Momentum Slope: The color-coded area fill identifies the direction of the cycle's slope. A change in slope is often the first warning of a cycle peak or trough.
The Zero Line: The zero line acts as the "equilibrium" point. Position relative to zero helps define whether the current cycle is in a bullish or bearish regime.
Multi-Timeframe Analysis (HTF): The script includes an HTF filter (suggested 5x the chart timeframe) to ensure you are trading in the direction of the dominant macro cycle.
Performance & Testing: The "Trending" Challenge
This indicator has been developed and tested primarily on Futures (ES, NQ, RTY) and US Equities.
Important Note on False Signals: While the CSI "nails" turning points during standard cyclic/swing conditions, users should be aware of "phantom" cycles or false signals during strong trending conditions. In a powerful trend, the indicator may signal a cycle peak while price continues to move linearly, leading to premature exhaustion signals. Filtering these "trend-drifts" is the current focus of development.
Community & Collaboration
This script is an ongoing project. I am making it public to find like-minded traders interested in Lars von Thienen’s work to:
Refine the processor logic for better signal-to-noise ratios during impulsive trends.
Discuss the best "Trend Shields" (Volume, HTF, or Volatility filters) to stay in winners longer.
Share specific settings for different asset classes in the Futures and Equity markets.
