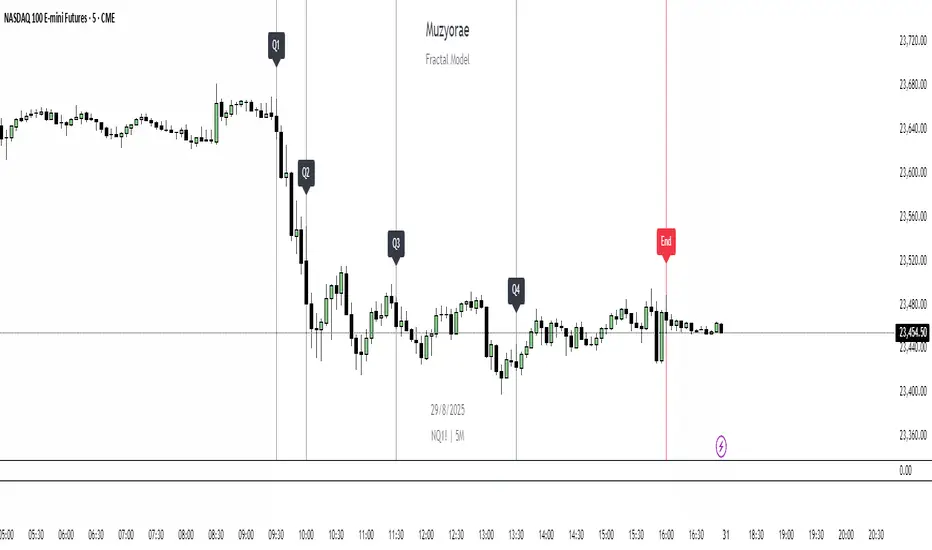
MCG - Meme Coin Gains [Logue]Meme Coin Gains. Investor preference for meme coin trading may signal irrational exuberance in the crypto market. If a large spike in meme coin gains is observed, a top may be near. Therefore, the gains of the most popular meme coins (DOGE, SHIB, SATS, ORDI, BONK, PEPE, and FLOKI) were averaged together in this indicator to help indicate potential mania phases, which may signal nearing of a top. Two simple moving averages of the meme coin gains are used to smooth the data and help visualize changes in trend. In back testing, I found a 10-day "fast" sma and a 20-day "slow" sma of the meme coin gains works well to signal tops and bottoms when extreme values of this indicator are reached.
Meme coins were not traded heavily prior to 2020. Therefore, there is only one cycle to test at the time of initial publication. Also, the meme coin space moves fast, so more meme coins may need to be added later. Also, once a meme coin has finished its mania phase where everyone and their mother has heard of it, it doesn't seem to run again (at least with the data up until time of publication). Therefore, the value of this indicator may not be great unless it is updated frequently.
The two moving averages are plotted. For the indicator, top and bottom "slow" sma trigger lines are plotted. The sma trigger line and the periods (daily) of the moving averages can be modified to your own preferences. The "slow" sma going above or below the trigger lines will print a different background color. Plot on a linear scale if you want to view this as similar to an RSI-type indicator. Plot on a log scale if you want to view as similar to a stochastic RSI.
Use this indicator at your own risk. I make no claims as to its accuracy in forecasting future trend changes of Bitcoin or the crypto market.
Cari dalam skrip untuk "Cycle"
MCV - Meme Coin Volume [Logue]Meme Coin Volume. Investor preference for meme coin trading may signal irrational exuberance in the crypto market. If a large spike in meme coin volume is observed, a top may be near. Therefore, the volume of the most popular meme coins was added together in this indicator to help indicate potential mania phases, which may signal nearing of a top. A simple moving average of the meme coin volume also helps visualize the trend while reducing the noise. In back testing, I found a 10-day sma of the meme coin volume works well.
Meme coins were not traded heavily prior to 2020. Therefore, there is only one cycle to test at the time of initial publication. Also, the meme coin space moves fast, so more meme coins may need to be added later.
The total volume is plotted along with a moving average of the volume. For the indicator, you are able to change the raw volume trigger line, the sma trigger line, and the period (daily) of the sma to your own preferences. The raw volume or sma going above their respective trigger lines will print a different background color.
Use this indicator at your own risk. I make no claims as to its accuracy in forecasting future trend changes of Bitcoin or the crypto market.
AMDX-XAMDGuided by ICT tutoring and also inspired by the teaching of
Daye', I create this versatile "AMDX" indicator.
A = Accumulation
M = Manipulation
D = Distribution
X = Continuation Or Reversal
This indicator shows a different way of viewing all the Timeframes by dividing them into Quarters, in this context the Trading sessions are divided into a 90m cycle, dividing each time range into Q1-Q2-Q3-Q4, in this way you have a clear vision of what the price is likely to do
True Open Times =
Opening Week - Monday at 6pm
Opening Day - 00:00
Asia -7.30pm
London -01.30
New York -07:30
PM -1.30pm
Session Times =
Q1 Asia 18:00-00:00
Q2 London 00:00-06:00
Q3 New York 06:00-12:00
Q4 PM 12:00-18:00
The user has the possibility to:
- Choose whether to display AMDX W
- Choose whether to display AMDX D
- Choose whether to display AMDX Session
- Choose to show the text in the Box
- Choose to show open levels
The indicator should be used as ICT and 'Daye' show in their concepts.
The indicator divides everything into Quarter ranges and classifies them into Q1-Q2-Q3-Q4 (as in the example above), and each Quarter has its own specific function, and can be used in this way:
If Q1 does an expansion it is likely that Q2 will do a consolidation, Q3 will do a Manipulation and Q4 will do a reversal returning to Q1
-If we are Bullish we buy under Open Session
-If we are Bearish we buy above open session
As in the example below:
If something is not clear, comment below and I will reply as soon as possible.
Recession Indicator (Unemployment Rate)Unemployment rate
percentage of unemployed individuals in an economy among individuals currently in the labour force. It is calcuated as Unemployed IndividualsTotal Labour Force × 100 where unemployed individuals are those who are currently not working but are actively seeking work.
The unemployment rate is one of the primary economic indicators used to measure the health of an economy. It tends to fluctuate with the business cycle, increasing during recessions and decreasing during expansions. It is among the indicators most commonly watched by policy makers, investors, and the general public.
Policy makers and central banks consider how much the unemployment rate has increased during a particular recession to gauge the recession’s impact on the economy and to decide how to tailor fiscal and monetary policies to mitigate its adverse effects. In addition, central banks carefully try to predict the future trend of the unemployment rate to devise long-term strategies to lower it.
This indicator is a representation of yearly rate of change of Unemployment rate. Historically (not always) when ROC(Yearly) of Unemployment rate crossover zero line was a signal of recession or economic contraction.
DR/IDR of Omega by TRSTNThis is an EXPERIMENTAL Script by @TRSTNGLRD derived from the coding of @IAmMas7er's "DR/IDR" Indicator that adds a total of 11 additional DR / IDR Ranges on both lower and higher timeframes.
This script is no-longer being worked on, so I have made it public.
Background:
This Script utilizes the Fibonacci-Doubling Sequence between the range of 18:30pm and 16:55pm NY-Time. Each Cycle is grouped into the following:
Omega/2, Omega/4, Omega/8, and Omega/16
The Mas7er's three original sessions are: Omega/4v1, Omega/4v2, and Omega/8v1
These three Sessions above take rule over all others. If you are looking to back-test this version of the script, please use the Experimental ranges as confirmation for the three above.
Important Notes:
- Please only select Sessions with their respected groups (All of Omega/4, All of Omega/16, etc...) rather than selecting all of them at once.
If you select all of them at once, the ranges will not be correct and cut each other off.
The only exceptions to this rule are the Mas7er's original ranges above.
- If you wish to have multiple groups of Ranges together, please add a second indicator to your chart.
- Omega/16v1 and Omega/16v6 are known to have a high-probability of a Judas Swing (takes out both sides of the range) - Be Cautious!
- Omega/2v1 is a very large DR / IDR range. I am working on shrinking it in size, but have more experimenting to do with different ranges.
- I do not use the experimental ranges with the IDR , only the DR . I have not been able to define probabilities fully yet, but the levels are respected nonetheless.
This script is not supposed to work EXACTLY like the Mas7er's, rather, generally instead.
Please comment and leave your opinion below about which ranges work the best and how you may utilize them.
Thank you!
CyCLOPECyCLOPE - CYCLe OPErator
by Antonio Pace 2022
All right reserved
The script uses time series decomposition tecniques for decompose the price signal into 10 harmonics waves of increasing
period and wavelength, the sum of which is the signal itself, to eliminate background noise and show a cleaner signal.
Also divides the high frequencies (secondary, short period trend) from the primary trend (long period trend),
which is composed of low frequencies, and show both separately.
Find highs and lows and indicate possible trend reversals, and favorable entry or exit points.
T0 is the basic harmonic with period 8 Time Unit (TU) of the current timeframe.
T1 has a double period compared to T0, T2 has a double period compared to T1 and so on.
The script composes the primary trend by adding the First 5 harmonics of the longer period (T7 + T6 + T5 + T4 + T3), therefore of low frequency.
This eliminates the noise (short-term retracements) from the main trend.
Similarly, it reconstructs the secondary trend (a possible retracement of a primary trend) by adding the two harmonics with the high frequency (T2 + T1)
T0 the harmonic with highest frequency it is too noisy for this TimeFrame and is left out.
The script then identifies the maximums and minimums of the primary trend and the secondary trend, indicating possible trend reversal points or favorable entry points in a continuing trend.
The script finds the maxima and minima of the reconstructed signal so as to have as little noise as possible.
The reconstructed signal is shown on the screen. The blue line for the long term trend and the orange line for the short time trend.
If the cloud changes from red to green, it means that a local minimum has formed on the main tred, we are in the presence of a possible bullish inversion.
If the cloud turns from green to red then a local high has formed, a bearish trend reversal may have started.
The line on the cloud represents the subtrend instead.
If the line goes from green to red it has formed a maximum and if it goes from red to green it has formed a minimum.
For instance:
If the line is red and the cloud becomes red we are in the presence of a possible inversion and the beginning of a bearish trend.
I exit the long position and into the short position.
Similarly If the cloud is red and the line is green it means that I have a rising subtrend in a bearish dominate trend.
If the line turns red I have a bearish entry point.
If the cloud turns green the low of the subtrend has also become a low of the main trend, a bullish trend has started.
The script is designed to run on a daily timeframe, but it should work on any timeframe provided there are enough Time Units (1024 TU) in the past.
Minimum usable timeframe: 8h, at shorter timeframes the signal becomes indistinguishable from noise.
when the main trend and the sub-trend have the same magnitude, that is, the line and the cloud have the same size, but different color the noise prevails,
there is no valid information.
Wait for them to become the same color to enter the market again.
Once you have chosen the timeframe and asset on which to operate, select the harmonics to compose the main trend and those to compose the secondary trend
so that the indicator matches as much as possible with the real results.
Looking for the right balance between signal and noise and then continuing to use these settings, for this specific timeframe.
if you don't want have both Long Term and Short Trend trend on screen you can hide the short therm and add is harmonic to LongTime trend
in these case gren cloud indicate long and red color indicate short.
VERY IMPORTANT!
THE LONG TERM TREND DOMINATE OVER THE SHORT TERM TREND EXCEPT WHERE BOTH HAVE SAME MAGNITUDE.
The short term trend describe price retracemet over long term trend,
enter to market only when both have the same color.
Use short therm trend to find maximum or minimum of retracement.
FIND AND USE THE MINIMUM NUMBER OF WAVE PER TREND, THE RISK IS OVER FITTING THE PRICE LINE AND CREATE CONFUSION.
THE SCRIPT WORK BEST FOR DAILY TIMEFRAME AND COME CONFIGURED FOR THIS.
ETH Gravity OscillatorThis indicator is a deviation of a Center of Gravity Oscillator corrected for the diminishing returns of Ethereum.
I've set up this indicator for it to be used on the weekly timeframe . The indicator oscillates between 0 and 10, where 0 indicates oversold conditions and 10 indicates overbought conditions. What is interesting is that it is not particularly ideal for identifying market cycle tops, but generally picks out the most euphoric region in the initial parabolic rally. Good to potentially keep in mind if there is a second bounce to the peak!
The indicator plots in any ETH charts. It paints in all time frames, but Weekly time frame is the correct one to interpret the 'official' read of it.
Made at the request of a kind commenter. If you would like to request different derivations of this script be sure to let me know!
Gann Seasonal Dates - CEGann Seasonal Dates - Community Edition
Welcome to the Gann Seasonal Dates V1.61 - Community Edition, a powerful tool designed to enhance time-based trading with W.D. Gann’s seasonal date methodology. This feature-complete indicator allows traders to plot critical seasonal dates on charts for equities, forex, commodities, and cryptocurrencies. It empowers traders to anticipate market turning points with precision.
Overview
The Gann Seasonal Dates plots Gann’s major and minor seasonal dates, which are rooted in the cyclical nature of solstices, equinoxes, and their midpoints. Major dates include the vernal equinox (March 21st), summer solstice (June 22nd), autumnal equinox (September 23rd), and winter solstice (December 22nd). Minor dates mark the halfway points between these events (February 4th, May 6th, July 23rd, August 8th, November 7th, and November 22nd). With customizable styling and historical data up to 50 years, this script helps traders identify key time-based market events.
Key Features
Major and Minor Seasonal Dates : Plot four major dates (solstices and equinoxes) and six minor dates (midpoints) to highlight potential market turning points.
Customizable Date Selection : Enable or disable individual major and minor dates to focus on specific cycles relevant to your analysis.
Historical Data Range : Adjust the lookback period up to 50 years, with recommendations for optimal performance based on your TradingView plan (5 years for Basic, 20 for Pro/Pro+/Premium).
Styling Options : Customize line styles (solid, dotted, dashed) and colors for major and minor dates to enhance chart clarity.
Labeled Visuals : Each plotted date includes a label with a tooltip (e.g., "Vernal equinox") for easy identification and context.
How It Works
Configure Settings : Enable major and/or minor dates and select specific dates (e.g., March 21st, February 4th) to display on your chart.
Set Historical Range : Adjust the years of data (up to 50) to plot historical seasonal dates, ensuring compatibility with your TradingView plan’s processing limits.
Customize Styling : Choose line styles and colors for major and minor dates to differentiate them visually.
Analyze and Trade : Use the plotted vertical lines and labels to identify potential market turning points, integrating Gann’s time-based cycles into your strategy.
Get Started
As a gift to the TradingView community and Gann traders, the Gann Seasonal Dates - Community Edition is provided free of charge. With no features locked, this tool offers full access to Gann’s seasonal date methodology for precise time-based analysis. Trade wisely and leverage the power of seasonal cycles!
TASC 2025.02 Autocorrelation Indicator█ OVERVIEW
This script implements the Autocorrelation Indicator introduced by John Ehlers in the "Drunkard's Walk: Theory And Measurement By Autocorrelation" article from the February 2025 edition of TASC's Traders' Tips . The indicator calculates the autocorrelation of a price series across several lags to construct a periodogram , which traders can use to identify market cycles, trends, and potential reversal patterns.
█ CONCEPTS
Drunkard's walk
A drunkard's walk , formally known as a random walk , is a type of stochastic process that models the evolution of a system or variable through successive random steps.
In his article, John Ehlers relates this model to market data. He discusses two first- and second-order partial differential equations, modified for discrete (non-continuous) data, that can represent solutions to the discrete random walk problem: the diffusion equation and the wave equation. According to Ehlers, market data takes on a mixture of two "modes" described by these equations. He theorizes that when "diffusion mode" is dominant, trading success is almost a matter of luck, and when "wave mode" is dominant, indicators may have improved performance.
Pink spectrum
John Ehlers explains that many recent academic studies affirm that market data has a pink spectrum , meaning the power spectral density of the data is proportional to the wavelengths it contains, like pink noise . A random walk with a pink spectrum suggests that the states of the random variable are correlated and not independent. In other words, the random variable exhibits long-range dependence with respect to previous states.
Autocorrelation function (ACF)
Autocorrelation measures the correlation of a time series with a delayed copy, or lag , of itself. The autocorrelation function (ACF) is a method that evaluates autocorrelation across a range of lags , which can help to identify patterns, trends, and cycles in stochastic market data. Analysts often use ACF to detect and characterize long-range dependence in a time series.
The Autocorrelation Indicator evaluates the ACF of market prices over a fixed range of lags, expressing the results as a color-coded heatmap representing a dynamic periodogram. Ehlers suggests the information from the periodogram can help traders identify different market behaviors, including:
Cycles : Distinguishable as repeated patterns in the periodogram.
Reversals : Indicated by sharp vertical changes in the periodogram when the indicator uses a short data length .
Trends : Indicated by increasing correlation across lags, starting with the shortest, over time.
█ USAGE
This script calculates the Autocorrelation Indicator on an input "Source" series, smoothed by Ehlers' UltimateSmoother filter, and plots several color-coded lines to represent the periodogram's information. Each line corresponds to an analyzed lag, with the shortest lag's line at the bottom of the pane. Green hues in the line indicate a positive correlation for the lag, red hues indicate a negative correlation (anticorrelation), and orange or yellow hues mean the correlation is near zero.
Because Pine has a limit on the number of plots for a single indicator, this script divides the periodogram display into three distinct ranges that cover different lags. To see the full periodogram, add three instances of this script to the chart and set the "Lag range" input for each to a different value, as demonstrated in the chart above.
With a modest autocorrelation length, such as 20 on a "1D" chart, traders can identify seasonal patterns in the price series, which can help to pinpoint cycles and moderate trends. For instance, on the daily ES1! chart above, the indicator shows repetitive, similar patterns through fall 2023 and winter 2023-2024. The green "triangular" shape rising from the zero lag baseline over different time ranges corresponds to seasonal trends in the data.
To identify turning points in the price series, Ehlers recommends using a short autocorrelation length, such as 2. With this length, users can observe sharp, sudden shifts along the vertical axis, which suggest potential turning points from upward to downward or vice versa.
Vibration BoxFirst Public release of the Vibration Box
WARNING - THESE CYCLES CANNOT PREDICT PERFECT "UP & DOWN" MOTION
There is absolutely no guarantee that these cycles will predict perfect "up & down" motion for the markets
Please be aware that this tool is to be used with a robust risk management system
These cycles are representative of "circle geometry within a square of price & time"
Slowly, I will build up some ideas to go along with this script so that you can learn to apply it to many different markets in many different ways
Those familiar with the work of W.D. Gann should be able to utilize this tool in many different ways
Instructions:
Place the box down with 2 mouse clicks (first is for bottom left corner & second is for top right corner)
NOTE: DUE TO TRADINGVIEW LIMITATIONS
-There is a maximum of 12 divisions for your box/vibration (I will work on increasing this number)
-You MUST choose a coordinate that is within the price action that has already occurred
-You CANNOT initially place the box BEFORE THE FIRST BAR of data
-You CANNOT initially place the box BEYOND THE LAST BAR of data
THEN, ONCE YOU HAVE PLACED THE BOX FOR THE FIRST TIME
YOU CAN MANUALLY ADJUST THE DATES WITHIN THE SETTINGS TO PLACE THE BOX IN ANYWAY YOU WOULD LIKE!
Planetary Speed - CEPlanetary Speed - Community Edition
Welcome to the Planetary Speed - Community Edition , a specialized tool designed to enhance W.D. Gann-inspired trading by plotting the speed of selected planets. This indicator measures changes in planetary ecliptic longitudes, which may correlate with market timing and volatility, making it ideal for traders analyzing equities, forex, commodities, and cryptocurrencies.
Overview
The Planetary Speed - Community Edition calculates the speed of a chosen planet (Mercury, Venus, Mars, Jupiter, Saturn, Uranus, Neptune, or Pluto) by comparing its ecliptic longitude across time. Supporting heliocentric and geocentric modes, the script plots speed data with high precision across various chart timeframes, particularly for markets open 24/7 like cryptocurrencies. Traders can customize line colors and add multiple instances for multi-planet analysis, aligning with Gann’s belief that planetary cycles influence market trends.
Key Features
Plots the speed of eight planets (Mercury, Venus, Mars, Jupiter, Saturn, Uranus, Neptune, Pluto) based on ecliptic longitude changes
Supports heliocentric and geocentric modes for flexible analysis
Customizes line colors for clear visualization of planetary speed data
Projects future speed data up to 250 days with daily resolution
Works across default TradingView timeframes (except monthly) for continuous markets
Enables multiple script instances for tracking different planets on the same chart
How to Use
Access the script’s settings to configure preferences
Choose a planet from Mercury, Venus, Mars, Jupiter, Saturn, Uranus, Neptune, or Pluto
Select heliocentric or geocentric mode for calculations
Customize the line color for speed data visualization
Review plotted speed data to identify potential market timing or volatility shifts
Add multiple instances to track different planets simultaneously
Get Started
The Planetary Speed - Community Edition provides full functionality for astrological market analysis. Designed to highlight Gann’s planetary cycles, this tool empowers traders to explore celestial influences. Trade wisely and harness the power of planetary speed!
Time Block with Current K-Line TimeThis indicator divides the market into fixed time blocks (daily, three-day, weekly, monthly, and yearly) and displays 1/4, 1/2, and 3/4 dividing lines within each block, indicating key price positions within the block.
————————————
Description:
1. Generally speaking, the duration of a market period is one time block within the corresponding period.
2. Supports display of the current candlestick time, the dividing line for the next block, and a countdown.
3. Multi-time zone support: Shanghai, New York, London, Tokyo, and UTC. Time display automatically adapts to the selected time zone.
4. Time block visualization: Select the time block length based on the observation period and draw dividers at the time block boundaries.
5. Real-time time display: Detailed time of the current candlestick chart (year/month/day, hour:minute, day of the week).
6. Future time prediction: Displays the next time block's start position with a future divider. A countdown function displays the time until the next block, helping to determine the remaining duration of the current trend.
————————————
Use scenarios:
Day trading: Identify trading day boundaries (1-day blocks)
Swing trading: Optimize weekly/monthly time frame transitions (1-week/1-month blocks)
Long-term investment: Observe annual market cycles (1-year blocks)
Cross-time zone trading: Seamlessly switch between major global trading time zones.
————————————
Functions:
- Time block division to observe market cycles
- Draw 1/4, 1/2, and 3/4 dividers to assist in trading decisions
- Current K-line Time Display
- Future Block Divider and Countdown Indicator
————————————
How to Use:
Can be combined with trend lines or other trend-following tools to identify trend-following entry opportunities near the dividing line and follow the main trend.
——————————————————————————————————————————————————————————
本指标将行情划分为固定时间区块(日、三日、周、月、年),并在每个区块内显示1/4、1/2、3/4分割线,标示区块内关键价格位置
————————————
描述:
1. 通常而言,一段行情的持续时间为对应周期下的一个时间区块
2. 支持显示当前K线时间及下一个区块的分割线和倒计时。
3. 多时区支持,支持上海、纽约、伦敦、东京、UTC五大交易时区,自适应所选时区的时间显示
4. 时间区块可视化:根据观测周期选择时间区块长度,在时间区块边界绘制分隔线
5. 实时时间显示:当前K线详细时间(年/月/日 时:分 星期)
6. 未来时间预测,下一个时间区块开始位置显示未来分割线,倒计时功能显示距离下个区块的时间,用于辅助判断当前趋势的剩余持续时间
————————————
使用场景:
日内交易:识别交易日边界(1日区块)
波段交易:把握周/月时间框架转换(1周/1月区块)
长期投资:观察年度市场周期(1年区块)
跨时区交易:无缝切换全球主要交易时区
————————————
功能:
- 时间区块划分,观察行情周期
- 绘制1/4、1/2、3/4分割线,辅助交易判断
- 当前K线时间显示
- 未来区块分割线及倒计时提示
————————————
使用方法:
可结合趋势线或其他趋势跟随工具,在分割线附近寻找顺势进场机会,追随主趋势
CVDD Z-ScoreCumulative Value Days Destroyed (CVDD) - The CVDD was created by Willy Woo and is the ratio of the cumulative value of Coin Days Destroyed in USD and the market age (in days). While this indicator is used to detect bottoms normally, an extension is used to allow detection of BTC tops. When the BTC price goes above the CVDD extension, BTC is generally considered to be overvalued. Because the "strength" of the BTC tops has decreased over the cycles, a logarithmic function for the extension was created by fitting past cycles as log extension = slope * time + intercept. This indicator is triggered for a top when the BTC price is above the CVDD extension. For the bottoms, the CVDD is shifted upwards at a default value of 120%. The slope, intercept, and CVDD bottom shift can all be modified in the script.
Now with the automatic Z-Score calculation for ease of classification of Bitcoin's valuation according to this metric.
Created for TRW.
Risk On/Off Index [SwissAlgo]Risk On/Off Index - Sector Rotation Analysis
----------------------------------------------------
What it does:
This indicator estimates market risk appetite by comparing the weighted performance of growth/cyclical sectors (Risk-On) against defensive sectors (Risk-Off).
It provides a normalized oscillator that ranges from -1 (extreme risk-off) to +1 (extreme risk-on), which may help traders identify potential shifts in market sentiment and sector rotation patterns.
The analysis examines whether institutional money flows favor aggressive growth assets or seek safety in defensive positions, potentially offering insights into the underlying risk tolerance that drives market movements. When properly interpreted alongside other analyses, this information could assist in understanding broader market cycles and sentiment transitions.
----------------------------------------------------
How it works:
The indicator analyzes 11 major sector ETFs weighted by their actual market capitalization representation:
Risk-On sectors (70% weight) : Technology (28%), Financials (11%), Consumer Discretionary (10%), Communication (9%), Industrials (8%), Energy (4%), Materials (2.5%), Real Estate (2%)
Risk-Off sectors (30% weight) : Healthcare (13%), Consumer Staples (6%), Utilities (2.5%)
The algorithm calculates the weighted performance difference over your selected timeframe (7 days to 12 months) and normalizes it using three methods: Simple Difference, Tanh Normalized, or Historical Range. A 7-period EMA smooths the signal, while a longer signal line (default 50) provides trend context.
----------------------------------------------------
Visual Features:
Main curve (Risk Appetite Delta) : The primary line shows the smoothed (7-period EMA) risk appetite reading. When above zero, growth sectors are outperforming defensive sectors (risk-on sentiment). When below zero, defensive sectors are outperforming growth sectors (risk-off sentiment).
Signal line : A longer EMA (default 50-period) of the risk appetite data that represents the underlying trend. Crossovers between the main curve and signal line may indicate potential momentum shifts in market sentiment (potential long signal when the crossover happens in extreme risk-off zones, and potential short signal when the crossunder occurs in extreme risk-on zones)
Dynamic color coding : The main curve color reflects both position and momentum:
Red : Risk-on territory (>0) with strengthening momentum (above signal line)
Green : Risk-on territory (>0) but weakening momentum (below signal line) - potential reversal warning
Maroon : Risk-off territory (<0) but strengthening momentum (above signal line) - potential reversal warning
Lime : Risk-off territory (<0) with strengthening momentum (below signal line)
Gradient background zones : Subtle fills indicate risk appetite intensity levels from moderate (0 to ±0.25) through strong (±0.25 to ±0.5) to extreme (±0.5 to ±1.0)
Sector breakdown table : Shows individual sector performance with clear Risk-On/Risk-Off categorization
Reference levels : Horizontal lines mark neutral (0), strong (±0.5), and extreme (±1) risk appetite zones
This color system allows traders to quickly assess not just current sentiment (above/below zero) but also whether that sentiment is strengthening or potentially reversing based on the relationship with the signal line.
----------------------------------------------------
Who may benefit:
Portfolio managers rotating between growth and defensive allocations
Swing traders timing sector rotation plays
Risk managers monitoring overall market sentiment
Asset allocators adjusting exposure based on risk appetite cycles
----------------------------------------------------
Key applications:
Identify when markets transition from growth-seeking to risk-averse behavior
Time entries into cyclical sectors during risk-on phases
Rotate to defensive sectors when risk appetite weakens
Spot divergences between individual stocks and broader market sentiment
----------------------------------------------------
Limitations:
This indicator reflects US equity sector dynamics and may not capture risk sentiment in other asset classes or geographic regions. ETF-based analysis introduces slight tracking differences from underlying sector performance. Past performance patterns do not guarantee future results.
----------------------------------------------------
Disclaimer:
This indicator is for educational and analytical purposes only. It does not constitute financial advice or trading recommendations. Users should conduct their own analysis and risk assessment before making investment decisions. SwissAlgo assumes no responsibility for trading losses or investment outcomes based on this indicator's signals.
Goichi Hosoda TheoryGreetings to traders. I offer you an indicator for trading according to the Ichimoku Kinho Hyo trading system. This indicator determines possible time cycles of price reversal and expected asset price values based on the theory of waves and time cycles by Goichi Hosoda.
The indicator contains classic price levels N, V, E and NT, and is supplemented with intermediate levels V+E, V+N, N+NT and x2, x3, x4 for levels V and E, which are used in cases where the wave does not contain corrections and there is no possibility to update the impulse-corrective wave.
A function for counting bars from points A B and C has also been added.
US Presidential Elections (Names & Dates)US Presidential Elections (Names & Dates)
Description :
This indicator marks key dates in US presidential history, highlighting both election days and inauguration dates. It's designed to provide historical context to your charts, allowing you to see how major political events align with market movements.
Key Features:
• Displays US presidential elections from 1936 to 2052
• Shows inauguration dates for each president
• Customizable colors and styles for both election and inauguration markers
• Toggle visibility of election and inauguration labels separately
• Adapts to different timeframes (daily, weekly, monthly)
• Includes president names for historical context
The indicator uses yellow labels for election days and blue labels for inauguration dates. Election labels show the year and "Election", while inauguration labels display the name of the incoming president.
Customization options include:
• Colors for election and inauguration labels and text
• Line widths for both types of events
• Label placement styles
This tool is perfect for traders and analysts who want to correlate political events with market trends over long periods. It provides a unique perspective on how presidential cycles might influence financial markets.
Note: Future elections (2024 onwards) are marked with a placeholder (✅) as the presidents are not yet known.
Use this indicator to:
• Identify potential market patterns around election cycles
• Analyze historical market reactions to specific presidencies
• Add political context to your long-term chart analysis
Enhance your chart analysis with this comprehensive view of US presidential history!
CVDD - Coin Value Days Destroyed for Bitcoin (BTC) [Logue]Cumulative Value Days Destroyed (CVDD) - The CVDD was created by Willy Woo and is the ratio of the cumulative value of Coin Days Destroyed in USD and the market age (in days). While this indicator is used to detect bottoms normally, an extension is used to allow detection of BTC tops. When the BTC price goes above the CVDD extension, BTC is generally considered to be overvalued. Because the "strength" of the BTC tops has decreased over the cycles, a logarithmic function for the extension was created by fitting past cycles as log extension = slope * time + intercept. This indicator is triggered for a top when the BTC price is above the CVDD extension. For the bottoms, the CVDD is shifted upwards at a default value of 120%. The slope, intercept, and CVDD bottom shift can all be modified in the script.
Cycle Channel Oscillator [LazyBear]Here's an oscillator derived from my previous script, Cycle Channel Clone ().
There are 2 oscillator plots - fast & slow. Fast plot shows the price location with in the medium term channel, while slow plot shows the location of short term midline of cycle channel with respect to medium term channel.
Usage of this is similar to %b oscillator. The slow plot can be considered as the signal line.
Bar colors can be enabled via options page. When short plot is above 1.0 or below 0, they are marked purple (both histo and the bar color) to highlight the extreme condition.
This makes use of the default 10/30 values of Cycle Channel, but may need tuning for your instrument.
More info:
List of my free indicators: bit.ly
List of my app-store indicators: blog.tradingview.com (More info: bit.ly)
Global Liquidity Proxy vs BitcoinGlobal Liquidity Proxy vs Bitcoin. Helps to understand the cycles with liquidty.
Planetary Signs - CEPlanetary Signs - Community Edition
Welcome to the Planetary Signs - Community Edition , a specialized tool designed to enhance W.D. Gann-inspired trading by highlighting zodiac sign transitions for selected planets. This indicator marks when planets enter specific zodiac signs, which may correlate with market turning points, making it ideal for traders analyzing equities, forex, commodities, and cryptocurrencies.
Overview
The Planetary Signs - Community Edition calculates the ecliptic longitude of a chosen planet (Sun, Moon, Mercury, Venus, Mars, Jupiter, Saturn, Uranus, Neptune, or Pluto) and highlights periods when it enters user-selected zodiac signs (Aries, Taurus, Gemini, etc.). Supporting heliocentric and geocentric modes, the script plots sign transitions with minute-level accuracy, syncing perfectly with chart timeframes. Traders can customize colors for each sign and add multiple instances for multi-planet analysis, aligning with Gann’s belief that zodiac transitions influence market trends.
Key Features
Highlights zodiac sign transitions for ten celestial bodies (Sun, Moon, Mercury, Venus, Mars, Jupiter, Saturn, Uranus, Neptune, Pluto)
Supports heliocentric and geocentric modes (Pluto heliocentric-only; Sun and Moon geocentric)
Allows selection of one or multiple zodiac signs with customizable highlight colors
Plots vertical lines and labels (e.g., “☿ 0 ♈ Aries”) at sign transitions with minute-level accuracy
Projects future sign transitions up to 120 days with daily resolution
Enables multiple script instances for tracking different planets or signs on the same chart
How to Use
Access the script’s settings to configure preferences
Choose a planet from the Sun, Moon, Mercury, Venus, Mars, Jupiter, Saturn, Uranus, Neptune, or Pluto
Select one or more zodiac signs (e.g., Aries, Taurus) to highlight
Customize the highlight color for each selected zodiac sign
Select heliocentric or geocentric mode for calculations
Review highlighted periods and labeled lines to identify zodiac sign transitions
Use transitions to anticipate potential market turning points, integrating Gann’s astrological principles
Get Started
The Planetary Signs - Community Edition provides full functionality for astrological market analysis. Designed to highlight Gann’s zodiac cycles, this tool empowers traders to explore celestial transitions. Trade wisely and harness the power of planetary alignments!
Muzyorae - ICT Quarterly Theory (Intraday)ICT Quarterly Theory — Intraday
What it is
ICT’s Quarterly Theory models the intraday session as repeating cycles of four “quarters.” On NY time, a trading day is split into four macro quarters of 6 hours each:
Q1: 00:00–06:00 NY (Asia / pre-London)
Q2: 06:00–12:00 NY (London–NY overlap, AM session)
Q3: 12:00–18:00 NY (Midday / PM session)
Q4: 18:00–24:00 NY (Asia re-open / late session)
Each macro quarter can be further subdivided into micro quarters of 90 minutes (q1–q4). This fractal view helps traders frame accumulation → expansion → distribution → liquidation phases and align executions with time-of-day liquidity.
Why it matters
Orderflow, liquidity raids, and displacement are highly time-dependent. Marking the quarters makes it easier to:
Anticipate when the market is likely to deliver the day’s expansion (often Q2) versus retracement/distribution (often Q3) or late liquidity runs (often Q4).
Compare today’s behavior to prior days within the same quarter windows.
Anchor bias, entries, and risk management to session-specific highs/lows rather than arbitrary clock times.
What this indicator shows
Macro quarters (6h): Vertical lines and optional labels (Q1–Q4) on NY time.
Micro quarters (90m): Optional finer verticals inside each macro quarter (q1–q4) for precise timing.
True Open (Q2 AM): Optional line at the AM session’s true open (default 06:00 NY) to study premium/discount development from the intraday benchmark.
Futures Sunday handling: Optional treatment of Sunday 18:00 NY as Q4 (useful for FX/futures).
Label controls: Choose above/below placement, offset, size, and colors; micro labels can be toggled independently.
Performance-friendly: De-duplicated labels and a look-back “days to show” setting keep charts clean.
How to use
Timeframe: Works on intraday charts (1–60m). 5–15m is a common balance of signal vs. noise.
Bias framing:
Map Asia (Q1), AM expansion (Q2), midday distribution (Q3), late session runs (Q4).
Compare where the daily range forms versus the True Open to gauge premium/discount and likely continuations.
Execution: Look for standard ICT tools (liquidity sweeps, FVGs, displacement, PD arrays) inside the active quarter to avoid fighting time-of-day flow.
Review: Scroll back multiple days and evaluate where the day’s high/low typically forms relative to Q2–Q3; adapt expectations.
Settings (high level)
Show Macro Labels / Micro Lines / Micro Labels
Label position (above/below), X-shift, colors, sizes
Days to show, de-dup window (prevents label overlaps)
Q2 True Open toggle and extension (doesn't work)
Include Sunday as Q4 (18:00 NY)
Notes
Quarter boundaries are fixed to America/New York session logic to match ICT timing.
This is a context tool; it does not generate buy/sell signals. Combine with your existing execution model.
Past behavior does not guarantee future results. Use proper risk management.
Gann Static Square of 9 - CEGann Static Square of 9 - Community Edition
Welcome to the Gann Static Square of 9 - Community Edition, a meticulously crafted tool designed to empower traders with the timeless principles of W.D. Gann’s Square of 9 methodology. This indicator is tailored for the TradingView community and Gann Traders, providing a robust solution for analyzing price and time dynamics across various markets.
Overview
The Gann Static Square of 9 harnesses the mathematical precision of Gann’s Square of 9 chart, plotting key price and time levels based on a fixed starting point of 1. Unlike its dynamic counterpart , this static version uses a consistent origin, making it ideal for traders seeking to map Gann’s geometric angles (45°, 90°, 135°, 180°, 225°, 270°, 315°, and 360°) with a standardized framework. By adjusting the price and time units, users can tailor the indicator to suit any asset, from equities and forex to commodities and cryptocurrencies.
Key Features
Fixed Starting Point: Begins calculations at a base value of 1, providing a standardized approach to plotting Gann’s Square of 9 levels.
Comprehensive Angle Projections: Plots eight critical Gann angles (45°, 90°, 135°, 180°, 225°, 270°, 315°, and 360°), enabling precise identification of support, resistance, and time-based targets.
Customizable Price and Time Units: Adjust the price unit (Y-axis) and time unit (X-axis) to align with the specific characteristics of your chosen market, ensuring optimal fit for price action and volatility.
Horizontal and Vertical Levels: Enable horizontal price levels to identify key support and resistance zones, and vertical time levels to pinpoint potential market turning points.
Revolution Control: Extend projections across multiple 360° cycles to uncover long-term price and time objectives, with user-defined revolution counts.
Customizable Aesthetics: Assign distinct colors to each angle for enhanced chart clarity and visual differentiation.
and more!
How It Works
Configure Settings: Set the price and time units to match your asset’s characteristics, and select the desired number of revolutions to project future levels.
Enable Levels: Choose which Gann angles (45° to 360°) to display, tailoring the indicator to your analysis needs.
Visualize Key Levels: The indicator plots horizontal price levels and optional vertical time levels, each labeled with its corresponding angle and price/time value.
Analyze and Trade: Leverage the plotted levels to identify critical support, resistance, and time-based turning points, enhancing your trading strategy with Gann’s proven methodology.
Get Started
As a token of appreciation for the TradingView community, and Gann traders, this Community Edition is provided free of charge. Trade safe and enjoy!
US Presidents 1920–2024Description:
This indicator displays all U.S. presidential elections from 1920 to 2024 on your chart.
Features:
Vertical lines at the date of each presidential election.
Line color by party:
Red = Republican
Blue = Democrat
Gray = Other/None
Labels showing the name of each president.
Modern flag style: Presidents from 1900 onward are highlighted as modern, giving clear historical separation.
Fully overlayed on the price chart for timeline context.
Customizable: Label position (above/below bar) and line width.
Use case: Useful for analyzing modern U.S. presidential cycles, market reactions to elections, or quickly referencing recent presidents directly on charts.