Bitcoin Halving Cycle Profit (with info table)English
Indicator Description:
Based on the original indicator by @KevinSvenson_
A table with dates was added for study purposes, however the resulting dates are not validated.
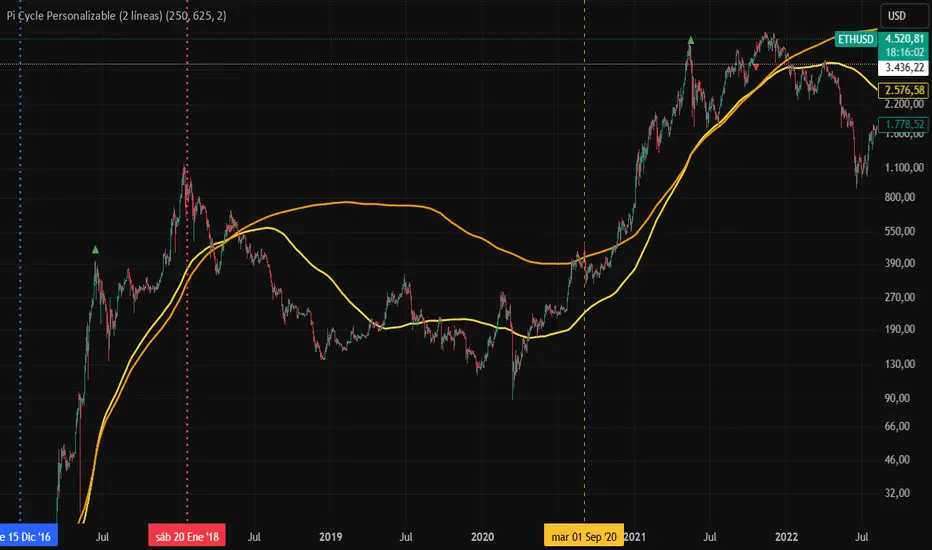
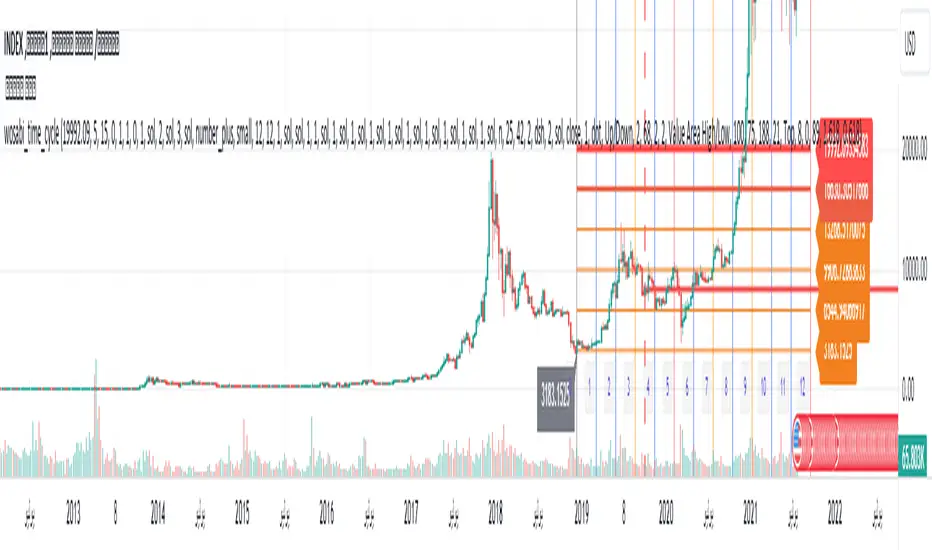
The Halving Cycle Profit indicator represents a fixed, recurring profit-taking cycle that begins with each Bitcoin halving event.
Functionality Explained:
After every halving event, there has historically been a fixed number of weeks that marked the area of highest profitability for taking profits.
• 40 weeks post-halving = Start of the optimal profit-taking zone.
• 80 weeks post-halving = “Last call” for profit-taking before the bear market.
• 135 weeks post-halving = Optimal area to begin Dollar-Cost Averaging (DCA).
Penunjuk Pine Script®