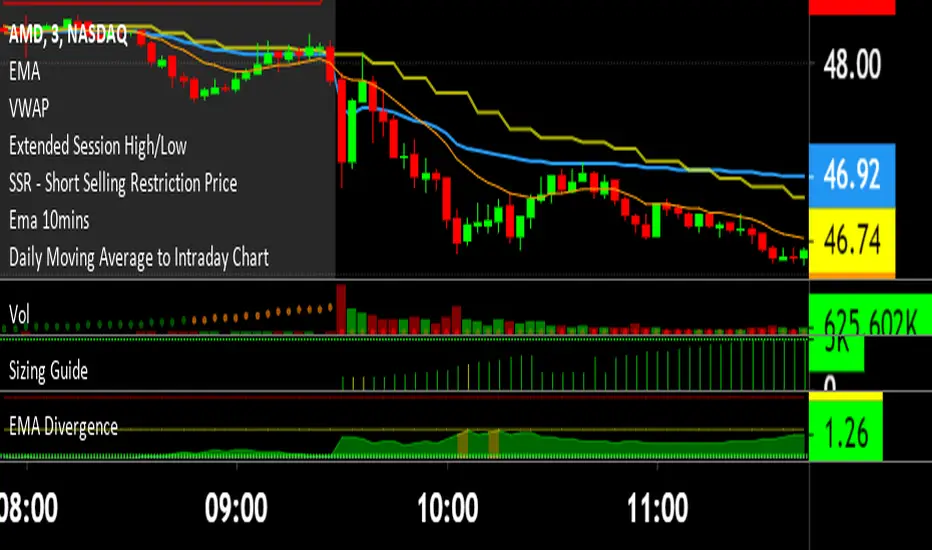
EMA DivergenceThis script automatically calculates the divergence between your favorite exponential moving average and the current price (13 ema default).
Additionally, it displays the area in yellow once the first threshold gets reached (1.5% divergence default) and in red once the second threshold gets reached (1.5% divergence default).
Cari dalam skrip untuk "Divergence"
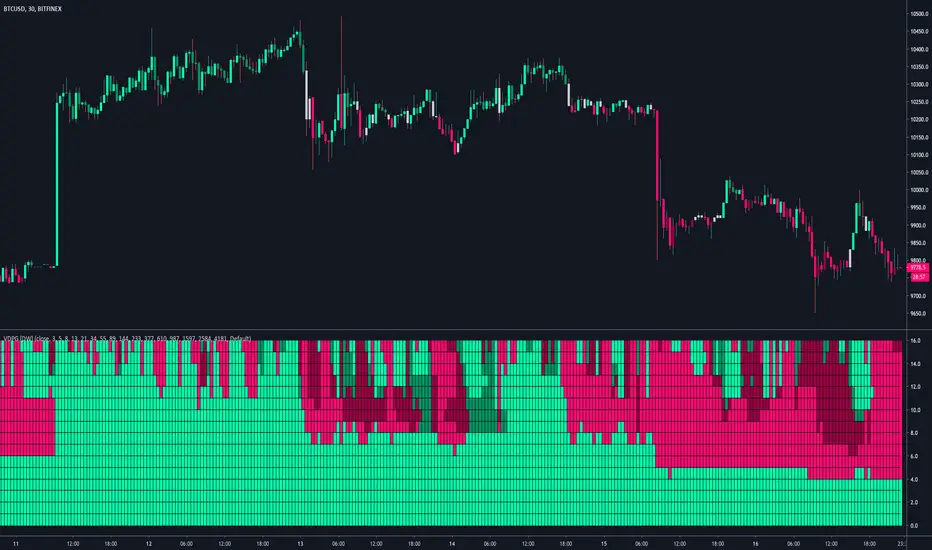
Volume Divergence Polarity Grid [DW]This study is an experiment built off the framework of my Dual Volume Divergence Index indicator.
It is designed to gauge polarity over multiple lookback periods of your choice by expressing the data as a two color grid.
Positive Volume Divergence and Negative Volume Divergence are calculated, and their relative values are used to gauge polarity.
The order of the grid is top to bottom - the top is the first lookback period, and the bottom is the last.
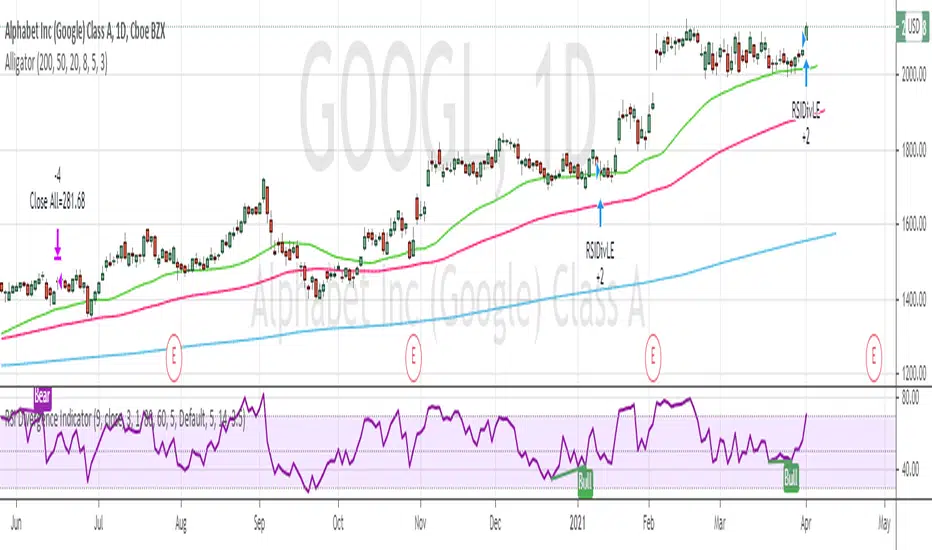
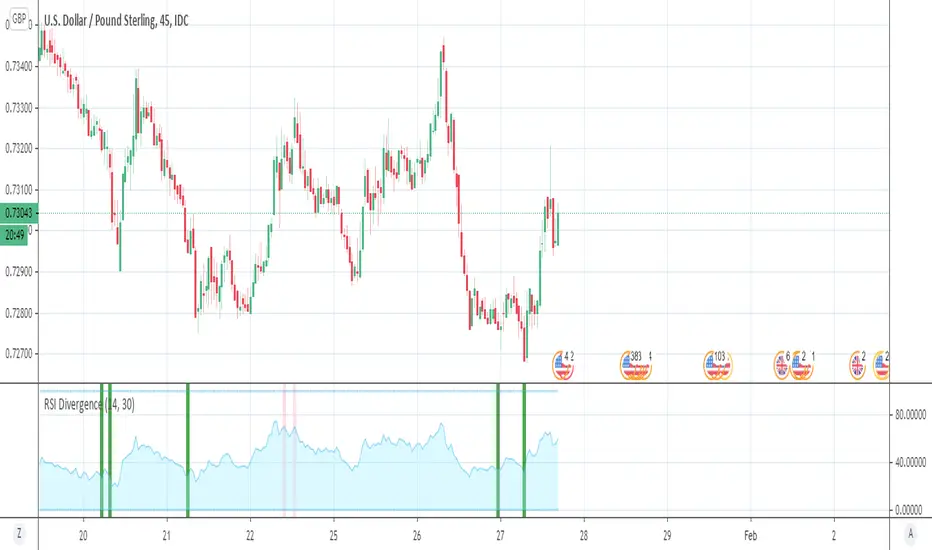
RSI DivergenceRSI DIVERGENCE is a difference between a fast and a slow RSI. Default values are 5 for the fast one and 14 for the slow one.
You can use this indicator in 2 different ways:
normal RSI : check double or triple top/bottom on a chart meanwhile RSI is descending/ascending (check the example on chart)
signal line : when RSI Divergence cross zero line from bottom to top you get a buy signal (the line become green), vice versa when the RSI Divergence cross zero line in the opposite way you get a sell signal (the line become red)

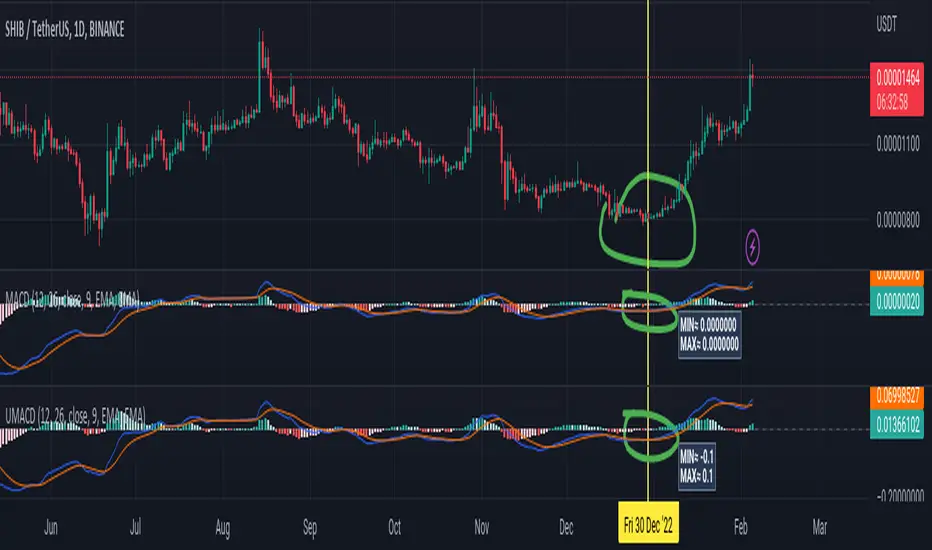
Universal Moving Average Convergence DivergenceI changed MACD formula to divergence of (MA26/MA12 - 1).
And its make it more useful.
Cuz:
1) comparability with all other coins with different prices.
2) fix small numbers in low price coines like shiba
3) making a good indicator like RSI to use it for optimization and ML/AI projects as a variable
Most important thing about this indicator is that its Universal
Now you can compare the UMACD of Shiba with Bitcoin without any problem in matamatics space.No need to use virtuality and its important in Optimization problems that we rediuse the problem from a picture to a number(A plot to a list of numbers)
If we don't care about exagrated pumps and dumps, we can say to it Normalized-MACD too. Cuz in normal situations its MAX ≈ 0.1 and MIN ≈ -0.1
Eflatun CCI Divergence and Top/BottomThe Commodity Channel Index (CCI) with Divergence and finding Top / Bottom points
Select MA with Sma, Ema, Wma, SWma, VWma, Hma or Rma
Follow bar color on top or bottom

Inverse Divergence [HeWhoMustNotBeNamed]Experimental.
In regular scenario divergence calculation follows these procedure
Pivots on price are considered as primary source
They are compared with pivots on oscillators
Trend bias of price is used
This is an experimental version where
Pivots on oscillators are considered as primary source
They are compared with pivots on price
Trend bias of oscillator is used. Using percentrank to define oscillator trend
Caution: Not meant for trading :)

Klinger Volume Divergence IndicatorA remix of the built-in Divergence Indicator that uses a Klinger Volume Oscillator instead of RSI to help spot divergent patterns in volume activity in relation to price.
Additions:
Basic color coding:
Positive volume (above center line) == buying
- Negative volume (below center line) == selling
Alerts for Bullish, Hidden Bullish, Bearish, and Hidden Bearish signals

Wolfpack Id with DivergenceThis indicator simply identifies if the markets are in an up or down trend. You should always use it in combination with other indicators, just as Wavetrends.
This indicator is mostly known because of Market Cipher. The script that was published under the name Wolfpack Id is for some reason closed source, but as it turns out there is of course no secret sauce involved, the original indicator goes way back and the thing that was then called Wolfpack Indicator is simply a MACD Signal Line with 3,8 settings. I added a simple divergence hunter for some extra Informations that might help, brought it up to contemporary pinescript standards, added Alerts and made the whole script open source, as it should be and as the original script also once was. Have fun!

Time Segmented Volume with divergence and Kumo cloud backgroundThis is a Time Segmented Volume (TSV) indicator with added divergence hunter, crossing signals, Kumo cloud background and alert functions
Please keep in mind that this indicator is a tool and not a strategy, do not blindly trade signals, do your own research first!

Price divergencePrice divergence will indicate how much current price is divert from market exponential moving average .

Time Divergence - TDV [SHK]A truly time based indicator to check the strength of the asset based on "Time". The main idea came to my mind about 2 years ago, When i was counting the candles in an impulse move and comparing it to number of retracement candles .
So i got a period (13 for example) and checked the price change between the 13 candles, Then the space between those two points (the price!) is divided to 13 (the time!).
The result can be analyzed by checking the Divergence, or checking the Linear Regression, or bollinger band, or trend lines and channels, or ...
You can also test different periods.
I'm price action trader and i don't use indicators, But i publish my past works for other users.
Hope you find new usage methods and share them in comments.

RSI Divergence Indicator strategyThis strategy is based on RSI divergence indicator.
RSI period setting 5
Go Long when Bull or Hidden Bull is shown
Exit when RSI goes above 75 OR when bear condition appears

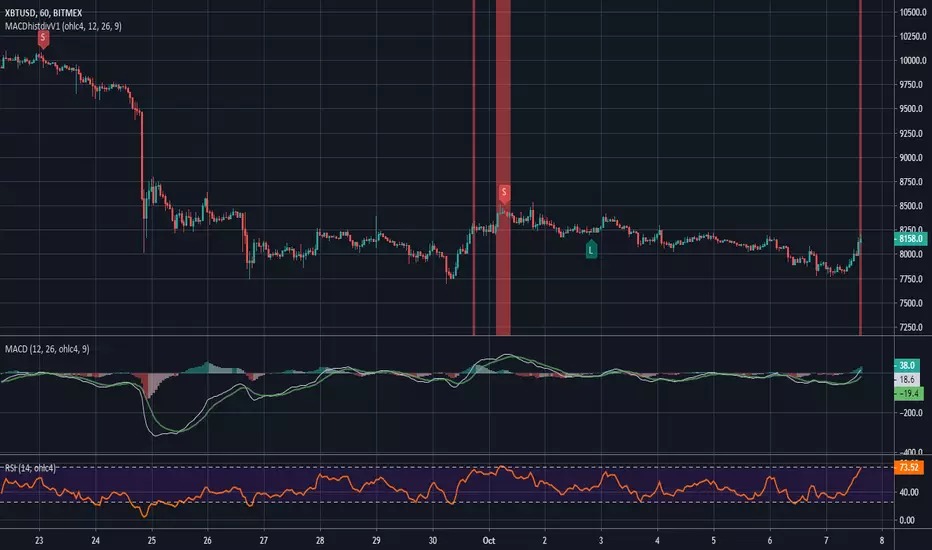
MACD histogram divergence by Rexio v1Hi everyone!
I wrote this indicator for intraday trading and it cannot be use only by itself you need to at least draw some S/R lines to make it useful. It is based at MACD histogram and gives signal when it sees divergence on MACD's Histogram when macd's histogram switchs trend. Im using it to playing with a trend most of the time looking. It highlights candles which can give good singnals to play with a trend (its based on ema200 and RSI overbought and oversold zones).
Im not a computer programist nor professional trader so it is only for educational purposes only.
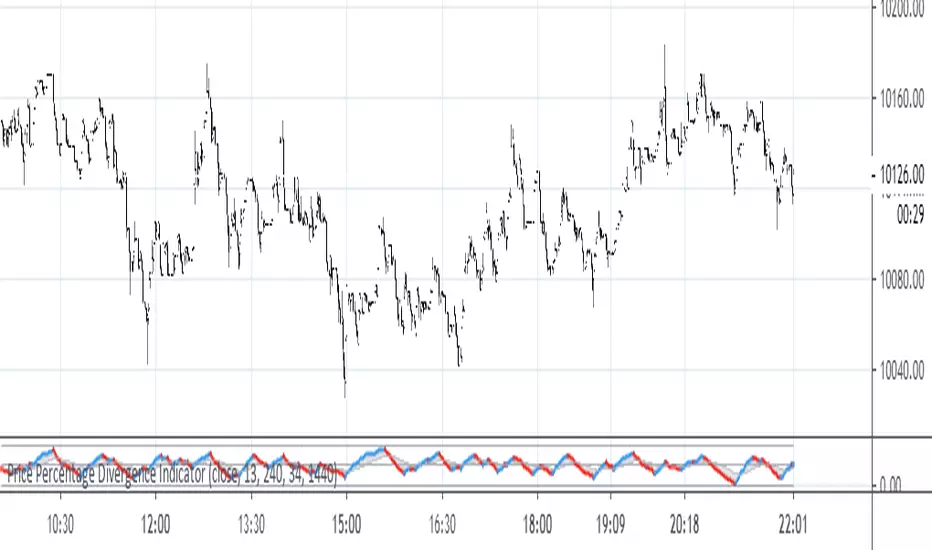
Price Percentage Divergence IndicatorThis is a price percentage divergence ( PPO ) indicator. It may as well be called a turning points indicator.)
MACD Price Divergence indicatorIndicator for divergence between MACD trend and price trends. Try it out and let me know what you think!

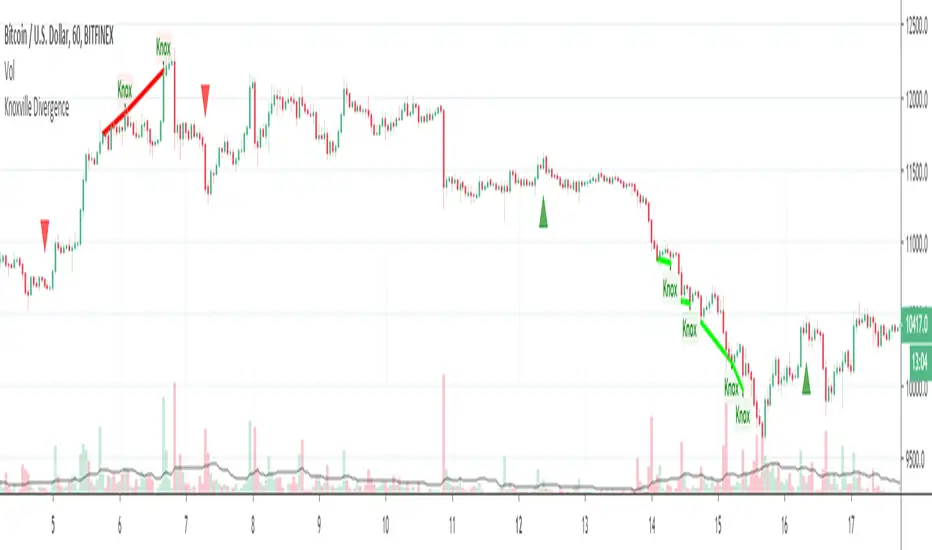
Knoxville DivergenceOverlays Knoxville Divergence on your Chart
These don't occur very often but when they do they are best used in conjunction with Rob Booker Reversal Tabs
Fib Divergence SystemCombo of many useful indicators which includes fib lines, time and money channels and divergence buy sell signals
Credits for source code:
Scarf, Lazybear, 100kiwi


RSI DivergenceSimple RSI Divergence with adjustable lookback period.
Highlights bars with higher price but lower RSI (bearish) or lower price but higher RSI (bullish) than the highest/lowest points in the lookback period.
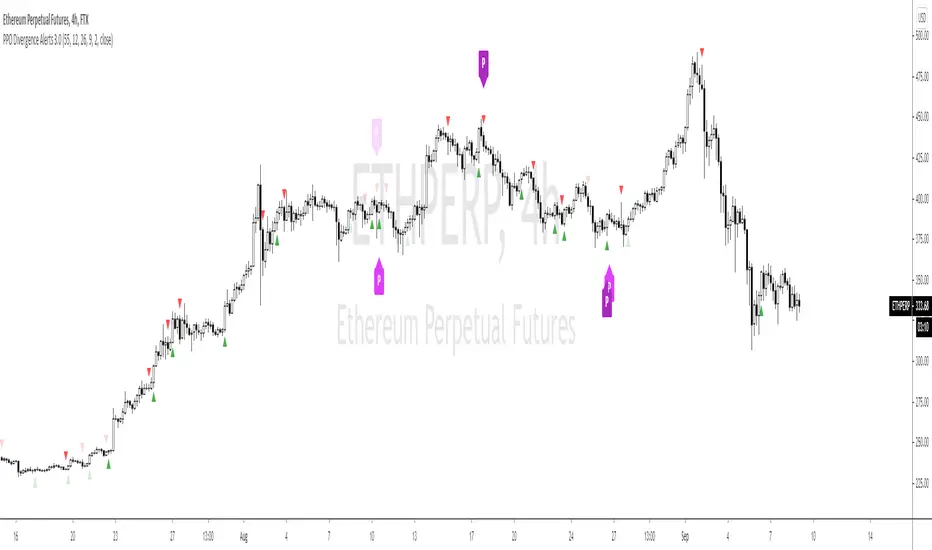
PPO Divergence Alerts 2.0This is basically the same code as my other PPO Divergence indicator expect it overlays the signal on the candles, rather than needing the oscillator. I'm keeping the old version, as I'm sure people will prefer it, but this version takes up less screen real estate.
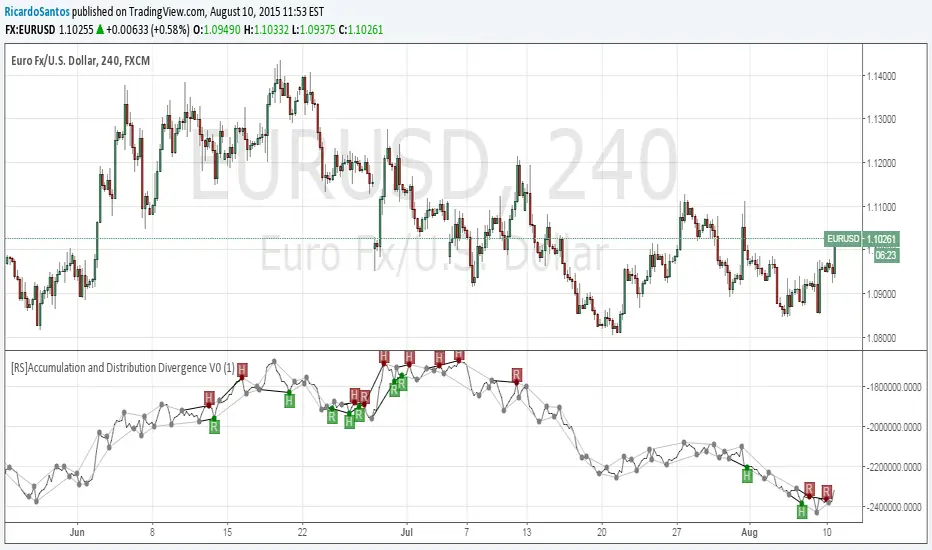
[RS]Accumulation and Distribution Divergence V0EXPERIMENTAL: Accumulation and Distribution Divergence detection.