Tipsy EMA Tipsy EMA
v0.2a
Coded by vaidab.
A simple strategy to buy dips in an uptrend.
How to use:
- buy on trend when price retraces to the orange "buy" line and compound orders
- sell when price reaches red line (stop loss) or at 💰 (take profit)
Note that you can reverse trade on the 💰 sign for a short scalp / day trade.
Uptrend: green/red background. Danger zone: orange bg. No go zone: no bg.
Potential buys (in a clear trend): 55, 100, 200 EMA touches and
fibo retracements to .382 and .618.
Potential stop loss: when price breaks the 200 EMA (marked by a red line).
Exit signs: opposite trend divergences (RSI).
Take profit: EMA 55 crossing down EMA 100.
Use it in confluence with market structure. E.g. If 200 EMA ligns up with
past market structure, if there are whole numbers or if there's a monthly level.
Tested BTCUSDT D, 4H
Cari dalam skrip untuk "Divergence"

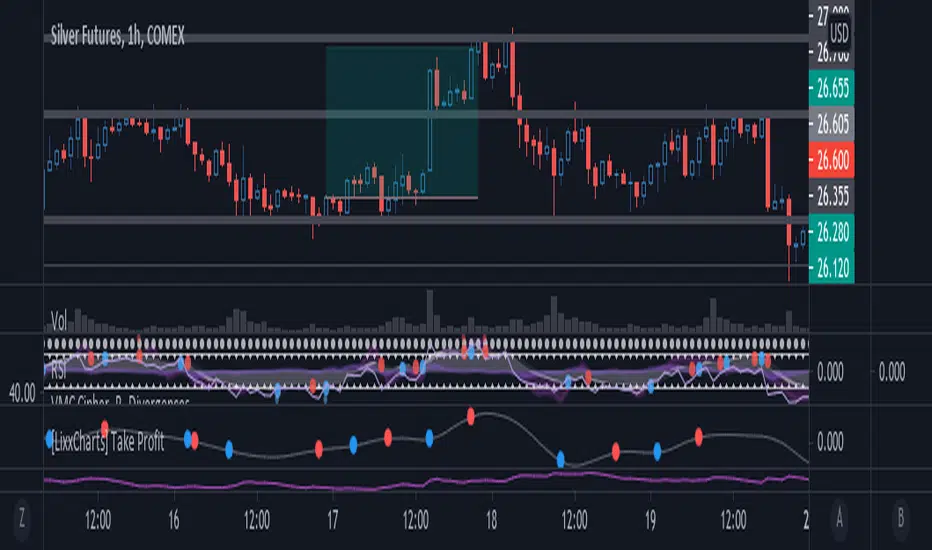
[Lixx] MESA(EMA/SMA) and ROC(ROC/MESA) Take Profit TriggersThis script uses the MESA EMA and SMA as well as the ROC/MESA cross to help find the take profit areas when trading divergences using market cipher or wavetrend. It is inspired by jordanfungs MESA indicator, however this one is different because it is not lagging in the signals.
Hope you enjoy it, and make sure to backtest any strategy before you use it.
MOVE/VXTLT CorrelationMany know of the VIX for equity trading. Yet, many are unaware that there is the same kind of volatility measure for trading bonds, called the MOVE Index.
"The Merrill Lynch Option Volatility Estimate (MOVE) Index is a yield curve weighted index of the normalized implied volatility on 1-month Treasury options which are weighted on the 2, 5, 10, and 30 year contracts."
With this script one can see the the correlation and divergences between bonds and its volatility measure to make educated decisions in trading or hedging.
The idea of this script comes from NicTheMajestic.

GLANTALL AT A DEEP GLANCE
Monitor the whole market at a glance
Give your analysis double-dimensional depth
With the help of this assistant , you can quickly aware about the various dimensions of the market and improve the quality of your trading experience.
Everything is clear in the picture so I will avoid further explanation.
All functions are controllable and highly customizable
Get instantly and accurate report of
Volume
Volume changes
Volume is higher or lower than average
Volume significant increase
2 oscillators of your choice, each one at 4 time frame of your choice, at the same time (Stoch, RSI, StochRSI, MFI, StochMFI)
Selected oscillators changes and direction
Selected oscillators divergences with full coordinate
Bollinger bands
Bollinger bands middle line changes
Bollinger bands width changes and direction
Amount of volatility
4 moving averages as type as your choice at a same time (SMA, EMA, WMA, HMA)
Mark up the moving averages as dynamic support or resistance
Crosses of the 4 averages as type as your choice at a same time (SMA, EMA, WMA, HMA) (completely separately than above mentined MAs) with full coordinate
More than 500 line code.. but Clean and Clear !
Gifts to all of you dear ones.

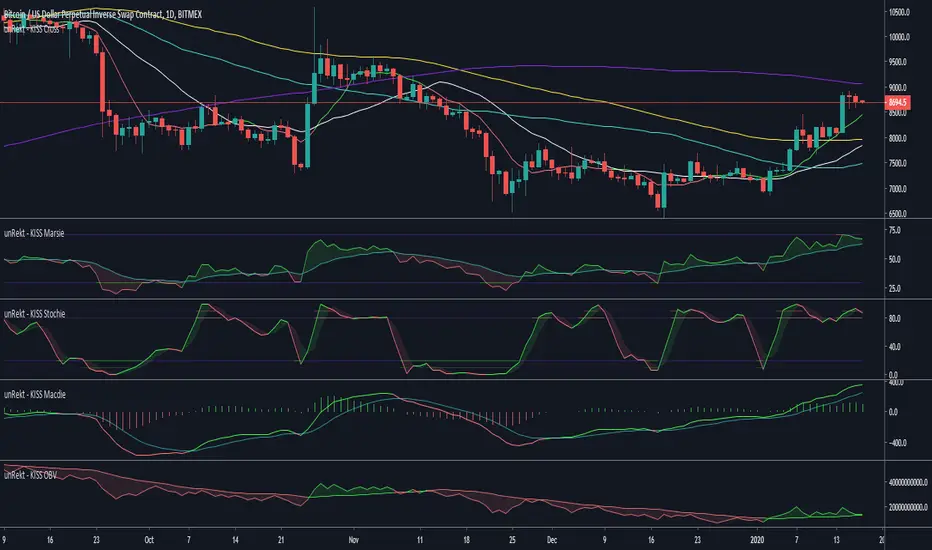
unRekt - KISS OBVOBV is the 'On Balance Volume' indicator and is part of the 'keeping it simple' series that have a similar color scheme. the OBV measures buying and selling pressure as a cumulative indicator, adding volume on up days and subtracting it on down days. The OBV can show divergences or confirm trend.
MACD Divergence +This study plots MACD Divergences and has the option of plotting a Top Dog Trading - MOM and DAD Version of the MACD
MACD Histogram and outline change color when increasing or decreasing above or below the zero-line,
Background also changes color according to MACD Line cross of Signal Line and 0 line or The Direction of DAD
Plenty of Alerts so that you dont have to stare at the screen all day

Linear Quadratic Convergence Divergence OscillatorIntroduction
I inspired myself from the MACD to present a different oscillator aiming to show more reactive/predictive information. The MACD originally show the relationship between two moving averages by subtracting one of fast period and another one of slow period. In my indicator i will use a similar concept, i will subtract a quadratic least squares moving average with a linear least squares moving average of same period, since the quadratic least squares moving average is faster than the linear one and both methods have low-lag this will result in a reactive oscillator.
LQCD In Details
A quadratic least squares moving average try to fit a quadratic function (parabola) to the price by using the method of least squares, the linear least squares moving average try to fit a line. Non-linear fit tend to minimize the sum of squares in non-linear data, this is why a quadratic method is more reactive. The difference of both filters give us an oscillator, then we apply a simple moving average to this oscillator to provide the signal line, subtracting the oscillator and its signal line give us the histogram, those two last steps are the same used in the MACD.
Length control the period of the quadratic/linear moving average. While the MACD use a signal line for plotting the histogram i also added the option to plot the momentum of the quadratic moving average instead, the result is smoother and reduce irregularities, in order to do so just check the differential option in the parameter box.
The period of the signal line and the momentum are both controlled by the signal parameter.
A predictive approach can be made by subtracting the histogram with the signal line, this process make the histogram way more predictive, in order to do so just check the predictive histogram option in the parameter box.
Predictive histogram with simple histogram option. The differential mode can also be used with the predictive parameter, this result in a smoother but less reactive prediction.
Information Interpretation
The amount of information the MACD can give us is high. We can use the histogram as signal generator, or the if the oscillator is over/under 0, combine the oscillator/signal line with histogram, combinations can provide various systems. Some traders use the histogram as signal generator and use the cross between the histogram and the signal line as a stop signal, this method can avoid some whipsaw trades. The study of divergences with the price is also another method.
Conclusion
This oscillator aim to show the same amount of information as the MACD with a similar calculation method but using different kind of filters as well as eliminating the need to use two separates periods for the moving averages calculation, its still possible to use different periods for the quadratic/linear moving average but the results can be less accurate. This indicator can be used like the MACD.

CCI Divergence w/ TrendLooks for divergences between the CCI and price. Provides signals based on the trend.


RSI or MFI %BPlots where RSI or MFI is inside its Bollinger Bands. Various strategies: good to see the trend (above/below average), overbought/oversold conditions (you could work a strategy around RSI getting out of overbought/oversold conditions as shown in the screenshot), divergences, etc...
I will also publish a Bollinger Bands width of RSI to identify areas of squeeze in volatility
Enjoy!

Money Flow Index + AlertsThis study is based on the work of TV user Beasley Savage ( ) and all credit goes to them.
Changes I've made:
1. Added a visual symbol of an overbought/oversold threshold cross in the form of a red/green circle, respectively. Sometimes it can be hard to see when a cross actually occurs, and if your scaling isn't set up properly you can get misleading visuals. This way removes all doubt. Bear in mind they aren't meant as trading signals, so DO NOT use them as such. Research the MFI if you're unsure, but I use them as an early warning and that particular market/stock is added to my watchlist.
2. Added 60/40 lines as the MFI respects these incredibly well in trends. E.g. in a solid uptrend the MFI won't go below 40, and vice versa. Use the idea of support and resistance levels on the indicator and it'll be a great help. I've coloured the zones. Strong uptrends should stay above 60, strong downtrends should stay below 40. The zone in between 40-60 I've called the transition zone. MFI often stays here in consolidation periods, and in the last leg of a cycle/trend the MFI will often drop into this zone after being above 60 or below 40. This is a great sign that you should get out and start looking to reverse your position. Hopefully it helps to spot divergences as well.
3. Added alerts based on an overbought/oversold cross. Also added an alert for when either condition is triggered, so hopefully that's useful for those struggling with low alert limits. Feel free to change the overbought/oversold levels, the alerts + crossover visual are set to adapt.
Like any indicator, don't use this one alone. It works best paired with indicators/techniques that contradict it. You'll often see a OB/OS cross, and price will continue on it's way for many weeks more. But MFI is a great tool for identifying upcoming trend changes.
Any queries please comment or PM me.
Cheers,
RJR

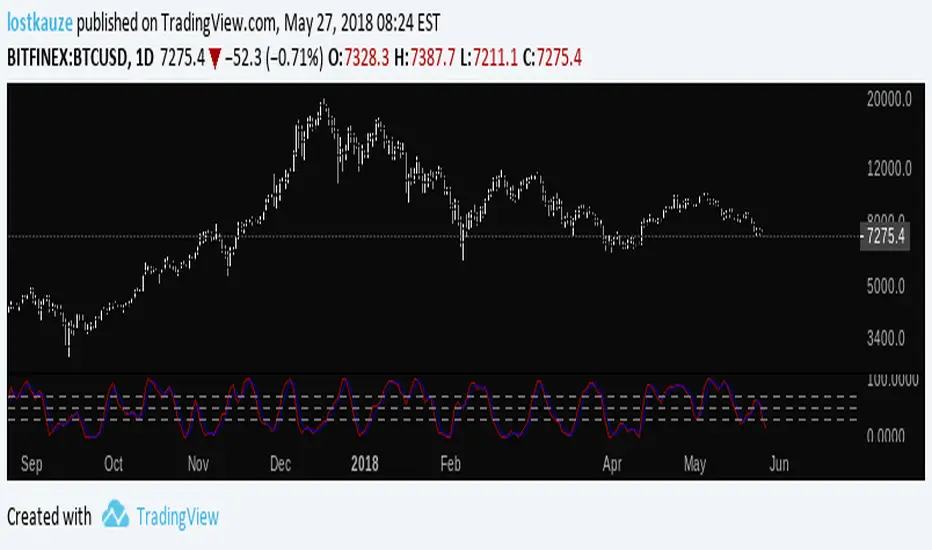
Stoch BitfinexSimilar to RSI Bitfinex , but Stoch version.
It applies Stochastic Oscillator to BTC longs/shorts ratio on Bitfinex. You can use the oscillator as you'd use Stoch:
- Divergences
- Oversold/overbought signals
- R/S on the indicator
- Trend indication
- etc
CCI Cloud [DW]This is a simple experimental study utilizing multiple CCIs and their divergences to visualize price activity.

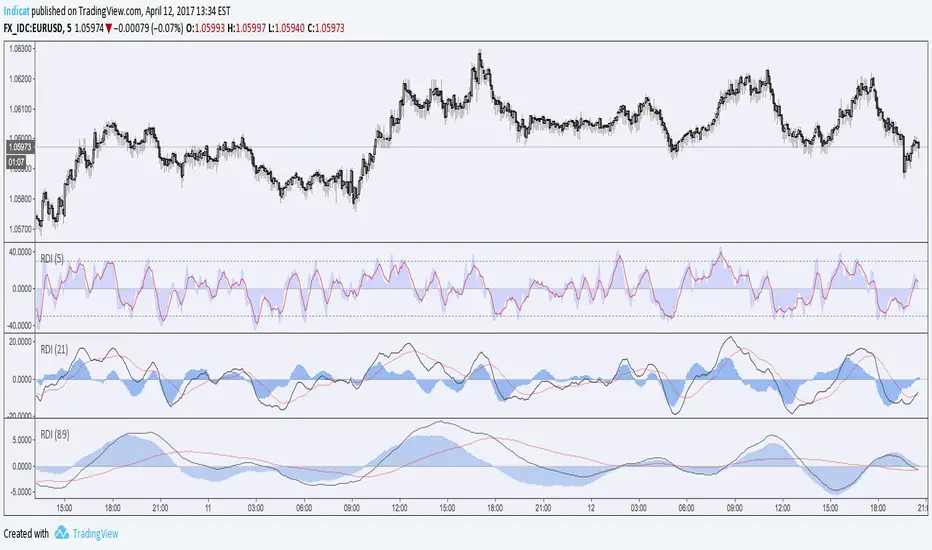
RSI featuring MACD on the Relative Divergence IndexHello Traders,
This Indicator uses RSI output to form a MACDish type of indicator.
Raw RSI output is smoothed with a linear regression curve to form the indicator line.
The signal line is a simple moving average of the same output, the histogram or momentum is the difference between the signal and indicator line, just as MACD
The outer level lines are switched off in MACD modus, because they will 'compress' this indicator, removing them also allows the zero line to 'float'
If you change the length of this indicator you also have to re-adjust the outer level lines, if used.
I recommend this indicator especially on higher lengths (55 or 89) in so you won't get whipped out by a early cross-over or 'false' divergence.
Cheers Indicat...
B3 ECOBlau's Ergodic Candlestick Oscillator = a decent trend finder, however slightly lagged. It can help you to see a reversal entry if you are looking for one. I find the one line ECO hard to use, so I have created this histogram version with a signal line. The colors help to show you whats going on with the ECO and its bias. This indicator shows up in a couple books by people other than Blau, and namely by Krausz. You can also see divergences, for example in pic above the lower or second of the two green humps showing that the general uptrend might be weakened as this run contained less momentum. Tighten up the signal line to see a faster change in its color. These settings are the B3 input settings for default, meaning the ones I use in trading. They are not however the default values you might read about other places.

Stochastic CCI MTF w/ UP/DOWN colours - squattterStoch CCI has nicer divergences than Stoch RSI.
Enjoy.

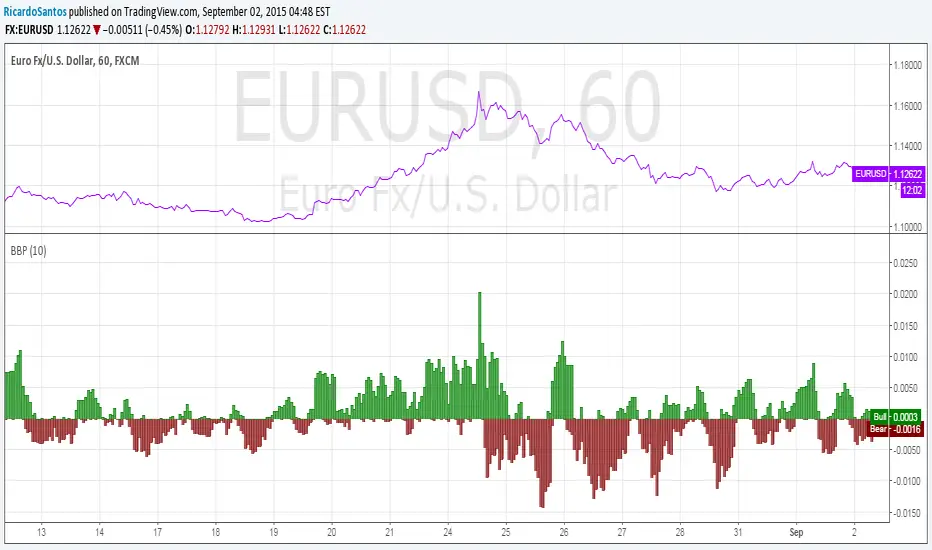
[RS]Linear Regression Bull and Bear Power Accumulation V1EXPERIMENTAL:
Bull and Bear power based on linear regression (this is a non lagging oscillator, the parameter are for the lookup window for the donchian extremes)
this indicator can also be used for convergence/divergence.
(accidentjev2) added multi timeframe support (indicator may repaint values)

[RS]Linear Regression Bull and Bear Power V0EXPERIMENTAL:
Bull and Bear power based on linear regression (this is a non lagging oscillator, the parameter are for the lookup window for the donchian extremes)
this indicator can also be used for convergence/divergence.
NQ vs ES SMT DivergencesAn algorithm for spotting SMT Divergences this is an ICT concept serving fellow ICT traders.


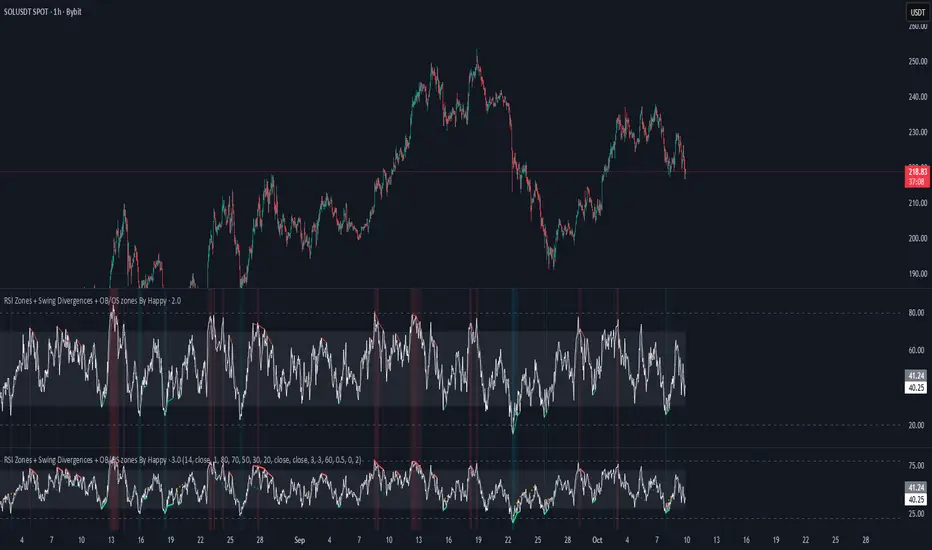
RSI Zones + Swing Divergences + OB/OS zones By HappyRsi with + divergences/ convergences + OB/OS zones
hidden bull/bear
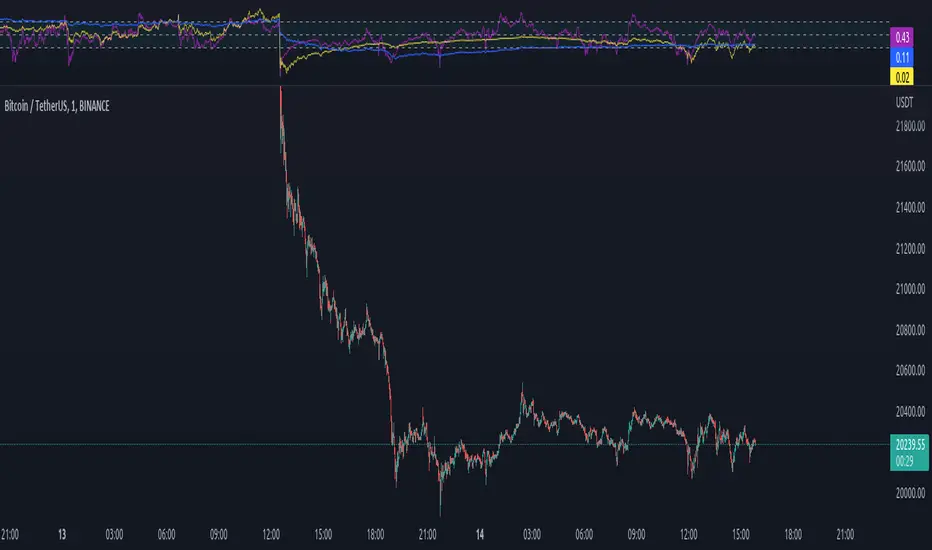
BB%Bx4This is just a script that combines 4 BB%B oscillators in one. It is useful for seeing multiple divergences on one graphic.
The default setting is the 1m time frame but, you can change it to 5m time frame and it will still work. You can see it on any CHART time frame and that was my goal when I made it. So, I don't have to switch back and forth.
I made this tool for my trading style and it may not work for you.
CFB-Adaptive, Williams %R w/ Dynamic Zones [Loxx]CFB-Adaptive, Williams %R w/ Dynamic Zones is a Jurik-Composite-Fractal-Behavior-Adaptive Williams % Range indicator with Dynamic Zones. These additions to the WPR calculation reduce noise and return a signal that is more viable than WPR alone.
What is Williams %R?
Williams %R , also known as the Williams Percent Range, is a type of momentum indicator that moves between 0 and -100 and measures overbought and oversold levels. The Williams %R may be used to find entry and exit points in the market. The indicator is very similar to the Stochastic oscillator and is used in the same way. It was developed by Larry Williams and it compares a stock’s closing price to the high-low range over a specific period, typically 14 days or periods.
What is Composite Fractal Behavior ( CFB )?
All around you mechanisms adjust themselves to their environment. From simple thermostats that react to air temperature to computer chips in modern cars that respond to changes in engine temperature, r.p.m.'s, torque, and throttle position. It was only a matter of time before fast desktop computers applied the mathematics of self-adjustment to systems that trade the financial markets.
Unlike basic systems with fixed formulas, an adaptive system adjusts its own equations. For example, start with a basic channel breakout system that uses the highest closing price of the last N bars as a threshold for detecting breakouts on the up side. An adaptive and improved version of this system would adjust N according to market conditions, such as momentum, price volatility or acceleration.
Since many systems are based directly or indirectly on cycles, another useful measure of market condition is the periodic length of a price chart's dominant cycle, (DC), that cycle with the greatest influence on price action.
The utility of this new DC measure was noted by author Murray Ruggiero in the January '96 issue of Futures Magazine. In it. Mr. Ruggiero used it to adaptive adjust the value of N in a channel breakout system. He then simulated trading 15 years of D-Mark futures in order to compare its performance to a similar system that had a fixed optimal value of N. The adaptive version produced 20% more profit!
This DC index utilized the popular MESA algorithm (a formulation by John Ehlers adapted from Burg's maximum entropy algorithm, MEM). Unfortunately, the DC approach is problematic when the market has no real dominant cycle momentum, because the mathematics will produce a value whether or not one actually exists! Therefore, we developed a proprietary indicator that does not presuppose the presence of market cycles. It's called CFB (Composite Fractal Behavior) and it works well whether or not the market is cyclic.
CFB examines price action for a particular fractal pattern, categorizes them by size, and then outputs a composite fractal size index. This index is smooth, timely and accurate
Essentially, CFB reveals the length of the market's trending action time frame. Long trending activity produces a large CFB index and short choppy action produces a small index value. Investors have found many applications for CFB which involve scaling other existing technical indicators adaptively, on a bar-to-bar basis.
What is Jurik Volty used in the Juirk Filter?
One of the lesser known qualities of Juirk smoothing is that the Jurik smoothing process is adaptive. "Jurik Volty" (a sort of market volatility ) is what makes Jurik smoothing adaptive. The Jurik Volty calculation can be used as both a standalone indicator and to smooth other indicators that you wish to make adaptive.
What is the Jurik Moving Average?
Have you noticed how moving averages add some lag (delay) to your signals? ... especially when price gaps up or down in a big move, and you are waiting for your moving average to catch up? Wait no more! JMA eliminates this problem forever and gives you the best of both worlds: low lag and smooth lines.
Ideally, you would like a filtered signal to be both smooth and lag-free. Lag causes delays in your trades, and increasing lag in your indicators typically result in lower profits. In other words, late comers get what's left on the table after the feast has already begun.
What are Dynamic Zones?
As explained in "Stocks & Commodities V15:7 (306-310): Dynamic Zones by Leo Zamansky, Ph .D., and David Stendahl"
Most indicators use a fixed zone for buy and sell signals. Here’ s a concept based on zones that are responsive to past levels of the indicator.
One approach to active investing employs the use of oscillators to exploit tradable market trends. This investing style follows a very simple form of logic: Enter the market only when an oscillator has moved far above or below traditional trading lev- els. However, these oscillator- driven systems lack the ability to evolve with the market because they use fixed buy and sell zones. Traders typically use one set of buy and sell zones for a bull market and substantially different zones for a bear market. And therein lies the problem.
Once traders begin introducing their market opinions into trading equations, by changing the zones, they negate the system’s mechanical nature. The objective is to have a system automatically define its own buy and sell zones and thereby profitably trade in any market — bull or bear. Dynamic zones offer a solution to the problem of fixed buy and sell zones for any oscillator-driven system.
An indicator’s extreme levels can be quantified using statistical methods. These extreme levels are calculated for a certain period and serve as the buy and sell zones for a trading system. The repetition of this statistical process for every value of the indicator creates values that become the dynamic zones. The zones are calculated in such a way that the probability of the indicator value rising above, or falling below, the dynamic zones is equal to a given probability input set by the trader.
To better understand dynamic zones, let's first describe them mathematically and then explain their use. The dynamic zones definition:
Find V such that:
For dynamic zone buy: P{X <= V}=P1
For dynamic zone sell: P{X >= V}=P2
where P1 and P2 are the probabilities set by the trader, X is the value of the indicator for the selected period and V represents the value of the dynamic zone.
The probability input P1 and P2 can be adjusted by the trader to encompass as much or as little data as the trader would like. The smaller the probability, the fewer data values above and below the dynamic zones. This translates into a wider range between the buy and sell zones. If a 10% probability is used for P1 and P2, only those data values that make up the top 10% and bottom 10% for an indicator are used in the construction of the zones. Of the values, 80% will fall between the two extreme levels. Because dynamic zone levels are penetrated so infrequently, when this happens, traders know that the market has truly moved into overbought or oversold territory.
Calculating the Dynamic Zones
The algorithm for the dynamic zones is a series of steps. First, decide the value of the lookback period t. Next, decide the value of the probability Pbuy for buy zone and value of the probability Psell for the sell zone.
For i=1, to the last lookback period, build the distribution f(x) of the price during the lookback period i. Then find the value Vi1 such that the probability of the price less than or equal to Vi1 during the lookback period i is equal to Pbuy. Find the value Vi2 such that the probability of the price greater or equal to Vi2 during the lookback period i is equal to Psell. The sequence of Vi1 for all periods gives the buy zone. The sequence of Vi2 for all periods gives the sell zone.
In the algorithm description, we have: Build the distribution f(x) of the price during the lookback period i. The distribution here is empirical namely, how many times a given value of x appeared during the lookback period. The problem is to find such x that the probability of a price being greater or equal to x will be equal to a probability selected by the user. Probability is the area under the distribution curve. The task is to find such value of x that the area under the distribution curve to the right of x will be equal to the probability selected by the user. That x is the dynamic zone.
Included:
Bar coloring
3 signal variations w/ alerts
Divergences w/ alerts
Loxx's Expanded Source Types
