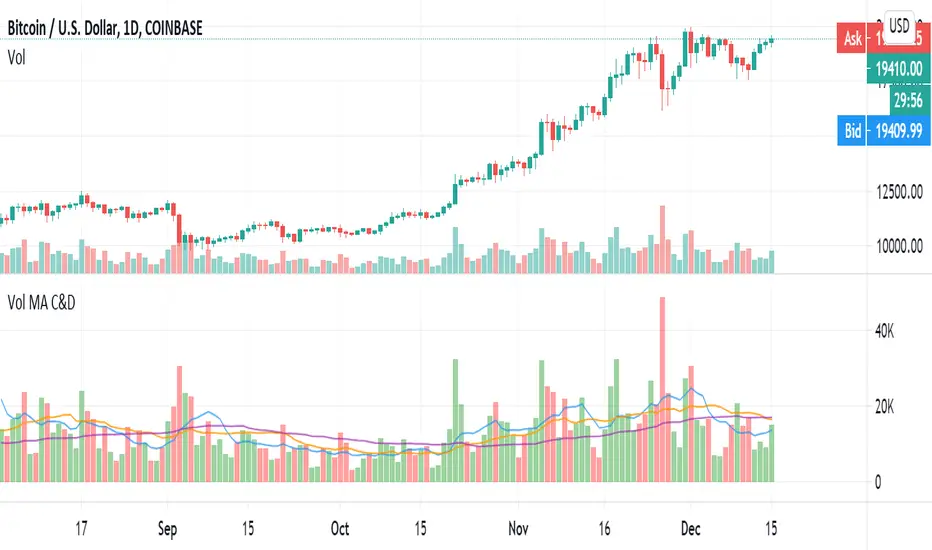
Volume MA Convergence and DivergenceGreetings, I imagine there is already some similar scripts as this one but I couldn't find one so I decided to add something.
We are looking at convergence and divergence signals of moving-average values of 3 different volume time frames. The time frames can of course be tweaked to ones liking, I set up Vol-MA8, 20 and 50. A strong enough divergence in at least 2 of the MAs may perhaps signal an exhausting trend or the beginning of a new one. Convergence of all three to a single point, or close enough to, may signal impending volatility potentially. The latter would best be complimented with another volatility predicative indicator or correlating impending price change data. There are more signals to be studied within this single indicator such as a converging occurrence above OR below the mean, etc, etc.
@OptiSean on Twitter
Enjoy, Cheers
Cari dalam skrip untuk "Divergence"
RSI Tops and BottomsHello Traders
This script finds Tops when RSI is in overbought area or Bottoms when RSI is in oversold area and checks the divergence between them. it checks divergence at tops/bottoms after RSI exited from OB/OS areas.
You can change overbought / oversold levels.
You can limit the time that RSI is in OB/OS area with the option "Max Number of Bars in OB/OS"
you can set the minimum/maximum distances between Tops/Bottoms with the options "Min Number of Bars between Tops/Bottoms" and "Max Number of Bars between Topss/Bottoms"
and you can set the color and line widths as you wish.
These tops or bottom must be sequential, means there mustn't be another top while checking tops or bottom while checking bottoms between them.
in next example you can see valid and invalid bottoms:
After you got signal then you better use Stop Order, a few pips higher than the high of colored candle for long positions, ( vise versa in short positions ). so you may escape from traps. ("Stop order" is filled when the price reached a pre-specified price. for example the price is now 10.0 and you set Buy Stop Order at 11.0 then if price reaches 11.0 then your buy order get filled. you can put stoploss a few pips lower than the low of colored candle or you can use ATR to decice stoploss level. how you wish)
For example in following screenshot you can see that buy stop order was not filled and you didn't take long position.
Enjoy!

TMsignal - RSI Divergence V1.0TMsignal - RSI Divergence V1.0: It automatically shows RSI Divergence, being much useful for detecting future changes in the tendency of the current stock, and weakness in the actual tendency.
Different timeframes can be set up to meet your needs.
We hope you like it! Contact us any question or improvement suggestions.

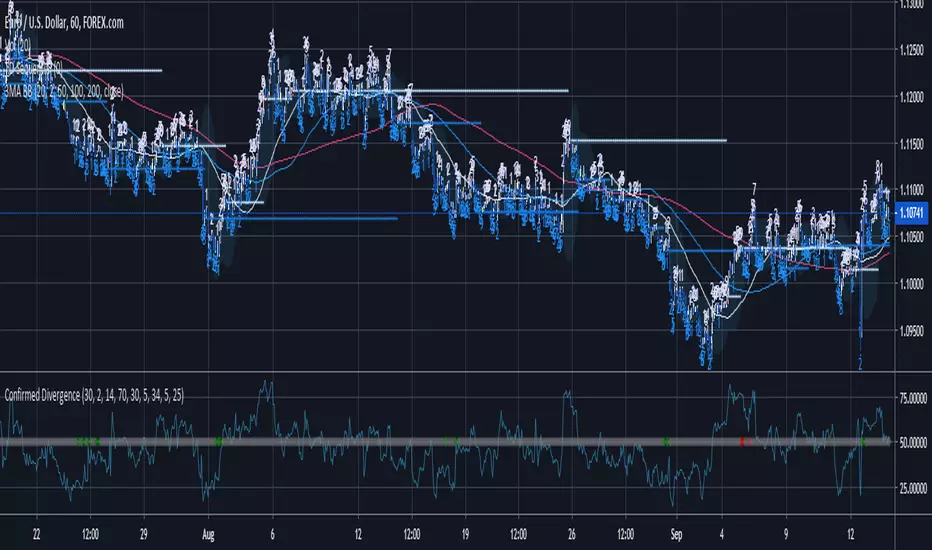
Confirmed DivergenceThis indicator paints the middle dots green when a bullish divergence is found on both the RSI and the Awesome Oscillator and red when bearish divergence is found
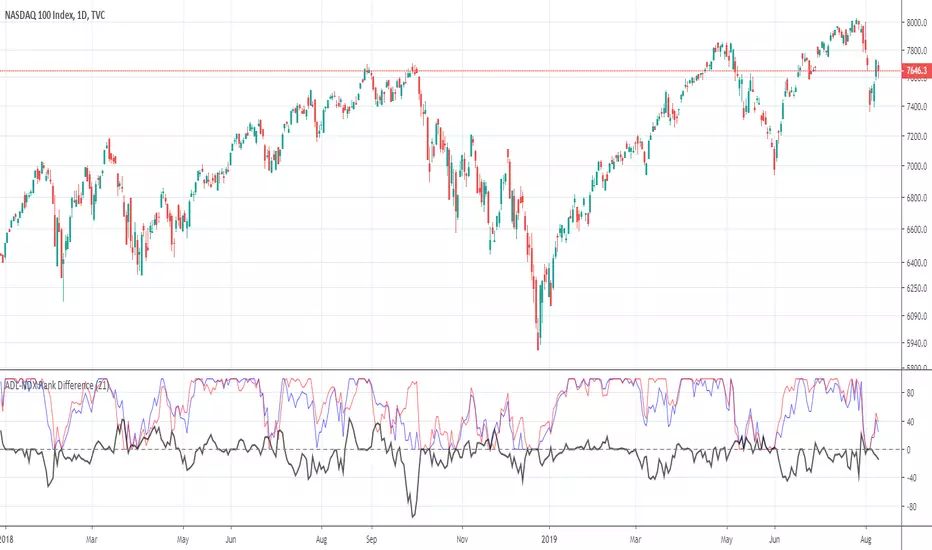
ADL-NDX Rank Difference-Buschi
English:
An expansion of the Advance Decline Line of the NASDAQ. It can be interesting to compare the Advance Decline Line with the corresponding benchmark index. I therefore made a ranking (0 to 100) based on the performance over the last days (default: 21 days). The difference is the target figure and ranges between -100 (bearish divergence) to +100 (bullish divergence).
Deutsch:
Eine Erweiterung der Advance Decline Line der NASDAQ. Oft möchte man den Verlauf der Advance Decline Line mit dem zugehörigen Leitindex vergleichen. Daher habe ich für beide ein Ranking (0 bis 100) erstellt auf Basis des Verlaufs über die letzten Tage (Standardwert: 21 Tage). Die Differenz stellt dabei die Zielgröße dar und schwankt zwischen -100 (bärische Divergenz) und +100 (bullische Divergenz).
ADL-SPX Rank Difference-Buschi
English:
An expansion of the Advance Decline Line of the NYSE. It can be interesting to compare the Advance Decline Line with the corresponding benchmark index. I therefore made a ranking (0 to 100) based on the performance over the last days (default: 21 days). The difference is the target figure and ranges between -100 (bearish divergence) to +100 (bullish divergence).
Deutsch:
Eine Erweiterung der Advance Decline Line der NYSE. Oft möchte man den Verlauf der Advance Decline Line mit dem zugehörigen Leitindex vergleichen. Daher habe ich für beide ein Ranking (0 bis 100) erstellt auf Basis des Verlaufs über die letzten Tage (Standardwert: 21 Tage). Die Differenz stellt dabei die Zielgröße dar und schwankt zwischen -100 (bärische Divergenz) und +100 (bullische Divergenz).

MACD percentage price oscillatorMACD Percentage Price Oscillator is a variation of the MACD indicator. Signal line crossovers are almost identical. The major difference is the MACD Percentage scale which enables comparison between stocks at different prices.
MACD Percentage Price Oscillator's trading signals are the same as for the MACD indicator. The MACD indicator is primarily used to trade trends and should not be used in a ranging market. Signals are taken when MACD crosses its signal line, calculated as a 9 day exponential moving average of MACD.
First check whether price is trending. If the MACD indicator is flat or stays close to the zero line, the market is ranging and signals are unreliable.
Signals are far stronger if there is either:
- a divergence on the MACD indicator; or
- a large swing above or below the zero line.
- Unless there is a divergence, do not go long if the signal is above the zero line, nor go short if the signal is below zero. Place stop-losses below the last minor Low when long, or the last minor High when short.
The main advantage of MACD Percentage over MACD is the ability to compare indicator values across stocks.
The only difference with MACD Percentage Price Oscillator is that the difference between the fast and slow moving averages is calculated as a percentage of the slow moving average: MACD = (12 Day EMA - 26 Day EMA) / 26 Day EMA

Awesome Oscillator and MACD HistogramThis is a quick script that combines two standard indicators, the Awesome Oscillator and MACD histogram, to highlight the beginnings of periods of fast price movement (divergence between the two). Since MACD's EMA responds more quickly than AO's SMA, look for periods of green over gold as a bullish signal, and red under blue as a bearish signal.
Of course both indicators are lagging in nature, but the presence of this divergence often leads larger, continued movement in the same direction.
Bullish Signals
Change from red to green below 0 with either blue or gold above 0 (strengthened on second green bar):
Rising green above 0 with gold below 0:
Bearish Signals
Change from green to red above 0 with either blue or gold below 0 (strengthened on second red bar):
Deepening red below 0 with blue above 0:

BTC vs US500: Normalized Trend DivergenceOverview:
In the financial landscape of 2026, the correlation between Bitcoin and traditional equity markets has reached institutional maturity. This indicator provides a sophisticated way to visualize this relationship by normalizing the US500 index directly onto the Bitcoin price scale.
This script is designed specifically for trading Bitcoin. We focus on anomalies where BTC either aligns with or diverges from the global market trend.
Key Features:
Target Asset: BTCUSD
Recommended Timeframe: 1D for reliable macro trend analysis.
Normalized US500 MA (Neon Blue): The primary signal line showing the 50-period trend of the S&P 500 adapted to BTC’s price.
Live Correlation Dashboard: Real-time data showing Market Status (Strong Risk-On, BTC Strength, etc.).
Crossover Signals: Visual alerts (triangles) when Bitcoin’s price breaks above or below the normalized US500 trend.
How to use:
Strong Risk-On: Price is above both MAs. Global markets and BTC are in sync.
BTC Strength (Divergence): BTC is above the US500 MA but US500 itself is lagging. This often signals institutional accumulation of BTC.

Pradip's MACD Divergence ProThis is where the "magic" happens, Pradip. MACD Divergence is one of the most powerful concepts because it acts like an early-warning system. It tells you when the market is "lying"—when the price is moving up or down, but the energy (momentum) behind it is dying.

HTB Reversal Pattern - RSI DivergenceHow this Script Works
Pivot Points: The script looks for "peaks" and "valleys" in the RSI indicator.
Divergence Logic: * Bullish: If the current price low is lower than the previous low, but the RSI low is higher than the previous RSI low, it indicates the selling pressure is fading despite the price drop.
Bearish: If the current price high is higher than the previous high, but the RSI high is lower than the previous RSI high, it suggests buying momentum is weakening.
The "Lookback" Offset: Because pivot points require a few bars to the right to be confirmed (defined by lbR), the labels will appear on the chart with a small delay (default is 5 bars). This is necessary to prevent "repainting" (signals that disappear after they appear).

RSI Divergence Indicator (Multi-Time Frame Confirmation)This custom-built RSI indicator blends traditional divergence detection with multi-timeframe trend confirmation, offering traders a smarter way to spot meaningful momentum shifts.

RSI Divergence Overlay with BGRSI Divergence Overlay with Bullish (Green) and Bearish (Red) notations

Capital Rotational Event (CRE)What is a Capital Rotational Event (CRE)?
A Capital Rotational Event is when money shifts from one asset to another — e.g., rotation from stocks into bonds, from tech into commodities, or from one sector into another.
In technical terms it typically shows:
✔ Divergence between two asset price series
✔ Relative strength switching direction
✔ Volume/flow confirming rotation
✔ Often precedes trend acceleration in the “receiver” asset

Price vs CVD Divergence Zones (All Types)This is an indicator which shows the divergence between the running price and the CVD

Zero Lag Moving Average Convergence Divergence (ZLMACD) [EVAI]Zero Lag Moving Average Convergence Divergence (ZLMACD)
ZLMACD is a MACD-style momentum oscillator that keeps the standard MACD structure while adding a practical “zero-lag” option through ZLEMA. It is intended for traders who like the familiar MACD workflow but want an oscillator that can respond earlier during transitions without turning into an overly noisy trigger.
The indicator plots the MACD line, the signal line, and the histogram around a zero baseline. If you already understand MACD, you already understand how to read this. The difference is that you can choose whether the oscillator and signal are driven by EMA, SMA, or ZLEMA, which changes the responsiveness and smoothness of the indicator.
Default behavior
This script defaults to the preset mode “ZLEMA osc + EMA signal.” In this configuration, the fast and slow oscillator averages are computed using ZLEMA, while the signal line remains an EMA of the MACD line. The reason for this mix is simple: ZLEMA tends to reduce lag in the oscillator, while EMA on the signal line helps keep crossovers readable and avoids excessive micro-signals.
In practice, this default preset often behaves like a “faster MACD” that still feels like MACD. It can highlight momentum turns earlier than a traditional EMA MACD while keeping the signal line stable enough to use for timing and confirmation.
Custom mode and MA selection
If you switch Mode to “Custom,” the indicator will use your selected moving average types for both the oscillator and the signal line. In Custom mode, the oscillator type applies to both fast and slow averages, and the signal type applies to the smoothing of the MACD line.
If you are in the default preset mode, the custom MA dropdowns will not change the calculations. This is intentional: the preset locks the MA types so the default behavior remains consistent and reproducible across charts and users.
Reading the indicator
The histogram reflects the distance between the MACD line and the signal line. When the histogram is above zero, the MACD line is above the signal line and momentum is biased upward; when it is below zero, the MACD line is below the signal line and momentum is biased downward. Changes in histogram height help visualize strengthening versus weakening momentum, while the zero baseline provides regime context by indicating whether the fast average is above or below the slow average.
Crossovers between MACD and signal behave exactly as they do in standard MACD, but the timing and “feel” will vary depending on the MA choices. ZLEMA on the oscillator typically makes turns appear earlier; SMA typically smooths more but can be slower; EMA tends to be the balanced baseline.
Alerts
Two alert conditions are included to detect histogram polarity shifts. One triggers when the histogram switches from non-negative to negative, and the other triggers when it switches from non-positive to positive. These are useful if you want simple notifications for momentum regime flips without staring at the chart continuously.
Notes
This indicator is provided for informational and educational purposes only and is not financial advice. Always test settings per instrument and timeframe and use risk management.

RSI Divergence + RSI Indicator MegartCombined RSI Divergence Indicator and RSI.
Highlights important RSI levels 70–80–90 and 30–20–10.
All calculations are always based on standard Japanese candlesticks, even when used on other chart types.

NQ vs ES-RTY-YM Divergence MTF OSOpen source script version for my NQ vs ES-RTY-YM Divergence MTF indicator

PSP 4H USD Divergence Highlighter (EURUSD + GBPUSD vs DXY)PSP indicator for the 4H chart. This compares the divergence between the EURUSD, GBPUSD, & DXY

AI Reversal Signals Custom [wjdtks255]📊 Indicator Overview: AI Reversal Signals Custom
This indicator is a comprehensive trend-following and reversal detection tool. It combines the long-term trend bias of a 200 EMA with highly sensitive RSI-based reversal signals and momentum visualization. It is designed to capture market bottoms and tops by identifying exhaustion points in price action.
Key Features
200 EMA (Trend Filter): A gold line representing the long-term institutional trend. It helps traders distinguish between "buying the dip" and "catching a falling knife."
Reversal Buy/Sell Labels: Real-time signals that appear when the market recovers from extreme overbought or oversold conditions.
Dynamic Background Clouds: Visual indicators of trend strength changes, highlighting potential entry zones.
Momentum Histogram: Internal calculations mimic the "Bottom Bars" seen in professional suites to track the velocity of price movement.
📈 Trading Strategy (How to Trade)
1. High-Probability Long Setup (Buy)
Trend Confirmation: Price should ideally be trading above the 200 EMA for the highest success rate.
Signal: Wait for the "BUY" label to appear below the candle.
Momentum: Confirm with the Light Green background or histogram shift indicating recovery.
Entry: Enter on the close of the signal candle.
2. High-Probability Short Setup (Sell)
Trend Confirmation: Price should ideally be trading below the 200 EMA.
Signal: Wait for the "SELL" label to appear above the candle.
Momentum: Confirm with the Red background or histogram fading from green to red.
Entry: Enter on the close of the signal candle.
3. Risk Management
Stop Loss: Place your Stop Loss slightly below the recent swing low for Buy orders, or above the recent swing high for Sell orders.
Take Profit: Exit when the price reaches a major support/resistance level or when an opposing signal appears.
💡 Professional Tip
For the best results, use this indicator on the 15-minute or 1-hour timeframes. The most powerful "Ultimate Reversal" signals occur when there is a Bullish Divergence (Price making lower lows while the RSI makes higher lows) followed by a confirmed "BUY" label.


RSI + EMA Dynamic Zones + Volume + Divergence (with RSI 50 line)RSI + EMA Dynamic Zones + Volume + Divergence (with RSI 50 line)

Volume Divergence(FULLAUTO)MINHPHUOCKBVolume Divergence( 5 COLOR)
BB50
AUTO TIME
bullishDivergence = color.lime
bearishDivergence =color.red
volSpike =color.rgb
volContraction = color.aqua
incVolTrend =color.new
decVolTrend =color.new
color.rgb
