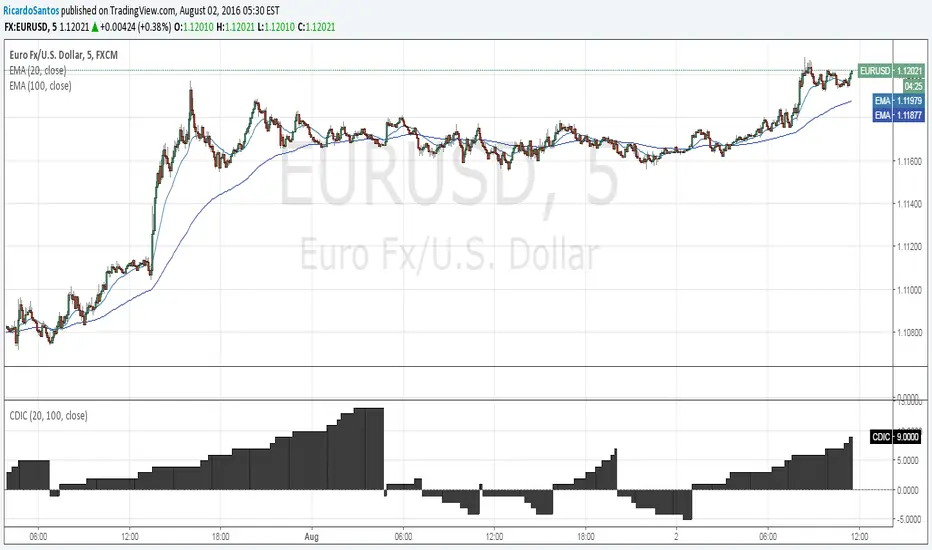
[RS]Convergence Divergence Impulse Counter V0EXPERIMENTAL:
Counts the number of impulses with the same direction within a larger trend.
Cari dalam skrip untuk "Divergence"
Willams %R extreme and MACD DivergenceThis is two different indicators combine into one.
First is the two different period of Williams% 5 mins and 15 mins.
Second is the MACD line of 5 mins chart.
Both will be primarily use on the 5 mins chart, you can use on another time frame if you wish
Williams %:
green = uptrending
red = downtrending
Bright green: overbought condition, look to Short at the end of the signal
Bright Red: oversold condition, look to Long at the end of the signal
MACD:
I also added the MACD line which you can use for divergence
when price move higher and MACD is moving down, expecting price to drop sometime soon or vice versa. See chart for example.


[RS]Leading Momentum Oscilator V0EXPERIMENTAL: Momentum oscilator based on offset, can also be used for divergence/convergence


ridenz rsi"Divergence is when the price of an asset is moving in the opposite direction of a technical indicator, such as an oscillator, or is moving contrary to other data. Divergence warns that the current price trend may be weakening, and in some cases may lead to the price changing direction.
If the stock is rising and making new highs, ideally the RSI is reaching new highs as well. If the stock is making new highs, but the RSI starts making lower highs, this warns the price uptrend may be weakening. This is negative divergence.
Positive divergence is the opposite situation. Imagine the price of a stock is making new lows while the RSI makes higher lows with each swing in the stock price. Investors may conclude that the lower lows in the stock price are losing their downward momentum and a trend reversal may soon follow.
Divergence is one of the common uses of many technical indicators, primarily the oscillators."

Continuation Gauge - Bull vs BearDivergence/ strength detector - great for tracking entry at key divergences and visualizing volatility.

VMDivergences◈ DIVERGENCE DETECTION SYSTEM ◈
════════════════════════════════════════════════════════════
▀▀▀▀▀▀▀▀▀▀▀▀▀▀▀▀▀▀▀▀▀▀▀▀▀▀▀▀▀▀▀▀▀▀▀▀▀▀▀▀▀▀▀▀▀▀▀▀▀▀▀▀▀▀▀▀▀
█ 🎯 OVERVIEW █
▄▄▄▄▄▄▄▄▄▄▄▄▄▄▄▄▄▄▄▄▄▄▄▄▄▄▄▄▄▄▄▄▄▄▄▄▄▄▄▄▄▄▄▄▄▄▄▄▄▄▄▄▄▄▄▄▄
VMDiv is a professional-grade divergence detection system built on a unique
hybrid oscillator that combines the best of momentum analysis and mean-reversion
theory. Unlike standard divergence indicators that rely on RSI or MACD, this
system uses a custom Volume Momentum oscillator with adjustable characteristics.
═══════════════════════════════════════════════════════════
🔧 THE VM OSCILLATOR ENGINE
═════════════════════════════════════════════════════════════
The core innovation is a hybrid oscillator combining TWO analytical approaches:
┌──────────────────────────────────────────────────────┐
│ COMPONENT 1: EMA MOMENTUM │
│ ════════════════════════ │
│ • Fast EMA minus Slow EMA (similar to MACD) │
│ • Normalized by standard deviation for consistency │
│ • Captures trend strength and directional momentum │
├─────────────────────────────────────────────────────────┤
│ COMPONENT 2: BOLLINGER BAND DISTANCE │
│ ════════════════════════════════════ │
│ • Price distance from Bollinger Band midline │
│ • Normalized to show position within bands (-1 to +1 typically) │
│ • Captures overextension and mean-reversion potential │
├─────────────────────────────────────────────────────────┤
│ THE BLEND │
│ ════════════ │
│ • "Momentum Blend" parameter controls the mix │
│ • 1.0 = Pure momentum oscillator │
│ • 0.0 = Pure mean-reversion oscillator │
│ • 0.5 = Balanced hybrid (often optimal) │
└───────────────────────────────────────────────────┘
═══════════════════════════════════════════════════════
📊 DIVERGENCE TYPES DETECTED
══════════════════════════════════════════════════════
This indicator detects SIX types of divergence patterns:
┌───────────────────────────────────────────────────────┐
│ 🔴 REGULAR BEARISH DIVERGENCE │
│ ══════════════════════════════ │
│ Price: Makes HIGHER HIGH ↗ │
│ Oscillator: Makes LOWER HIGH ↘ │
│ │
│ Interpretation: Momentum is weakening despite higher prices. │
│ Signal: Potential reversal to the DOWNSIDE │
│ Reliability: HIGH - Classic reversal signal at tops │
├────────────────────────────────────────────────────────┤
│ 🟢 REGULAR BULLISH DIVERGENCE │
│ ══════════════════════════════ │
│ Price: Makes LOWER LOW ↘ │
│ Oscillator: Makes HIGHER LOW ↗ │
│ │
│ Interpretation: Momentum is strengthening despite lower prices. │
│ Signal: Potential reversal to the UPSIDE │
│ Reliability: HIGH - Classic reversal signal at bottoms │
├──────────────────────────────────────────────────┤
│ 🟠 HIDDEN BEARISH DIVERGENCE │
│ ════════════════════════════ │
│ Price: Makes LOWER HIGH ↘ │
│ Oscillator: Makes HIGHER HIGH ↗ │
│ │
│ Interpretation: Downtrend showing internal strength. │
│ Signal: Trend CONTINUATION - expect further downside │
│ Best used: During confirmed downtrends │
├──────────────────────────────────────────────────────┤
│ 🟡 HIDDEN BULLISH DIVERGENCE │
│ ════════════════════════════ │
│ Price: Makes HIGHER LOW ↗ │
│ Oscillator: Makes LOWER LOW ↘ │
│ │
│ Interpretation: Uptrend showing internal strength. │
│ Signal: Trend CONTINUATION - expect further upside │
│ Best used: During confirmed uptrends │
├───────────────────────────────────────────────────┤
│ 🟣 DOUBLE TOP DIVERGENCE │
│ ═════════════════════════ │
│ Price: Two SIMILAR HIGHS (within ATR tolerance) │
│ Oscillator: Second high LOWER than first │
│ │
│ Interpretation: Resistance tested twice with weakening momentum. │
│ Signal: Strong reversal setup - HIGH PROBABILITY bearish │
│ Best used: At major resistance levels │
├───────────────────────────────────────────────────────────┤
│ 🔵 DOUBLE BOTTOM DIVERGENCE │
│ ═══════════════════════════ │
│ Price: Two SIMILAR LOWS (within ATR tolerance) │
│ Oscillator: Second low HIGHER than first │
│ │
│ Interpretation: Support tested twice with strengthening momentum. │
│ Signal: Strong reversal setup - HIGH PROBABILITY bullish │
│ Best used: At major support levels │
└──────────────────────────────────────────────────┘

Spirit Time SMT 1M DIVDivergences from 90Min-1Min
apparently i have to explain more of what this does.
pretty self explanatory
Hope this enough text

Divergence Channels Indicator — JudasBulletUnique Buy/Sell Indicator. Place stoploss above/below 18 EMA. Low risk/high reward. My No.1 indicator on every chart.

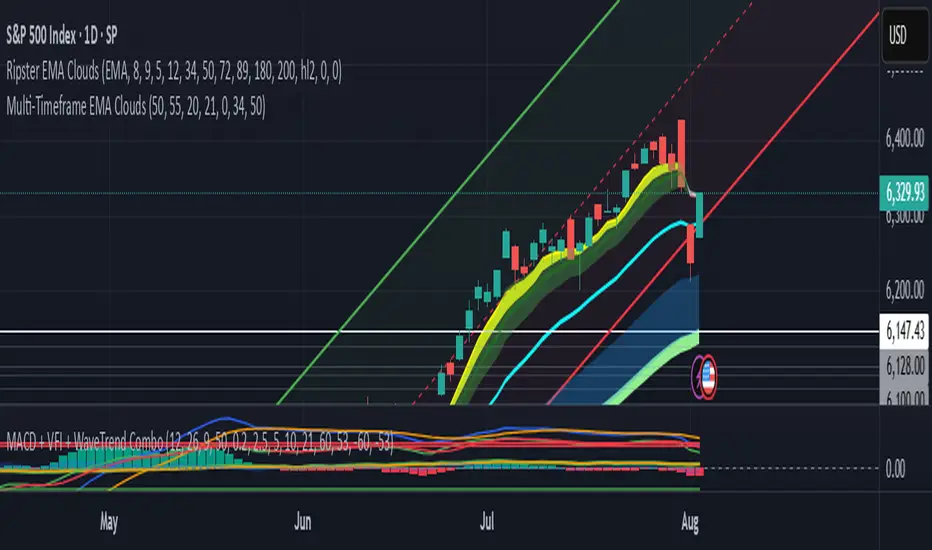
Divergence TridentA Combination of MACD + VFI + WaveTrend
Tradingview hates me and is making me explain this in greater detail so maybe this is enough????
Divergence from Moving AverageSimple script to monitor the difference between closing price and sma(20), sma(20) and sma(60), sma(60) and sma(120). The zero axis provides times when the moving average converge.


Divergence Volume of BiznesFilosofThis indicator warns in advance about impending trouble. And also prepares in advance for a new rally. It also shows the ratio of volumes in dollars to the actual volume of the instrument. We can see when whales accumulate positions and carry extra passengers into the market.
More details about this indicator on my channel in YouTube.
===
Этот индикатор предупреждает заранее о надвигающейся беде. А также готовит заранее к новому ралли. Также он показывает соотношение объемов в долларах к фактическому объёму инструмента. Мы можем видеть когда киты накапливают позиции и выносят лишних пассажиров в срынка.
Более подробно про этот индикатор на моём канале в Ютуб.

Gold Timing Composite (EURUSD + DXY + US02Y)Here's the publication-ready description for TradingView:
Gold Timing Composite Indicator - 3-Component Model
Overview
A precision-engineered multi-component oscillator designed specifically for intraday gold trading. This indicator synthesizes three critical market drivers—EUR/USD dynamics, broad US Dollar strength, and Treasury yield movements—to isolate genuine gold price catalysts from market noise, delivering high-probability timing signals through triple-layer confirmation.
Components & Methodology
The indicator employs z-score normalization (default 20-period lookback) to harmonize three distinct but correlated market signals into a unified composite reading:
Fast Price Discovery Signal (40%):
EURUSD (40%) - EUR/USD captures rapid USD repricing with the deepest FX liquidity globally
Broad USD Strength Confirmation (35%):
-DXY (35%) - Inverted US Dollar Index measures comprehensive USD strength across six major currencies (EUR 57%, JPY 14%, GBP 12%, CAD 9%, SEK 4%, CHF 4%)
Real Yield Proxy (25%):
-US02Y (25%) - Inverted 2-Year Treasury yield captures Fed policy expectations and real rate dynamics
Key Features
✅ Dual USD Validation - EURUSD (speed) + DXY (breadth) filter EUR-specific moves from true USD weakness
✅ Real Yield Sensitivity - US02Y isolates rate-driven gold moves from pure currency effects
✅ Triple Confirmation System - Visual alignment dots when all three components agree simultaneously
✅ Mean-Reversion Zones - Overbought/oversold thresholds at ±1.5 standard deviations
✅ Clean Visualization - Candle-based display (no wicks) for rapid pattern recognition
✅ EUR/USD Divergence Detection - Identifies when EURUSD moves are EUR-specific vs broad USD moves
How to Use
Basic Signals:
Green candles = Bullish gold pressure (USD weakening / yields falling)
Red candles = Bearish gold pressure (USD strengthening / yields rising)
Above +1.5 = Overbought zone → look for mean-reversion shorts
Below -1.5 = Oversold zone → look for mean-reversion longs
High-Confidence Setups (Alignment Dots):
Lime dot at top = All 3 components bullish → maximum gold long confidence
Magenta dot at bottom = All 3 components bearish → maximum gold short confidence
No dots = Components diverging → reduce position size or wait for clarity
Divergence Trading:
Gold makes new high but composite doesn't confirm → potential reversal down
Gold makes new low but composite doesn't confirm → potential reversal up
Understanding Component Interactions
Normal Correlation (High Confidence):
EURUSD ↑ + DXY ↓ + US02Y ↓ → Broad USD weakness + falling yields → Strong gold bull signal
EURUSD ↓ + DXY ↑ + US02Y ↑ → Broad USD strength + rising yields → Strong gold bear signal
EURUSD/DXY Divergence (Critical Filter):
EURUSD ↑ but DXY flat/up → EUR-specific strength (ECB, Eurozone news) → Weak gold signal
DXY flat = USD not actually weak, just EUR strong → Gold may not follow EURUSD
EURUSD flat but DXY ↓ → Broad USD weakness (JPY, GBP, CAD all strong) → Strong gold signal
True USD weakness beyond just EUR → High-probability gold long
FX vs Yields Divergence:
EURUSD ↑ + DXY ↓ but US02Y ↑ → USD weak in FX but yields rising → Mixed signal
Hawkish Fed repricing vs currency weakness → Medium confidence, smaller size
EURUSD ↓ + DXY ↑ but US02Y ↓ → USD strong but yields falling → Conflicting drivers
Could be risk-off (safe haven bid to Treasuries) → Analyze broader market context
Best Practices
Timeframes: 5-minute to 15-minute charts for intraday trading
Session Focus: London fix (10:30 AM GMT) and New York open (8:20 AM EST) for peak gold liquidity
Pair With:
Key gold technical levels (round numbers, previous highs/lows)
COMEX gold futures volume profile
Real yield charts (when available)
VIX for risk sentiment context
Risk Management:
Full position: When alignment dots appear (all 3 components agree)
Half position: When 2 of 3 components align
Wait/reduce: When all three components diverge
Weight Adjustments:
Fed announcement days (FOMC, CPI, NFP): Increase US02Y to 35%, reduce EURUSD to 35%
ECB policy days: Monitor EURUSD/DXY divergence closely (EUR-specific moves may not affect gold)
Geopolitical events: DXY and yields may diverge (safe-haven flows) → Focus on DXY + yields, reduce EURUSD weight
Asian session: EURUSD less reliable (lower liquidity), consider increasing DXY weight to 45%
Technical Details
Calculation Method: Z-score normalization with configurable lookback period
Default Weights: EURUSD 40% | -DXY 35% | -US02Y 25%
Extreme Threshold: ±1.5 standard deviations (adjustable)
Alignment Trigger: All 3 components in unanimous agreement
Customizable Parameters:
Z-score lookback period (default: 20)
15-20: Faster, more sensitive (intraday focus)
30-50: Slower, smoother (swing trade context)
Individual component weights
Extreme threshold levels (1.3 for more signals, 1.8 for extremes only)
Alignment indicator toggle
Advantages Over Simple Indicators
Unlike single-instrument or DXY-only indicators, this composite:
Filters EUR-specific noise - When EURUSD moves but DXY doesn't confirm, gold often doesn't follow
Combines speed + breadth - EURUSD for fast entries, DXY for broad confirmation
Isolates real yield drivers - US02Y separates rate-driven moves from pure FX effects
Identifies regime shifts - When FX and yields diverge, signals changing market dynamics
Adaptable weighting - Adjust for different sessions, events, or market regimes
Real-World Signal Examples
Example 1: High-Confidence Long (All Aligned)
Fed dovish surprise → US02Y falls sharply
USD sells off → EURUSD rises + DXY falls
Composite surges, lime dot appears
Action: Full position gold long
Example 2: False Signal (EUR-Specific)
ECB hawkish statement → EURUSD rallies
But DXY unchanged (JPY, GBP, CAD not moving)
US02Y also unchanged
Composite rises but no alignment dot
Action: Small/no gold position (move is EUR-specific, not USD weakness)
Example 3: Mixed Signal (FX vs Yields)
Strong US jobs data → US02Y spikes (bearish gold)
But USD sells off in FX → EURUSD up + DXY down (bullish gold)
Composite shows divergence, no dots
Action: Wait for clarity or trade with tight stops
Example 4: Divergence Entry
Gold makes new intraday high
But composite fails to confirm (makes lower high)
Bearish divergence forms
Action: Short gold on next pullback
Suggested Complementary Analysis
Fundamental:
Fed vs ECB policy divergence and forward guidance
Real yield trends (10Y TIPS when available)
Inflation expectations (breakevens)
Central bank balance sheet changes
Geopolitical risk premium
Technical:
Gold futures COT (Commitment of Traders) positioning
COMEX gold open interest
Gold/Silver ratio
Mining stock performance (GDX, GDXJ)
Intermarket:
US equity market performance (risk-on/risk-off context)
Crude oil (inflation proxy)
Copper (growth expectations)
Bitcoin correlation (alternative store of value narrative)
Limitations & Considerations
When the Indicator Struggles:
Flash crashes or circuit breakers - Extreme events can break normal correlations temporarily
Asian session gaps - Lower EURUSD liquidity can cause false signals
Central bank interventions - SNB or BOJ FX intervention distorts DXY temporarily
Geopolitical shocks - Gold can decouple from USD/yields during wars, crises (safe-haven bid)
Quarter-end flows - Rebalancing can create temporary USD moves unrelated to fundamentals
Best Used When:
Normal market conditions (liquid sessions, no major shocks)
Clear trending or mean-reverting environment
Components showing consistent correlations
Combined with price action and volume confirmation
Performance Optimization Tips
Backtest your timeframe - Test 15-25 lookback periods to find optimal sensitivity
Session-specific weights - Use different weight profiles for London vs New York vs Asia
Combine with price action - Don't trade composites alone; wait for gold to confirm with candle patterns
Monitor component correlations - If EURUSD/DXY correlation breaks down, reduce both weights temporarily
Use with stop-loss discipline - Composite extremes suggest mean-reversion, but trends can extend
Disclaimer
This indicator is a technical analysis tool and does not guarantee profitable trades. Gold markets are influenced by numerous factors including geopolitics, central bank policy, inflation, and market sentiment that cannot be fully captured by any indicator. Always employ proper risk management, position sizing, and stop-losses. Backtest thoroughly before live implementation. Past performance is not indicative of future results.
Credits
Developed for intraday precious metals traders seeking multi-factor confirmation for gold timing decisions. Built on intermarket analysis principles combining currency dynamics, interest rate differentials, and statistical normalization for robust signal generation. Designed to filter EUR-specific noise and isolate true USD weakness—the primary driver of gold price movements.
Version: 1.0
Pine Script Version: 6
Asset Class: Precious Metals (Gold, Silver)
Category: Oscillators, Multi-Timeframe Analysis, Intermarket Analysis
Use Case: Intraday mean-reversion and momentum timing for gold (XAUUSD, GC futures)
Trading gold with this indicator? Share your results, questions, or improvement suggestions in the comments!

EURUSD Timing Composite (5-Component)Overview
An advanced multi-component oscillator designed specifically for intraday EURUSD trading. This indicator synthesizes four correlated FX pairs plus US yield dynamics to isolate genuine EUR strength and USD weakness from market noise, providing high-probability timing signals through multi-layer cross-validation.
Components & Methodology
The indicator employs z-score normalization (default 20-period lookback) to harmonize five distinct market signals into a unified composite reading:
Primary USD Strength Signals (50%):
GBPUSD (25%) - GBP/USD serves as a USD strength proxy with high correlation to EURUSD
-USDCHF (25%) - Inverted USD/CHF provides independent USD strength confirmation
Yield Differential Signal (25%):
-US02Y (25%) - Inverted 2-Year Treasury yield captures Fed policy expectations and rate differentials
EUR-Specific Strength Signals (25%):
EURGBP (12.5%) - EUR/GBP isolates EUR performance against its closest rival
EURCHF (12.5%) - EUR/CHF confirms broad EUR strength beyond USD dynamics
Key Features
✅ Triple-Layer Validation - Combines USD FX signals, yield differentials, and EUR crosses
✅ Rate Differential Integration - Captures Fed policy repricing and carry trade dynamics
✅ Cross-Pair Confirmation - Filters false signals from GBP/CHF-specific events
✅ Alignment Indicator - Visual dots highlight when 4+ components agree (high-confidence setups)
✅ Mean-Reversion Zones - Overbought/oversold thresholds at ±1.5 standard deviations
✅ Clean Visualization - Candle-based display (no wicks) for rapid interpretation
How to Use
Basic Signals:
Green candles = Bullish EURUSD pressure (EUR strengthening / USD weakening / yields falling)
Red candles = Bearish EURUSD pressure (EUR weakening / USD strengthening / yields rising)
Above +1.5 = Overbought zone → look for mean-reversion shorts
Below -1.5 = Oversold zone → look for mean-reversion longs
High-Confidence Setups (Alignment Dots):
Lime dot at top = 4+ components bullish → strong long bias
Magenta dot at bottom = 4+ components bearish → strong short bias
No dots = Mixed signals → reduce position size or wait for clarity
Divergence Trading:
EURUSD makes new high but composite doesn't confirm → potential reversal down
EURUSD makes new low but composite doesn't confirm → potential reversal up
Best Practices
Timeframes: 5-minute to 15-minute charts for intraday trading
Session Focus: London session and London/New York overlap (peak EUR liquidity)
Pair With: Key technical levels, pivot points, or session open ranges
Risk Management: Scale position size based on alignment strength (larger when dots appear)
Component Interpretation:
GBPUSD + USDCHF + US02Y all aligned = USD-driven move (highest confidence)
EURGBP + EURCHF both strong = EUR-specific strength (independent of USD)
All five aligned = Maximum confidence (broad market agreement)
FX pairs vs yields diverging = Mixed regime (be cautious)
Weight Adjustments:
Fed data days (CPI, NFP, FOMC): Increase US02Y weight to 35%, reduce FX to 20% each
Brexit/BOE events: Reduce GBPUSD to 15%, increase EURCHF to 20%
ECB policy days: Increase EUR cross weights (EURGBP/EURCHF) to 17.5% each
SNB intervention risk: Monitor USDCHF and EURCHF for anomalies
Technical Details
Calculation Method: Z-score normalization with configurable lookback period
Default Weights: GBPUSD 25% | -USDCHF 25% | -US02Y 25% | EURGBP 12.5% | EURCHF 12.5%
Extreme Threshold: ±1.5 standard deviations (adjustable)
Alignment Trigger: 4 out of 5 components in agreement
Customizable Parameters:
Z-score lookback period (default: 20)
Individual component weights
Extreme threshold levels
Alignment indicator toggle
Advantages Over Simple Indicators
Unlike single-pair or DXY-based indicators, this composite:
Integrates yield dynamics - Captures Fed repricing that drives USD independently of FX flows
Isolates EUR strength - EUR crosses separate EUR-specific moves from USD dynamics
Triple confirmation - FX pairs + yields + EUR crosses must align for high-confidence signals
Filters rate/FX divergence - When yields and FX disagree, indicator shows mixed signals
Regime adaptability - Adjustable weights for different market conditions
Understanding Component Relationships
Normal Correlation Environment:
GBPUSD ↑ + USDCHF ↓ + US02Y ↓ → USD weakness → EURUSD ↑
EURGBP ↑ + EURCHF ↑ → EUR strength → EURUSD ↑
When Components Diverge (Critical Signals):
FX says USD weak, but US02Y rising → Yields attracting capital despite FX → Weak EURUSD signal
GBPUSD ↑ but EURGBP ↓ → GBP-specific strength, not EUR → Neutral for EURUSD
Only yields moving, FX flat → Pure rate story, wait for FX confirmation
Only EUR crosses rising → EUR strength independent of USD → Strong EUR-specific signal
Regime Examples:
Fed hawkish surprise: US02Y spikes (bearish), FX confirms → Strong EURUSD short
ECB policy shift: EURGBP/EURCHF move, but USD signals mixed → EUR-specific trade
Risk-off: All USD signals bullish, EUR crosses bearish → Maximum EURUSD short confidence
Suggested Complementary Analysis
ECB vs Fed policy divergence and forward guidance
US-Germany 2-year yield differential
European equity market performance (Euro Stoxx 50)
EUR-denominated commodity prices
PMI differentials (Eurozone vs US)
Political risk events (elections, Brexit, fiscal policy)
Real yield differentials (when TIPS data available)
Limitations & Considerations
Fed/ECB simultaneous announcements can create temporary whipsaws
Brexit volatility may distort GBPUSD signals (reduce weight during UK events)
SNB interventions spike USDCHF/EURCHF (monitor for anomalies)
Yield curve inversions may affect US02Y signal interpretation
Works best in normal conditions (less reliable during market dislocations)
Requires understanding of intermarket dynamics for optimal use
Disclaimer
This indicator is a technical analysis tool and does not guarantee profitable trades. Always employ proper risk management, monitor fundamental developments, and backtest strategies thoroughly before live implementation. Past performance is not indicative of future results.
Credits
Engineered for intraday FX traders seeking multi-factor confirmation for EURUSD timing decisions. Built on intermarket analysis principles combining correlated currency pairs, yield differentials, and statistical normalization for robust signal generation.
Version: 1.0
Pine Script Version: 6
Category: Oscillators, Multi-Timeframe Analysis, Interest Rate Analysis
Use Case: Intraday mean-reversion and momentum timing for EURUSD
Questions, improvement ideas, or want to share your results? Comment below!

WaveTrend With Divs & RSI(STOCH) Divs by WeloTradesWaveTrend with Divergences & RSI(STOCH) Divergences by WeloTrades
Overview
The "WaveTrend With Divergences & RSI(STOCH) Divergences" is an advanced Pine Script™ indicator designed for TradingView, offering a multi-dimensional analysis of market conditions. This script integrates several technical indicators—WaveTrend, Money Flow Index (MFI), RSI, and Stochastic RSI—into a cohesive tool that identifies both regular and hidden divergences across these indicators. These divergences can indicate potential market reversals and provide critical trading opportunities.
This indicator is not just a simple combination of popular tools; it offers extensive customization options, organized data presentation, and valuable trading signals that are easy to interpret. Whether you're a day trader or a long-term investor, this script enhances your ability to make informed decisions.
Originality and Usefulness
The originality of this script lies in its integration and the synergy it creates among the indicators used. Rather than merely combining multiple indicators, this script allows them to work together, enhancing each other's strengths. For example, by identifying divergences across WaveTrend, RSI, and Stochastic RSI simultaneously, the script provides multiple layers of confirmation, which reduces the likelihood of false signals and increases the reliability of trading signals.
The usefulness of this script is apparent in its ability to offer a consolidated view of market dynamics. It not only simplifies the analytical process by combining different indicators but also provides deeper insights through its divergence detection features. This comprehensive approach is designed to help traders identify potential market reversals, confirm trends, and ultimately make more informed trading decisions.
How the Components Work Together
1. Cross-Validation of Signals
WaveTrend: This indicator is primarily used to identify overbought and oversold conditions, as well as potential buy and sell signals. WaveTrend's ability to smooth price data and reduce noise makes it a reliable tool for identifying trend reversals.
RSI & Stochastic RSI: These momentum oscillators are used to measure the speed and change of price movements. While RSI identifies general overbought and oversold conditions, Stochastic RSI offers a more granular view by tracking the RSI’s level relative to its high-low range over a period of time. When these indicators align with WaveTrend signals, it adds a layer of confirmation that enhances the reliability of the signals.
Money Flow Index (MFI): This volume-weighted indicator assesses the inflow and outflow of money in an asset, giving insights into buying and selling pressure. By analyzing the MFI alongside WaveTrend and RSI indicators, the script can cross-validate signals, ensuring that buy or sell signals are supported by actual market volume.
Example Bullish scenario:
When a bullish divergence is detected on the RSI and confirmed by a corresponding bullish signal on the WaveTrend, along with an increasing Money Flow Index, the probability of a successful trade setup increases. This cross-validation minimizes the risk of acting on false signals, which might occur when relying on a single indicator.
Example Bearish scenario:
When a bearish divergence is detected on the RSI and confirmed by a corresponding bearish signal on the WaveTrend, along with an decreasing Money Flow Index, the probability of a successful trade setup increases. This cross-validation minimizes the risk of acting on false signals, which might occur when relying on a single indicator.
2. Divergence Detection and Market Reversals
Regular Divergences: Occur when the price action and an indicator (like RSI or WaveTrend) move in opposite directions. Regular bullish divergence signals a potential upward reversal when the price makes a lower low while the indicator makes a higher low. Conversely, regular bearish divergence suggests a downward reversal when the price makes a higher high, but the indicator makes a lower high.
Hidden Divergences: These occur when the price action and indicator move in the same direction, but with different momentum. Hidden bullish divergence suggests the continuation of an uptrend, while hidden bearish divergence suggests the continuation of a downtrend. By detecting these divergences across multiple indicators, the script identifies potential trend reversals or continuations with greater accuracy.
Example: The script might detect a regular bullish divergence on the WaveTrend while simultaneously identifying a hidden bullish divergence on the RSI. This combination suggests that while a trend reversal is possible, the overall market sentiment remains bullish, providing a nuanced view of the market.
A Regular Bullish Divergence Example:
A Hidden Bullish Divergence Example:
A Regular Bearish Divergence Example:
A Hidden Bearish Divergence Example:
3. Trend Strength and Sentiment Analysis
WaveTrend: Measures the strength and direction of the trend. By identifying the extremes of market sentiment (overbought and oversold levels), WaveTrend provides early signals for potential reversals.
Money Flow Index (MFI): Assesses the underlying sentiment by analyzing the flow of money. A rising MFI during an uptrend confirms strong buying pressure, while a falling MFI during a downtrend confirms selling pressure. This helps traders assess whether a trend is likely to continue or reverse.
RSI & Stochastic RSI: Offer a momentum-based perspective on the trend’s strength. High RSI or Stochastic RSI values indicate that the asset may be overbought, suggesting a potential reversal. Conversely, low values indicate oversold conditions, signaling a possible upward reversal.
Example:
During a strong uptrend, the WaveTrend & RSI's might signal overbought conditions, suggesting caution. If the MFI also shows decreasing buying pressure and the RSI reaches extreme levels, these indicators together suggest that the trend might be weakening, and a reversal could be imminent.
Example:
During a strong downtrend, the WaveTrend & RSI's might signal oversold conditions, suggesting caution. If the MFI also shows increasing buying pressure and the RSI reaches extreme levels, these indicators together suggest that the trend might be weakening, and a reversal could be imminent.
Conclusion
The "WaveTrend With Divergences & RSI(STOCH) Divergences" script offers a powerful, integrated approach to technical analysis by combining trend, momentum, and sentiment indicators into a single tool. Its unique value lies in the cross-validation of signals, the ability to detect divergences, and the comprehensive view it provides of market conditions. By offering traders multiple layers of analysis and customization options, this script is designed to enhance trading decisions, reduce false signals, and provide clearer insights into market dynamics.
WAVETREND
Display of WaveTrend:
Display of WaveTrend Setting:
WaveTrend Indicator Explanation
The WaveTrend indicator helps identify overbought and oversold conditions, as well as potential buy and sell signals. Its flexibility allows traders to adapt it to various strategies, making it a versatile tool in technical analysis.
WaveTrend Input Settings:
WT MA Source: Default: HLC3
What it is: The data source used for calculating the WaveTrend Moving Average.
What it does: Determines the input data to smooth price action and filter noise.
Example: Using HLC3 (average of High, Low, Close) provides a smoother data representation compared to using just the closing price.
Length (WT MA Length): Default: 3
What it is: The period used to calculate the Moving Average.
What it does: Adjusts the sensitivity of the WaveTrend indicator, where shorter lengths respond more quickly to price changes.
Example: A length of 3 is ideal for short-term analysis, providing quick reactions to price movements.
WT Channel Length & Average: Default: WT Channel Length = 9, Average = 12
What it is: Lengths used to calculate the WaveTrend channel and its average.
What it does: Smooths out the WaveTrend further, reducing false signals by averaging over a set period.
Example: Higher values reduce noise and help in identifying more reliable trends.
Channel: Style, Width, and Color:
What it is: Customization options for the WaveTrend channel's appearance.
What it does: Adjusts how the channel is displayed, including line style, width, and color.
Example: Choosing an area style with a distinct color can make the WaveTrend indicator clearly visible on the chart.
WT Buy & Sell Signals:
What it is: Settings to enable and customize buy and sell signals based on WaveTrend.
What it does: Allows for the display of buy/sell signals and customization of their shapes and colors.
When it gives a Buy Signal: Generated when the WaveTrend line crosses below an oversold level and then rises back, indicating a potential upward price movement.
When it gives a Sell Signal: Triggered when the WaveTrend line crosses above an overbought level and then declines, suggesting a possible downward trend.
Example: The script identifies these signals based on mean reversion principles, where prices tend to revert to the mean after reaching extremes. Traders can use these signals to time their entries and exits effectively.
WAVETREND OVERBOUGTH AND OVERSOLD LEVELS
Display of WaveTrend with Overbought & Oversold Levels:
Display of WaveTrend Overbought & Oversold Levels Settings:
WaveTrend Overbought & Oversold Levels Explanation
WT OB & OS Levels: Default: OB Level 1 = 53, OB Level 2 = 60, OS Level 1 = -53, OS Level 2 = -60
What it is: The default overbought and oversold levels used by the WaveTrend indicator to signal potential market reversals.
What it does: When the WaveTrend crosses above the OB levels, it indicates an overbought condition, potentially signaling a reversal or selling opportunity. Conversely, when it crosses below the OS levels, it indicates an oversold condition, potentially signaling a reversal or buying opportunity.
Example: A trader might use these levels to time entry or exit points, such as selling when the WaveTrend crosses into the overbought zone or buying when it crosses into the oversold zone.
Show OB/OS Levels: Default: True
What it is: Toggle options to show or hide the overbought and oversold levels on your chart.
What it does: When enabled, these levels will be visually represented on your chart, helping you to easily identify when the market reaches these critical thresholds.
Example: Displaying these levels can help you quickly see when the WaveTrend is approaching or has crossed into overbought or oversold territory, allowing for more informed trading decisions.
Line Style, Width, and Color for OB/OS Levels:
What it is: Options to customize the appearance of the OB and OS levels on your chart, including line style (solid, dotted, dashed), line width, and color.
What it does: These settings allow you to adjust how prominently these levels are displayed on your chart, which can help you better visualize and respond to overbought or oversold conditions.
Example: Setting a thicker, dashed line in a contrasting color can make these levels stand out more clearly, aiding in quick visual identification.
Example of Use:
Scenario: A trader wants to identify potential selling points when the market is overbought. They set the OB levels at 53 and 60, choosing a solid, red line style to make these levels clear on their chart. As the WaveTrend crosses above 53, they monitor for further price action, and upon crossing 60, they consider initiating a sell order.
WAVETREND DIVERGENCES
Display of WaveTrend Divergence:
Display of WaveTrend Divergence Setting:
WaveTrend Divergence Indicator Explanation
The WaveTrend Divergence feature helps identify potential reversal points in the market by highlighting divergences between the price and the WaveTrend indicator. Divergences can signal a shift in market momentum, indicating a possible trend reversal. This component allows traders to visualize and customize divergence detection on their charts.
WaveTrend Divergence Input Settings:
Potential Reversal Range: Default: 28
What it is: The number of bars to look back when detecting potential tops and bottoms.
What it does: Sets the range for identifying possible reversal points based on historical data.
Example: A setting of 28 looks back across the last 28 bars to find reversal points, offering a balance between responsiveness and reliability.
Reversal Minimum LVL OB & OS: Default: OB = 35, OS = -35
What it is: The minimum overbought and oversold levels required for detecting potential reversals.
What it does: Adjusts the thresholds that trigger a reversal signal based on the WaveTrend indicator.
Example: A higher OB level reduces the sensitivity to overbought conditions, potentially filtering out false reversal signals.
Lookback Bar Left & Right: Default: Left = 10, Right = 1
What it is: The number of bars to the left and right used to confirm a top or bottom.
What it does: Helps determine the position of peaks and troughs in the price action.
Example: A larger left lookback captures more extended price action before the peak, while a smaller right lookback focuses on the immediate past.
Lookback Range Min & Max: Default: Min = 5, Max = 60
What it is: The minimum and maximum range for the lookback period when identifying divergences.
What it does: Fine-tunes the detection of divergences by controlling the range over which the indicator looks back.
Example: A wider range increases the chances of detecting divergences across different market conditions.
R.Div Minimum LVL OB & OS: Default: OB = 53, OS = -53
What it is: The threshold levels for detecting regular divergences.
What it does: Adjusts the sensitivity of the regular divergence detection.
Example: Higher thresholds make the detection more conservative, identifying only stronger divergence signals.
H.Div Minimum LVL OB & OS: Default: OB = 20, OS = -20
What it is: The threshold levels for detecting hidden divergences.
What it does: Similar to regular divergence settings but for hidden divergences, which can indicate potential reversals that are less obvious.
Example: Lower thresholds make the hidden divergence detection more sensitive, capturing subtler market shifts.
Divergence Label Options:
What it is: Options to display and customize labels for regular and hidden divergences.
What it does: Allows users to visually differentiate between regular and hidden divergences using customizable labels and colors.
Example: Using different colors and symbols for regular (R) and hidden (H) divergences makes it easier to interpret signals on the chart.
Text Size and Color:
What it is: Customization options for the size and color of divergence labels.
What it does: Adjusts the readability and visibility of divergence labels on the chart.
Example: Larger text size may be preferred for charts with a lot of data, ensuring divergence labels stand out clearly.
FAST & SLOW MONEY FLOW INDEX
Display of Fast & Slow Money Flow:
Display of Fast & Slow Money Flow Setting:
Fast Money Flow Indicator Explanation
The Fast Money Flow indicator helps traders identify the flow of money into and out of an asset over a shorter time frame. By tracking the volume-weighted average of price movements, it provides insights into buying and selling pressure in the market, which can be crucial for making timely trading decisions.
Fast Money Flow Input Settings:
Fast Money Flow: Length: Default: 9
What it is: The period used for calculating the Fast Money Flow.
What it does: Determines the sensitivity of the Money Flow calculation. A shorter length makes the indicator more responsive to recent price changes, while a longer length provides a smoother signal.
Example: A length of 9 is suitable for traders looking to capture quick shifts in market sentiment over a short period.
Fast MFI Area Multiplier: Default: 5
What it is: A multiplier applied to the Money Flow area calculation.
What it does: Adjusts the size of the Money Flow area on the chart, effectively amplifying or reducing the visual impact of the indicator.
Example: A higher multiplier can make the Money Flow more prominent on the chart, aiding in the quick identification of significant money flow changes.
Y Position (Y Pos): Default: 0
What it is: The vertical position adjustment for the Fast Money Flow plot on the chart.
What it does: Allows you to move the Money Flow plot up or down on the chart to avoid overlap with other indicators.
Example: Adjusting the Y Position can be useful if you have multiple indicators on the chart and need to maintain clarity.
Fast MFI Style, Width, and Color:
What it is: Customization options for how the Fast Money Flow is displayed on the chart.
What it does: Enables you to choose between different plot styles (line or area), set the line width, and select colors for positive and negative money flow.
Example: Using different colors for positive (green) and negative (red) money flow helps to visually distinguish between periods of buying and selling pressure.
Slow Money Flow Indicator Explanation
The Slow Money Flow indicator tracks the flow of money into and out of an asset over a longer time frame. It provides a broader perspective on market sentiment, smoothing out short-term fluctuations and highlighting longer-term trends.
Slow Money Flow Input Settings:
Slow Money Flow: Length: Default: 12
What it is: The period used for calculating the Slow Money Flow.
What it does: A longer period smooths out short-term fluctuations, providing a clearer view of the overall money flow trend.
Example: A length of 12 is often used by traders looking to identify sustained trends rather than short-term volatility.
Slow MFI Area Multiplier: Default: 5
What it is: A multiplier applied to the Slow Money Flow area calculation.
What it does: Adjusts the size of the Money Flow area on the chart, helping to emphasize the indicator’s significance.
Example: Increasing the multiplier can help highlight the Money Flow in markets with less volatile price action.
Y Position (Y Pos): Default: 0
What it is: The vertical position adjustment for the Slow Money Flow plot on the chart.
What it does: Allows for vertical repositioning of the Money Flow plot to maintain chart clarity when used with other indicators.
Example: Adjusting the Y Position ensures that the Slow Money Flow indicator does not overlap with other key indicators on the chart.
Slow MFI Style, Width, and Color:
What it is: Customization options for the visual display of the Slow Money Flow on the chart.
What it does: Allows you to choose the plot style (line or area), set the line width, and select colors to differentiate positive and negative money flow.
Example: Customizing the colors for the Slow Money Flow allows traders to quickly distinguish between buying and selling trends in the market.
RSI
Display of RSI:
Display of RSI Setting:
RSI Indicator Explanation
The Relative Strength Index (RSI) is a momentum oscillator that measures the speed and change of price movements. It is typically used to identify overbought or oversold conditions in the market, providing traders with potential signals for buying or selling.
RSI Input Settings:
RSI Source: Default: Close
What it is: The data source used for calculating the RSI.
What it does: Determines which price data (e.g., close, open) is used in the RSI calculation, affecting how the indicator reflects market conditions.
Example: Using the closing price is standard practice, as it reflects the final agreed-upon price for a given time period.
MA Type (Moving Average Type): Default: SMA
What it is: The type of moving average applied to the RSI for smoothing purposes.
What it does: Changes the smoothing technique of the RSI, impacting how quickly the indicator responds to price movements.
Example: Using an Exponential Moving Average (EMA) will make the RSI more sensitive to recent price changes compared to a Simple Moving Average (SMA).
RSI Length: Default: 14
What it is: The period over which the RSI is calculated.
What it does: Adjusts the sensitivity of the RSI. A shorter length (e.g., 7) makes the RSI more responsive to recent price changes, while a longer length (e.g., 21) smooths out the indicator, reducing the number of signals.
Example: A 14-period RSI is commonly used for identifying overbought and oversold conditions, providing a balance between sensitivity and reliability.
RSI Plot Style, Width, and Color:
What it is: Options to customize the appearance of the RSI line on the chart.
What it does: Allows you to adjust the visual representation of the RSI, including the line width and color.
Example: Setting a thicker line width and a bright color like yellow can make the RSI more visible on the chart, aiding in quick analysis.
Display of RSI with RSI Moving Average:
RSI Moving Average Explanation
The RSI Moving Average adds a smoothing layer to the RSI, helping to filter out noise and provide clearer signals. It is particularly useful for confirming trend strength and identifying potential reversals.
RSI Moving Average Input Settings:
MA Length: Default: 14
What it is: The period over which the Moving Average is calculated on the RSI.
What it does: Adjusts the smoothing of the RSI, helping to reduce false signals and provide a clearer trend indication.
Example: A 14-period moving average on the RSI can smooth out short-term fluctuations, making it easier to spot genuine overbought or oversold conditions.
MA Plot Style, Width, and Color:
What it is: Customization options for how the RSI Moving Average is displayed on the chart.
What it does: Allows you to adjust the line width and color, helping to differentiate the Moving Average from the main RSI line.
Example: Using a contrasting color for the RSI Moving Average (e.g., magenta) can help it stand out against the main RSI line, making it easier to interpret the indicator.
STOCHASTIC RSI
Display of Stochastic RSI:
Display of Stochastic RSI Setting:
Stochastic RSI Indicator Explanation
The Stochastic RSI (Stoch RSI) is a momentum oscillator that measures the level of the RSI relative to its high-low range over a set period of time. It is used to identify overbought and oversold conditions, providing potential buy and sell signals based on momentum shifts.
Stochastic RSI Input Settings:
Stochastic RSI Length: Default: 14
What it is: The period over which the Stochastic RSI is calculated.
What it does: Adjusts the sensitivity of the Stochastic RSI. A shorter length makes the indicator more responsive to recent price changes, while a longer length smooths out the fluctuations, reducing noise.
Example: A length of 14 is commonly used to identify momentum shifts over a medium-term period, providing a balanced view of potential overbought or oversold conditions.
Display of Stochastic RSI %K Line:
Stochastic RSI %K Line Explanation
The %K line in the Stochastic RSI is the main line that tracks the momentum of the RSI over the chosen period. It is the faster-moving component of the Stochastic RSI, often used to identify entry and exit points.
Stochastic RSI %K Input Settings:
%K Length: Default: 3
What it is: The period used for smoothing the %K line of the Stochastic RSI.
What it does: Smoothing the %K line helps reduce noise and provides a clearer signal for potential market reversals.
Example: A smoothing length of 3 is common, offering a balance between responsiveness and noise reduction, making it easier to spot significant momentum shifts.
%K Plot Style, Width, and Color:
What it is: Customization options for the visual representation of the %K line.
What it does: Allows you to adjust the appearance of the %K line on the chart, including line width and color, to fit your visual preferences.
Example: Setting a blue color and a medium width for the %K line makes it stand out clearly on the chart, helping to identify key points of momentum change.
%K Fill Color (Above):
What it is: The fill color that appears above the %K line on the chart.
What it does: Adds visual clarity by shading the area above the %K line, making it easier to interpret the direction and strength of momentum.
Example: Using a light blue fill color above the %K line can help emphasize bullish momentum, making it visually prominent.
Display of Stochastic RSI %D Line:
Stochastic RSI %D Line Explanation
The %D line in the Stochastic RSI is a moving average of the %K line and acts as a signal line. It is slower-moving compared to the %K line and is often used to confirm signals or identify potential reversals when it crosses the %K line.
Stochastic RSI %D Input Settings:
%D Length: Default: 3
What it is: The period used for smoothing the %D line of the Stochastic RSI.
What it does: Smooths out the %D line, making it less sensitive to short-term fluctuations and more reliable for identifying significant market signals.
Example: A length of 3 is often used to provide a smoothed signal line that can help confirm trends or reversals indicated by the %K line.
%D Plot Style, Width, and Color:
What it is: Customization options for the visual representation of the %D line.
What it does: Allows you to adjust the appearance of the %D line on the chart, including line width and color, to match your preferences.
Example: Setting an orange color and a thicker line width for the %D line can help differentiate it from the %K line, making crossover points easier to spot.
%D Fill Color (Below):
What it is: The fill color that appears below the %D line on the chart.
What it does: Adds visual clarity by shading the area below the %D line, making it easier to interpret bearish momentum.
Example: Using a light orange fill color below the %D line can highlight bearish conditions, making it visually easier to identify.
RSI & STOCHASTIC RSI OVERBOUGHT AND OVERSOLD LEVELS
Display of RSI & Stochastic with Overbought & Oversold Levels:
Display of RSI & Stochastic Overbought & Oversold Settings:
RSI & Stochastic Overbought & Oversold Levels Explanation
The Overbought (OB) and Oversold (OS) levels for RSI and Stochastic RSI indicators are key thresholds that help traders identify potential reversal points in the market. These levels are used to determine when an asset is likely overbought or oversold, which can signal a potential trend reversal.
RSI & Stochastic Overbought & Oversold Input Settings:
RSI & Stochastic Level 1 Overbought (OB) & Oversold (OS): Default: OB Level = 170, OS Level = 130
What it is: The first set of thresholds for determining overbought and oversold conditions for both RSI and Stochastic RSI indicators.
What it does: When the RSI or Stochastic RSI crosses above the overbought level, it suggests that the asset might be overbought, potentially signaling a sell opportunity. Conversely, when these indicators drop below the oversold level, it suggests the asset might be oversold, potentially signaling a buy opportunity.
Example: If the RSI crosses above 170, traders might look for signs of a potential trend reversal to the downside, while a cross below 130 might indicate a reversal to the upside.
RSI & Stochastic Level 2 Overbought (OB) & Oversold (OS): Default: OB Level = 180, OS Level = 120
What it is: The second set of thresholds for determining overbought and oversold conditions for both RSI and Stochastic RSI indicators.
What it does: These levels provide an additional set of reference points, allowing traders to differentiate between varying degrees of overbought and oversold conditions, potentially leading to more refined trading decisions.
Example: When the RSI crosses above 180, it might indicate an extreme overbought condition, which could be a stronger signal for a sell, while a cross below 120 might indicate an extreme oversold condition, which could be a stronger signal for a buy.
RSI & Stochastic Overbought (OB) Band Customization:
OB Level 1: Width, Style, and Color:
What it is: Customization options for the visual appearance of the first overbought band on the chart.
What it does: Allows you to set the line width, style (solid, dotted, dashed), and color for the first overbought band, enhancing its visibility on the chart.
Example: A dashed red line with medium width can clearly indicate the first overbought level, helping traders quickly identify when this threshold is crossed.
OB Level 2: Width, Style, and Color:
What it is: Customization options for the visual appearance of the second overbought band on the chart.
What it does: Allows you to set the line width, style, and color for the second overbought band, providing a clear distinction from the first band.
Example: A dashed red line with a slightly thicker width can represent a more significant overbought level, making it easier to differentiate from the first level.
RSI & Stochastic Oversold (OS) Band Customization:
OS Level 1: Width, Style, and Color:
What it is: Customization options for the visual appearance of the first oversold band on the chart.
What it does: Allows you to set the line width, style (solid, dotted, dashed), and color for the first oversold band, making it visually prominent.
Example: A dashed green line with medium width can highlight the first oversold level, helping traders identify potential buying opportunities.
OS Level 2: Width, Style, and Color:
What it is: Customization options for the visual appearance of the second oversold band on the chart.
What it does: Allows you to set the line width, style, and color for the second oversold band, providing an additional visual cue for extreme oversold conditions.
Example: A dashed green line with a thicker width can represent a more significant oversold level, offering a stronger visual cue for potential buying opportunities.
RSI DIVERGENCES
Display of RSI Divergence Labels:
Display of RSI Divergence Settings:
RSI Divergence Lookback Explanation
The RSI Divergence settings allow traders to customize the parameters for detecting divergences between the RSI (Relative Strength Index) and price action. Divergences occur when the price moves in the opposite direction to the RSI, potentially signaling a trend reversal. These settings help refine the accuracy of divergence detection by adjusting the lookback period and range. ( NOTE: This setting only imply to the RSI. This doesn't effect the STOCHASTIC RSI. )
RSI Divergence Lookback Input Settings:
Lookback Left: Default: 10
What it is: The number of bars to look back from the current bar to detect a potential divergence.
What it does: Defines the left-side lookback period for identifying pivot points in the RSI, which are used to spot divergences. A longer lookback period may capture more significant trends but could also miss shorter-term divergences.
Example: A setting of 10 bars means the script will consider pivot points up to 10 bars before the current bar to check for divergence patterns.
Lookback Right: Default: 1
What it is: The number of bars to look forward from the current bar to complete the divergence pattern.
What it does: Defines the right-side lookback period for confirming a potential divergence. This setting helps ensure that the identified divergence is valid by allowing the script to check subsequent bars for confirmation.
Example: A setting of 1 bar means the script will look at the next bar to confirm the divergence pattern, ensuring that the signal is reliable.
Lookback Range Min: Default: 5
What it is: The minimum range of bars required to detect a valid divergence.
What it does: Sets a lower bound on the range of bars considered for divergence detection. A lower minimum range might capture more frequent but possibly less significant divergences.
Example: Setting the minimum range to 5 ensures that only divergences spanning at least 5 bars are considered, filtering out very short-term patterns.
Lookback Range Max: Default: 60
What it is: The maximum range of bars within which a divergence can be detected.
What it does: Sets an upper bound on the range of bars considered for divergence detection. A larger maximum range might capture more significant divergences but could also include less relevant long-term patterns.
Example: Setting the maximum range to 60 bars allows the script to detect divergences over a longer timeframe, capturing more extended divergence patterns that could indicate major trend reversals.
RSI Divergence Explanation
RSI divergences occur when the RSI indicator and price action move in opposite directions, signaling potential trend reversals. This section of the settings allows traders to customize the appearance and detection of both regular and hidden bullish and bearish divergences.
RSI Divergence Input Settings:
R. Bullish Div Label: Default: True
What it is: An option to display labels for regular bullish divergences.
What it does: Enables or disables the visibility of labels that mark regular bullish divergences, where the price makes a lower low while the RSI makes a higher low, indicating a potential upward reversal.
Example: A trader might use this to spot buying opportunities in a downtrend when a bullish divergence suggests the trend may be reversing.
Bullish Label Color, Line Width, and Line Color:
What it is: Settings to customize the appearance of regular bullish divergence labels.
What it does: Allows you to choose the color of the labels, adjust the width of the divergence lines, and select the color for these lines.
Example: Selecting a green label color and a distinct line width makes bullish divergences easily recognizable on your chart.
R. Bearish Div Label: Default: True
What it is: An option to display labels for regular bearish divergences.
What it does: Enables or disables the visibility of labels that mark regular bearish divergences, where the price makes a higher high while the RSI makes a lower high, indicating a potential downward reversal.
Example: A trader might use this to spot selling opportunities in an uptrend when a bearish divergence suggests the trend may be reversing.
Bearish Label Color, Line Width, and Line Color:
What it is: Settings to customize the appearance of regular bearish divergence labels.
What it does: Allows you to choose the color of the labels, adjust the width of the divergence lines, and select the color for these lines.
Example: Choosing a red label color and a specific line width makes bearish divergences clearly stand out on your chart.
H. Bullish Div Label: Default: False
What it is: An option to display labels for hidden bullish divergences.
What it does: Enables or disables the visibility of labels that mark hidden bullish divergences, where the price makes a higher low while the RSI makes a lower low, indicating potential continuation of an uptrend.
Example: A trader might use this to confirm an existing uptrend when a hidden bullish divergence signals continued buying strength.
Hidden Bullish Label Color, Line Width, and Line Color:
What it is: Settings to customize the appearance of hidden bullish divergence labels.
What it does: Allows you to choose the color of the labels, adjust the width of the divergence lines, and select the color for these lines.
Example: A softer green color with a thinner line width might be chosen to subtly indicate hidden bullish divergences, keeping the chart clean while providing useful information.
H. Bearish Div Label: Default: False
What it is: An option to display labels for hidden bearish divergences.
What it does: Enables or disables the visibility of labels that mark hidden bearish divergences, where the price makes a lower high while the RSI makes a higher high, indicating potential continuation of a downtrend.
Example: A trader might use this to confirm an existing downtrend when a hidden bearish divergence signals continued selling pressure.
Hidden Bearish Label Color, Line Width, and Line Color:
What it is: Settings to customize the appearance of hidden bearish divergence labels.
What it does: Allows you to choose the color of the labels, adjust the width of the divergence lines, and select the color for these lines.
Example: A muted red color with a thinner line width might be selected to indicate hidden bearish divergences without overwhelming the chart.
Divergence Text Size and Color: Default: S (Small)
What it is: Settings to adjust the size and color of text labels for RSI divergences.
What it does: Allows you to customize the size and color of text labels that display the divergence information on the chart.
Example: Choosing a small text size with a bright white color can make divergence labels easily readable without taking up too much space on the chart.
STOCHASTIC DIVERGENCES
Display of Stochastic RSI Divergence Labels:
Display of Stochastic RSI Divergence Settings:
Stochastic RSI Divergence Explanation
Stochastic RSI divergences occur when the Stochastic RSI indicator and price action move in opposite directions, signaling potential trend reversals. These settings allow traders to customize the detection and visual representation of both regular and hidden bullish and bearish divergences in the Stochastic RSI.
Stochastic RSI Divergence Input Settings:
R. Bullish Div Label: Default: True
What it is: An option to display labels for regular bullish divergences in the Stochastic RSI.
What it does: Enables or disables the visibility of labels that mark regular bullish divergences, where the price makes a lower low while the Stochastic RSI makes a higher low, indicating a potential upward reversal.
Example: A trader might use this to spot buying opportunities in a downtrend when a bullish divergence in the Stochastic RSI suggests the trend may be reversing.
Bullish Label Color, Line Width, and Line Color:
What it is: Settings to customize the appearance of regular bullish divergence labels in the Stochastic RSI.
What it does: Allows you to choose the color of the labels, adjust the width of the divergence lines, and select the color for these lines.
Example: Selecting a blue label color and a distinct line width makes bullish divergences in the Stochastic RSI easily recognizable on your chart.
R. Bearish Div Label: Default: True
What it is: An option to display labels for regular bearish divergences in the Stochastic RSI.
What it does: Enables or disables the visibility of labels that mark regular bearish divergences, where the price makes a higher high while the Stochastic RSI makes a lower high, indicating a potential downward reversal.
Example: A trader might use this to spot selling opportunities in an uptrend when a bearish divergence in the Stochastic RSI suggests the trend may be reversing.
Bearish Label Color, Line Width, and Line Color:
What it is: Settings to customize the appearance of regular bearish divergence labels in the Stochastic RSI.
What it does: Allows you to choose the color of the labels, adjust the width of the divergence lines, and select the color for these lines.
Example: Choosing an orange label color and a specific line width makes bearish divergences in the Stochastic RSI clearly stand out on your chart.
H. Bullish Div Label: Default: False
What it is: An option to display labels for hidden bullish divergences in the Stochastic RSI.
What it does: Enables or disables the visibility of labels that mark hidden bullish divergences, where the price makes a higher low while the Stochastic RSI makes a lower low, indicating potential continuation of an uptrend.
Example: A trader might use this to confirm an existing uptrend when a hidden bullish divergence in the Stochastic RSI signals continued buying strength.
Hidden Bullish Label Color, Line Width, and Line Color:
What it is: Settings to customize the appearance of hidden bullish divergence labels in the Stochastic RSI.
What it does: Allows you to choose the color of the labels, adjust the width of the divergence lines, and select the color for these lines.
Example: A softer blue color with a thinner line width might be chosen to subtly indicate hidden bullish divergences, keeping the chart clean while providing useful information.
H. Bearish Div Label: Default: False
What it is: An option to display labels for hidden bearish divergences in the Stochastic RSI.
What it does: Enables or disables the visibility of labels that mark hidden bearish divergences, where the price makes a lower high while the Stochastic RSI makes a higher high, indicating potential continuation of a downtrend.
Example: A trader might use this to confirm an existing downtrend when a hidden bearish divergence in the Stochastic RSI signals continued selling pressure.
Hidden Bearish Label Color, Line Width, and Line Color:
What it is: Settings to customize the appearance of hidden bearish divergence labels in the Stochastic RSI.
What it does: Allows you to choose the color of the labels, adjust the width of the divergence lines, and select the color for these lines.
Example: A muted orange color with a thinner line width might be selected to indicate hidden bearish divergences without overwhelming the chart.
Divergence Text Size and Color: Default: S (Small)
What it is: Settings to adjust the size and color of text labels for Stochastic RSI divergences.
What it does: Allows you to customize the size and color of text labels that display the divergence information on the chart.
Example: Choosing a small text size with a bright white color can make divergence labels easily readable without taking up too much space on the chart.
Alert System:
Custom Alerts for Divergences and Reversals:
What it is: The script includes customizable alert conditions to notify you of detected divergences or potential reversals based on WaveTrend, RSI, and Stochastic RSI.
What it does: Helps you stay informed of key market movements without constantly monitoring the charts, enabling timely decisions.
Example: Setting an alert for regular bearish divergence on the WaveTrend could notify you of a potential sell opportunity as soon as it is detected.
How to Use Alerts:
Set up custom alerts in TradingView based on these conditions to be notified of potential trading opportunities. Alerts are triggered when the indicator detects conditions that match the selected criteria, such as divergences or potential reversals.
By following the detailed guidelines and examples above, you can effectively use and customize this powerful indicator to suit your trading strategy.
For further understanding and customization, refer to the input settings within the script and adjust them to match your trading style and preferences.
How Components Work Together
Synergy and Cross-Validation: The indicator combines multiple layers of analysis to validate trading signals. For example, a WaveTrend buy signal that coincides with a bullish divergence in RSI and positive fast money flow is likely to be more reliable than any single indicator’s signal. This cross-validation reduces the likelihood of false signals and enhances decision-making.
Comprehensive Market Analysis: Each component plays a role in analyzing different aspects of the market. WaveTrend focuses on trend strength, Money Flow indicators assess market sentiment, while RSI and Stochastic RSI offer detailed views of price momentum and potential reversals.
Ideal For
Traders who require a reliable, multifaceted tool for detecting market trends and reversals.
Investors seeking a deeper understanding of market dynamics across different timeframes and conditions, whether in forex, equities, or cryptocurrency markets.
This script is designed to provide a comprehensive tool for technical analysis, combining multiple indicators and divergence detection into one versatile and customizable script. It is especially useful for traders who want to monitor various indicators simultaneously and look for convergence or divergence signals across different technical tools.
Acknowledgements
Special thanks to these amazing creators for inspiration and their creations:
I want to thank these amazing creators for creating there amazing indicators , that inspired me and also gave me a head start by making this indicator! Without their amazing indicators it wouldn't be possible!
vumanchu: VuManChu Cipher B Divergences.
MisterMoTa: RSI + Divergences + Alerts .
DevLucem: Plain Stochastic Divergence.
Note
This indicator is designed to be a powerful tool in your trading arsenal. However , it is essential to backtest and adjust the settings according to your trading strategy before applying it to live trading . If you have any questions or need further assistance, feel free to reach out.

Stoch_RSI_ChartEnhanced Stochastic RSI Divergence Indicator with VWAP Filter for Charts
This custom indicator builds upon the classic Stochastic RSI to automatically detect both regular and hidden divergences. It’s designed to help traders spot potential market reversals or continuations using two methods for divergence detection (fractal‑ and pivot‑based) while offering optional VWAP filtering for confirmation.
Key Features
Stoch RSI Calculation
The indicator computes a smoothed Stoch RSI using configurable parameters for RSI length, stochastic length, and smoothing periods. An option to average the K and D lines provides a cleaner momentum view.
Divergence Detection via Fractals & Pivots
Fractal-Based Divergences:
Looks for 4-candle patterns to identify higher-highs or lower-lows in the price that are not confirmed by the oscillator, signaling potential reversals.
Pivot-Based Divergences:
Utilizes TradingView’s built-in pivot functions to find divergence conditions over adjustable pivot ranges.
Regular vs. Hidden Divergences:
Regular Divergence: Occurs when price makes a new extreme (higher high or lower low) while the Stoch RSI fails to follow suit.
Hidden Divergence: Indicates potential trend continuations when the oscillator diverges against the established price trend.
Optional VWAP Filtering
The script includes two optional VWAP filters that work as follows:
VWAP Filter on Regular Divergences:
Only confirms regular divergence signals if the current price satisfies the VWAP condition (e.g., price is above VWAP for bullish signals, below VWAP for bearish signals).
VWAP Filter on Hidden Divergences:
Similarly, hidden divergence signals are validated only when the price meets specific VWAP conditions, adding an extra layer of trend confirmation.
Customizable Alerts and Visual Labels
Easily configure divergence labels (“B” for bullish, “S” for bearish) and enable up to four alert conditions for real‑time notifications when a divergence occurs.
Credits & History:
Log RSI by @fskrypt
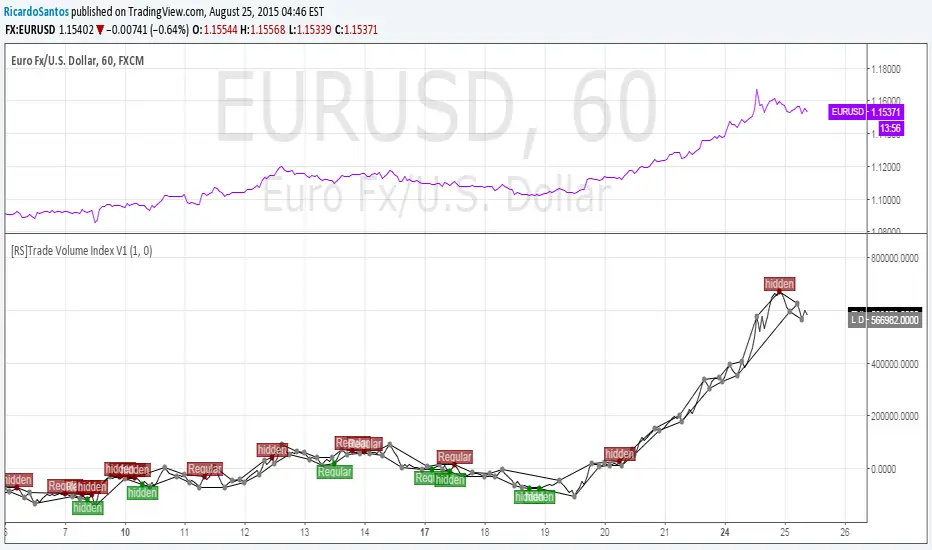
Divergence Detection originally by @RicardoSantos (with edits from @JustUncleL)
Further Edits by @NeoButane on August 8, 2018
Latest Edits by @FYMD on June 1, 2024

Savitzky-Golay Z-Score [BackQuant]Savitzky-Golay Z-Score
The Savitzky-Golay Z-Score is a powerful trading indicator that combines the precision of the Savitzky-Golay filter with the statistical strength of the Z-Score. This advanced indicator is designed to detect trend shifts, identify overbought or oversold conditions, and highlight potential divergences in the market, providing traders with a unique edge in detecting momentum changes and trend reversals.
Core Concept: Savitzky-Golay Filter
The Savitzky-Golay filter is a widely-used smoothing technique that preserves important signal features such as peak detection while filtering out noise. In this indicator, the filter is applied to price data (default set to HLC3) to smooth out volatility and produce a cleaner trend line. By specifying the window size and polynomial degree, traders can fine-tune the degree of smoothing to match their preferred trading style or market conditions.
Z-Score: Measuring Deviation
The Z-Score is a statistical measure that indicates how far the current price is from its mean in terms of standard deviations. In trading, the Z-Score can be used to identify extreme price moves that are likely to revert or continue trending. A positive Z-Score means the price is above the mean, while a negative Z-Score indicates the price is below the mean.
This script calculates the Z-Score based on the Savitzky-Golay filtered price, enabling traders to detect moments when the price is diverging from its typical range and may present an opportunity for a trade.
Long and Short Conditions
The Savitzky-Golay Z-Score generates clear long and short signals based on the Z-Score value:
Long Signals : When the Z-Score is positive, indicating the price is above its smoothed mean, a long signal is generated. The color of the bars turns green, signaling upward momentum.
Short Signals : When the Z-Score is negative, indicating the price is below its smoothed mean, a short signal is generated. The bars turn red, signaling downward momentum.
These signals allow traders to follow the prevailing trend with confidence, using statistical backing to avoid false signals from short-term volatility.
Standard Deviation Levels and Extreme Levels
This indicator includes several features to help visualize overbought and oversold conditions:
Standard Deviation Levels: The script plots horizontal lines at +1, +2, -1, and -2 standard deviations. These levels provide a reference for how far the current price is from the mean, allowing traders to quickly identify when the price is moving into extreme territory.
Extreme Levels: Additional extreme levels at +3 and +4 (and their negative counterparts) are plotted to highlight areas where the price is highly likely to revert. These extreme levels provide important insight into market conditions that are far outside the norm, signaling caution or potential reversal zones.
The indicator also adapts the color shading of these extreme zones based on the Z-Score’s strength. For example, the area between +3 and +4 is shaded with a stronger color when the Z-Score approaches these values, giving a visual representation of market pressure.
Divergences: Detecting Hidden and Regular Signals
A key feature of the Savitzky-Golay Z-Score is its ability to detect bullish and bearish divergences, both regular and hidden:
Regular Bullish Divergence: This occurs when the price makes a lower low while the Z-Score forms a higher low. It signals that bearish momentum is weakening, and a bullish reversal could be near.
Hidden Bullish Divergence: This divergence occurs when the price makes a higher low while the Z-Score forms a lower low. It signals that bullish momentum may continue after a temporary pullback.
Regular Bearish Divergence: This occurs when the price makes a higher high while the Z-Score forms a lower high, signaling that bullish momentum is weakening and a bearish reversal may be near.
Hidden Bearish Divergence: This divergence occurs when the price makes a lower high while the Z-Score forms a higher high, indicating that bearish momentum may continue after a temporary rally.
These divergences are plotted directly on the chart, making it easier for traders to spot when the price and momentum are out of sync and when a potential reversal may occur.
Customization and Visualization
The Savitzky-Golay Z-Score offers a range of customization options to fit different trading styles:
Window Size and Polynomial Degree: Adjust the window size and polynomial degree of the Savitzky-Golay filter to control how much smoothing is applied to the price data.
Z-Score Lookback Period: Set the lookback period for calculating the Z-Score, allowing traders to fine-tune the sensitivity to short-term or long-term price movements.
Display Options: Choose whether to display standard deviation levels, extreme levels, and divergence labels on the chart.
Bar Color: Color the price bars based on trend direction, with green for bullish trends and red for bearish trends, allowing traders to easily visualize the current momentum.
Divergences: Enable or disable divergence detection, and adjust the lookback periods for pivots used to detect regular and hidden divergences.
Alerts and Automation
To ensure you never miss an important signal, the indicator includes built-in alert conditions for the following events:
Positive Z-Score (Long Signal): Triggers an alert when the Z-Score crosses above zero, indicating a potential buying opportunity.
Negative Z-Score (Short Signal): Triggers an alert when the Z-Score crosses below zero, signaling a potential short opportunity.
Shifting Momentum: Alerts when the Z-Score is shifting up or down, providing early warning of changing market conditions.
These alerts can be configured to notify you via email, SMS, or app notification, allowing you to stay on top of the market without having to constantly monitor the chart.
Trading Applications
The Savitzky-Golay Z-Score is a versatile tool that can be applied across multiple trading strategies:
Trend Following: By smoothing the price and calculating the Z-Score, this indicator helps traders follow the prevailing trend while avoiding false signals from short-term volatility.
Mean Reversion: The Z-Score highlights moments when the price is far from its mean, helping traders identify overbought or oversold conditions and capitalize on potential reversals.
Divergence Trading: Regular and hidden divergences between the Z-Score and price provide early warning of trend reversals, allowing traders to enter trades at opportune moments.
Final Thoughts
The Savitzky-Golay Z-Score is an advanced statistical tool designed to provide a clearer view of market trends and momentum. By applying the Savitzky-Golay filter and Z-Score analysis, this indicator reduces noise and highlights key areas where the market may reverse or accelerate, giving traders a significant edge in understanding price behavior.
Whether you’re a trend follower or a reversal trader, this indicator offers the flexibility and insights you need to navigate complex markets with confidence.
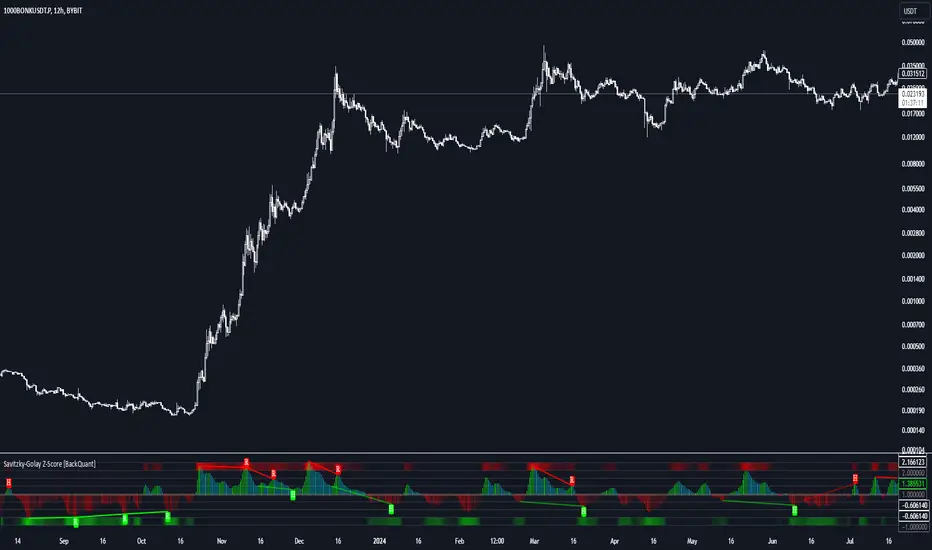
Nef33-Volume Footprint ApproximationDescription of the "Volume Footprint Approximation" Indicator
Purpose
The "Volume Footprint Approximation" indicator is a tool designed to assist traders in analyzing market volume dynamics and anticipating potential trend changes in price. It is inspired by the concept of a volume footprint chart, which visualizes the distribution of trading volume across different price levels. However, since TradingView does not provide detailed intrabar data for all users, this indicator approximates the behavior of a footprint chart by using available volume and price data (open, close, volume) to classify volume as buy or sell, calculate volume delta, detect imbalances, and generate trend change signals.
The indicator is particularly useful for identifying areas of high buying or selling activity, imbalances between supply and demand, delta divergences, and potential reversal points in the market. It provides specific signals for bullish and bearish trend changes, making it suitable for traders looking to trade reversals or confirm trends.
How It Works
The indicator uses volume and price data from each candlestick to perform the following calculations:
Volume Classification:
Classifies the volume of each candlestick as "buy" or "sell" based on price movement:
If the closing price is higher than the opening price (close > open), the volume is classified as "buy."
If the closing price is lower than the opening price (close < open), the volume is classified as "sell."
If the closing price equals the opening price (close == open), it compares with the previous close to determine the direction:
If the current close is higher than the previous close, it is classified as "buy."
If the current close is lower than the previous close, it is classified as "sell."
If the current close equals the previous close, the classification from the previous bar is used.
Delta Calculation:
Calculates the volume delta as the difference between buy volume and sell volume (buyVolume - sellVolume).
A positive delta indicates more buy volume; a negative delta indicates more sell volume.
Imbalance Detection:
Identifies imbalances between buy and sell volume:
A buy imbalance occurs when buy volume exceeds sell volume by a defined percentage (default is 300%).
A sell imbalance occurs when sell volume exceeds buy volume by the same percentage.
Delta Divergence Detection:
Positive Delta Divergence: Occurs when the price is falling (for at least 2 bars) but the delta is increasing or becomes positive, indicating that buyers are entering despite the price decline.
Negative Delta Divergence: Occurs when the price is rising (for at least 2 bars) but the delta is decreasing or becomes negative, indicating that sellers are entering despite the price increase.
Trend Change Signals:
Bullish Signal (trendChangeBullish): Generated when the following conditions are met:
There is a positive delta divergence.
The delta has moved from a negative value (e.g., -500) to a positive value (e.g., +200) over the last 3 bars.
There is a buy imbalance.
The price is near a historical support level (approximated as the lowest low of the last 50 bars).
Bearish Signal (trendChangeBearish): Generated when the following conditions are met:
There is a negative delta divergence.
The delta has moved from a positive value (e.g., +500) to a negative value (e.g., -200) over the last 3 bars.
There is a sell imbalance.
The price is near a historical resistance level (approximated as the highest high of the last 50 bars).
Visual Elements
The indicator is displayed in a separate panel below the price chart (overlay=false) and includes the following elements:
Volume Histograms:
Buy Volume: Represented by a green histogram. Shows the volume classified as "buy."
Sell Volume: Represented by a red histogram. Shows the volume classified as "sell."
Note: The histograms overlap, and the last plotted histogram (red) takes visual precedence, meaning the sell volume may cover the buy volume if it is larger.
Delta Line:
Delta Volume: Represented by a blue line. Shows the difference between buy and sell volume.
A line above zero indicates more buy volume; a line below zero indicates more sell volume.
A dashed gray horizontal line marks the zero level for easier interpretation.
Imbalance Backgrounds:
Buy Imbalance: Light green background when buy volume exceeds sell volume by the defined percentage.
Sell Imbalance: Light red background when sell volume exceeds buy volume by the defined percentage.
Divergence Backgrounds:
Positive Delta Divergence: Lime green background when a positive delta divergence is detected.
Negative Delta Divergence: Fuchsia background when a negative delta divergence is detected.
Trend Change Signals:
Bullish Signal: Green label with the text "Bullish Trend Change" when the conditions for a bullish trend change are met.
Bearish Signal: Red label with the text "Bearish Trend Change" when the conditions for a bearish trend change are met.
Information Labels:
Below each bar, a label displays:
Total Vol: The total volume of the bar.
Delta: The delta volume value.
Alerts
The indicator generates the following alerts:
Positive Delta Divergence: "Positive Delta Divergence Detected! Price is falling, but delta is increasing."
Negative Delta Divergence: "Negative Delta Divergence Detected! Price is rising, but delta is decreasing."
Bullish Trend Change Signal: "Bullish Trend Change Signal! Positive Delta Divergence, Delta Rise, Buy Imbalance, and Near Support."
Bearish Trend Change Signal: "Bearish Trend Change Signal! Negative Delta Divergence, Delta Drop, Sell Imbalance, and Near Resistance."
These alerts can be configured in TradingView to receive real-time notifications.
Adjustable Parameters
The indicator allows customization of the following parameters:
Imbalance Threshold (%): The percentage required to detect an imbalance between buy and sell volume (default is 300%).
Lookback Period for Divergence: Number of bars to look back for detecting price and delta trends (default is 2 bars).
Support/Resistance Lookback Period: Number of bars to look back for identifying historical support and resistance levels (default is 50 bars).
Delta High Threshold (Bearish): Minimum delta value 2 bars ago for the bearish signal (default is +500).
Delta Low Threshold (Bearish): Maximum delta value in the current bar for the bearish signal (default is -200).
Delta Low Threshold (Bullish): Maximum delta value 2 bars ago for the bullish signal (default is -500).
Delta High Threshold (Bullish): Minimum delta value in the current bar for the bullish signal (default is +200).
Practical Use
The indicator is useful for the following purposes:
Identifying Trend Changes:
The trend change signals (trendChangeBullish and trendChangeBearish) indicate potential price reversals. For example, a bullish signal near a support level may be an opportunity to enter a long position.
Detecting Divergences:
Delta divergences (positive and negative) can anticipate trend changes by showing a disagreement between price movement and underlying buying/selling pressure.
Finding Key Levels:
Imbalances (green and red backgrounds) often coincide with support and resistance levels, helping to identify areas where the market might react.
Confirming Trends:
A consistently positive delta in an uptrend or a negative delta in a downtrend can confirm the strength of the trend.
Identifying Failed Auctions:
Although not detected automatically, you can manually identify failed auctions by observing a price move to new highs/lows with decreasing volume in the direction of the move.
Limitations
Intrabar Data: It does not use detailed intrabar data, making it less precise than a native footprint chart.
Approximations: Volume classification and support/resistance detection are approximations, which may lead to false signals.
Volume Dependency: It requires reliable volume data, so it may be less effective on assets with inaccurate volume data (e.g., some forex pairs).
False Signals: Divergences and imbalances do not always indicate a trend change, especially in strongly trending markets.
Recommendations
Combine with Other Indicators: Use tools like RSI, MACD, support/resistance levels, or candlestick patterns to confirm signals.
Trade on Higher Timeframes: Signals are more reliable on higher timeframes like 1-hour or 4-hour charts.
Perform Backtesting: Evaluate the indicator's accuracy on historical data to adjust parameters and improve effectiveness.
Adjust Parameters: Modify thresholds (e.g., imbalanceThreshold or supportResistanceLookback) based on the asset and timeframe you are trading.
Conclusion
The "Volume Footprint Approximation" indicator is a powerful tool for analyzing volume dynamics and anticipating price trend changes. By classifying volume, calculating delta, detecting imbalances and divergences, and generating trend change signals, it provides traders with valuable insights into market buying and selling pressure. While it has limitations due to the lack of intrabar data, it can be highly effective when used in combination with other technical analysis tools and on assets with reliable volume data.
