TSI + DivergencesTrue Strength Indicator (TSI) + Divergences + Alerts + Lookback periods.
This version of the True Strength Indicator adds the following 3 additional features to the stock TSI by Tradingview:
- Optional divergence lines drawn directly onto the oscillator.
- Configurable alerts to notify you when divergences occur.
- Configurable lookback periods to fine tune the divergences drawn in order to suit different trading styles and timeframes.
This indicator adds additional features onto the stock TSI by Tradingview, whose core calculations remain unchanged. Namely the configurable option to automatically, quickly and clearly draw divergence lines onto the oscillator for you as they occur, with minimal delay. It also has the addition of unique alerts, so you can be notified when divergences occur without spending all day watching the charts. Furthermore, this version of the TSI comes with configurable lookback periods, which can be configured in order to adjust the sensitivity of the divergences, in order to suit shorter or higher timeframe trading approaches.
The True Strength Indicator
Tradingview describes the True Strength Indicator as follows:
“The True Strength Index (TSI) is a momentum oscillator that ranges between limits of -100 and +100 and has a base value of 0. Momentum is positive when the oscillator is positive (pointing to a bullish market bias) and vice versa. It was developed by William Blau and consists of 2 lines: the index line and an exponential moving average of the TSI, called the signal line. Traders may look for any of the following 5 types of conditions: overbought, oversold, centerline crossover, divergence and signal line crossover. The indicator is often used in combination with other signals..”
What are divergences?
Divergence is when the price of an asset is moving in the opposite direction of a technical indicator, such as an oscillator, or is moving contrary to other data. Divergence warns that the current price trend may be weakening, and in some cases may lead to the price changing direction.
There are 4 main types of divergence, which are split into 2 categories;
regular divergences and hidden divergences. Regular divergences indicate possible trend reversals, and hidden divergences indicate possible trend continuation.
Regular bullish divergence: An indication of a potential trend reversal, from the current downtrend, to an uptrend.
Regular bearish divergence: An indication of a potential trend reversal, from the current uptrend, to a downtrend.
Hidden bullish divergence: An indication of a potential uptrend continuation.
Hidden bearish divergence: An indication of a potential downtrend continuation.
Setting alerts.
With this indicator you can set alerts to notify you when any/all of the above types of divergences occur, on any chart timeframe you choose.
Configurable lookback values.
You can adjust the default lookback values to suit your prefered trading style and timeframe. If you like to trade a shorter time frame, lowering the default lookback values will make the divergences drawn more sensitive to short term price action.
How do traders use divergences in their trading?
A divergence is considered a leading indicator in technical analysis, meaning it has the ability to indicate a potential price move in the short term future.
Hidden bullish and hidden bearish divergences, which indicate a potential continuation of the current trend are sometimes considered a good place for traders to begin, since trend continuation occurs more frequently than reversals, or trend changes.
When trading regular bullish divergences and regular bearish divergences, which are indications of a trend reversal, the probability of it doing so may increase when these occur at a strong support or resistance level. A common mistake new traders make is to get into a regular divergence trade too early, assuming it will immediately reverse, but these can continue to form for some time before the trend eventually changes, by using forms of support or resistance as an added confluence, such as when price reaches a moving average, the success rate when trading these patterns may increase.
Typically, traders will manually draw lines across the swing highs and swing lows of both the price chart and the oscillator to see whether they appear to present a divergence, this indicator will draw them for you, quickly and clearly, and can notify you when they occur.
Disclaimer : This script includes code from the stock TSI by Tradingview as well as the RSI divergence indicator.
Cari dalam skrip untuk "Divergence"

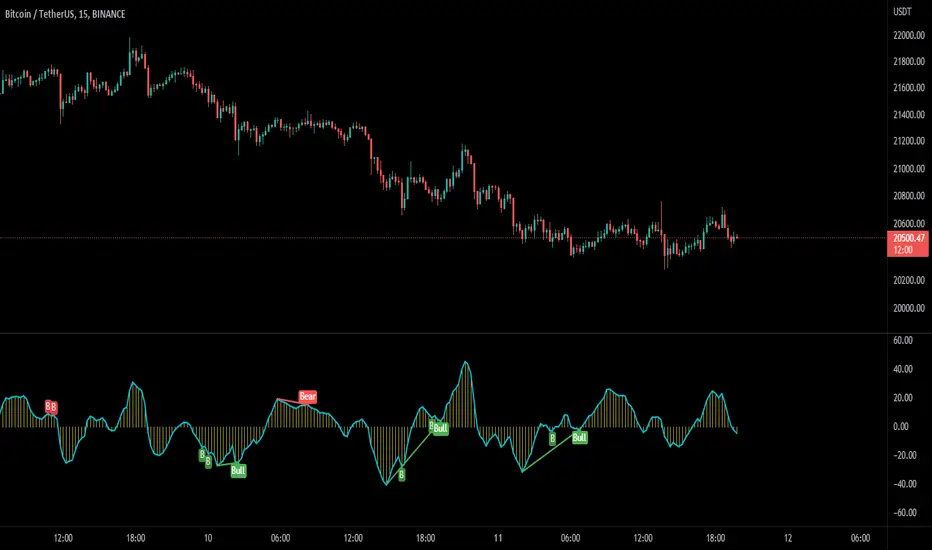
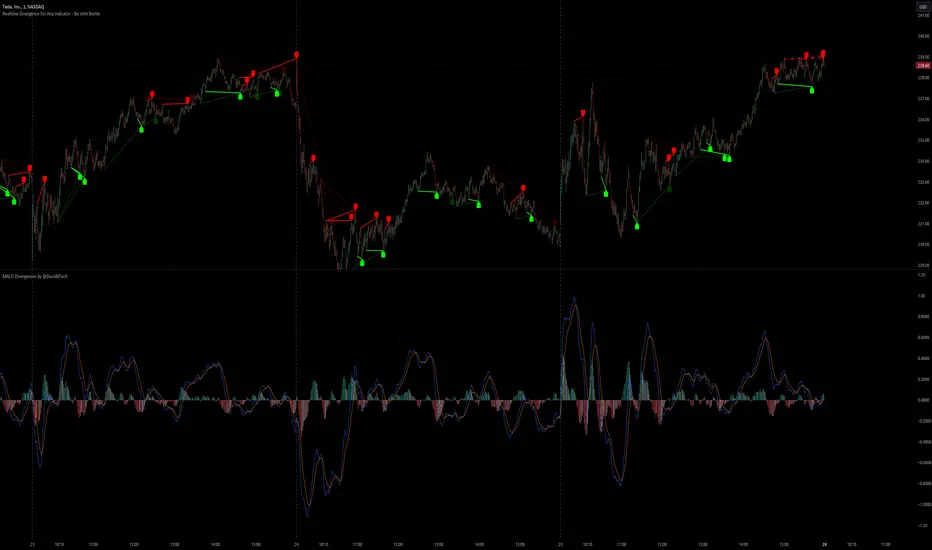
Momentum Oscillator, Divergences & Signals [TrendAlpha]The "Momentum, Real Time Divergences & Signals " indicator is designed to provide traders with insights into market momentum, identify potential divergences, and generate buy and sell signals. It offers a comprehensive set of features to assist traders in making informed trading decisions.
The indicator starts by calculating the momentum oscillator based on user-defined parameters.
- Traders can adjust the "Length" parameter to customize the sensitivity of the oscillator. The default value is set to 7, but it can be modified according to individual preferences.
- The "Source" parameter allows traders to select the input source for the oscillator calculation, with the default being the closing price of the asset.
- Traders have the option to display divergence lines by switching on the "Show Lines" parameter. This feature helps identify potential divergences between the oscillator and the price.
The oscillator is calculated using a two-step process. First, a smoothing function is applied to the source data using the "sma" (simple moving average) function. Then, the rate of change is computed over the specified length using the "mom" (momentum) function. Positive oscillator values indicate upward momentum, while negative values indicate downward momentum.
The indicator also generates buy and sell signals by identifying bullish and bearish divergences. A bullish divergence occurs when the oscillator is negative and crosses above zero, while a bearish divergence occurs when the oscillator is positive and crosses below zero. The indicator checks for specific conditions to confirm the divergences, such as comparing the current oscillator value with the previous value and validating the corresponding price action.
When a bullish or bearish divergence is detected, the indicator plots circles to highlight these signals on the chart. A green circle indicates a bullish signal, suggesting a potential buying opportunity, while a red circle indicates a bearish signal, suggesting a potential selling opportunity. In addition to circles, the indicator also displays labels to provide further clarity on the signals. A "Buy" label is shown for bullish signals, and a "Sell" label is shown for bearish signals.
To visually represent the divergences, the indicator plots lines connecting the corresponding points on the oscillator. A green line is drawn for bullish divergences, while a red line is drawn for bearish divergences. Traders can easily observe the divergence patterns and their relationships with the price action, aiding them in making trading decisions.
- The indicator also includes alert conditions for both bullish and bearish divergences. Traders can set up alerts to receive notifications when potential divergences occur, allowing them to take timely action.

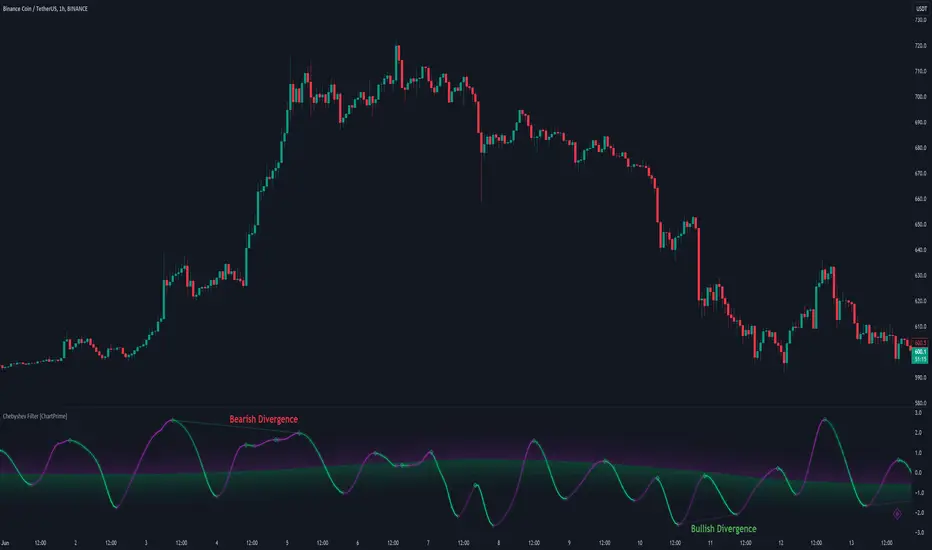
Chebyshev Filter Divergences [ChartPrime]The Chebyshev Filter Divergences Oscillator
The Chebyshev Filter indicator is a powerful tool designed to identify potential divergences between price and a filtered version of price based on the Chebyshev filter algorithm. It helps to spot mean reversion points by highlighting areas where price and the filtered price exhibit conflicting signals.
Chebyshev Filter Background:
The Chebyshev filter, named after the Russian mathematician Pafnuty Chebyshev , was invented in the mid-19th century. It's a type of filter used in signal processing and digital signal processing for smoothing or removing unwanted frequency components from a signal.
It provides a sharp cutoff between the passband and stopband of a filter while minimizing ripple in the passband or stopband.
Chebyshev filters are widely used in various applications, including audio and image processing, telecommunications, and financial analysis, due to their efficiency and effectiveness in filtering out noise and extracting relevant information from signals.
◆ Indicator Calculation:
The indicator first applies a Chebyshev filter to the price data, producing a filtered price series. It then normalizes this filtered price series to a range, where it can be used as oscillator with divergences.
◆ Visualization:
The filtered price series is plotted on the chart, highlighting areas where it deviates from its smoothed average.
Bullish and bearish divergences are marked on the chart with specific lines and colors, indicating potential shifts in market sentiment.
Signs of change in direction are also marked on the chart, providing additional insights into possible mean reversals of price.
◆ User Inputs:
Ripple (dB): Specifies the desired ripple factor in decibels for the Chebyshev filter.
Normalization Length: Sets the length of the normalization period used in the Chebyshev filter.
Pivots to Right and Left: Determines the number of pivot points to the right and left of the current point to consider when detecting divergences.
Max and Min of Lookback Range: Specifies the maximum and minimum lookback range for identifying divergences.
Show Divergences: Enables or disables the display of bullish and bearish divergences.
Visual Settings: Allows customization of colors for visual clarity.
In conclusion, the Chebyshev Filter Divergences indicator, with its ability to identify potential mean reversion points through divergences between price and a filtered version of price, offers traders a valuable tool for decision-making in the financial markets. By highlighting areas of divergence, traders can potentially capitalize on market inefficiencies and make more informed trading decisions.
ATR Divergences [UAlgo]Divergence is a concept in financial markets that highlights inconsistencies between the price of an asset and a given indicator. This script focuses on identifying divergences using the Average True Range (ATR). Divergence occurs when there is a disparity between the direction of the price and the oscillator, providing valuable insights for traders anticipating potential trend reversals.
This script employs pivot points (with using High-Low values of the candles) to identify potential divergences between the oscillator (ATR) and price movements. Here's how each type of divergence is determined:
Key Features:
Regular Bullish Divergence:
Oscillator registers a higher low.
Price records a lower low.
Indicative of potential upward reversal.
Hidden Bullish Divergence:
Oscillator indicates a lower low.
Price exhibits a higher low.
Signals a concealed bullish continuation pattern.
Regular Bearish Divergence:
Oscillator shows a lower high.
Price marks a higher high.
Suggests a possible downward reversal.
Hidden Bearish Divergence:
Oscillator reflects a higher high.
Price displays a lower high.
Indicates a hidden bearish continuation pattern.
Usage and Customization:
ATR Length: Adjustable parameter for customizing the Average True Range calculation period.
Plot Options: Choose to display Regular Bullish, Hidden Bullish, Regular Bearish, and/or Hidden Bearish divergences.
Wait for Candle Close: Option to wait for candle closure before plotting signals.
How to Interpret:
Regular divergences may indicate potential trend reversals, while hidden divergences suggest a continuation of the current trend. Traders can leverage these signals to make informed decisions in their trading strategies.
Feel free to customize the parameters based on your trading preferences. Happy Trading!

RSI Potential Divergence - FontiramisuIndicator showing potential momentum divergences on RSI Momentum.
The problem with the classic divergence is that when the signal appears, it is sometimes too late to enter a trade.
The potential divergence corrects this problem by signaling the beginning of a potential divergence.
RSI is a momentum indicator that offers relevant insights with divergences.
Potential divergences are indicated with the letter B and a red color for Bearish Div or Green color for Bullish Div .
Potential divergence is confirmed when the line and the label "Bear"' or "Bull" appear.

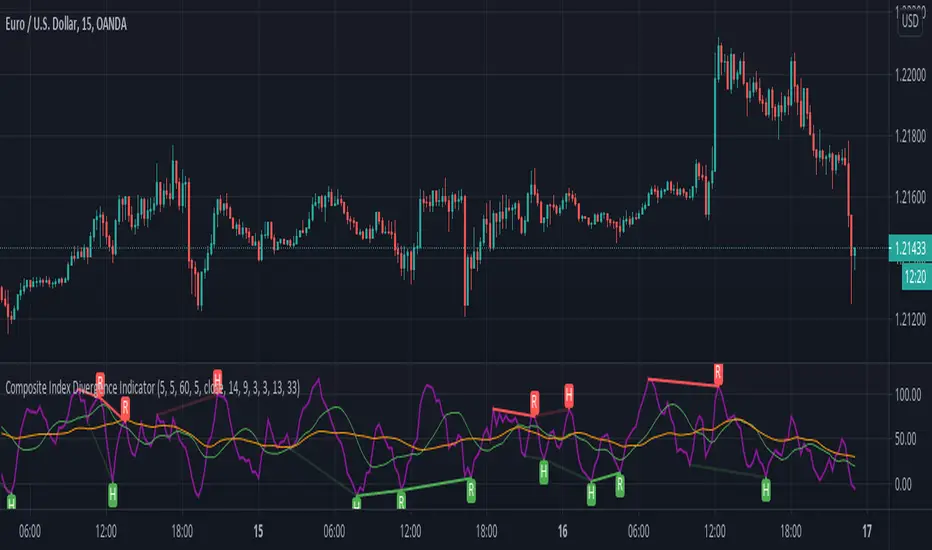
Composite Index Divergence IndicatorComposite Index by Constance Brown mixed with built-ins Divergence Indicator
useful indicator to find divergence
this script find divergence automatically for you
Volume HeatMap Divergence [BigBeluga]🔵 OVERVIEW
The Volume HeatMap Divergence is a smart volume visualization tool that overlays normalized volume data directly on the chart. Using a color heatmap from aqua to red, it transforms raw volume into an intuitive scale — highlighting areas of weak to intense market participation. Additionally, it detects volume-based divergences from price to signal potential reversals or exhaustion zones. Combined with clear visual labeling, this tool empowers traders with actionable volume insights.
🔵 CONCEPTS
Normalized Volume Heatmap : Volume is normalized to a 0–100% scale and visually represented as candles below the chart.
float vol = volume / ta.percentile_nearest_rank(volume, 1000, 100) * 100
Bar Coloring : Price candles are dynamically colored based on volume intensity.
Volume Divergence Logic :
Bullish Divergence : Price forms a lower low, but volume forms a higher low.
Bearish Divergence : Price forms a higher high, but volume forms a lower high.
Dynamic Detection Range : Customizable range ensures divergence signals are meaningful and not random.
Volume Labels : Additional info on divergence bars shows both the actual volume and its normalized % score.
🔵 FEATURES
Volume Heatmap Plot : Normalized volume values colored using a smooth gradient from aqua (low) to red (high).
Price Bar Coloring : Candlesticks on the main chart adopt the same heatmap color based on volume.
Divergence Detection :
Bullish divergence with label and low marker
Bearish divergence with label and high marker
Dual Divergence Labels :
On the volume plot : Direction (Bull/Bear), raw volume, and normalized %
On the price chart : Shape labels showing "Bull" or "Bear" at local highs/lows
Custom Inputs :
Divergence range (min & max), pivot detection distance (left/right)
Toggle to show/hide divergence labels, volume, and % text
Clear Bull/Bear Coloring : Fully customizable label and line colors for both bullish and bearish signals.
🔵 HOW TO USE
Use the indicator as an overlay to monitor real-time volume strength using the heatmap color.
Watch for divergence markers:
Bullish divergence: Candle shows higher volume while price makes a new low
Bearish divergence: Candle shows lower volume while price makes a new high
Use the volume info labels to verify the context of divergence:
Actual volume at divergence candle
Normalized % of that volume compared to past 1000 bars
Adjust pivot sensitivity using "Pivot Left" and "Pivot Right" to tune signal frequency and lag with a right pivot length.
Use divergence zones as early warnings for potential reversals or trend shifts.
Disable or customize labels in settings depending on your charting preferences.
🔵 CONCLUSION
Volume HeatMap Divergence merges heatmap-style volume visualization with intelligent divergence detection — giving traders a clean yet powerful edge. By revealing hidden disconnections between price and participation, it helps users spot exhaustion moves or hidden accumulation zones before the market reacts. Whether you’re a scalper, swing trader, or intraday strategist, this tool offers real-time clarity on who’s in control behind the candles.

MA SLope Potential Divergence - FontiramisuIndicator showing potential momentum divergences on Moving Average's Slope.
The problem with the classic divergence is that when the signal appears, it is sometimes too late to enter a trade .
The potential divergence corrects this problem by signaling the beginning of a potential divergence .
Moving average slope is a momentum indicator that offers relevant insights with divergences
Potential divergences are indicated with the letter B and a red color for Bearish Div or Green color for Bullish Div .
Potential divergence is confirmed when the line and the label "Bear"' or "Bull" appear.
You can either show fast slope's divergences or slow slope's divergences or slow/fast diff's divergences.

Cumulative Volume Delta Divergence [TradingFinder] Periodic EMA🔵 Introduction
The Cumulative Volume Delta (CVD) is a powerful tool in technical analysis that is derived from market volume or trading activity. The Cumulative Volume Delta Divergence Detector Indicator helps traders identify Cumulative Volume Delta Divergences (CVD Divergence), which can provide reliable trading signals.
These divergences, such as bullish and bearish CVD divergences, act as key indicators of potential trend reversals in financial markets. By analyzing CVD divergences, traders can gain insights into the strength of buying and selling pressure and make more informed predictions about price trends.
The CVD indicator is particularly effective for traders who engage in day trading and scalping, as it helps identify price reversal points by analyzing volume and price behavior.
Using the CVD indicator in combination with other technical tools such as support and resistance levels and candlestick patterns allows for a more accurate market analysis.
🔵 How to Use
Divergences are one of the most important technical analysis signals that indicate the current strength of a price move may not be sustainable.
Cumulative Volume Delta Divergence helps traders identify potential trading opportunities that may not be visible on the price chart alone.
This type of divergence examines the relationship between buying and selling volume and price, enabling traders to better understand price trends.
🟣 Bullish CVD Divergence
A bullish CVD divergence occurs when the price makes a lower low, but the CVD indicator shows a higher low. This indicates increasing buying pressure in the market, even though the price is declining. In other words, despite the price dropping, buyers are gradually gaining strength, which could signal a price reversal and the start of a bullish trend.
How to use this signal : In this scenario, traders looking to go long can use this signal as a favorable opportunity to enter the market. After a bullish divergence, the market typically tends to move upward.
To reduce risk, traders can wait for further confirmation from the price chart. For example, if the price breaks through the previous high after the divergence or breaks a resistance level, this could be a more reliable signal for entering the market.
🟣 Bearish CVD Divergence
A bearish CVD divergence is the opposite of a bullish divergence. In this type of divergence, the price makes a higher high, but the CVD indicator shows a lower high. This indicates decreasing buying pressure and weakening momentum in the current bullish trend. A bearish divergence often serves as a warning of a potential market reversal to the downside.
How to use this signal : Traders can use this divergence as an opportunity to exit long positions or enter short positions. When the CVD indicator makes a lower high compared to the price, it signals weakness in buyer strength.
If traders receive further confirmation from the price chart, such as a break of key support levels or an increase in selling volume, this can serve as a stronger signal for the beginning of a bearish trend.
🟣 How to Build a Trading Strategy with Cumulative Volume Delta Divergence
Using CVD divergence alone may not be sufficient. Traders should combine this tool with other technical analysis techniques and indicators to have more confidence in their decisions. For example, when observing a CVD divergence, traders can also analyze volume, trend lines, or candlestick patterns to get a more accurate market analysis.
Additionally, risk management should always be a priority. Using stop-loss orders and properly sizing trades can help traders minimize their losses if they make a mistake.
🔵 Setting
Divergence Fractal Period : Determines the period of swings. The minimum and default value is 2.
CVD Period : You can set the period of " Periodic " and " EMA " modes.
Cumulative Mode : It has three modes "Periodic" and "EMA". In "Periodic" mode, it accumulates the volume periodically and in "EMA" mode, it calculates the moving average of the volume.
Market Ultra Data : If you turn on this feature, 26 large brokers will be included in the calculation of the trading volume. The advantage of this capability is to have more reliable volume data. You should be careful to specify the market you are in, FOREX brokers and Crypto brokers are different.
🔵 Conclusion
The Cumulative Volume Delta (CVD) indicator is a powerful tool in technical analysis, helping traders better identify price trends and make more accurate market predictions. By identifying CVD divergences, traders can anticipate price reversals and time their market entries and exits accordingly.
Bullish and bearish CVD divergences each provide valuable signals that can help traders identify the best entry and exit points in the market. A bullish CVD divergence signals strength in buying that will likely lead to a price increase, while a bearish CVD divergence indicates weakness in the bullish trend and the potential for the beginning of a bearish trend.
Overall, combining CVD with other technical analysis tools and employing risk management strategies can help traders make better trading decisions and capitalize on available market opportunities.

Quarterly Theory ICT 04 [TradingFinder] SSMT 4Quarter Divergence🔵 Introduction
Sequential SMT Divergence is an advanced price-action-based analytical technique rooted in the ICT (Inner Circle Trader) methodology. Its primary objective is to identify early-stage divergences between correlated assets within precise time structures. This tool not only breaks down market structure but also enables traders to detect engineered liquidity traps before the market reacts.
In simple terms, SMT (Smart Money Technique) occurs when two correlated assets—such as indices (ES and NQ), currency pairs (EURUSD and GBPUSD), or commodities (Gold and Silver)—exhibit different reactions at key price levels (swing highs or lows). This lack of alignment is often a sign of smart money manipulation and signals a lack of confirmation in the ongoing trend—hinting at an imminent reversal or at least a pause in momentum.
In its Sequential form, SMT divergences are examined through a more granular temporal lens—between intraday quarters (Q1 through Q4). When SMT appears at the transition from one quarter to another (e.g., Q1 to Q2 or Q3 to Q4), the signal becomes significantly more powerful, often aligning with a critical phase in the Quarterly Theory—a framework that segments market behavior into four distinct phases: Accumulation, Manipulation, Distribution, and Reversal/Continuation.
For instance, a Bullish SMT forms when one asset prints a new low while its correlated counterpart fails to break the corresponding low from the previous quarter. This usually indicates absorption of selling pressure and the beginning of accumulation by smart money. Conversely, a Bearish SMT arises when one asset makes a higher high, but the second asset fails to confirm, signaling distribution or a fake-out before a decline.
However, SMT alone is not enough. To confirm a true Market Structure Break (MSB), the appearance of a Precision Swing Point (PSP) is essential—a specific candlestick formation on a lower timeframe (typically 5 to 15 minutes) that reveals the entry of institutional participants. The combination of SMT and PSP provides a more accurate entry point and better understanding of premium and discount zones.
The Sequential SMT Indicator, introduced in this article, dynamically scans charts for such divergence patterns across multiple sessions. It is applicable to various markets including Forex, crypto, commodities, and indices, and shows particularly strong performance during mid-week sessions (Wednesdays and Thursdays)—when most weekly highs and lows tend to form.
Bullish Sequential SMT :
Bearish Sequential SMT :
🔵 How to Use
The Sequential SMT (SSMT) indicator is designed to detect time and structure-based divergences between two correlated assets. This divergence occurs when both assets print a similar swing (high or low) in the previous quarter (e.g., Q3), but in the current quarter (e.g., Q4), only one asset manages to break that swing level—while the other fails to reach it.
This temporal mismatch is precisely identified by the SSMT indicator and often signals smart money activity, a market phase transition, or even the presence of an engineered liquidity trap. The signal becomes especially powerful when paired with a Precision Swing Point (PSP)—a confirming candle on lower timeframes (5m–15m) that typically indicates a market structure break (MSB) and the entry of smart liquidity.
🟣 Bullish Sequential SMT
In the previous quarter, both assets form a similar swing low.
In the current quarter, one asset (e.g., EURUSD) breaks that low and trades below it.
The other asset (e.g., GBPUSD) fails to reach the same low, preserving the structure.
This time-based divergence reflects declining selling pressure, potential absorption, and often marks the end of a manipulation phase and the start of accumulation. If confirmed by a bullish PSP candle, it offers a strong long opportunity, with stop-losses defined just below the swing low.
🟣 Bearish Sequential SMT
In the previous quarter, both assets form a similar swing high.
In the current quarter, one asset (e.g., NQ) breaks above that high.
The other asset (e.g., ES) fails to reach that high, remaining below it.
This type of divergence signals weakening bullish momentum and the likelihood of distribution or a fake-out before a price drop. When followed by a bearish PSP candle, it sets up a strong shorting opportunity with targets in the discount zone and protective stops placed above the swing high.
🔵 Settings
⚙️ Logical Settings
Quarterly Cycles Type : Select the time segmentation method for SMT analysis.
Available modes include: Yearly, Monthly, Weekly, Daily, 90 Minute, and Micro.
These define how the indicator divides market time into Q1–Q4 cycles.
Symbol : Choose the secondary asset to compare with the main chart asset (e.g., XAUUSD, US100, GBPUSD).
Pivot Period : Sets the sensitivity of the pivot detection algorithm. A smaller value increases responsiveness to price swings.
Activate Max Pivot Back : When enabled, limits the maximum number of past pivots to be considered for divergence detection.
Max Pivot Back Length : Defines how many past pivots can be used (if the above toggle is active).
Pivot Sync Threshold : The maximum allowed difference (in bars) between pivots of the two assets for them to be compared.
Validity Pivot Length : Defines the time window (in bars) during which a divergence remains valid before it's considered outdated.
🎨 Display Settings
Show Cycle :Toggles the visual display of the current Quarter (Q1 to Q4) based on the selected time segmentation
Show Cycle Label : Shows the name (e.g., "Q2") of each detected Quarter on the chart.
Show Bullish SMT Line : Draws a line connecting the bullish divergence points.
Show Bullish SMT Label : Displays a label on the chart when a bullish divergence is detected.
Bullish Color : Sets the color for bullish SMT markers (label, shape, and line).
Show Bearish SMT Line : Draws a line for bearish divergence.
Show Bearish SMT Label : Displays a label when a bearish SMT divergence is found.
Bearish Color : Sets the color for bearish SMT visual elements.
🔔 Alert Settings
Alert Name : Custom name for the alert messages (used in TradingView’s alert system).
Message Frequency :
All: Every signal triggers an alert.
Once Per Bar: Alerts once per bar regardless of how many signals occur.
Per Bar Close: Only triggers when the bar closes and the signal still exists.
Time Zone Display : Choose the time zone in which alert timestamps are displayed (e.g., UTC).
Bullish SMT Divergence Alert : Enable/disable alerts specifically for bullish signals.
Bearish SMT Divergence Alert : Enable/disable alerts specifically for bearish signals
🔵 Conclusion
The Sequential SMT (SSMT) indicator is a powerful and precise tool for identifying structural divergences between correlated assets within a time-based framework. Unlike traditional divergence models that rely solely on sequential pivot comparisons, SSMT leverages Quarterly Theory, in combination with concepts like liquidity sweeps, market structure breaks (MSB) and precision swing points (PSP), to provide a deeper and more actionable view of market dynamics.
By using SSMT, traders gain not only the ability to identify where divergence occurs, but also when it matters most within the market cycle. This empowers them to anticipate major moves or traps before they fully materialize, and position themselves accordingly in high-probability trade zones.
Whether you're trading Forex, crypto, indices, or commodities, the true strength of this indicator is revealed when used in sync with the Accumulation, Manipulation, Distribution, and Reversal phases of the market. Integrated with other confluence tools and market models, SSMT can serve as a core component in a professional, rule-based, and highly personalized trading strategy.

SMT Divergence ICT 01 [TradingFinder] Smart Money Technique🔵 Introduction
SMT Divergence (short for Smart Money Technique Divergence) is a trading technique in the ICT Concepts methodology that focuses on identifying divergences between two positively correlated assets in financial markets.
These divergences occur when two assets that should move in the same direction move in opposite directions. Identifying these divergences can help traders spot potential reversal points and trend changes.
Bullish and Bearish divergences are clearly visible when an asset forms a new high or low, and the correlated asset fails to do so. This technique is applicable in markets like Forex, stocks, and cryptocurrencies, and can be used as a valid signal for deciding when to enter or exit trades.
Bullish SMT Divergence : This type of divergence occurs when one asset forms a higher low while the correlated asset forms a lower low. This divergence is typically a sign of weakness in the downtrend and can act as a signal for a trend reversal to the upside.
Bearish SMT Divergence : This type of divergence occurs when one asset forms a higher high while the correlated asset forms a lower high. This divergence usually indicates weakness in the uptrend and can act as a signal for a trend reversal to the downside.
🔵 How to Use
SMT Divergence is an analytical technique that identifies divergences between two correlated assets in financial markets.
This technique is used when two assets that should move in the same direction move in opposite directions.
Identifying these divergences can help you pinpoint reversal points and trend changes in the market.
🟣 Bullish SMT Divergence
This divergence occurs when one asset forms a higher low while the correlated asset forms a lower low. This divergence indicates weakness in the downtrend and can signal a potential price reversal to the upside.
In this case, when the correlated asset is forming a lower low, and the main asset is moving lower but the correlated asset fails to continue the downward trend, there is a high probability of a trend reversal to the upside.
🟣 Bearish SMT Divergence
Bearish divergence occurs when one asset forms a higher high while the correlated asset forms a lower high. This type of divergence indicates weakness in the uptrend and can signal a potential trend reversal to the downside.
When the correlated asset fails to make a new high, this divergence may be a sign of a trend reversal to the downside.
🟣 Confirming Signals with Correlation
To improve the accuracy of the signals, use assets with strong correlation. Forex pairs like OANDA:EURUSD and OANDA:GBPUSD , or cryptocurrencies like COINBASE:BTCUSD and COINBASE:ETHUSD , or commodities such as gold ( FX:XAUUSD ) and silver ( FX:XAGUSD ) typically have significant correlation. Identifying divergences between these assets can provide a strong signal for a trend change.
🔵 Settings
Second Symbol : This setting allows you to select another asset for comparison with the primary asset. By default, "XAUUSD" (Gold) is set as the second symbol, but you can change it to any currency pair, stock, or cryptocurrency. For example, you can choose currency pairs like EUR/USD or GBP/USD to identify divergences between these two assets.
Divergence Fractal Periods : This parameter defines the number of past candles to consider when identifying divergences. The default value is 2, but you can change it to suit your preferences. This setting allows you to detect divergences more accurately by selecting a greater number of candles.
Bullish Divergence Line : Displays a line showing bullish divergence from the lows.
Bearish Divergence Line : Displays a line showing bearish divergence from the highs.
Bullish Divergence Label : Displays the "+SMT" label for bullish divergences.
Bearish Divergence Label : Displays the "-SMT" label for bearish divergences.
🔵 Conclusion
SMT Divergence is an effective tool for identifying trend changes and reversal points in financial markets based on identifying divergences between two correlated assets. This technique helps traders receive more accurate signals for market entry and exit by analyzing bullish and bearish divergences.
Identifying these divergences can provide opportunities to capitalize on trend changes in Forex, stocks, and cryptocurrency markets. Using SMT Divergence along with risk management and confirming signals with other technical analysis tools can improve the accuracy of trading decisions and reduce risks from sudden market changes.

Ultimate Oscillator + DivergencesUltimate Oscillator (UO) + Divergences + Alerts + Lookback periods.
This version of the Ultimate Oscillator adds the following 3 additional features to the stock UO by Tradingview:
- Optional divergence lines drawn directly onto the oscillator.
- Configurable alerts to notify you when divergences occur.
- Configurable lookback periods to fine tune the divergences drawn in order to suit different trading styles and timeframes.
This indicator adds additional features onto the stock Ultimate Oscillator by Tradingview, whose core calculations remain unchanged. Namely the configurable option to automatically, quickly and clearly draw divergence lines onto the oscillator for you as they occur, with minimal delay. It also has the addition of unique alerts, so you can be notified when divergences occur without spending all day watching the charts. Furthermore, this version of the Ultimate Oscillator comes with configurable lookback periods, which can be configured in order to adjust the sensitivity of the divergences, in order to suit shorter or higher timeframe trading approaches.
The Ultimate Oscillator
Tradingview describes the Ultimate Oscillator as follows:
“The Ultimate Oscillator indicator (UO) indicator is a technical analysis tool used to measure momentum across three varying timeframes. The problem with many momentum oscillators is that after a rapid advance or decline in price, they can form false divergence trading signals. For example, after a rapid rise in price, a bearish divergence signal may present itself, however price continues to rise. The ultimate Oscillator attempts to correct this by using multiple timeframes in its calculation as opposed to just one timeframe which is what is used in most other momentum oscillators.”
More information on the history, use cases and calculations of the Ultimate Oscillator can be found here: www.tradingview.com
What are divergences?
Divergence is when the price of an asset is moving in the opposite direction of a technical indicator, such as an oscillator, or is moving contrary to other data. Divergence warns that the current price trend may be weakening, and in some cases may lead to the price changing direction.
There are 4 main types of divergence, which are split into 2 categories;
regular divergences and hidden divergences . Regular divergences indicate possible trend reversals, and hidden divergences indicate possible trend continuation.
Regular bullish divergence: An indication of a potential trend reversal, from the current downtrend, to an uptrend.
Regular bearish divergence: An indication of a potential trend reversal, from the current uptrend, to a downtrend.
Hidden bullish divergence: An indication of a potential uptrend continuation.
Hidden bearish divergence: An indication of a potential downtrend continuation.
Setting alerts.
With this indicator you can set alerts to notify you when any/all of the above types of divergences occur, on any chart timeframe you choose.
Configurable lookback values.
You can adjust the default lookback values to suit your prefered trading style and timeframe. If you like to trade a shorter time frame, lowering the default lookback values will make the divergences drawn more sensitive to short term price action.
How do traders use divergences in their trading?
A divergence is considered a leading indicator in technical analysis, meaning it has the ability to indicate a potential price move in the short term future.
Hidden bullish and hidden bearish divergences, which indicate a potential continuation of the current trend are sometimes considered a good place for traders to begin, since trend continuation occurs more frequently than reversals, or trend changes.
When trading regular bullish divergences and regular bearish divergences, which are indications of a trend reversal, the probability of it doing so may increase when these occur at a strong support or resistance level. A common mistake new traders make is to get into a regular divergence trade too early, assuming it will immediately reverse, but these can continue to form for some time before the trend eventually changes, by using forms of support or resistance as an added confluence, such as when price reaches a moving average, the success rate when trading these patterns may increase.
Typically, traders will manually draw lines across the swing highs and swing lows of both the price chart and the oscillator to see whether they appear to present a divergence, this indicator will draw them for you, quickly and clearly, and can notify you when they occur.
Disclaimer : This script includes code from the stock UO by Tradingview as well as the RSI divergence indicator.
MACD Potential Divergence - FontiramisuIndicator showing potential momentum divergences on MACD Momentum.
The problem with the classic divergence is that when the signal appears, it is sometimes too late to enter a trade .
The potential divergence corrects this problem by signaling the beginning of a potential divergence .
MACD is a momentum indicator that offers relevant insights with divergences.
Potential divergences are indicated with the letter B and a red color for Bearish Div or Green color for Bullish Div .
Potential divergence is confirmed when the line and the label "Bear"' or "Bull" appear.
Hidden SMT Divergence ICT 01 [TradingFinder] HSMT SMC Technique🔵 Introduction
Hidden SMT Divergence, an advanced concept within the Smart Money Technique (SMT), identifies discrepancies between correlated assets by focusing on their closing prices.
Unlike the standard SMT Divergence, which uses high and low prices for analysis, Hidden SMT Divergence uncovers subtle signals by examining divergences based on the assets' closing values.
These divergences often highlight potential reversals or trend continuations, making this technique a valuable tool for traders aiming to anticipate market movements.
This approach applies across various markets and asset classes, including :
Commodities : CAPITALCOM:GOLD vs. CAPITALCOM:SILVER or BLACKBULL:BRENT vs. BLACKBULL:WTI .
Indices : NASDAQ:NDX vs. TVC:SPX vs. FX:US30 .
FOREX : FX:EURUSD vs. OANDA:GBPUSD vs. TVC:DXY (US Dollar Index).
Cryptocurrencies : BITSTAMP:BTCUSD vs. COINBASE:ETHUSD vs. KUCOIN:SOLUSDT vs. CRYPTOCAP:TOTAL3 .
Volatility Measures : FOREXCOM:XAUUSD vs. TVC:VIX (Volatility Index).
By identifying divergences within these asset groups, traders can gain actionable insights into potential market reversals or shifts in trend direction. Hidden SMT Divergence is particularly effective for pinpointing subtle market signals that traditional methods may overlook.
Bullish Hidden SMT Divergence : This divergence emerges when one asset forms a higher low, while the correlated asset creates a lower low in terms of their closing prices. It often signals weakening downward momentum and a potential reversal to the upside.
Bearish Hidden SMT Divergence : This occurs when one asset establishes a higher high, while the correlated asset forms a lower high based on their closing prices. It typically reflects declining upward momentum and a probable shift to the downside.
🔵 How to Use
The Hidden SMT Divergence indicator provides traders with a systematic approach to identify market reversals or trend continuations through divergences in closing prices between two correlated assets.
🟣 Bullish Hidden SMT Divergence
Bullish Hidden SMT Divergence occurs when the closing price of the primary asset forms a higher low, while the correlated asset creates a lower low. This pattern indicates weakening downward momentum and signals a potential reversal to the upside.
After identifying the divergence, confirm it using additional tools like support levels, volume trends, or indicators such as RSI and MACD. Enter a buy position as the price shows signs of reversal near support zones, ensuring proper risk management by placing a stop-loss below the support level.
Bearish Hidden SMT Divergence
Bearish Hidden SMT Divergence is identified when the closing price of the primary asset forms a higher high, while the correlated asset creates a lower high. This divergence suggests a weakening uptrend and a likely reversal to the downside.
Validate the signal by examining resistance levels, declining volume, or complementary indicators. Consider entering a sell position as the price starts declining from resistance levels, and set a stop-loss above the resistance zone to limit potential losses.
🔵 Setting
Second Symbol : Select the secondary asset to compare with the primary asset. By default, "XAUUSD" (Gold) is used, but it can be customized to any stock, cryptocurrency, or currency pair.
Divergence Fractal Periods : Defines the number of past candles considered for identifying divergences. The default value is 2, but traders can adjust it for greater precision.
Bullish Divergence Line : Displays a dashed line connecting the points of bullish divergence.
Bearish Divergence Line : Shows a similar line for bearish divergence points.
Bullish Divergence Label : Marks areas of bullish divergence with a "+SMT" label.
Bearish Divergence Label : Highlights bearish divergences with a "-SMT" label.
Chart Type : Choose between Line or Candle charts for enhanced visualization.
🔵 Conclusion
Hidden SMT Divergence offers traders a refined method for identifying market reversals by analyzing closing price discrepancies between correlated assets. Its ability to uncover subtle divergences makes it an essential tool for traders who aim to stay ahead of market trends.
By integrating this technique with other technical analysis tools and sound risk management, traders can enhance their decision-making process and capitalize on market opportunities with greater confidence.
Hidden SMT Divergence’s focus on closing prices ensures more precise signals, helping traders refine their strategies across various markets, including Forex, commodities, indices, and cryptocurrencies.
Its open-source nature allows for customization and verification, providing transparency and flexibility to suit diverse trading needs. Hidden SMT Divergence stands as a powerful addition to the arsenal of any trader seeking to unlock hidden opportunities in dynamic financial markets.

Realtime Divergence for Any Indicator - By John BartleThe main purpose of this script is to show historical and real-time divergences for any oscillating indicator. The secondary purpose is to give the user a lot of precise control over identifying divergences and determining what they are. This is an improved version of my other script which is similarly called "Realtime Divergence for Any Indicator"
There are four types of divergences that are offered:
Bull divergence
Hidden bull divergence
Bear divergence
Hidden Bear divergence
There are three types of potential(real-time) divergences which include:
1) Without right side bars for rightside pivots. Plus without waiting for the rightside pivot bar to complete
2) Without right side bars for rightside pivots. Plus with waiting for the rightside pivot bar to complete
3) With right side bars for rightside pivots. Plus without waiting for the rightside pivot right-most bar to complete
A definite divergence occurs when all specified bars are accounted for and fully formed.
Potential divergences use dashed lines and definite(historical) divergences use solid lines.
In addition to several other categories of settings to filter out unwanted divergences or manipulate the search process, this script also offers Alerts. Remember that alerts must not only be set within this scripts settings but also your "Alerts" panel on your right. It's strange but BOTH must be set for alerts to work...
Other interesting Things To Know:
1)I actually don't trade and so I have no need of a paid account. Unpaid accounts don't have the playback feature so I haven't really tested this script out very well. Sorry. Just let me know if something seems off and IF I have time I'll try to fix it.
2)Keep in mind that Pinescript limits the number of lines that can be shown at one time. This means that if your settings allow for a large number of divergence lines they will be removed from the leftward side of your chart but appear in the rightward side.
3) The time and the values for the price or oscillator are not the same things as each other nor are they physical things with physical space. This means that slopes of lines using the time as X and value as Y can not have definite angles. Consequently, under the setting "DIVERGENCES: SLOPE ANGLE EXCLUSION" YOU have to decide what slope equals what angle by using the setting called "Normalization Factor".
4) Remember that some individual settings apply to both the oscillator and price chart. This means that even if the setting's conditions are fulfilled in one they may not be fulfilled in the other.
5) Under the category "DIVERGENCES: INTERSECTION ALLOWANCE", if you set the "Measurement Type" to Relative Percentage then FYI any single given length will equate to an increasingly smaller percentage the further away from zero it is. Because of this, I think "Reletive Percentage" is probably only useful for price charts or oscillators with big values. Maybe >200 is OK ?
Errors:
1) If you get the error mentioning that the script must complete execution within X amount of time, this is because this is a big script and sometimes takes longer than your service plan's allotted time limit. You can just disable some of the settings to reduce the scripts amount of work and time. The biggest time savers will be to disable some lines and labels
2) If you get an error saying the script accessed a negative index(e.g. ) then try temporarily increasing the "Add More Array Elements" setting to 100-200. Sometimes it fixes the problem.
3) You may sometimes temporarily get an error that reads: "Pine cannot determine the referencing length of a series. Try using max_bars_back in the study or strategy function".
If this happens there are several things that you can do:
3A) Create a copy of my script. Then edit the section of code that looks like this ")//, max_bars_back = INSERT_YOUR_QUANTITY_HERE)" and transform it to look like this new code ", max_bars_back = INSERT_YOUR_QUANTITY_HERE)" then repeatedly try replacing "INSERT_YOUR_QUANTITY_HERE" with an increasingly larger number greater than 244 but less than 5000.
This method will increase your system resources and could cause other problems. Try changing the code back after a few hours and see if all is well again. It is a Pinescript limitation issue and happens when certain functions or variables don't get used at least once within the first 244 bars.
3B) Adjust your settings to hopefully find a divergence within the first 244 bars. If one is found then the problematic variables or functions should get used and the Pinescript 244 bar limitation should be temporarily resolved.
3C) Wait for X number of new bars to occur. If a divergence is eventually found within the first 244 bars that should solve the issue.
Tips:
1) If the amount that a setting changes value is undesirable for each time you click it then you can change that amount in the code. To do that, you'll need your own copy of my script. To make your own copy just click on "create a working copy" in the brown colored strip area above the code. Then within approximately the first 108 lines find the title of the setting you want to change. Then look to it's right to find the parameter called "step =". Change what the step equals to whatever you want. FYI, you can hover your mouse over the blue colored code and a popup will tell you what parameters(i.e. settings) that function(e.g. "input.int()") has available.
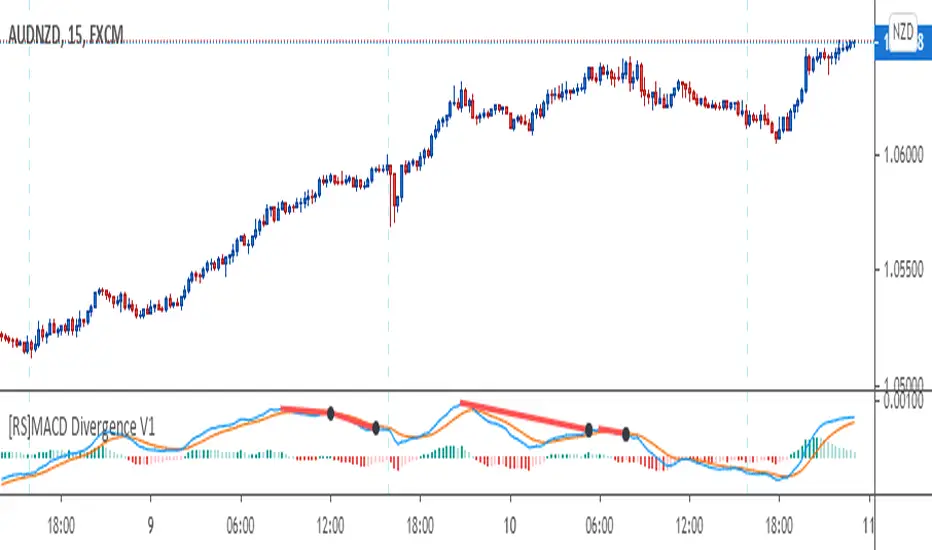
[RS]MACD Divergence V1This oscilator was created by Ricardo Santos using MACD's histogram as the series to find low and high fractals and from there find and plot divergences.
I just modified it a little bit to make it to look more like the MACD public library indicator and use the actual MACD series (instead of the histogram) to find the fractals and from there plot divergences.
I did this to make it easier for me and other fellow students of a Forex school where we use these type of divergences to find patterns.
LB Squeeze Momentum DivergencesThis study tries to highlight LazyBear Squeeze Momentum divergences
as they are defined by
TradingLatino TradingView user
Squeeze momentum green peaks are connected by a line
Associated prices to these green peaks are also connected
If both lines have a different slope orientation
then there is a divergence.
It only shows two last divergence lines and angles.
The original chart screenshot shows some divergence lines
on the top or main chart
these were drawn manually
because you cannot write to two different charts
from the same pine script study (Well, not in August 2020 anyways)
It's aimed at BTCUSDT pair and 4h timeframe.
HOW IT WORKS
Simple geometric mathematics are used
to calculate the two lines degrees
Then both degrees are compared
to show if both lines agree ( // or \\ )
or if they disagree ( /\ or \/ )
SETTINGS
(SQZDiver) Show degrees : Show degrees of each Squeeze Momentum Divergence
lines to the x-axis.
(SQZDiver) Show desviation labels : Whether to show
or not desviation labels for the Squeeze Momentum Divergences.
(SQZDiver) Show desviation lines : Whether to show
or not desviation lines for the Squeeze Momentum Divergences.
(ADX) Smoothing
(ADX) DI Length
(ADX) key level
(ADX) Print : Whether to show
or not scaled ADX line
(SQZMOM) BB Length
(SQZMOM) BB MultFactor
(SQZMOM) KC Length
(SQZMOM) KC MultFactor
(SQZMOM) Use TrueRange (KC)
(SQZMOM) Print : Whether to show
or not Squeeze Momentum indicator.
WARNING
Some securities and timeframes might output degrees
too next to zero.
The code might need to be tweaked to meet your needs.
USAGE
One strategy is to sell when you are in a long entry
when you find out that the price slope is upwards ( / )
while the lb smilb slope is downwards: ( \ )
E.g. You will see:
/
\
on the indicator.
Why?
Because it might signal you that the price is
going to correct downwards soon.
FEEDBACK 1
Please let me know if there is any
other strategy based on the red side of
LB Squeeze Momentum
so that I might add support for it in the future.
FEEDBACK 2
Calculating degrees in a chart
with a different x-axis scale
is a nightmare
that's why I did not a range settings
so that values next to zero are
converted into zero
and thus showing an horizontal line.
Feedback is welcome on this matter.
EXTRA 1
If you turn off showing the divergence lines
and if you turn off showing the divergence labels
you almost get what TradingLatino user uses
as its default momentum indicator.
EXTRA 2
Optionally this indicator can show you
a rescaled ADX (it only works properly on 2020 Bitcoin charts)
ABOUT COLOURS
TradingLatino user has both dark green and light green
inverted compared to this LB SQZMOM chart.
CREDITS
I have reused and adapted some code from
'Squeeze Momentum Indicator' study
which it's from TradingView LazyBear user.
I have reused and adapted some code from
'Directional Movement Index + ADX & Keylevel Support' study
which it's from TradingView console user.

Realtime Divergence for Any IndicatorThis indicator is an addon to any oscillating indicator. It shows divergences. It shows realtime divergences too. Realtime divergences are potential divergences because the actual pivot is not fully formed.
It shows:
Regular Bullish Divergences
Hidden Bullish Divergences
Regular Bearish Divergences
Hidden Bearish Divergences
Reatime divergence lines are dashed lines while non-reatime are solid.
This script also offers a fair bit of control over what you can accept as a legitimate divergence.
Also note that functions tend to not work properly in conditional and loop structures so I couldn't use a lot of functions and consequently my script is really big. Sorry.

eBacktesting - Learning: RSI DivergenceseBacktesting - Learning: RSI Divergences is meant to train your eye to spot when a trend is losing momentum before price fully turns.
How to study it (step-by-step)
1. Start with the trend
- First decide if price is generally trending up or down (higher highs / higher lows vs lower highs / lower lows).
- Divergences matter most after a trend has been running for a while.
2. Look for the “mismatch”
- Bearish divergence: price prints higher highs, but RSI prints lower highs.
- This often shows up near the end of a strong bullish run, when buyers are still pushing price up but with less momentum.
- Bullish divergence: price prints lower lows, but RSI prints higher lows.
- This can show up near the end of a bearish move, when selling pressure is fading.
3. Treat divergence as a warning, not an entry
- The key lesson: divergence often signals trend weakness, not an instant reversal.
- After a divergence appears, study what happens next: stalling, ranging, a pullback, or a full reversal.
4. Add simple confirmation
- Practice waiting for something obvious after the divergence:
a break of a small support/resistance level,
a shift in swing structure,
or a clear rejection candle from a key area.
- This helps you avoid taking every divergence as a trade signal.
5. Use it inside eBacktesting (best practice)
- Replay the chart and pause on each divergence mark.
- Log:
Where it happened (after a long run or in the middle of chop?),
Whether price stalled first or reversed immediately,
What confirmation appeared (if any),
The best “invalidation” idea (what would prove you wrong?).
- Over time you’ll see which divergences are meaningful for your market and session, and which ones are noise.
These indicators are built to pair perfectly with the eBacktesting extension, where traders can practice these concepts step-by-step. Backtesting concepts visually like this is one of the fastest ways to learn, build confidence, and improve trading performance.
Educational use only. Not financial advice.

RSI Cascade DivergencesRSI Cascade Divergences is a tool for detecting divergences between price and RSI with an extended cascade-based strength accumulation logic. A “cascade” represents a sequence of multiple divergences linked through RSI pivot points. The indicator records RSI pivots, checks whether a divergence is present, assigns a strength value to each structure, and displays only signals that meet your minimum strength thresholds.
How Divergence Logic Works
The indicator identifies local RSI extremes (pivots) based on Pivot Length and Pivot Confirm.
For every confirmed pivot it stores:
the RSI value at the pivot,
the corresponding value of the RSI Source price,
the pivot’s bar index.
How a Divergence Is Formed
A divergence is detected when two consecutive RSI pivots of the same type show opposite dynamics relative to the price source defined in RSI Source (default: close), not relative to chart highs/lows.
Bearish divergence: the price source value at the second pivot is higher, but RSI forms a lower high.
Bullish divergence: the price source value at the second pivot is lower, but RSI forms a higher low.
The indicator does not use price highs/lows — only the selected price source at the pivot points.
Cascade Strength Calculation
Each new pivot is compared only with the previous pivot of the same type.
A cascade grows in strength if:
divergence conditions are met,
the difference in RSI values exceeds Min. RSI Distance,
the previous structure already had some strength or the previous pivot was formed in the OB/OS zone.
If the divergence occurs as RSI exits OB/OS, strength is additionally increased by +1.
Behavior in Strong Trends
Divergences may appear repeatedly and even form cascades with high strength. However, if price does not react meaningfully, this indicates strong trend pressure.
In such cases, divergences stop functioning as reversal signals:
RSI attempts to counter-move, but the dominant trend continues.
The indicator accurately reflects this — cascades may form but fail to trigger any reversal, which itself suggests a powerful, persistent trend.
Filtering and Context Reset
To avoid retaining irrelevant pivots:
when RSI is above Overbought → low pivots are cleared;
when RSI is below Oversold → high pivots are cleared.
This prevents false cascades during extreme RSI conditions.
Input Parameters
RSI Source — price source used in RSI calculations (close, hl2, ohlc4, etc.).
RSI Length — RSI calculation period.
Overbought / Oversold — RSI threshold zones.
Pivot Length — number of bars to the left required for a pivot.
Pivot Confirm — bars to the right required to confirm the pivot.
Min. RSI Distance — minimum difference between two pivot RSI values for the divergence to be considered meaningful.
Min. Strength (Bull / Bear) — minimum accumulated strength for:
confirming the signal,
displaying the strength label,
triggering alerts.
Weaker signals below these thresholds appear as dashed guide structures.
Visual
Display settings for lines, markers, and colors.
These parameters do not affect the indicator logic.
Important
Divergences — including cascades — should not be used as a standalone trading signal.
Always combine them with broader market context, trend analysis, structure, volume, and risk management tools.

RSI Divergence (Nikko)RSI Divergence by Nikko
🧠 RSI Divergence Detector — Nikko Edition This script is an enhanced RSI Divergence detector built with Pine Script v6, modified for better visuals and practical usability. It uses linear regression to detect bullish and bearish divergences between the RSI and price action — one of the most reliable early signals in technical analysis.
✅ Improvements from the Original:
- Clean divergence lines using regression fitting.
- Optional label display to reduce clutter (Display Labels toggle).
- Adjustable line thickness (Display Line Width).
- A subtle heatmap background to highlight RSI overbought/oversold zones.
- Uses max accuracy with high calc_bars_count and custom extrapolation window.
🔍 How It Works: The script applies linear regression (least squares method) on both RSI data, and Price (close) data.
It then compares the direction of RSI vs. direction of Price over a set length. If price is making higher highs while RSI makes lower highs, it's a bearish divergence. If price is making lower lows while RSI makes higher lows, it's a bullish divergence. Additional filters (e.g., momentum and slope thresholds) are used to validate only strong divergences.
🔧 Input Parameters: RSI Length: The RSI period (default: 14). RSI Divergence Length: The lookback period for regression (default: 25). Source: Which price data to calculate RSI from (default: close). Display Labels: Show/hide “Bullish” or “Bearish” labels on the chart. Display Line Width: Adjusts how thick the plotted divergence lines appear.
📣 Alerts: Alerts are built-in for both RSI Buy (bullish divergence) and RSI Sell (bearish divergence) so you can use it in automation or notifications.
🚀 Personal Note: I’ve been using this script daily in my own trading, which is why I took time to improve both the logic and visual clarity. If you want a divergence tool that doesn't clutter your chart but gives strong signals, this might be what you're looking for.

Momentum DivergenceOverview
The Momentum Divergence Oscillator is a valuable tool designed for traders who are familiar with basic charting but want to deepen their market insights. This indicator combines a momentum calculation with divergence detection, presenting the data in an intuitive way with a blue momentum line and colored divergence signals ("Bull" and "Bear"). It’s perfect for refining entry and exit points across various timeframes, especially for scalping or swing trading strategies.
Understanding the Concepts
What is Momentum?
Momentum measures the speed and strength of a price movement by comparing the current closing price to a previous close over a set period. In this indicator, it’s calculated as the difference between the current close and the close from a user-defined number of bars ago (default: 10). A rising momentum line indicates accelerating upward momentum, while a falling line suggests slowing momentum or a potential reversal. This helps you gauge whether a trend is gaining power or losing steam, making it a key indicator for spotting overbought or oversold conditions.
What is a Divergence?
A divergence occurs when the price action and the momentum indicator move in opposite directions, often signaling a potential trend reversal. The Momentum Divergence Oscillator highlights two types:
Bullish Divergence: When the price forms a lower low (indicating weakness), but the momentum shows a higher low (suggesting underlying strength). This can foreshadow an upward reversal.
Bearish Divergence: When the price reaches a higher high (showing strength), but the momentum records a lower high (indicating fading momentum). This may hint at an impending downward turn.
How the Indicator Works
The indicator plots a momentum line in a separate pane below your chart, giving you a clear view of price momentum over time. It also scans for divergences using adjustable lookback periods (default: 5 bars left and right) and a range window (default: 5-60 bars) to ensure relevance. When a divergence is detected, it’s visually highlighted, and you can customize the sensitivity through input settings like the momentum length and pivot lookback. Alerts are included to notify you of new divergence signals in real-time, saving you from constant monitoring.
How to Apply It
Identifying Opportunities: Use bullish divergences ("Bull") as a cue to consider long positions, especially when confirmed by support levels or a moving average crossover. Bearish divergences ("Bear") can signal short opportunities, particularly near resistance zones.
Combining with Other Tools: Pair this oscillator with indicators like the Relative Strength Index (RSI) or volume analysis to filter out false signals and increase confidence in your trades. For example, a bullish divergence with rising volume can be a stronger buy signal.
Timeframe Flexibility: Test it on shorter timeframes (e.g., 5-minute charts) for quick scalping trades or longer ones (e.g., 1-hour or 4-hour charts) for swing trading, adjusting the momentum length to suit the market’s pace.
Alert Setup: Enable the built-in alerts to get notified when a divergence forms, allowing you to react promptly without staring at the screen all day.
Strategy Example
Spot a bullish divergence on a 15-minute chart where the price hits a lower low, but the momentum rises.
Confirm with a break above a 20-period EMA and increasing volume.
Enter a long position with a stop-loss below the recent low and a take-profit near the next resistance level.
Customization Tips
Adjust the "Momentum Length" (default: 10) to make the oscillator more or less sensitive—shorter lengths react faster, while longer ones smooth out noise.
Tweak the "Pivot Lookback" settings to widen or narrow the divergence detection range based on your trading style.
Use the "Range Upper/Lower" inputs to focus on divergences within a specific timeframe that matches your strategy.
Important Considerations
b]This indicator is a technical analysis tool, not a guaranteed trading system. Always pair it with a solid strategy and strict risk management, such as setting stop-losses.
In strong trending markets, divergences can sometimes produce false signals. Consider adding a trend filter (e.g., ADX below 25) to avoid whipsaws.
Experiment with the settings on a demo account or backtest to find what works best for your preferred markets and timeframes.

RSI DivergenceWhat is "RSI Divergence"?
"RSI Divergence" is a indicator that find RSI divergence automatically.
What it does?
When it finds an RSI divergence, it draws a line on the indicator.
How it does it?
The lines are found using the least squares method. If the signs of the linear regression on the graph and the linear regression plotted on the RSI are different, this is considered divergence.
How to use it?
RSI lenght = RSI lenght
source = source of RSI
RSI Divergence Lenght = lenght of lines that draws on indicator
zoom = zoom
examples:
