Cari dalam skrip untuk "Divergence"
SteveLeo PPO DivergenceWorks pretty decently as a scalping strategy with 0.25 risk to reward ratio, improves drastically if you combine with other indicators
Credits goes to other PPO divergence indicators, I just recoded this one to be a visual overlay

MACD + RSI TSA simple strategy that use EMAs convergence/divergence and RSI peeks to take position. Fractals are really useful to positioning your stop loss.
It works well on commodities and forex markets.

Reversal Point Dynamics - Machine Learning⇋ Reversal Point Dynamics - Machine Learning
RPD Machine Learning: Self-Adaptive Multi-Armed Bandit Trading System
RPD Machine Learning is an advanced algorithmic trading system that implements genuine machine learning through contextual multi-armed bandits, reinforcement learning, and online adaptation. Unlike traditional indicators that use fixed rules, RPD learns from every trade outcome , automatically discovers which strategies work in current market conditions, and continuously adapts without manual intervention .
Core Innovation: The system deploys six distinct trading policies (ranging from aggressive trend-following to conservative range-bound strategies) and uses LinUCB contextual bandit algorithms with Random Fourier Features to learn which policy performs best in each market regime. After the initial learning phase (50-100 trades), the system achieves autonomous adaptation , automatically shifting between policies as market conditions evolve.
Target Users: Quantitative traders, algorithmic trading developers, systematic traders, and data-driven investors who want a system that adapts over time . Suitable for stocks, futures, forex, and cryptocurrency on any liquid instrument with >100k daily volume.
The Problem This System Solves
Traditional Technical Analysis Limitations
Most trading systems suffer from three fundamental challenges :
Fixed Parameters: Static settings (like "buy when RSI < 30") work well in backtests but may struggle when markets change character. What worked in low-volatility environments may not work in high-volatility regimes.
Strategy Degradation: Manual optimization (curve-fitting) produces systems that perform well on historical data but may underperform in live trading. The system never adapts to new market conditions.
Cognitive Overload: Running multiple strategies simultaneously forces traders to manually decide which one to trust. This leads to hesitation, late entries, and inconsistent execution.
How RPD Machine Learning Addresses These Challenges
Automated Strategy Selection: Instead of requiring you to choose between trend-following and mean-reversion strategies, RPD runs all six policies simultaneously and uses machine learning to automatically select the best one for current conditions. The decision happens algorithmically, removing human hesitation.
Continuous Learning: After every trade, the system updates its understanding of which policies are working. If the market shifts from trending to ranging, RPD automatically detects this through changing performance patterns and adjusts selection accordingly.
Context-Aware Decisions: Unlike simple voting systems that treat all conditions equally, RPD analyzes market context (ADX regime, entropy levels, volatility state, volume patterns, time of day, historical performance) and learns which combinations of context features correlate with policy success.
Machine Learning Architecture: What Makes This "Real" ML
Component 1: Contextual Multi-Armed Bandits (LinUCB)
What Is a Multi-Armed Bandit Problem?
Imagine facing six slot machines, each with unknown payout rates. The exploration-exploitation dilemma asks: Should you keep pulling the machine that's worked well (exploitation) or try others that might be better (exploration)? RPD solves this for trading policies.
Academic Foundation:
RPD implements Linear Upper Confidence Bound (LinUCB) from the research paper "A Contextual-Bandit Approach to Personalized News Article Recommendation" (Li et al., 2010, WWW Conference). This algorithm is used in content recommendation and ad placement systems.
How It Works:
Each policy (AggressiveTrend, ConservativeRange, VolatilityBreakout, etc.) is treated as an "arm." The system maintains:
Reward History: Tracks wins/losses for each policy
Contextual Features: Current market state (8-10 features including ADX, entropy, volatility, volume)
Uncertainty Estimates: Confidence in each policy's performance
UCB Formula: predicted_reward + α × uncertainty
The system selects the policy with highest UCB score , balancing proven performance (predicted_reward) with potential for discovery (uncertainty bonus). Initially, all policies have high uncertainty, so the system explores broadly. After 50-100 trades, uncertainty decreases, and the system focuses on known-performing policies.
Why This Matters:
Traditional systems pick strategies based on historical backtests or user preference. RPD learns from actual outcomes in your specific market, on your timeframe, with your execution characteristics.
Component 2: Random Fourier Features (RFF)
The Non-Linearity Challenge:
Market relationships are often non-linear. High ADX may indicate favorable conditions when volatility is normal, but unfavorable when volatility spikes. Simple linear models struggle to capture these interactions.
Academic Foundation:
RPD implements Random Fourier Features from "Random Features for Large-Scale Kernel Machines" (Rahimi & Recht, 2007, NIPS). This technique approximates kernel methods (like Support Vector Machines) while maintaining computational efficiency for real-time trading.
How It Works:
The system transforms base features (ADX, entropy, volatility, etc.) into a higher-dimensional space using random projections and cosine transformations:
Input: 8 base features
Projection: Through random Gaussian weights
Transformation: cos(W×features + b)
Output: 16 RFF dimensions
This allows the bandit to learn non-linear relationships between market context and policy success. For example: "AggressiveTrend performs well when ADX >25 AND entropy <0.6 AND hour >9" becomes naturally encoded in the RFF space.
Why This Matters:
Without RFF, the system could only learn "this policy has X% historical performance." With RFF, it learns "this policy performs differently in these specific contexts" - enabling more nuanced selection.
Component 3: Reinforcement Learning Stack
Beyond bandits, RPD implements a complete RL framework :
Q-Learning: Value-based RL that learns state-action values. Maps 54 discrete market states (trend×volatility×RSI×volume combinations) to 5 actions (4 policies + no-trade). Updates via Bellman equation after each trade. Converges toward optimal policy after 100-200 trades.
TD(λ) with Eligibility Traces: Extension of Q-Learning that propagates credit backwards through time . When a trade produces an outcome, TD(λ) updates not just the final state-action but all states visited during the trade, weighted by eligibility decay (λ=0.90). This accelerates learning from multi-bar trades.
Policy Gradient (REINFORCE): Learns a stochastic policy directly from 12 continuous market features without discretization. Uses gradient ascent to increase probability of actions that led to positive outcomes. Includes baseline (average reward) for variance reduction.
Meta-Learning: The system learns how to learn by adapting its own learning rates based on feature stability and correlation with outcomes. If a feature (like volume ratio) consistently correlates with success, its learning rate increases. If unstable, rate decreases.
Why This Matters:
Q-Learning provides fast discrete decisions. Policy Gradient handles continuous features. TD(λ) accelerates learning. Meta-learning optimizes the optimization. Together, they create a robust, multi-approach learning system that adapts more quickly than any single algorithm.
Component 4: Policy Momentum Tracking (v2 Feature)
The Recency Challenge:
Standard bandits treat all historical data equally. If a policy performed well historically but struggles in current conditions due to regime shift, the system may be slow to adapt because historical success outweighs recent underperformance.
RPD's Solution:
Each policy maintains a ring buffer of the last 10 outcomes. The system calculates:
Momentum: recent_win_rate - global_win_rate (range: -1 to +1)
Confidence: consistency of recent results (1 - variance)
Policies with positive momentum (recent outperformance) get an exploration bonus. Policies with negative momentum and high confidence (consistent recent underperformance) receive a selection penalty.
Effect: When markets shift, the system detects the shift more quickly through momentum tracking, enabling faster adaptation than standard bandits.
Signal Generation: The Core Algorithm
Multi-Timeframe Fractal Detection
RPD identifies reversal points using three complementary methods :
1. Quantum State Analysis:
Divides price range into discrete states (default: 6 levels)
Peak signals require price in top states (≥ state 5)
Valley signals require price in bottom states (≤ state 1)
Prevents mid-range signals that may struggle in strong trends
2. Fractal Geometry:
Identifies swing highs/lows using configurable fractal strength
Confirms local extremum with neighboring bars
Validates reversal only if price crosses prior extreme
3. Multi-Timeframe Confirmation:
Analyzes higher timeframe (4× default) for alignment
MTF confirmation adds probability bonus
Designed to reduce false signals while preserving valid setups
Probability Scoring System
Each signal receives a dynamic probability score (40-99%) based on:
Base Components:
Trend Strength: EMA(velocity) / ATR × 30 points
Entropy Quality: (1 - entropy) × 10 points
Starting baseline: 40 points
Enhancement Bonuses:
Divergence Detection: +20 points (price/momentum divergence)
RSI Extremes: +8 points (RSI >65 for peaks, <40 for valleys)
Volume Confirmation: +5 points (volume >1.2× average)
Adaptive Momentum: +10 points (strong directional velocity)
MTF Alignment: +12 points (higher timeframe confirms)
Range Factor: (high-low)/ATR × 3 - 1.5 points (volatility adjustment)
Regime Bonus: +8 points (trending ADX >25 with directional agreement)
Penalties:
High Entropy: -5 points (entropy >0.85, chaotic price action)
Consolidation Regime: -10 points (ADX <20, no directional conviction)
Final Score: Clamped to 40-99% range, classified as ELITE (>85%), STRONG (75-85%), GOOD (65-75%), or FAIR (<65%)
Entropy-Based Quality Filter
What Is Entropy?
Entropy measures randomness in price changes . Low entropy indicates orderly, directional moves. High entropy indicates chaotic, unpredictable conditions.
Calculation:
Count up/down price changes over adaptive period
Calculate probability: p = ups / total_changes
Shannon entropy: -p×log(p) - (1-p)×log(1-p)
Normalized to 0-1 range
Application:
Entropy <0.5: Highly ordered (ELITE signals possible)
Entropy 0.5-0.75: Mixed (GOOD signals)
Entropy >0.85: Chaotic (signals blocked or heavily penalized)
Why This Matters:
Prevents trading during choppy, news-driven conditions where technical patterns may be less reliable. Automatically raises quality bar when market is unpredictable.
Regime Detection & Market Microstructure - ADX-Based Regime Classification
RPD uses Wilder's Average Directional Index to classify markets:
Bull Trend: ADX >25, +DI > -DI (directional conviction bullish)
Bear Trend: ADX >25, +DI < -DI (directional conviction bearish)
Consolidation: ADX <20 (no directional conviction)
Transitional: ADX 20-25 (forming direction, ambiguous)
Filter Logic:
Blocks all signals during Transitional regime (avoids trading during uncertain conditions)
Blocks Consolidation signals unless ADX ≥ Min Trend Strength
Adds probability bonus during strong trends (ADX >30)
Effect: Designed to reduce signal frequency while focusing on higher-quality setups.
Divergence Detection
Bearish Divergence:
Price makes higher high
Velocity (price momentum) makes lower high
Indicates weakening upward pressure → SHORT signal quality boost
Bullish Divergence:
Price makes lower low
Velocity makes higher low
Indicates weakening downward pressure → LONG signal quality boost
Bonus: Adds probability points and additional acceleration factor. Divergence signals have historically shown higher success rates in testing.
Hierarchical Policy System - The Six Trading Policies
1. AggressiveTrend (Policy 0):
Probability Threshold: 60% (trades more frequently)
Entropy Threshold: 0.70 (tolerates moderate chaos)
Stop Multiplier: 2.5× ATR (wider stops for trends)
Target Multiplier: 5.0R (larger targets)
Entry Mode: Pyramid (scales into winners)
Best For: Strong trending markets, breakouts, momentum continuation
2. ConservativeRange (Policy 1):
Probability Threshold: 75% (more selective)
Entropy Threshold: 0.60 (requires order)
Stop Multiplier: 1.8× ATR (tighter stops)
Target Multiplier: 3.0R (modest targets)
Entry Mode: Single (one-shot entries)
Best For: Range-bound markets, low volatility, mean reversion
3. VolatilityBreakout (Policy 2):
Probability Threshold: 65% (moderate)
Entropy Threshold: 0.80 (accepts high entropy)
Stop Multiplier: 3.0× ATR (wider stops)
Target Multiplier: 6.0R (larger targets)
Entry Mode: Tiered (splits entry)
Best For: Compression breakouts, post-consolidation moves, gap opens
4. EntropyScalp (Policy 3):
Probability Threshold: 80% (very selective)
Entropy Threshold: 0.40 (requires extreme order)
Stop Multiplier: 1.5× ATR (tightest stops)
Target Multiplier: 2.5R (quick targets)
Entry Mode: Single
Best For: Low-volatility grinding moves, tight ranges, highly predictable patterns
5. DivergenceHunter (Policy 4):
Probability Threshold: 70% (quality-focused)
Entropy Threshold: 0.65 (balanced)
Stop Multiplier: 2.2× ATR (moderate stops)
Target Multiplier: 4.5R (balanced targets)
Entry Mode: Tiered
Best For: Divergence-confirmed reversals, exhaustion moves, trend climax
6. AdaptiveBlend (Policy 5):
Probability Threshold: 68% (balanced)
Entropy Threshold: 0.75 (balanced)
Stop Multiplier: 2.0× ATR (standard)
Target Multiplier: 4.0R (standard)
Entry Mode: Single
Best For: Mixed conditions, general trading, fallback when no clear regime
Policy Clustering (Advanced/Extreme Modes)
Policies are grouped into three clusters based on regime affinity:
Cluster 1 (Trending): AggressiveTrend, DivergenceHunter
High regime affinity (0.8): Performs well when ADX >25
Moderate vol affinity (0.6): Works in various volatility
Cluster 2 (Ranging): ConservativeRange, AdaptiveBlend
Low regime affinity (0.3): Better suited for ADX <20
Low vol affinity (0.4): Optimized for calm markets
Cluster 3 (Breakout): VolatilityBreakout
Moderate regime affinity (0.6): Works in multiple regimes
High vol affinity (0.9): Requires high volatility for optimal characteristics
Hierarchical Selection Process:
Calculate cluster scores based on current regime and volatility
Select best-matching cluster
Run UCB selection within chosen cluster
Apply momentum boost/penalty
This two-stage process reduces learning time - instead of choosing among 6 policies from scratch, system first narrows to 1-2 policies per cluster, then optimizes within cluster.
Risk Management & Position Sizing
Dynamic Kelly Criterion Sizing (Optional)
Traditional Fixed Sizing Challenge:
Using the same position size for all signal probabilities may be suboptimal. Higher-probability signals could justify larger positions, lower-probability signals smaller positions.
Kelly Formula:
f = (p × b - q) / b
Where:
p = win probability (from signal score)
q = loss probability (1 - p)
b = win/loss ratio (average_win / average_loss)
f = fraction of capital to risk
RPD Implementation:
Uses Fractional Kelly (1/4 Kelly default) for safety. Full Kelly is theoretically optimal but can recommend large position sizes. Fractional Kelly reduces volatility while maintaining adaptive sizing benefits.
Enhancements:
Probability Bonus: Normalize(prob, 65, 95) × 0.5 multiplier
Divergence Bonus: Additional sizing on divergence signals
Regime Bonus: Additional sizing during strong trends (ADX >30)
Momentum Adjustment: Hot policies receive sizing boost, cold policies receive reduction
Safety Rails:
Minimum: 1 contract (floor)
Maximum: User-defined cap (default 10 contracts)
Portfolio Heat: Max total risk across all positions (default 4% equity)
Multi-Mode Stop Loss System
ATR Mode (Default):
Stop = entry ± (ATR × base_mult × policy_mult)
Consistent risk sizing
Ignores market structure
Best for: Futures, forex, algorithmic trading
Structural Mode:
Finds swing low (long) or high (short) over last 20 bars
Identifies fractal pivots within lookback
Places stop below/above structure + buffer (0.1× ATR)
Best for: Stocks, instruments that respect structure
Hybrid Mode (Intelligent):
Attempts structural stop first
Falls back to ATR if:
Structural level is invalid (beyond entry)
Structural stop >2× ATR away (too wide)
Best for: Mixed instruments, adaptability
Dynamic Adjustments:
Breakeven: Move stop to entry + 1 tick after 1.0R profit
Trailing: Trail stop 0.8R behind price after 1.5R profit
Timeout: Force close after 30 bars (optional)
Tiered Entry System
Challenge: Equal sizing on all signals may not optimize capital allocation relative to signal quality.
Solution:
Tier 1 (40% of size): Enters immediately on all signals
Tier 2 (60% of size): Enters only if probability ≥ Tier 2 trigger (default 75%)
Example:
Calculated optimal size: 10 contracts
Signal probability: 72%
Tier 2 trigger: 75%
Result: Enter 4 contracts only (Tier 1)
Same signal at 80% probability
Result: Enter 10 contracts (4 Tier 1 + 6 Tier 2)
Effect: Automatically scales size to signal quality, optimizing capital allocation.
Performance Optimization & Learning Curve
Warmup Phase (First 50 Trades)
Purpose: Ensure all policies get tested before system focuses on preferred strategies.
Modifications During Warmup:
Probability thresholds reduced 20% (65% becomes 52%)
Entropy thresholds increased 20% (more permissive)
Exploration rate stays high (30%)
Confidence width (α) doubled (more exploration)
Why This Matters:
Without warmup, system might commit to early-performing policy without testing alternatives. Warmup forces thorough exploration before focusing on best-performing strategies.
Curriculum Learning
Phase 1 (Trades 1-50): Exploration
Warmup active
All policies tested
High exploration (30%)
Learning fundamental patterns
Phase 2 (Trades 50-100): Refinement
Warmup ended, thresholds normalize
Exploration decaying (30% → 15%)
Policy preferences emerging
Meta-learning optimizing
Phase 3 (Trades 100-200): Specialization
Exploration low (15% → 8%)
Clear policy preferences established
Momentum tracking fully active
System focusing on learned patterns
Phase 4 (Trades 200+): Maturity
Exploration minimal (8% → 5%)
Regime-policy relationships learned
Auto-adaptation to market shifts
Stable performance expected
Convergence Indicators
System is learning well when:
Policy switch rate decreasing over time (initially ~50%, should drop to <20%)
Exploration rate decaying smoothly (30% → 5%)
One or two policies emerge with >50% selection frequency
Performance metrics stabilizing over time
Consistent behavior in similar market conditions
System may need adjustment when:
Policy switch rate >40% after 100 trades (excessive exploration)
Exploration rate not decaying (parameter issue)
All policies showing similar selection (not differentiating)
Performance declining despite relaxed thresholds (underlying signal issue)
Highly erratic behavior after learning phase
Advanced Features
Attention Mechanism (Extreme Mode)
Challenge: Not all features are equally important. Trading hour might matter more than price-volume correlation, but standard approaches treat them equally.
Solution:
Each RFF dimension has an importance weight . After each trade:
Calculate correlation: sign(feature - 0.5) × sign(reward)
Update importance: importance += correlation × 0.01
Clamp to range
Effect: Important features get amplified in RFF transformation, less important features get suppressed. System learns which features correlate with successful outcomes.
Temporal Context (Extreme Mode)
Challenge: Current market state alone may be incomplete. Historical context (was volatility rising or falling?) provides additional information.
Solution:
Includes 3-period historical context with exponential decay (0.85):
Current features (weight 1.0)
1 bar ago (weight 0.85)
2 bars ago (weight 0.72)
Effect: Captures momentum and acceleration of market features. System learns patterns like "rising volatility with falling entropy" that may precede significant moves.
Transfer Learning via Episodic Memory
Short-Term Memory (STM):
Last 20 trades
Fast adaptation to immediate regime
High learning rate
Long-Term Memory (LTM):
Condensed historical patterns
Preserved knowledge from past regimes
Low learning rate
Transfer Mechanism:
When STM fills (20 trades), patterns consolidated into LTM . When similar regime recurs later, LTM provides faster adaptation than starting from scratch.
Practical Implementation Guide - Recommended Settings by Instrument
Futures (ES, NQ, CL):
Adaptive Period: 20-25
ML Mode: Advanced
RFF Dimensions: 16
Policies: 6
Base Risk: 1.5%
Stop Mode: ATR or Hybrid
Timeframe: 5-15 min
Forex Majors (EURUSD, GBPUSD):
Adaptive Period: 25-30
ML Mode: Advanced
RFF Dimensions: 16
Policies: 6
Base Risk: 1.0-1.5%
Stop Mode: ATR
Timeframe: 5-30 min
Cryptocurrency (BTC, ETH):
Adaptive Period: 20-25
ML Mode: Extreme (handles non-stationarity)
RFF Dimensions: 32 (captures complexity)
Policies: 6
Base Risk: 1.0% (volatility consideration)
Stop Mode: Hybrid
Timeframe: 15 min - 4 hr
Stocks (Large Cap):
Adaptive Period: 25-30
ML Mode: Advanced
RFF Dimensions: 16
Policies: 5-6
Base Risk: 1.5-2.0%
Stop Mode: Structural or Hybrid
Timeframe: 15 min - Daily
Scaling Strategy
Phase 1 (Testing - First 50 Trades):
Max Contracts: 1-2
Goal: Validate system on your instrument
Monitor: Performance stabilization, learning progress
Phase 2 (Validation - Trades 50-100):
Max Contracts: 2-3
Goal: Confirm learning convergence
Monitor: Policy stability, exploration decay
Phase 3 (Scaling - Trades 100-200):
Max Contracts: 3-5
Enable: Kelly sizing (1/4 Kelly)
Goal: Optimize capital efficiency
Monitor: Risk-adjusted returns
Phase 4 (Full Deployment - Trades 200+):
Max Contracts: 5-10
Enable: Full momentum tracking
Goal: Sustained consistent performance
Monitor: Ongoing adaptation quality
Limitations & Disclaimers
Statistical Limitations
Learning Sample Size: System requires minimum 50-100 trades for basic convergence, 200+ trades for robust learning. Early performance (first 50 trades) may not reflect mature system behavior.
Non-Stationarity Risk: Markets change over time. A system trained on one market regime may need time to adapt when conditions shift (typically 30-50 trades for adjustment).
Overfitting Possibility: With 16-32 RFF dimensions and 6 policies, system has substantial parameter space. Small sample sizes (<200 trades) increase overfitting risk. Mitigated by regularization (λ) and fractional Kelly sizing.
Technical Limitations
Computational Complexity: Extreme mode with 32 RFF dimensions, 6 policies, and full RL stack requires significant computation. May perform slowly on lower-end systems or with many other indicators loaded.
Pine Script Constraints:
No true matrix inversion (uses diagonal approximation for LinUCB)
No cryptographic RNG (uses market data as entropy)
No proper random number generation for RFF (uses deterministic pseudo-random)
These approximations reduce mathematical precision compared to academic implementations but remain functional for trading applications.
Data Requirements: Needs clean OHLCV data. Missing bars, gaps, or low liquidity (<100k daily volume) can degrade signal quality.
Forward-Looking Bias Disclaimer
Reward Calculation Uses Future Data: The RL system evaluates trades using an 8-bar forward-looking window. This means when a position enters at bar 100, the reward calculation considers price movement through bar 108.
Why This is Disclosed:
Entry signals do NOT look ahead - decisions use only data up to entry bar
Forward data used for learning only, not signal generation
In live trading, system learns identically as bars unfold in real-time
Simulates natural learning process (outcomes are only known after trades complete)
Implication: Backtested metrics reflect this 8-bar evaluation window. Live performance may vary if:
- Positions held longer than 8 bars
- Slippage/commissions differ from backtest settings
- Market microstructure changes (wider spreads, different execution quality)
Risk Warnings
No Guarantee of Profit: All trading involves substantial risk of loss. Machine learning systems can fail if market structure fundamentally changes or during unprecedented events.
Maximum Drawdown: With 1.5% base risk and 4% max total risk, expect potential drawdowns. Historical drawdowns do not predict future drawdowns. Extreme market conditions can exceed expectations.
Black Swan Events: System has not been tested under: flash crashes, trading halts, circuit breakers, major geopolitical shocks, or other extreme events. Such events can exceed stop losses and cause significant losses.
Leverage Risk: Futures and forex involve leverage. Adverse moves combined with leverage can result in losses exceeding initial investment. Use appropriate position sizing for your risk tolerance.
System Failures: Code bugs, broker API failures, internet outages, or exchange issues can prevent proper execution. Always monitor automated systems and maintain appropriate safeguards.
Appropriate Use
This System Is:
✅ A machine learning framework for adaptive strategy selection
✅ A signal generation system with probabilistic scoring
✅ A risk management system with dynamic sizing
✅ A learning system designed to adapt over time
This System Is NOT:
❌ A price prediction system (does not forecast exact prices)
❌ A guarantee of profits (can and will experience losses)
❌ A replacement for due diligence (requires monitoring and understanding)
❌ Suitable for complete beginners (requires understanding of ML concepts, risk management, and trading fundamentals)
Recommended Use:
Paper trade for 100 signals before risking capital
Start with minimal position sizing (1-2 contracts) regardless of calculated size
Monitor learning progress via dashboard
Scale gradually over several months only after consistent results
Combine with fundamental analysis and broader market context
Set account-level risk limits (e.g., maximum drawdown threshold)
Never risk more than you can afford to lose
What Makes This System Different
RPD implements academically-derived machine learning algorithms rather than simple mathematical calculations or optimization:
✅ LinUCB Contextual Bandits - Algorithm from WWW 2010 conference (Li et al.)
✅ Random Fourier Features - Kernel approximation from NIPS 2007 (Rahimi & Recht)
✅ Q-Learning, TD(λ), REINFORCE - Standard RL algorithms from Sutton & Barto textbook
✅ Meta-Learning - Learning rate adaptation based on feature correlation
✅ Online Learning - Real-time updates from streaming data
✅ Hierarchical Policies - Two-stage selection with clustering
✅ Momentum Tracking - Recent performance analysis for faster adaptation
✅ Attention Mechanism - Feature importance weighting
✅ Transfer Learning - Episodic memory consolidation
Key Differentiators:
Actually learns from trade outcomes (not just parameter optimization)
Updates model parameters in real-time (true online learning)
Adapts to changing market regimes (not static rules)
Improves over time through reinforcement learning
Implements published ML algorithms with proper citations
Conclusion
RPD Machine Learning represents a different approach from traditional technical analysis to adaptive, self-learning systems . Instead of manually optimizing parameters (which can overfit to historical data), RPD learns behavior patterns from actual trading outcomes in your specific market.
The combination of contextual bandits, reinforcement learning, random fourier features, hierarchical policy selection, and momentum tracking creates a multi-algorithm learning system designed to handle non-stationary markets better than static approaches.
After the initial learning phase (50-100 trades), the system achieves autonomous adaptation - automatically discovering which strategies work in current conditions and shifting allocation without human intervention. This represents an approach where systems adapt over time rather than remaining static.
Use responsibly. Paper trade extensively. Scale gradually. Understand that past performance does not guarantee future results and all trading involves risk of loss.
Taking you to school. — Dskyz, Trade with insight. Trade with anticipation.

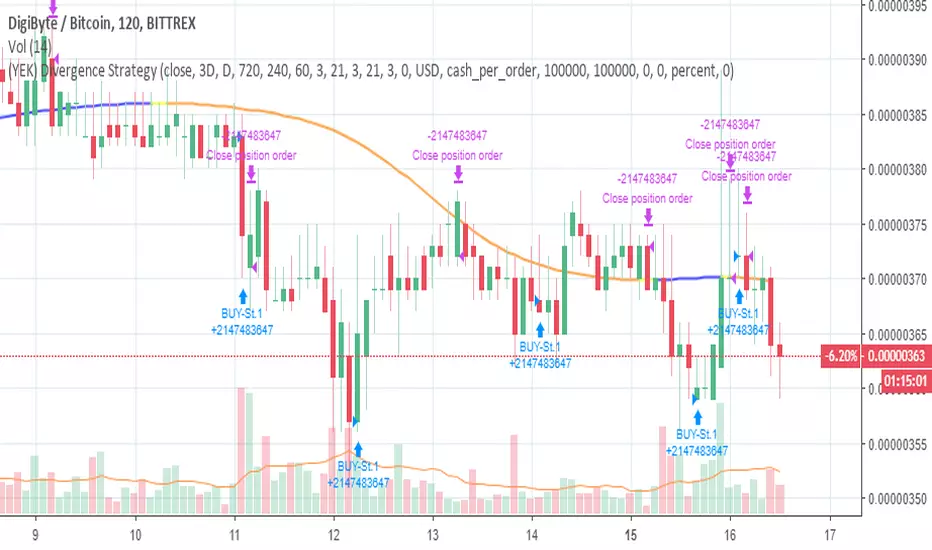
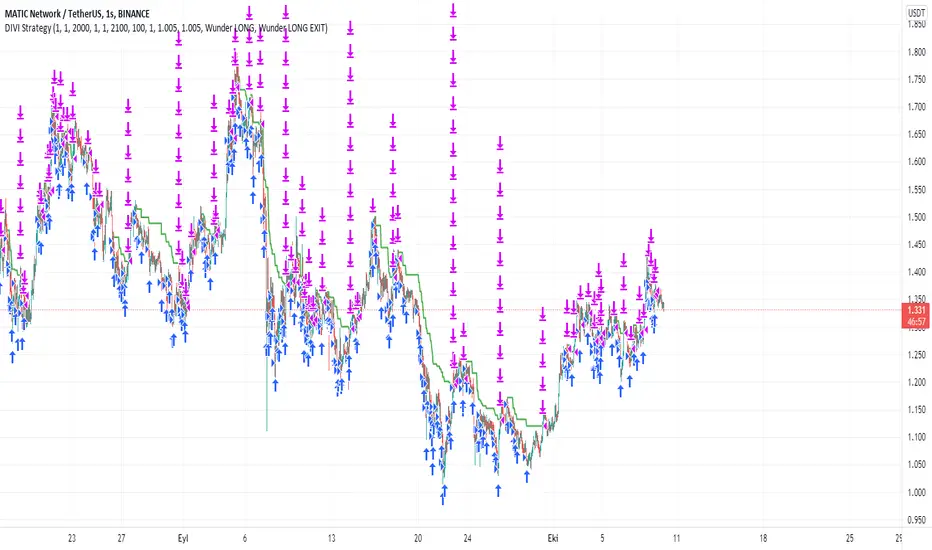
DIVI Wunder StrategyAs it is known, divergence is a situation we encounter very often on graphs. Various divergencies may occur according to many indicators. MACD divergence, RSI divergence... In the strategy I use only positive divergence. What is positive divergence I will explain on MACD positive divergence A MACD positive divergence is a situation in which the MACD does not reach a new low, despite the fact that the price of the stock reached a new low. This is seen as a bullish trading signal—hence, the term “positive divergence.” So I thought of these divergencies and came up with a new strategy. Combining the divergencies with the VOLPIN strategy I wrote earlier, a great strategy has emerged. When the divergence signals are came from MACD,RSI,CCI,OBV,Chaikin Money Flow, VWmacd and Money Flow Index all these indicators I sent a buy signal until the 40 times completed. ThenI sent to sell signal when the price come to take profit level. In this strategy, you divide your principal into as many parts as you want. For example, let's say that you have 1000 dollars of money and you make purchases by dividing this money into 40 equal parts in the default settings of the indicator. $25 per purchase. After each purchase is made as 25 dollars, you can adjust your profit rate from the profit taking settings. When you look at the results of the strategy, your profit rate will be very high. I usually use this strategy in one hour periods. Of course you change it whatever you want. Also change all settings from panel to get more profit. Have fun :)
QuantJazz Turbine Trader BETA v1.17QuantJazz Turbine Trader BETA v1.17 - Strategy Introduction and User Guide
Strategy Introduction
Welcome to the QuantJazz Turbine Trader BETA v1.17, a comprehensive trading strategy designed for TradingView. This strategy is built upon oscillator principles, drawing inspiration from the Turbo Oscillator by RedRox, and incorporates multiple technical analysis concepts including RSI, MFI, Stochastic oscillators, divergence detection, and an optional FRAMA (Fractal Adaptive Moving Average) filter.
The Turbine Trader aims to provide traders with a flexible toolkit for identifying potential entry and exit points in the market. It presents information through a main signal line oscillator, a histogram, and various visual cues like dots, triangles, and divergence lines directly on the indicator panel. The strategy component allows users to define specific conditions based on these visual signals to trigger automated long or short trades within the TradingView environment.
This guide provides an overview of the strategy's components, settings, and usage. Please remember that this is a BETA version (v1.17). While developed with care, it may contain bugs or behave unexpectedly.
LEGAL DISCLAIMER: QuantJazz makes no claims about the fitness or profitability of this tool. Trading involves significant risk, and you may lose all of your invested capital. All trading decisions made using this strategy are solely at the user's discretion and responsibility. Past performance is not indicative of future results. Always conduct thorough backtesting and risk assessment before deploying any trading strategy with real capital.
This work is licensed under Creative Commons Attribution-NonCommercial-ShareAlike 4.0 International.
Core Concepts and Visual Elements
The Turbine Trader indicator displays several components in its own panel below the main price chart:
1. Signal Line (Avg & Avg2): This is the primary oscillator. It's a composite indicator derived from RSI, MFI (Money Flow Index), and Stochastic calculations, smoothed using an EMA (Exponential Moving Average).
Avg: The faster smoothed signal line.
Avg2: The slower smoothed signal line.
Color Coding: The space between Avg and Avg2 is filled. The color (Neon Blue/gColor or Neon Purple/rColor) indicates the trend based on the relationship between Avg and Avg2. Blue suggests bullish momentum (Avg > Avg2), while Purple suggests bearish momentum (Avg2 > Avg).
Zero Line Crosses: Crossovers of the Avg line with the zero level can indicate shifts in momentum.
2. Histogram (resMfi): This histogram is based on smoothed and transformed MFI calculations (Fast MFI and Slow MFI).
Color Coding: Bars are colored Neon Blue (histColorUp) when above zero, suggesting bullish pressure, and Neon Purple (histColorDn) when below zero, suggesting bearish pressure. Transparency is applied.
Zero Line Crosses: Crossovers of the histogram with the zero level can signal potential shifts in money flow.
3. Reversal Points (Dots): Dots appear on the Signal Line (specifically on Avg2) when the color changes (i.e., Avg crosses Avg2).
Small Dots: Appear when a reversal occurs while the oscillator is in an "extreme" zone (below -60 for bullish reversals, above +60 for bearish reversals).
Large Dots: Appear when a reversal occurs outside of these extreme zones.
Colors: Blue (gRdColor) for bullish reversals (Avg crossing above Avg2), Purple (rRdColor) for bearish reversals (Avg crossing below Avg2).
4. Take Profit (TP) Signals (Triangles): Small triangles appear above (+120) or below (-120) the zero line.
Bearish Triangle (Down, Purple rTpColor): Suggests a potential exit point for long positions or an entry point for short positions, based on the oscillator losing upward momentum above the 50 level.
Bullish Triangle (Up, Blue gTpColor): Suggests a potential exit point for short positions or an entry point for long positions, based on the oscillator losing downward momentum below the -50 level.
5. Divergence Lines: The strategy automatically detects and draws potential regular and hidden divergences between the price action (highs/lows) and the Signal Line (Avg).
Regular Bullish Divergence (White bullDivColor line, ⊚︎ label): Price makes a lower low, but the oscillator makes a higher low. Suggests potential bottoming.
Regular Bearish Divergence (White bearDivColor line, ⊚︎ label): Price makes a higher high, but the oscillator makes a lower high. Suggests potential topping.
Hidden Bullish Divergence (bullHidDivColor line, ⊚︎ label): Price makes a higher low, but the oscillator makes a lower low. Suggests potential continuation of an uptrend.
Hidden Bearish Divergence (bearHidDivColor line, ⊚︎ label): Price makes a lower high, but the oscillator makes a higher high. Suggests potential continuation of a downtrend.
Delete Broken Divergence Lines: If enabled, newer divergence lines originating from a similar point will replace older ones.
6. Status Line: A visual bar at the top (95 to 105) and bottom (-95 to -105) of the indicator panel. Its color intensity reflects the confluence of signals:
Score Calculation: +1 if Avg > Avg2, +1 if Avg > 0, +1 if Histogram > 0.
Top Bar (Bullish): Bright Blue (gStatColor) if score is 3, Faded Blue if score is 2, Black otherwise.
Bottom Bar (Bearish): Bright Purple (rStatColor) if score is 0, Faded Purple if score is 1, Black otherwise.
Strategy Settings Explained
The strategy's behavior is controlled via the settings panel (gear icon).
1. Date Range:
Start Date, End Date: Define the period for backtesting. Trades will only occur within this range.
2. Optional Webhook Configuration: (For Automation)
3C Email Token, 3C Bot ID: Enter your 3Commas API credentials if you plan to automate trading using webhooks. The strategy generates JSON alert messages compatible with 3Commas. You can go ahead and just leave the text field as defaulted, "TOKEN HERE" / "BOT ID HERE" if not using any bot automations at this time. You can always come back later and automate it. More info can be made available from QuantJazz should you need automation assistance with custom indicators and trading strategies.
3. 🚀 Signal Line:
Turn On/Off: Show or hide the main signal lines (Avg, Avg2).
gColor, rColor: Set the colors for bullish and bearish signal line states.
Length (RSI): The lookback period for the internal RSI calculation. Default is 2.
Smooth (EMA): The smoothing period for the EMAs applied to the composite signal. Default is 9.
RSI Source: The price source used for RSI calculation (default: close).
4. 📊 Histogram:
Turn On/Off: Show or hide the histogram.
histColorUp, histColorDn: Set the colors for positive and negative histogram bars.
Length (MFI): The base lookback period for MFI calculations. Default is 5. Fast and Slow MFI lengths are derived from this.
Smooth: Smoothing period for the final histogram output. Default is 1 (minimal smoothing).
5.💡 Other:
Show Divergence Line: Toggle visibility of regular divergence lines.
bullDivColor, bearDivColor: Colors for regular divergence lines.
Show Hidden Divergence: Toggle visibility of hidden divergence lines.
bullHidDivColor, bearHidDivColor: Colors for hidden divergence lines.
Show Status Line: Toggle visibility of the top/bottom status bars.
gStatColor, rStatColor: Colors for the status line bars.
Show TP Signal: Toggle visibility of the TP triangles.
gTpColor, rTpColor: Colors for the TP triangles.
Show Reversal points: Toggle visibility of the small/large dots on the signal line.
gRdColor, rRdColor: Colors for the reversal dots.
Delete Broken Divergence Lines: Enable/disable automatic cleanup of older divergence lines.
6. ⚙️ Strategy Inputs: (CRITICAL for Trade Logic)
This section defines which visual signals trigger trades. Each signal (Small/Large Dots, TP Triangles, Bright Bars, Signal/Histogram Crosses, Signal/Histogram Max/Min, Divergences) has a dropdown menu:
Long: This signal can trigger a long entry.
Short: This signal can trigger a short entry.
Disabled: This signal will not trigger any entry.
Must Be True Checkbox: If checked for a specific signal, that signal's condition must be met for any trade (long or short, depending on the dropdown selection for that signal) to be considered. Multiple "Must Be True" conditions act as AND logic – all must be true simultaneously.
How it Works:
The strategy first checks if all conditions marked as "Must Be True" (for the relevant trade direction - long or short) are met.
If all "Must Be True" conditions are met, it then checks if at least one of the conditions not marked as "Must Be True" (and set to "Long" or "Short" respectively) is also met.
If both steps pass, and other filters (like Date Range, FRAMA) allow, an entry order is placed.
Example: If "Large Bullish Dot" is set to "Long" and "Must Be True" is checked, AND "Bullish Divergence" is set to "Long" but "Must Be True" is not checked: A long entry requires BOTH the Large Bullish Dot AND the Bullish Divergence to occur simultaneously. If "Large Bullish Dot" was "Long" but not "Must Be True", then EITHER a Large Bullish Dot OR a Bullish Divergence could trigger a long entry (assuming no other "Must Be True" conditions are active).
Note: By default, the strategy is configured for long-only trades (strategy.risk.allow_entry_in(strategy.direction.long)). To enable short trades, you would need to comment out or remove this line in the Pine Script code and configure the "Strategy Inputs" accordingly.
7. 💰 Take Profit Settings:
Take Profit 1/2/3 (%): The percentage above the entry price (for longs) or below (for shorts) where each TP level is set. (e.g., 1.0 means 1% profit).
TP1/2/3 Percentage: The percentage of the currently open position to close when the corresponding TP level is hit. The percentages should ideally sum to 100% if you intend to close the entire position across the TPs.
Trailing Stop (%): The percentage below the highest high (for longs) or above the lowest low (for shorts) reached after the activation threshold, where the stop loss will trail.
Trailing Stop Activation (%): The minimum profit percentage the trade must reach before the trailing stop becomes active.
Re-entry Delay (Bars): The minimum number of bars to wait after a TP is hit before considering a re-entry. Default is 1 (allows immediate re-entry on the next bar if conditions met).
Re-entry Price Offset (%): The percentage the price must move beyond the previous TP level before a re-entry is allowed. This prevents immediate re-entry if the price hovers around the TP level.
8. 📈 FRAMA Filter: (Optional Trend Filter)
Use FRAMA Filter: Enable or disable the filter.
FRAMA Source, FRAMA Period, FRAMA Fast MA, FRAMA Slow MA: Parameters for the FRAMA calculation. Defaults provided are common starting points.
FRAMA Filter Type:
FRAMA > previous bars: Allows trades only if FRAMA is significantly above its recent average (defined by FRAMA Percentage and FRAMA Lookback). Typically used to confirm strong upward trends for longs.
FRAMA < price: Allows trades only if FRAMA is below the current price (framaSource). Can act as a baseline trend filter.
FRAMA Percentage (X), FRAMA Lookback (Y): Used only for the FRAMA > previous bars filter type.
How it Affects Trades: If Use FRAMA Filter is enabled:
Long entries require the FRAMA filter condition to be true.
Short entries require the FRAMA filter condition to be false (as currently coded, this acts as an inverse filter for shorts if enabled).
How to Use the Strategy
1. Apply to Chart: Open your desired chart on TradingView. Click "Indicators", find "QuantJazz Turbine Trader BETA v1.17" (you might need to add it via Invite-only scripts or if published publicly), and add it to your chart. The oscillator appears below the price chart, and the strategy tester panel opens at the bottom.
2. Configure Strategy Properties: In the Pine Script code itself (or potentially via the UI if supported), adjust the strategy() function parameters like initial_capital, default_qty_value, commission_value, slippage, etc., to match your account, broker fees, and risk settings. The user preferences provided (e.g., 1000 initial capital, 0.1% commission) are examples. Remember use_bar_magnifier is false by default in v1.17.
3. Configure Inputs (Settings Panel):
Set the Date Range for backtesting.
Crucially, configure the ⚙️ Strategy Inputs. Decide which signals should trigger entries and whether they are mandatory ("Must Be True"). Start simply, perhaps enabling only one or two signals initially, and test thoroughly. Remember the default long-only setting unless you modify the code.
Set up your 💰 Take Profit Settings, including TP levels, position size percentages for each TP, and the trailing stop parameters. Decide if you want to use the re-entry feature.
Decide whether to use the 📈 FRAMA Filter and configure its parameters if enabled.
Adjust visual elements (🚀 Signal Line, 📊 Histogram, 💡 Other) as needed for clarity.
4. Backtest: Use the Strategy Tester panel in TradingView. Analyze the performance metrics (Net Profit, Max Drawdown, Profit Factor, Win Rate, Trade List) across different assets, timeframes, and setting configurations. Pay close attention to how different "Strategy Inputs" combinations perform.
5. Refine: Based on backtesting results, adjust the input settings, TP/SL strategy, and signal combinations to optimize performance for your chosen market and timeframe, while being mindful of overfitting.
6. Automation (Optional): If using 3Commas or a similar platform:
Enter your 3C Email Token and 3C Bot ID in the settings.
Create alerts in TradingView (right-click on the chart or use the Alert panel).
Set the Condition to "QuantJazz Turbine Trader BETA v1.17".
In the "Message" box, paste the corresponding placeholder, which will pass the message in JSON from our custom code to TradingView to pass through your webhook: {{strategy.order.alert_message}}.
In the next tab, configure the Webhook URL provided by your automation platform. Put a Whale sound, while you're at it! 🐳
When an alert triggers, TradingView will send the pre-formatted JSON message from the strategy code to your webhook URL.
Final Notes
The QuantJazz Turbine Trader BETA v1.17 offers a wide range of customizable signals and strategy logic. Its effectiveness heavily depends on proper configuration and thorough backtesting specific to the traded asset and timeframe. Start with the default settings, understand each component, and methodically test different combinations of signals and parameters. Remember the inherent risks of trading and never invest capital you cannot afford to lose.

The Ultimate Backtest - Fontiramisu█ OVERVIEW
The Ultimate Backtest allows you to create an infinite number of trading strategies and backtest them easily and quickly.
You can leverage the trading setup you created with the tradingview's real-time alert system.
The tool is constantly being improved to accommodate more in-house indicators in order to imagine more trading strategies.
█ HOW IT WORKS.
The tool is divided into 3 main parts:
1. The indicators:
These are the indicators that you will be able to set up to create your setups.
Example: rsi, exponential moving average, home made resistance/support indicator etc.
We are working to add more and more in-house indicators to multiply the trading strategies.
2. The entry/exit strategy:
The entry/exit trades management is a central point of the strategy.
Here we propose several ways to take profits and in-house optimizations to enter a position.
3. The setup: the combination of indicators
Here it is up to you to create your own recipe.
You combine the different indicators set up above to make a real strategy.
Example: RSI Divergence + Location on a support.
Let's look at this in more detail.
Below is a description of all sections
█ 1. THE INDICATORS
TREND: MA (moving average) -->
Set up a moving average from multiple methods (sma, ema, smma...) of the type and length you want.
> A long is taken if the price is above the MA.
> A short is taken if the price comes below the MA.
You can set up a smoothing MA from the existing moving average and use it in the same way.
ENVELOPE: SUPER TREND -->
The supertrend is a trend following indicator. It clearly describes the distinction between downtrends and uptrends with a red or green direction. It is calculated according to the ATR and a factor.
> A long is taken when the direction is green and the price touches the supertrend support line.
> A short is taken when the direction is red and the price touches the supertrend resistance line.
ENVELOPE: BOLLINGER BAND -->
Bollinger bands are used to evaluate the volatility and probable evolution of prices, here we exploit the envelope
> A long is taken if the price crosses the lower band.
> A short is taken if the price crosses the upper band.
CLOUD: ICHIMOKU -->
The Ichimoku cloud aims to identify the direction and reversal points of dominant market trends. It displays support and resistance levels.
> A long is taken when the price enters the green ichimoku cloud.
> A short is taken when the price enters the red ichimoku cloud.
MOMENTUM: MACD ZERO LAG / MACD / RSI -->
RSI (Relative Strength Index) reflects the relative strength of upward movements, compared to downward movements.
MACD (Moving Average Convergence Divergence) is a momentum indicator that follows the trend and shows the correlation between two moving averages of the asset price.
MACD ZERO LAG is calculated in the same way except that the exponential moving averages that make up the calculation do not lag.
> A long is taken on a potential bullish divergence.
> A short is taken on a potential bearish divergence.
For now, with these indicators, we only take a trade based on divergences but we will add overbuy/oversell etc.
MOMENTUM: MA SLOPE -->
This house indicator allows you to use the slope of a moving average as a measure of momentum.
Define the length of the moving average whose slope we will take.
We then take a fast ma of the slope then a slow ma (You define the lengths with the parameters)
The tool foresees a subtraction between the slow and fast ma to have another interpretation of the slope.
This indicator is available and can be viewed freely on my tradingview profile.
> A long is taken when there is a potential bullish divergence on the fast/slow MA or the difference.
> A short is taken when there is a potential bear divergence on the fast/slow MA or the difference.
RESISTANCE: R/S FONTIRAMISU -->
An in-house indicator that shows resistances and supports according to the chosen parameters.
Indicator available and can be viewed freely on my tradingview profile.
> A long is taken when the price arrives on a support.
> A short is taken when the price arrives on a resistance.
-----
MOMENTUM DIVERGENCE -->
Section used to set the divergence detection.
The first field allows you to select which momentum you want to calculate the divergence on.
PIVOT DETECTION -->
Used to calculate top and dip on the chart, it is used with divergences/resistances/enter-exit optimizations....
Default parameters are: Deviation: 2.5, Depth: 10.
█ 2. STRATEGY FOR ENTERING/EXITING TRADES.
STRATEGY: TP/SL -->
Enter/Exit Trade Mode" field: The first field allows you to choose between two modes:
1. TP/SL Mode:
This mode allows you to take entries with take profits that you define afterwards with the TP1 and TP2 parameters .
> The stop loss is calculated automatically by taking the last dip if it is a long and the last top if it is a short.
> You can add a "Stop Loss % Offset" which will increase the size of the stop loss by the % value you set.
> If you activate TP2, the profit taking is split between TP1 and TP2, you can select the percentage of profit taking split between TP1 and TP2 via the "Percent Exit Profit TP1" field.
> The "TPX Multiplier" fields allow you to define the desired Risk Reward, if = 1 then RR = 1/1.
> A Trailing stop option is available, if active then the profit take will be split between TP1 and Trailing stop.
For the moment you can choose between the two MA's set up above to serve as trailing stop:
> In long, if the price goes below the MA then you take the profit (or the loss)
> In short, if the price goes above the MA then you take the profit (or the loss)
2. ONLY BUY/SELL:
Here the take profits are not taken into account, we only have an alternation between the long and the shorts.
The trailing stop applies to this mode and can be interesting depending on the use.
STRATEGY: SETUP OPTIMIZER (FP) -->
Here we have 3 home made optimization tools to take more relevant trades.
1. FAVORABLE ENTRY FROM PIVOT.
Here the tool will favor entries with interesting locations depending on dips and tops before.
A red cross with "FP" will appear on the chart each time a trade does not meet this condition.
2.STOP LOSS MAX (SL).
Will only take trades where the stop loss is maximum at X%.
A red cross with "%SL" will appear on the chart each time a trade does not meet this condition.
3. MOVE ALREADY TRADED.
Will not take several trades in the same move.
This can avoid cascading losing trades on some setups.
A red cross with "MT" will appear on the chart each time a trade does not meet this condition.
█ 3. THE SETUP: THE COMBINATION OF INDICATORS
Here, let your creativity speak.
You are free to assemble the indicators in the following way:
The conditions defined inside a group (group1/group2/group3) are combined to each other via an OR operator .
Example, if "cond01 = Momentum DIv" and "cond02 = Res/Sup Location", then trades will be triggered if one of the two conditions is met.
The conditions defined between several groups are multiplied via the AND operator .
Example, if "cond01 = Momentum DIv" and "cond12 = Res/Sup Location", then trades are taken if both conditions are met at the same time.
ALL CONDITIONS:
> NONE
No conditions selected.
> Momentum Div
Triggers when a potential divergence occurs on the selected momentum (in the divergence section).
> Momentum Div UT Sup
Triggers when a potential divergence occurs on the selected momentum (in the divergence section) in the upper timeframe.
The upper timeframe of the momentum is calculated directly in the code by multiplying the set parameters by 4 (fastlenght/slowlenght...).
> Multi MA
It is set in the "Trend: MA" section and is triggered by the conditions mentioned in the "INDICATORS" section.
> Smooting MA
Is set in the "Trend: MA" section and is triggered by the conditions mentioned in the "INDICATORS" section.
> Super Trend Env
Is set in the "ENVELOPE: SUPER TREND" section and is triggered by the conditions mentioned in the "INDICATORS" section.
> BB Env
It is set in the "ENVELOPE: BOLLINGER BAND" section and is triggered by the conditions mentioned in the "INDICATORS" section.
> Ichimoku Cloud
Is set in the "CLOUD: ICHIMOKU" section and is triggered by the conditions mentioned in the "INDICATORS" section.
> Res/Sup Location
Is set in the "RESISTANCE: R/S" section and is triggered by the conditions mentioned in the "INDICATORS" section.

Ruckard TradingLatinoThis strategy tries to mimic TradingLatino strategy.
The current implementation is beta.
Si hablas castellano o espanyol por favor consulta MENSAJE EN CASTELLANO más abajo.
It's aimed at BTCUSDT pair and 4h timeframe.
STRATEGY DEFAULT SETTINGS EXPLANATION
max_bars_back=5000 : This is a random number of bars so that the strategy test lasts for one or two years
calc_on_order_fills=false : To wait for the 4h closing is too much. Try to check if it's worth entering a position after closing one. I finally decided not to recheck if it's worth entering after an order is closed. So it is false.
calc_on_every_tick=false
pyramiding=0 : We only want one entry allowed in the same direction. And we don't want the order to scale by error.
initial_capital=1000 : These are 1000 USDT. By using 1% maximum loss per trade and 7% as a default stop loss by using 1000 USDT at 12000 USDT per BTC price you would entry with around 142 USDT which are converted into: 0.010 BTC . The maximum number of decimal for contracts on this BTCUSDT market is 3 decimals. E.g. the minimum might be: 0.001 BTC . So, this minimal 1000 amount ensures us not to entry with less than 0.001 entries which might have happened when using 100 USDT as an initial capital.
slippage=1 : Binance BTCUSDT mintick is: 0.01. Binance slippage: 0.1 % (Let's assume). TV has an integer slippage. It does not have a percentage based slippage. If we assume a 1000 initial capital, the recommended equity is 142 which at 11996 USDT per BTC price means: 0.011 BTC. The 0.1% slippage of: 0.011 BTC would be: 0.000011 . This is way smaller than the mintick. So our slippage is going to be 1. E.g. 1 (slippage) * 0.01 (mintick)
commission_type=strategy.commission.percent and commission_value=0.1 : According to: binance . com / en / fee / schedule in VIP 0 level both maker and taker fees are: 0.1 %.
BACKGROUND
Jaime Merino is a well known Youtuber focused on crypto trading
His channel TradingLatino
features monday to friday videos where he explains his strategy.
JAIME MERINO STANCE ON BOTS
Jaime Merino stance on bots (taken from memory out of a 2020 June video from him):
'~
You know. They can program you a bot and it might work.
But, there are some special situations that the bot would not be able to handle.
And, I, as a human, I would handle it. And the bot wouldn't do it.
~'
My long term target with this strategy script is add as many
special situations as I can to the script
so that it can match Jaime Merino behaviour even in non normal circumstances.
My alternate target is learn Pine script
and enjoy programming with it.
WARNING
This script might be bigger than other TradingView scripts.
However, please, do not be confused because the current status is beta.
This script has not been tested with real money.
This is NOT an official strategy from Jaime Merino.
This is NOT an official strategy from TradingLatino . net .
HOW IT WORKS
It basically uses ADX slope and LazyBear's Squeeze Momentum Indicator
to make its buy and sell decisions.
Fast paced EMA being bigger than slow paced EMA
(on higher timeframe) advices going long.
Fast paced EMA being smaller than slow paced EMA
(on higher timeframe) advices going short.
It finally add many substrats that TradingLatino uses.
SETTINGS
__ SETTINGS - Basics
____ SETTINGS - Basics - ADX
(ADX) Smoothing {14}
(ADX) DI Length {14}
(ADX) key level {23}
____ SETTINGS - Basics - LazyBear Squeeze Momentum
(SQZMOM) BB Length {20}
(SQZMOM) BB MultFactor {2.0}
(SQZMOM) KC Length {20}
(SQZMOM) KC MultFactor {1.5}
(SQZMOM) Use TrueRange (KC) {True}
____ SETTINGS - Basics - EMAs
(EMAS) EMA10 - Length {10}
(EMAS) EMA10 - Source {close}
(EMAS) EMA55 - Length {55}
(EMAS) EMA55 - Source {close}
____ SETTINGS - Volume Profile
Lowest and highest VPoC from last three days
is used to know if an entry has a support
VPVR of last 100 4h bars
is also taken into account
(VP) Use number of bars (not VP timeframe): Uses 'Number of bars {100}' setting instead of 'Volume Profile timeframe' setting for calculating session VPoC
(VP) Show tick difference from current price {False}: BETA . Might be useful for actions some day.
(VP) Number of bars {100}: If 'Use number of bars (not VP timeframe)' is turned on this setting is used to calculate session VPoC.
(VP) Volume Profile timeframe {1 day}: If 'Use number of bars (not VP timeframe)' is turned off this setting is used to calculate session VPoC.
(VP) Row width multiplier {0.6}: Adjust how the extra Volume Profile bars are shown in the chart.
(VP) Resistances prices number of decimal digits : Round Volume Profile bars label numbers so that they don't have so many decimals.
(VP) Number of bars for bottom VPOC {18}: 18 bars equals 3 days in suggested timeframe of 4 hours. It's used to calculate lowest session VPoC from previous three days. It's also used as a top VPOC for sells.
(VP) Ignore VPOC bottom advice on long {False}: If turned on it ignores bottom VPOC (or top VPOC on sells) when evaluating if a buy entry is worth it.
(VP) Number of bars for VPVR VPOC {100}: Number of bars to calculate the VPVR VPoC. We use 100 as Jaime once used. When the price bounces back to the EMA55 it might just bounce to this VPVR VPoC if its price it's lower than the EMA55 (Sells have inverse algorithm).
____ SETTINGS - ADX Slope
ADX Slope
help us to understand if ADX
has a positive slope, negative slope
or it is rather still.
(ADXSLOPE) ADX cut {23}: If ADX value is greater than this cut (23) then ADX has strength
(ADXSLOPE) ADX minimum steepness entry {45}: ADX slope needs to be 45 degrees to be considered as a positive one.
(ADXSLOPE) ADX minimum steepness exit {45}: ADX slope needs to be -45 degrees to be considered as a negative one.
(ADXSLOPE) ADX steepness periods {3}: In order to avoid false detection the slope is calculated along 3 periods.
____ SETTINGS - Next to EMA55
(NEXTEMA55) EMA10 to EMA55 bounce back percentage {80}: EMA10 might bounce back to EMA55 or maybe to 80% of its complete way to EMA55
(NEXTEMA55) Next to EMA55 percentage {15}: How much next to the EMA55 you need to be to consider it's going to bounce back upwards again.
____ SETTINGS - Stop Loss and Take Profit
You can set a default stop loss or a default take profit.
(STOPTAKE) Stop Loss % {7.0}
(STOPTAKE) Take Profit % {2.0}
____ SETTINGS - Trailing Take Profit
You can customize the default trailing take profit values
(TRAILING) Trailing Take Profit (%) {1.0}: Trailing take profit offset in percentage
(TRAILING) Trailing Take Profit Trigger (%) {2.0}: When 2.0% of benefit is reached then activate the trailing take profit.
____ SETTINGS - MAIN TURN ON/OFF OPTIONS
(EMAS) Ignore advice based on emas {false}.
(EMAS) Ignore advice based on emas (On closing long signal) {False}: Ignore advice based on emas but only when deciding to close a buy entry.
(SQZMOM) Ignore advice based on SQZMOM {false}: Ignores advice based on SQZMOM indicator.
(ADXSLOPE) Ignore advice based on ADX positive slope {false}
(ADXSLOPE) Ignore advice based on ADX cut (23) {true}
(STOPTAKE) Take Profit? {false}: Enables simple Take Profit.
(STOPTAKE) Stop Loss? {True}: Enables simple Stop Loss.
(TRAILING) Enable Trailing Take Profit (%) {True}: Enables Trailing Take Profit.
____ SETTINGS - Strategy mode
(STRAT) Type Strategy: 'Long and Short', 'Long Only' or 'Short Only'. Default: 'Long and Short'.
____ SETTINGS - Risk Management
(RISKM) Risk Management Type: 'Safe', 'Somewhat safe compound' or 'Unsafe compound'. ' Safe ': Calculations are always done with the initial capital (1000) in mind. The maximum losses per trade/day/week/month are taken into account. ' Somewhat safe compound ': Calculations are done with initial capital (1000) or a higher capital if it increases. The maximum losses per trade/day/week/month are taken into account. ' Unsafe compound ': In each order all the current capital is gambled and only the default stop loss per order is taken into account. That means that the maximum losses per trade/day/week/month are not taken into account. Default : 'Somewhat safe compound'.
(RISKM) Maximum loss per trade % {1.0}.
(RISKM) Maximum loss per day % {6.0}.
(RISKM) Maximum loss per week % {8.0}.
(RISKM) Maximum loss per month % {10.0}.
____ SETTINGS - Decimals
(DECIMAL) Maximum number of decimal for contracts {3}: How small (3 decimals means 0.001) an entry position might be in your exchange.
EXTRA 1 - PRICE IS IN RANGE indicator
(PRANGE) Print price is in range {False}: Enable a bottom label that indicates if the price is in range or not.
(PRANGE) Price range periods {5}: How many previous periods are used to calculate the medians
(PRANGE) Price range maximum desviation (%) {0.6} ( > 0 ): Maximum positive desviation for range detection
(PRANGE) Price range minimum desviation (%) {0.6} ( > 0 ): Mininum negative desviation for range detection
EXTRA 2 - SQUEEZE MOMENTUM Desviation indicator
(SQZDIVER) Show degrees {False}: Show degrees of each Squeeze Momentum Divergence lines to the x-axis.
(SQZDIVER) Show desviation labels {False}: Whether to show or not desviation labels for the Squeeze Momentum Divergences.
(SQZDIVER) Show desviation lines {False}: Whether to show or not desviation lines for the Squeeze Momentum Divergences.
EXTRA 3 - VOLUME PROFILE indicator
WARNING: This indicator works not on current bar but on previous bar. So in the worst case it might be VP from 4 hours ago. Don't worry, inside the strategy calculus the correct values are used. It's just that I cannot show the most recent one in the chart.
(VP) Print recent profile {False}: Show Volume Profile indicator
(VP) Avoid label price overlaps {False}: Avoid label prices to overlap on the chart.
EXTRA 4 - ZIGNALY SUPPORT
(ZIG) Zignaly Alert Type {Email}: 'Email', 'Webhook'. ' Email ': Prepare alert_message variable content to be compatible with zignaly expected email content format. ' Webhook ': Prepare alert_message variable content to be compatible with zignaly expected json content format.
EXTRA 5 - DEBUG
(DEBUG) Enable debug on order comments {False}: If set to true it prepares the order message to match the alert_message variable. It makes easier to debug what would have been sent by email or webhook on each of the times an order is triggered.
HOW TO USE THIS STRATEGY
BOT MODE: This is the default setting.
PROPER VOLUME PROFILE VIEWING: Click on this strategy settings. Properties tab. Make sure Recalculate 'each time the order was run' is turned off.
NEWBIE USER: (Check PROPER VOLUME PROFILE VIEWING above!) You might want to turn on the 'Print recent profile {False}' setting. Alternatively you can use my alternate realtime study: 'Resistances and supports based on simplified Volume Profile' but, be aware, it might consume one indicator.
ADVANCED USER 1: Turn on the 'Print price is in range {False}' setting and help us to debug this subindicator. Also help us to figure out how to include this value in the strategy.
ADVANCED USER 2: Turn on the all the (SQZDIVER) settings and help us to figure out how to include this value in the strategy.
ADVANCED USER 3: (Check PROPER VOLUME PROFILE VIEWING above!) Turn on the 'Print recent profile {False}' setting and report any problem with it.
JAIME MERINO: Just use the indicator as it comes by default. It should only show BUY signals, SELL signals and their associated closing signals. From time to time you might want to check 'ADVANCED USER 2' instructions to check that there's actually a divergence. Check also 'ADVANCED USER 1' instructions for your amusement.
EXTRA ADVICE
It's advised that you use this strategy in addition to these two other indicators:
* Squeeze Momentum Indicator
* ADX
so that your chart matches as close as possible to TradingLatino chart.
ZIGNALY INTEGRATION
This strategy supports Zignaly email integration by default. It also supports Zignaly Webhook integration.
ZIGNALY INTEGRATION - Email integration example
What you would write in your alert message:
||{{strategy.order.alert_message}}||key=MYSECRETKEY||
ZIGNALY INTEGRATION - Webhook integration example
What you would write in your alert message:
{ {{strategy.order.alert_message}} , "key" : "MYSECRETKEY" }
CREDITS
I have reused and adapted some code from
'Directional Movement Index + ADX & Keylevel Support' study
which it's from TradingView console user.
I have reused and adapted some code from
'3ema' study
which it's from TradingView hunganhnguyen1193 user.
I have reused and adapted some code from
'Squeeze Momentum Indicator ' study
which it's from TradingView LazyBear user.
I have reused and adapted some code from
'Strategy Tester EMA-SMA-RSI-MACD' study
which it's from TradingView fikira user.
I have reused and adapted some code from
'Support Resistance MTF' study
which it's from TradingView LonesomeTheBlue user.
I have reused and adapted some code from
'TF Segmented Linear Regression' study
which it's from TradingView alexgrover user.
I have reused and adapted some code from
"Poor man's volume profile" study
which it's from TradingView IldarAkhmetgaleev user.
FEEDBACK
Please check the strategy source code for more detailed information
where, among others, I explain all of the substrats
and if they are implemented or not.
Q1. Did I understand wrong any of the Jaime substrats (which I have implemented)?
Q2. The strategy yields quite profit when we should long (EMA10 from 1d timeframe is higher than EMA55 from 1d timeframe.
Why the strategy yields much less profit when we should short (EMA10 from 1d timeframe is lower than EMA55 from 1d timeframe)?
Any idea if you need to do something else rather than just reverse what Jaime does when longing?
FREQUENTLY ASKED QUESTIONS
FAQ1. Why are you giving this strategy for free?
TradingLatino and his fellow enthusiasts taught me this strategy. Now I'm giving back to them.
FAQ2. Seriously! Why are you giving this strategy for free?
I'm confident his strategy might be improved a lot. By keeping it to myself I would avoid other people contributions to improve it.
Now that everyone can contribute this is a win-win.
FAQ3. How can I connect this strategy to my Exchange account?
It seems that you can attach alerts to strategies.
You might want to combine it with a paying account which enable Webhook URLs to work.
I don't know how all of this works right now so I cannot give you advice on it.
You will have to do your own research on this subject. But, be careful. Automating trades, if not done properly,
might end on you automating losses.
FAQ4. I have just found that this strategy by default gives more than 3.97% of 'maximum series of losses'. That's unacceptable according to my risk management policy.
You might want to reduce default stop loss setting from 7% to something like 5% till you are ok with the 'maximum series of losses'.
FAQ5. Where can I learn more about your work on this strategy?
Check the source code. You might find unused strategies. Either because there's not a substantial increases on earnings. Or maybe because they have not been implemented yet.
FAQ6. How much leverage is applied in this strategy?
No leverage.
FAQ7. Any difference with original Jaime Merino strategy?
Most of the times Jaime defines an stop loss at the price entry. That's not the case here. The default stop loss is 7% (but, don't be confused it only means losing 1% of your investment thanks to risk management). There's also a trailing take profit that triggers at 2% profit with a 1% trailing.
FAQ8. Why this strategy return is so small?
The strategy should be improved a lot. And, well, backtesting in this platform is not guaranteed to return theoric results comparable to real-life returns. That's why I'm personally forward testing this strategy to verify it.
MENSAJE EN CASTELLANO
En primer lugar se agradece feedback para mejorar la estrategia.
Si eres un usuario avanzado y quieres colaborar en mejorar el script no dudes en comentar abajo.
Ten en cuenta que aunque toda esta descripción tenga que estar en inglés no es obligatorio que el comentario esté en inglés.
CHISTE - CASTELLANO
¡Pero Jaime!
¡400.000!
¡Tu da mun!

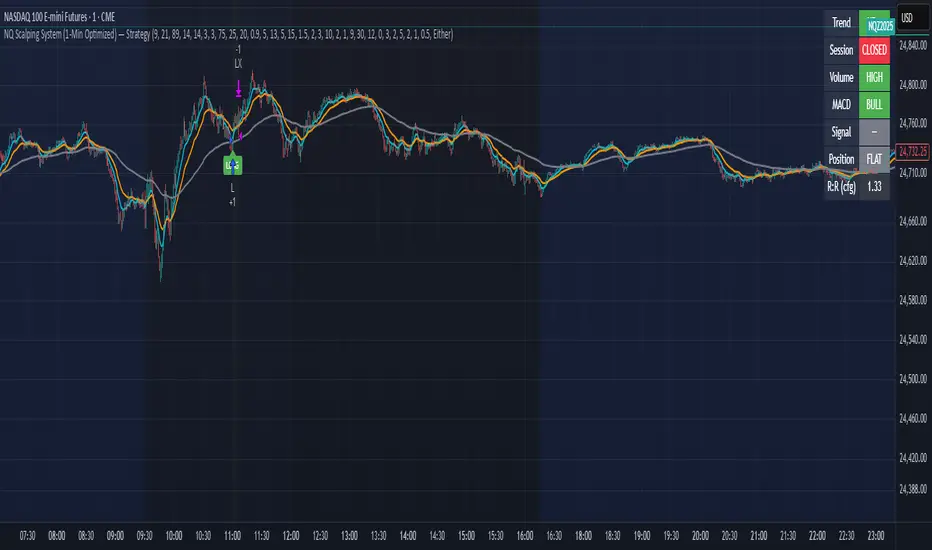
NQ Scalping System (1-Min Optimized) — StrategyNQ Scalping System — What this does (in plain English)
You’re buying pullbacks in an uptrend and selling pullbacks in a downtrend.
Trend = EMA89. Entries lean on EMA8/EMA21 touches + a StochRSI reset & cross so you’re not chasing candles. Optional Volume and MACD filters keep you out of weak moves. A time window avoids dead markets and the first noisy minute.
Long setup
Price above EMA89 (trend up)
Price pulls back to EMA8 (or EMA21 if fallback is on) by at least your Min Pullback (NQ points)
StochRSI resets to oversold and %K crosses up %D
(Optional) Volume thrust and MACD momentum confirm
Within your session window
Short = mirror image.
Exits you control
Stop/Target: ATR-based (adaptive) or fixed scalp points
Trailing stop: only arms after price moves your way by X points, then trails by your offset
Early exit options: StochRSI fade, EMA break, trend break, or opposite divergence
Quick scalp: grab a few points or bail after X bars if nothing happens
Reality check
This is a rules → orders system. It will not match eyeballed indicator labels. Fills, gaps, and trail behavior are real. That’s the point.
How I’d run it (defaults that won’t waste your time)
Use ATR stops/targets by default
EMA21 fallback = ON (you’ll miss fewer good pullbacks)
MACD filter = ON when choppy; OFF when trends are clean
Volume multiplier: start modest, bump it up if you get chopped
Session: keep RTH (e.g., 09:30–15:45 ET) and skip the first minute
Quick presets for higher timeframes
Use these as starting points and then nudge to taste.
5-Minute (intraday swings)
OB/OS: 80 / 20
Volume Multiplier: 1.3
MACD: 8 / 21 / 5
ATR Stop× / Target×: 1.8–2.2 / 2.5–3.0
Min Pullback: 1.0–1.5 pts
Quick Scalp: 6–10 pts, Bars: 12–20
Trailing: Activation 6–8 pts, Offset 3–4 pts
Divergence: Hidden ON, MTF OFF
15-Minute (session legs)
OB/OS: 85 / 15
Volume Multiplier: 1.4
MACD: 8 / 21 / 5
ATR Stop× / Target×: 2.0–2.5 / 3.0–4.0
Min Pullback: 1.5–2.5 pts
Quick Scalp: 12–18 pts, Bars: 16–30
Trailing: Activation 10–14 pts, Offset 5–6 pts
Divergence: Hidden ON, MTF ON (LTF = 5m)
30-Minute (bigger intraday trends)
OB/OS: 88 / 12
Volume Multiplier: 1.5
MACD: 12 / 26 / 9 (or 8 / 21 / 5 if you want faster)
ATR Stop× / Target×: 2.2–2.8 / 3.5–5.0
Min Pullback: 2.5–4.0 pts
Quick Scalp: 18–28 pts, Bars: 20–40
Trailing: Activation 16–24 pts, Offset 6–8 pts
Divergence: Hidden ON, MTF ON (LTF = 5m or 15m)
1-Hour (multi-hour swings)
OB/OS: 90 / 10
Volume Multiplier: 1.6–1.8
MACD: 12 / 26 / 9
ATR Stop× / Target×: 2.5–3.5 / 4.0–6.0
Min Pullback: 4–7 pts
Quick Scalp: 30–50 pts, Bars: 24–60
Trailing: Activation 28–40 pts, Offset 10–15 pts
Divergence: Hidden ON, MTF ON (LTF = 15m)
Tuning tips (read this)
Getting chopped? Raise Min Pullback, raise Volume Multiplier, leave MACD ON, and narrow your session.
Missing moves? Turn EMA21 fallback ON, lower Volume Multiplier, relax OB/OS (e.g., 75/25 on 5m).
Flat days? Use Quick Scalp and a tighter Trail Activation to lock gains.
Strategy Builder v1.0.0 [BigBeluga]🔵 OVERVIEW
The Strategy Builder combines advanced price-action logic, smart-money concepts, and volatility-adaptive momentum signals to automate high-quality entries and exits across any market. It blends trend recognition, market structure shifts, order block reactions, imbalance (FVG) signals, liquidity sweeps, candlestick confirmations, and oscillator-powered divergences into one cohesive engine.
Whether used as a full automation workflow or as a structured confirmation framework, this strategy provides a disciplined, rules-driven method to trade with logic — not emotion.
🔵 BACKTEST WINDOW CONTROL
This module allows you to restrict strategy execution to a specific historical period.
Ideal for performance isolation, regime testing, and forward-walk validation.
Limit Backtest Window
Enabling this option activates custom date filters for the backtest engine.
Start — Define the starting date & time for backtesting
End — Define the ending date & time for backtesting
Only trades and signals inside this window are executed
Reduces computation load on large datasets
Useful for testing specific market environments (e.g., bull cycles, crash periods, sideways regimes)
🔵 SIGNAL GLOSSARY (Advanced Technical Explanation)
Traders can build long and short setups using up to 6 configurable entry conditions for each direction.
Every condition can be set as Bullish or Bearish and mapped to any signal source — allowing deep customization
Below is the full internal logic overview of every signal available in the Strategy Builder.
Signals are based on trend models, volatility structures, liquidity logic, oscillator behavior, and market structure mapping.
Trend Signals (Low-Lag Trend Engine)
Uses a proprietary low-lag baseline + momentum gradient model to detect directional bias.
Trend Signal — Momentum breaks above/below adaptive trend baseline.
Trend Signal+ — Stronger trend confirmation using volatility-weighted momentum.
Trend Signal Any — Triggers when any bullish/bearish trend signal appears.
SmartBand & Retests (Adaptive Volatility Bands)
Dynamic envelope that contracts/expands with volatility & trend strength.
SmartBand Retest — Price retests dynamic band and rejects, confirming continuation.
ActionWave Signals (Impulse-Pullback Engine)
Tracks wave behavior, acceleration and deceleration in price.
ActionWave — Detects directional impulse strength vs pullback weakness.
ActionWave Cross — Momentum acceleration threshold crossed → trend ignition.
Magnet Signals (Liquidity Gravity + Mean Reversion Bias)
Detects zones where price is being drawn due to liquidity voids or imbalance.
Magnet — Trend and liquidity pressure align, creating directional “pull.”
MagnetBar Low Momentum — Low-volatility compression → pre-breakout condition.
Flow Trend (Directional Flow State + ATR Envelope)
Higher-timeframe bias confirmation + dynamic volatility filter.
FlowTrend — Confirms major directional bias (uptrend or downtrend).
FlowTrend Retest — Price tests HTF flow band and rejects → trend resume.
Voltix (Volatility Expansion Pulse)
Detects regime shift from quiet accumulation → trending expansion.
Voltix — Breakout volatility signature, trend acceleration trigger.
Candlestick Pattern (Algorithmic Price Action Recognition)
Auto-recognizes meaningful reversal or continuation candle formations.
Candlestick Pattern — Confirms momentum reversal/continuation via candle logic.
OrderBlock Logic (Institutional Footprint System)
Institutional demand/supply zone tracking with mitigation logic.
Order Block Touch — Price taps institutional zone → reaction filter.
Order Block Break — OB invalidation → institutional flow shift.
Market Structure Engine (Swing Logic + Volume Confirmation)
Tracks major swing breaks and structural reversals.
BoS — Break of Structure in trend direction (continuation bias).
ChoCh — Change of Character — early reversal marker.
Fair Value Gaps (Imbalance & Volume Displacement)
Identifies inefficiencies caused by rapid displacement moves.
FVG Created — Price leaves inefficiency behind.
FVG Retest — Price returns to rebalance inefficiency → reaction zone.
Liquidity Events (Stop-Run & Reversal Logic)
Detects stop-hunt events and liquidity sweeps.
SFP — Swing failure & wick sweep → reversal confirmation.
Liquidity Created — New equal highs/lows form liquidity pool.
Liquidity Grab — Sweep through liquidity line followed by rejection.
Support / Resistance Break Logic
Adaptive zone recognition + momentum confirmation.
Support/Resistance Cross — Zone decisively broken → structural shift.
Pattern Breakouts (Market Geometry Engine)
Tracks breakout from compression & expansion formations.
Channel Break — Channel breakout → trend acceleration.
Wedge Break — Break from contraction wedge → burst of momentum.
Session Logic (Opening Range Behavior)
Session-based volatility trigger.
Session Break — Break above/below session opening range.
Momentum / Reversal Oscillator Suite
Oscillator-driven exhaustion & reversal signals.
Nautilus Signals — Momentum reversal signature (oscillator shift).
Nautilus Peak — Momentum peak → exhaustion risk.
OverSold/Overbought ❖ — Extreme exhaustion zones → reversal setup.
DipX Signals ✦ — Dip buy / Dip sell timing, micro-reversal engine.
Advanced Divergence Engine
Momentum/price disagreement layer with multi-trigger confirmation.
Normal Divergence — Classic divergence reversal.
Hidden Divergence — Trend continuation divergence.
Multiple Divergence — Multiple divergence confirmations stacked → high confidence.
🔧 Adjustable Signal Logic
Some signals in this system can be additionally refined through the strategy settings panel.
This allows traders to tune internal behavior for different market regimes, assets, and volatility conditions.
🔵 LONG / SHORT EXIT CONDITIONS
This section allows you to automate exits using the same advanced market conditions available for entries.
Each exit rule consists of:
Toggle — Enable/disable individual exit rule.
Direction Filter — Trigger exit only if selected market bias appears (Bullish/Bearish).
Signal Type — Choose which market event triggers the exit (same list as entry conditions).
When the active conditions are met, the strategy automatically closes the current position — ensuring emotion-free risk management and systematic trade control.
🔵 TAKE PROFIT & STOP LOSS SYSTEM
This strategy builder provides a fully dynamic risk-management engine designed for both systematic traders and discretionary confirmation users.
Take Profit Logic
Scale out of trades progressively or exit fully using algorithmic TP levels.
Up to 3 Take-Profit targets available
Choose TP calculation method:
• ATR-based distance (volatility-adaptive targets)
• %-based distance (fixed percentage from entry)
Define Size — ATR multiplier or % value
Custom Exit Size per TP (e.g., 25% / 25% / 50%)
Visual TP plotting on chart for clarity
Stop Loss Logic
Automated protection logic for every trade.
Two SL Modes:
• Fixed Stop Loss — static SL from entry
• Trailing Stop Loss — SL follows price as trade progresses
Distance options:
• ATR multiplier (adapts to volatility)
• %-based from entry (fixed distance)
SL dynamically draws on chart for transparency
Trailing SL behavior:
Follows price only in profitable direction
Never moves against the trade
Locks profits as trend develops
🔵 Strategy Dashboard
A compact on-chart performance dashboard is included to help monitor live trade status and backtest results in real time.
It displays key metrics:
Start Capital — Initial account balance used in simulation.
Position Size — % of capital allocated per trade based on user settings (It changes if the trade hits take profits, when more than one take profit is selected).
Current Trade — Shows active trade direction (Long / Short) and real-time % return from entry.
Closed Trades — Counter of completed positions, useful for reading sample size during testing.
🔵 CONCLUSION
The Strategy Builder brings together a powerful suite of smart-money and momentum-driven signals, allowing traders to automate robust trade logic built on modern market structure concepts. With access to trend filters, order blocks, liquidity events, divergence signals, volatility cues, and session-based triggers, it provides a deeply adaptive trade engine capable of fitting many market environments.

multi Stoch + MACD + CCI strategy (J)The Stochastic Oscillator (STOCH) is a range bound momentum oscillator. The Stochastic indicator is designed to display the location of the close compared to the high/low range over a user defined number of periods. Typically, the Stochastic Oscillator is used for three things; Identifying overbought and oversold levels, spotting divergences and also identifying bull and bear set ups or signals.
www.tradingview.com(STOCH)
MACD is an extremely popular indicator used in technical analysis. MACD can be used to identify aspects of a security's overall trend. Most notably these aspects are momentum, as well as trend direction and duration. What makes MACD so informative is that it is actually the combination of two different types of indicators. First, MACD employs two Moving Averages of varying lengths (which are lagging indicators) to identify trend direction and duration. Then, MACD takes the difference in values between those two Moving Averages (MACD Line) and an EMA of those Moving Averages (Signal Line) and plots that difference between the two lines as a histogram which oscillates above and below a center Zero Line. The histogram is used as a good indication of a security's momentum.
www.tradingview.com(Moving_Average_Convergence/Divergence)
The Commodity Channel Index (CCI) is a momentum oscillator used in technical analysis primarily to identify overbought and oversold levels by measuring an instrument's variations away from its statistical mean. CCI is a very well-known and widely-used indicator that has gained level of popularity in no small part of its versatility. Besides overbought/oversold levels, CCI is often used to find reversals as well as divergences. Originally, the indicator was designed to be used for identifying trends in commodities, however it is now used in a wide range of financial instruments.
www.tradingview.com(CCI)

Sentiment OscillatorPrice moves when there are more market takers than there are market makers at a certain price (i.e. price moves up when there are more market buys than limit sells and vice versa). The idea of this indicator is to show the ratio between market takers and market makers in a way that is intuitive to technical analysis methods, and hopefully revealing the overall sentiment of the market in doing so. You can use it in the same way you would other oscillators (histogram crossing zero, divergences, etc). The main difference between this and most volume-weighted indicators is that the price is divided by volume instead of multiplied by it, thus giving you a rough idea of how much "effort" it took to move the price. My hypothesis is that when more volume is needed to move the price, that means bulls and bears are not in agreement of what the "fair price" should be for an asset (e.g. if the candle closes only a bit higher than its open but there's a huge spike in volume, that tells you that a majority of the market are starting to think the price is too high and they've started selling).
Methods of Calculation
1. Price Change Per Volume
The main method this indicator uses to reveal market sentiment is by comparing price change to the volume of trades in a bar.
You will see this calculation plotted in its most basic form by ticking the "Show Bar per Bar Change/Volume" box in the inputs dialog. I personally found that the plots were too noisy and cannot be used in real time reliably due to the fact that there is not much volume at the open of a new bar. I decided to leave in the option to use this method, in case you'd like to experiment with it or get a better grasp of how the indicator works.
2. Exponential Moving Averages
In my quest to smooth out the plotted data, I experimented with exponential moving averages. Applying an EMA on the change per volume data did smooth it out a bit, but still left in a lot of noise. So I worked around it by applying the EMA to the price change first, and then dividing it by the EMA of the volume. The term I use for the result of this calculation is "Market Sentiment" (do let me know if you have a better-fitting term for it ;-)), and I have kept it as an option that you can use in the way you would use other oscillators like CMF, OBV, etc. This option is unticked by default.
3. MACD
I left "Market Sentiment" unchecked as the default option because I thought an easier way to use this indicator would be as a momentum indicator like the MACD . So that's what I turned it into! I applied another EMA on the Market Sentiment, added a slower EMA to subtract from the first, and now we have a MACD line. I added a signal line to subtract from the MACD , and the result is plotted as a histogram... ish . I used area instead of columns for plot style so you don't get confused when comparing with a regular MACD indicator, but you can always change it if an actual histogram is more your taste.
The "histogram" is the main gauge of sentiment change momentum and it is easiest to use, that is why it is the only calculation plotted by default.
Methods of Use
As I have mentioned before, you can use this as you would other oscillators.
-The easiest way to use this indicator is with the Momentum histogram, where crosses over 0 indicate increasing bullish sentiment, and crosses below 0 indicate increasing bearish sentiment. You may also spot occasional divergences with the histogram.
-For the Market Sentiment option, the easiest way to use it is to look for divergences.
-And if you use the "Price Change per Volume of Each Bar", well... I honestly don't know. I guess divergences would be apparent towards the close of a bar, but in realtime, I don't recommend you use this. Maybe if you'd like to study the market movement, looking at historical data and comparing price, volume , and Change per Volume of each bar would come in handy in a pseudo-tape-reading kind of way.
Anyway, that's my explanation of this indicator. The default values were tested on BTC/USDT (Binance) 4h with decent results. You'll have to adjust the parameters for different markets and timeframes.
I have published this as a strategy so you can test out how the indicator performs as you're tweaking the parameters.
I'm aware that the code might not be the cleanest as I have only started learning pine (and code in general) for about a month, so any suggestions to improve the script would be appreciated!
Good luck and happy trading :-)

Auto Div ADX STO RSI (Flip+P) v2This strategy combines multi-indicator divergence detection, momentum confirmation and adaptive position management into a unified automated trading framework.
It identifies regular bullish and bearish divergences using RSI and Stochastic (K), with configurable confirmation logic (RSI+STO, RSI only, or STO only). Divergences are validated only when price forms a lower low / higher high while the oscillator forms a higher low / lower high within a user-defined lookback window.
To filter low-quality setups, the strategy applies an ADX trend strength requirement, ensuring signals are taken only when market conditions reflect sufficient directional energy. Optional stochastic filters (oversold/overbought K levels) can further refine long and short entries.
Once a valid signal appears, the system supports Automatic Flip Logic:
If a bullish divergence forms during a short position, the strategy closes the short and flips long.
If a bearish divergence forms during a long position, it closes the long and flips short.
Position sizing uses adaptive pyramiding: the initial flip takes size proportional to the opposite side’s accumulated units, and new signals in the same direction can add incremental units (scale-in) if enabled. This models progressive conviction as new divergence signals occur.
All entries can optionally be required to confirm on bar close.
Alerts are included for both Long and Short entries.
Key Features
• Automatic detection of RSI and Stochastic divergences
• User-selectable confirmation rules (RSI, STO, or both)
• ADX-based strength filter
• Optional Stochastic K oversold/overbought filters
• Full flip logic between Long and Short
• Dynamic pyramiding and configurable scale-ins
• Bar-close confirmation option
• Alerts for Long/Short entries
• Status-line visualization of ADX, RSI, Stochastic, and unit cycles
This strategy is designed for traders who want a structured, divergence-based model enhanced with trend strength filtering and flexible position management logic, suitable for systematic discretionary trading or fully automated execution.

Multi-Confluence Swing Hunter V1# Multi-Confluence Swing Hunter V1 - Complete Description
Overview
The Multi-Confluence Swing Hunter V1 is a sophisticated low timeframe scalping strategy specifically optimized for MSTR (MicroStrategy) trading. This strategy employs a comprehensive point-based scoring system that combines optimized technical indicators, price action analysis, and reversal pattern recognition to generate precise trading signals on lower timeframes.
Performance Highlight:
In backtesting on MSTR 5-minute charts, this strategy has demonstrated over 200% profit performance, showcasing its effectiveness in capturing rapid price movements and volatility patterns unique to MicroStrategy's trading behavior.
The strategy's parameters have been fine-tuned for MSTR's unique volatility characteristics, though they can be optimized for other high-volatility instruments as well.
## Key Innovation & Originality
This strategy introduces a unique **dual scoring system** approach:
- **Entry Scoring**: Identifies swing bottoms using 13+ different technical criteria
- **Exit Scoring**: Identifies swing tops using inverse criteria for optimal exit timing
Unlike traditional strategies that rely on simple indicator crossovers, this system quantifies market conditions through a weighted scoring mechanism, providing objective, data-driven entry and exit decisions.
## Technical Foundation
### Optimized Indicator Parameters
The strategy utilizes extensively backtested parameters specifically optimized for MSTR's volatility patterns:
**MACD Configuration (3,10,3)**:
- Fast EMA: 3 periods (vs standard 12)
- Slow EMA: 10 periods (vs standard 26)
- Signal Line: 3 periods (vs standard 9)
- **Rationale**: These faster parameters provide earlier signal detection while maintaining reliability, particularly effective for MSTR's rapid price movements and high-frequency volatility
**RSI Configuration (21-period)**:
- Length: 21 periods (vs standard 14)
- Oversold: 30 level
- Extreme Oversold: 25 level
- **Rationale**: The 21-period RSI reduces false signals while still capturing oversold conditions effectively in MSTR's volatile environment
**Parameter Adaptability**: While optimized for MSTR, these parameters can be adjusted for other high-volatility instruments. Faster-moving stocks may benefit from even shorter MACD periods, while less volatile assets might require longer periods for optimal performance.
### Scoring System Methodology
**Entry Score Components (Minimum 13 points required)**:
1. **RSI Signals** (max 5 points):
- RSI < 30: +2 points
- RSI < 25: +2 points
- RSI turning up: +1 point
2. **MACD Signals** (max 8 points):
- MACD below zero: +1 point
- MACD turning up: +2 points
- MACD histogram improving: +2 points
- MACD bullish divergence: +3 points
3. **Price Action** (max 4 points):
- Long lower wick (>50%): +2 points
- Small body (<30%): +1 point
- Bullish close: +1 point
4. **Pattern Recognition** (max 8 points):
- RSI bullish divergence: +4 points
- Quick recovery pattern: +2 points
- Reversal confirmation: +4 points
**Exit Score Components (Minimum 13 points required)**:
Uses inverse criteria to identify swing tops with similar weighting system.
## Risk Management Features
### Position Sizing & Risk Control
- **Single Position Strategy**: 100% equity allocation per trade
- **No Overlapping Positions**: Ensures focused risk management
- **Configurable Risk/Reward**: Default 5:1 ratio optimized for volatile assets
### Stop Loss & Take Profit Logic
- **Dynamic Stop Loss**: Based on recent swing lows with configurable buffer
- **Risk-Based Take Profit**: Calculated using risk/reward ratio
- **Clean Exit Logic**: Prevents conflicting signals
## Default Settings Optimization
### Key Parameters (Optimized for MSTR/Bitcoin-style volatility):
- **Minimum Entry Score**: 13 (ensures high-conviction entries)
- **Minimum Exit Score**: 13 (prevents premature exits)
- **Risk/Reward Ratio**: 5.0 (accounts for volatility)
- **Lower Wick Threshold**: 50% (identifies true hammer patterns)
- **Divergence Lookback**: 8 bars (optimal for swing timeframes)
### Why These Defaults Work for MSTR:
1. **Higher Score Thresholds**: MSTR's volatility requires more confirmation
2. **5:1 Risk/Reward**: Compensates for wider stops needed in volatile markets
3. **Faster MACD**: Captures momentum shifts quickly in fast-moving stocks
4. **21-period RSI**: Reduces noise while maintaining sensitivity
## Visual Features
### Score Display System
- **Green Labels**: Entry scores ≥10 points (below bars)
- **Red Labels**: Exit scores ≥10 points (above bars)
- **Large Triangles**: Actual trade entries/exits
- **Small Triangles**: Reversal pattern confirmations
### Chart Cleanliness
- Indicators plotted in separate panes (MACD, RSI)
- TP/SL levels shown only during active positions
- Clear trade markers distinguish signals from actual trades
## Backtesting Specifications
### Realistic Trading Conditions
- **Commission**: 0.1% per trade
- **Slippage**: 3 points
- **Initial Capital**: $1,000
- **Account Type**: Cash (no margin)
### Sample Size Considerations
- Strategy designed for 100+ trade sample sizes
- Recommended timeframes: 4H, 1D for swing trading
- Optimal for trending/volatile markets
## Strategy Limitations & Considerations
### Market Conditions
- **Best Performance**: Trending markets with clear swings
- **Reduced Effectiveness**: Highly choppy, sideways markets
- **Volatility Dependency**: Optimized for moderate to high volatility assets
### Risk Warnings
- **High Allocation**: 100% position sizing increases risk
- **No Diversification**: Single position strategy
- **Backtesting Limitation**: Past performance doesn't guarantee future results
## Usage Guidelines
### Recommended Assets & Timeframes
- **Primary Target**: MSTR (MicroStrategy) - 5min to 15min timeframes
- **Secondary Targets**: High-volatility stocks (TSLA, NVDA, COIN, etc.)
- **Crypto Markets**: Bitcoin, Ethereum (with parameter adjustments)
- **Timeframe Optimization**: 1min-15min for scalping, 30min-1H for swing scalping
### Timeframe Recommendations
- **Primary Scalping**: 5-minute and 15-minute charts
- **Active Monitoring**: 1-minute for precise entries
- **Swing Scalping**: 30-minute to 1-hour timeframes
- **Avoid**: Sub-1-minute (excessive noise) and above 4-hour (reduces scalping opportunities)
## Technical Requirements
- **Pine Script Version**: v6
- **Overlay**: Yes (plots on price chart)
- **Additional Panes**: MACD and RSI indicators
- **Real-time Compatibility**: Confirmed bar signals only
## Customization Options
All parameters are fully customizable through inputs:
- Indicator lengths and levels
- Scoring thresholds
- Risk management settings
- Visual display preferences
- Date range filtering
## Conclusion
This scalping strategy represents a comprehensive approach to low timeframe trading that combines multiple technical analysis methods into a cohesive, quantified system specifically optimized for MSTR's unique volatility characteristics. The optimized parameters and scoring methodology provide a systematic way to identify high-probability scalping setups while managing risk effectively in fast-moving markets.
The strategy's strength lies in its objective, multi-criteria approach that removes emotional decision-making from scalping while maintaining the flexibility to adapt to different instruments through parameter optimization. While designed for MSTR, the underlying methodology can be fine-tuned for other high-volatility assets across various markets.
**Important Disclaimer**: This strategy is designed for experienced scalpers and is optimized for MSTR trading. The high-frequency nature of scalping involves significant risk. Past performance does not guarantee future results. Always conduct your own analysis, consider your risk tolerance, and be aware of commission/slippage costs that can significantly impact scalping profitability.

Kuytrade - Super Scalping Pro V1.0📘 Strategy "Kuytrade - Super Scalping Pro"
What is this strategy?
This is a scalping trading that helps you catch quick profits from short-term price movements. It's perfect for traders who want to make multiple small wins throughout the day.
How does it work?
The strategy uses a 3-level filter system to find high-quality trading signals:
Level 1: CORE Indicators (Must Pass)
- EMA (Moving Averages): Checks if the trend is going up or down
- MACD: Confirms momentum is building in the right direction
Level 2: MOMENTUM Indicators
- RSI: Looks for oversold (ready to bounce up) or overbought (ready to drop) conditions
- Stochastic: Finds reversal points where price might change direction
Level 3: BOOST Indicators
- RSI Divergence: Spots hidden opportunities when price and momentum disagree
- Strong Candles: Identifies powerful price movements
- ATR Filter: Makes sure the market is active enough to trade
Trading Setup
Each Signal Opens 3 Orders:
Order 1: Closes at TP1 (quick small profit)
Order 2: Closes at TP2 (medium profit)
Order 3: Closes at TP3 (big profit target)
Default Settings:
TP1: 1,000 points
TP2: 1,500 points
TP3: 2,500 points
Stop Loss: 1,200 points
Lot Size: 0.01 per order (3 orders total)
Smart Features
- Trailing Stop Loss
- When TP1 hits, the Stop Loss for TP3 automatically moves to breakeven + 150 points, protecting your profit!
- Auto Asset Detection
The strategy automatically recognizes what you're trading:
- Forex pairs (EURUSD, GBPUSD, etc.)
- Gold, Silver, Platinum
- Crypto (Bitcoin, Ethereum)
- Stock Indices (US30, NASDAQ, S&P500)
Indicators:
You can enable/disable each indicator level
Mix and match to find what works for your style
Visuals:
Show/Hide TP/SL lines
Show/Hide entry boxes
Mobile view for smaller screens
When to Use This Strategy?
✅ Best for:
Active markets (London/NY sessions)
Lower timeframes (1m, 5m, 15m)
Volatile pairs with clear trends
❌ Avoid during:
Major news releases
Very quiet markets
Weekends/holidays
----------------------------------------
กลยุทธ์นี้คืออะไร?
Scalping ที่ออกแบบมาให้ช่วยทำกำไรเล็กๆ จากการเคลื่อนไหวของราคาระยะสั้น เหมาะสำหรับเทรดเดอร์ที่ต้องการทำกำไรเล็กน้อยบ่อยๆ ตลอดทั้งวัน
ทำงานยังไง?
กลยุทธ์ใช้ระบบกรองสัญญาณ 3 ระดับ เพื่อหาจุดเข้าที่มีคุณภาพสูง
Level 1: ตัวบ่งชี้หลัก (ต้องผ่าน)
- EMA (เส้นค่าเฉลี่ย): เช็คว่าเทรนด์กำลังขึ้นหรือลง
- MACD: ยืนยันว่าแรงซื้อ/ขายกำลังมาถูกทาง
Level 2: ตัวบ่งชี้โมเมนตัม
- RSI: หาจุด Oversold (ราคาถูกเกินไป พร้อมกลับตัว) หรือ Overbought (ราคาแพงเกิน พร้อมลง)
- Stochastic: หาจุดกลับตัวที่ราคาอาจจะเปลี่ยนทิศ
Level 3: ตัวบ่งชี้เสริม
- RSI Divergence: เจอโอกาสแอบแฝงเมื่อราคาและโมเมนตัมไม่สอดคล้องกัน
- Strong Candles: จับแท่งเทียนที่แรงมาก
- ATR Filter: ตรวจว่าตลาดมีความผันผวนพอจะเทรดไหม
การตั้งค่าการเทรด
แต่ละสัญญาณเปิด 3 ออเดอร์:
ออเดอร์ 1: ปิดที่ TP1 (กำไรเล็กเร็ว)
ออเดอร์ 2: ปิดที่ TP2 (กำไรกลางๆ)
ออเดอร์ 3: ปิดที่ TP3 (กำไรใหญ่)
ค่าเริ่มต้น:
TP1: 800 จุด
TP2: 1,500 จุด
TP3: 2,500 จุด
Stop Loss: 1,200 จุด
ขนาดล็อต: 0.01 ต่อออเดอร์ (รวม 3 ออเดอร์)
ฟีเจอร์พิเศษ
- Trailing Stop Loss (ขยับ SL ตาม)
- เมื่อ TP1 โดน SL ของ TP3 จะเลื่อนมาที่ราคาเข้า + 150 จุด ทำให้คุณไม่ขาดทุน!
- ตรวจจับสินทรัพย์อัตโนมัติ
กลยุทธ์จะจำคู่เงินที่คุณเทรดได้เอง:
คู่เงิน Forex (EURUSD, GBPUSD ฯลฯ)
- ทองคำ, เงิน, แพลตตินั่ม
- คริปโต (Bitcoin, Ethereum)
- ดัชนีหุ้น (US30, NASDAQ, S&P500)
แดชบอร์ดผลงาน (ล่างซ้าย)
- แสดง Win Rate แต่ละ TP
- ติดตามกำไร/ขาดทุนรวม
- แสดงสถิติทั้งหมด
แดชบอร์ดสถานะ Level (บนขวา)
สถานะตัวบ่งชี้แบบเรียลไทม์
เขียว = สัญญาณพร้อม
แดง = รอเงื่อนไข
ตั้งค่าที่ปรับได้
คุณภาพสัญญาณ:
เปิด "Strict Filter" = สัญญาณน้อยแต่คุณภาพสูง
ปิด "Strict Filter" = สัญญาณเยอะแต่อาจเสี่ยงขึ้น
ตัวบ่งชี้:
- เปิด/ปิดแต่ละ Level ได้
- ผสมผสานหาสูตรที่เหมาะกับคุณ
การแสดงผล:
- แสดง/ซ่อนเส้น TP/SL
- แสดง/ซ่อนกล่องข้อมูล Entry
- โหมดมือถือสำหรับจอเล็ก
เมื่อไหร่ควรใช้กลยุทธ์นี้?
✅ เหมาะกับ:
- ตลาดที่คึกคัก (เซสชั่นลอนดอน/นิวยอร์ก)
- ไทม์เฟรมเล็ก (1m, 5m, 15m)
- คู่เงินที่มีความผันผวนและเทรนด์ชัด
❌ หลีกเลี่ยง:
- ช่วงมีข่าวเศรษฐกิจสำคัญ
- ตลาดเงียบมาก
- วันหยุดสุดสัปดาห์

BitBell - EMA PullBack RSI EXO
🔵 Introduction
Version 1.1
This is a Pine 5 trend following strategy. It has a four strategy with several alerts and signals. The design intent is to produce a commercial grade signal generator that can be adapted to any symbol in cryptocurrency and only 1H Chart. Ideally, the script is reliable enough to be the basis of an automated trading system web-hooked to a server with API access to crypto brokerages. The strategy can be run in three different modes: long, short and bidirectional.
As a trend following strategy, the behavior of the script is to buy on strength and sell on weakness. As such the trade orders maintain its directional bias according to price pressure. What you will see on the chart is long positions on the left side of the mountain and short on the right. Long and short positions are not intermingled as long as there exists a detectable trend. This is extremely beneficial feature in long running bull or bear markets. The script uses multiple setups to avoid the situation where you got in on the trend, took a small profit but couldn’t get back in because the logic is waiting for a pullback or some other intricate condition.
Deep draw-downs are a characteristic of trend following systems and this system is no different. However, this script makes use of the TradingView pyramid feature with three NPUs to find better place and even you can change drop percentage in settings for another trigger, accessible from the properties tab.
When trend market break it will stop the trade and usually it takes 2-4 percent loss but don't worry it has prefect money management and you can use it for Futures market and even Spot market.
🔵 Design
This script uses twelve indicators on two time frames. The chart (primary) interval and one higher time frame which is based on the primary. The higher time frame identifies the trend for which the primary will trade. I’ve tried to keep the higher time frame around five times greater than the primary. The original trading algorithms are a port from a much larger program on another trading platform. I’ve converted some of the statistical functions to use standard indicators available on TradingView. The setups make heavy use of the Hull Moving Average in conjunction with EMAs that form the Bill Williams Alligator as described in his book “New Trading Dimensions” Chapter 3. Lag between the Hull and the EMAs form the basis of the entry and exit points. The alligator itself is used to identify the trend main body.
The entire script is around 740 lines of Pine code which is the maximum incidental size given the TradingView limits: local scopes, run-time duration and compile time. I’ve been working on this script for over a year and have tested it on various instruments stock crypto. It performs well on higher liquidity markets that have at least a year of historical data. Though it can be configured to work on any interval between 15 minutes and 4 hour, trend trading is generally a longer term paradigm. For day trading the 10 to 15 minute interval will allow you to catch momentum breakouts. For intraweek trades 30 minutes to 1 hour should give you a trade every other a day.
Inputs to the script use cone centric measurements in effort to avoid exposing adjustments to the various internal indicators. The goal was to keep the inputs relevant to the actual trade entry and exit locations as opposed to a series of MA input values and the like. As a result the strategy exposes over 12 inputs grouped into long or short sections. Inputs are available for the usual minimum profit and stop-loss as well as trade, modes, presets, reports and lots of calibrations. The inputs are numerous, I’m aware. Unfortunately, at this time, TradingView does not offer any other method to get data in the script. The usual initialization files such as cnf, cfg, ini, json and xml files are currently unsupported.
Example configurations for various instruments along with a detailed PDF user manual is available.
it has no repaint i guaranty this, and you can have 10 days free with comment and check it by yourself
One issue that comes up when comparing the strategy with the study is that the strategy trades show on the chart one bar later than the study. This problem is due to the fact that “strategy.entry()” and “strategy_close()” do not execute on the same bar called. The study, on the other hand, has no such limitation since there are no position routines. However, alerts that are subsequently fired off when triggered in the study are dispatched from the TradingView servers one bar later from the study plot. Therefore the alert you actually receive on your cell phone matches the strategy plot but is one bar later than the study plot.
Please be aware that the data source matters. Cryptocurrency has no central tick repository so each exchange supplies TradingView its feed. Even though it is the same symbol the quality of the data and subsequently the bars that are supplied to the chart varies with the exchange. This script will absolutely produce different results on different data feeds of the same symbol. Be sure to backtest this script on the same data you intend to receive alerts for. Any example settings I share with you will always have the exchange name used to generate the test results.
🟡 Usage
It sends long and short signals with pyramid orders of up to 3, meaning that the strategy can trigger up to 3 orders in the same direction. Good risk and money management.
It's important to note that the strategy combines 2 systems working together (Long and LongX). Let’s describe the specific features of this strategy.
🔵 If Findes Supports And Ressitances And Trend Lines As Best As It Can, And You Can See:
🟢 Frist Simple Long Condition = It Look At The Trend Wait For RSI Cross 30 Number Then Ckeck Risk To Reward, check something else such as divergence:
🟢 Another Long Example:
🔴 Frist Simple Short Condition = It Look At The Trend Wait For RSI Cross 70 Number Then Ckeck Risk To Reward, check something else such as divergence:
🔴 Another Short Example:
The following steps provide a very brief set of instructions that will get you started but will most certainly not produce the best backtest. A trading system that you are willing to risk your hard earned capital will require a well crafted configuration that involves time, expertise and clearly defined goals. As previously mentioned, I have several example configs that I use for my own trading that I can share with you along with a PDF which describes each input in detail. To get hands on experience in setting up your own symbol from scratch please follow the steps below.
The input dialog box contains over 12 inputs, There are four options must to be configured: Choose Target, side, Choose Settings, Money Management,and settings that apply to both. The following steps address these four main options only.
Money Management System For Leverage 10:
Bot Finds Last Lower Low And Calculate Distance From Entry Price, Then Cross It To Initial Capitan And Cross Leverage =>
Position_Size = (((1.64) * (initial Capital)) * (leverage))
And Check Dominances Too For Getting Best Money Management Result
🔵 Settings
* Side, You Can Set Long Or Short Or Both.
* Choose Target, You Can Set One Target Or All Targets.
* Money Management, You Can ON Or OFF It, With OFF You Can USE It For SPOT Trades.
* Choose Settings, In This Field You Can Set Mathematical Optimization, Ddepends On Which Pair You USE.
* Clear With Daily PullBack?, With This Check Box You Can Clear Signals With Daily PullBack.
* Long X, You Can Set Long Leverage.
* Short X, You Can Set Short Leverage.
* Second Order X, You Can Set Pyramiding Leverage.
* Target Long, You Can Set Percent For Long Target.
* Target Short, You Can Set Percent For Short Target.
* Short Martin Percent, You Can Set Short Martingale Percent.
* Long Martin Percent, You Can Set Long Martingale Percent.
🟡 Pyraming 3
🟡 Commission Is 0.065 %
🟡 Slippage Is 10 ticks
🔴Only Use For 1 Hour Chart
🔴 CONCLUSION
We believe that success lies in the association of the user with the indicator, opposed to many traders who have the perspective that the indicator itself can make them become profitable. The reality is much more complicated than that.
The aim is to provide an indicator comprehensive, customizable, and intuitive enough that any trader can be led to understand this truth and develop an actionable perspective of technical indicators as support tools for decision making.
🔴 RISK DISCLAIMER
Trading is risky & most day traders lose money. All content, tools, scripts, articles, & education provided by BitBell are purely for informational & educational purposes only. Past performance does not guarantee future results.

Pressure Pivots - MPI (Strategy)⇋ PRESSURE PIVOTS — MARKET PRESSURE INDEX STRATEGY
A comprehensive reversal trading system that combines order flow pressure analysis, multi-factor confluence detection, and adaptive machine learning to identify high-probability turning points in liquid markets.
━━━━━━━━━━━━━━━━━━━━━━━━━━━━━━━━━━━━━
CORE INNOVATION: MARKET PRESSURE INDEX (MPI)
Traditional indicators measure price movement. The Market Pressure Index measures the force behind the movement.
How MPI Works:
Every bar tells two stories through volume distribution:
• Buy Pressure: Volume × (Close - Low) / (High - Low)
• Sell Pressure: Volume × (High - Close) / (High - Low)
• Net Pressure: Buy Pressure - Sell Pressure
This raw pressure is then normalized against baseline activity to create the bounded MPI (-1.0 to +1.0):
• Smooth Pressure: EMA(Net Pressure, period)
• Baseline Activity: SMA(|Net Pressure|, period × 2)
• MPI: (Smooth Pressure / Baseline) × Sensitivity
What MPI Reveals:
MPI > +0.7: Extreme buy pressure → Exhaustion potential
MPI = +0.2 to +0.7: Healthy bullish momentum
MPI = -0.2 to +0.2: Neutral/balanced pressure
MPI = -0.7 to -0.2: Healthy bearish momentum
MPI < -0.7: Extreme sell pressure → Exhaustion potential
Why It Works:
Two bars can both move 10 points, but if one closes at the high on high volume (aggressive buying) and the other closes mid-range on average volume (weak buying), only MPI distinguishes between sustainable momentum and exhaustion. This volume-weighted pressure analysis reveals conviction behind price moves—the key to timing reversals.
━━━━━━━━━━━━━━━━━━━━━━━━━━━━━━━━━━━━━
SEVEN-FACTOR CONFLUENCE SYSTEM
MPI extremes alone aren't enough. The system requires multiple independent confirmations through weighted scoring:
1. DIVERGENCE (Weight: 3.0) — Premium Signal Type: DIV
Price makes new high but MPI makes lower high (or inverse for bullish)
• Detection: Tracks pivots with 5-bar lookback, compares price vs MPI at pivot points
• Signal: Purple triangles, highest weight (pressure weakening while price extends)
2. LIQUIDITY SWEEP (Weight: 2.5) — Premium Signal Type: LIQ
Price breaks swing high/low within 0.3 ATR then reverses
• Detection: Break within tolerance + close back through level
• Signal: Orange triangles, second-highest weight (stop hunt reversal)
3. ORDER FLOW IMBALANCE (Weight: 2.0) — Premium Signal Type: OF
Aggressive buying/selling 50% above normal
• Detection: EMA(aggressive volume) vs SMA(imbalance) threshold
• Signal: Aqua triangles, institutional positioning
4. VELOCITY EXHAUSTION (Weight: 1.5)
Parabolic move (2+ ATRs in 3 bars) + extreme MPI
• Detection: |3-bar price change / ATR| > threshold + MPI > ±0.5
• Indicates: Momentum deceleration, blow-off top/bottom
5. WICK REJECTION (Weight: 1.5)
Single bar: wick > 60% of range, or sequence: 2 bars with 40% + 30% wicks
• Detection: Shooting stars (bearish) or hammers (bullish)
• Indicates: Intrabar rejection, battle won by opposing side
6. VOLUME SPIKE (Weight: 1.0)
Volume > 20-bar average × multiplier (default: 2.0x)
• Detection: Participation surge confirmation
• Lowest weight: Can be manipulated, better as confirmation
7. POSITION FACTOR (Weight: 1.0)
At 10-bar highest (bearish) or lowest (bullish)
• Detection: Structural positioning for reversal
• Base requirement: Must be at extreme to score
Scoring Logic:
Premium Signals (DIV/LIQ/OF): Must score ≥6.0 (default premiumThreshold)
Standard Signals (STD): Must score ≥4.0 (default standardThreshold)
Example Scoring:
Divergence (3.0) + Liquidity Sweep (2.5) + Volume (1.0) = 6.5 → FIRES (DIV signal)
Recent High (1.0) + Wick (1.5) + Volume (1.0) + Velocity (1.5) = 5.0 → FIRES (STD signal)
━━━━━━━━━━━━━━━━━━━━━━━━━━━━━━━━━━━━━
ADAPTIVE LEARNING ENGINE
Unlike static strategies, this system learns from every trade and optimizes itself.
Performance Tracking:
Every trade records:
• Entry Score: Confluence level at entry
• Signal Type: DIV / LIQ / OF / STD
• Win/Loss: Boolean outcome
• R-Multiple: (Exit - Entry) / (Entry - Stop)
• MAE: Maximum Adverse Excursion (worst drawdown)
• MFE: Maximum Favorable Excursion (best profit reached)
Three Adaptive Parameters:
1. Signal Threshold Adaptation
If Win Rate < Target (45%): RAISE threshold → fewer signals, better quality
If Win Rate > Target + 10% AND good R: LOWER threshold → more signals, profitable
2. Stop Distance Adaptation
If Avg MAE > 0.85 AND WR < 50%: WIDEN stops → reduce premature exits
If Avg MAE < 0.4 AND WR > 55%: TIGHTEN stops → reduce risk
3. Target Distance Adaptation
If Avg MFE > Target × 1.5: EXTEND targets → capture more of runners
If Avg MFE < Target × 0.7: SHORTEN targets → take profits faster
Signal Type Filtering:
The system tracks performance by type (DIV/LIQ/OF/STD):
• If Type WR < 40% AND Avg R < 0.8: Type DISABLED
• If Type WR ≥ 40% OR Avg R ≥ 0.8: Type RE-ENABLED
Example: If OF signals consistently lose while DIV signals win, system automatically stops taking OF signals and focuses on DIV.
Warmup Period:
First 30 trades (default) gather baseline data with relaxed thresholds. After warmup, full adaptation activates.
━━━━━━━━━━━━━━━━━━━━━━━━━━━━━━━━━━━━━
COMPLETE POSITION MANAGEMENT
Dynamic Position Sizing:
Base Contracts = (Equity × Risk%) / (Stop Distance × Point Value)
Then multiplied by:
• Score Bonus: Up to +50% for highest-scoring signals
• Signal Type Bonus: DIV signals +50%, LIQ signals +30%
• Streak Multiplier: After 3 losses: 50% reduction, After 3 wins: 25% increase
Example: High-scoring DIV signal on winning streak = 3-4× larger position than weak STD signal on losing streak
Entry Modes:
Single Entry: Full size at once, exit at TP2 (or partial at TP1)
Tiered Entry: 40% at TP1 (2R), 60% at TP2 (4R adaptive)
Stop Management (3 Modes):
Structural: Beyond recent 20-bar swing high/low + buffer
ATR: Fixed ATR multiplier (default: 2.0 ATR, then adapts)
Hybrid: Attempt structural, fallback to ATR if invalid
Plus:
• Breakeven: Move stop to entry ± 1 tick when 1R reached
• Trailing: Activate when 1.5R reached, trail 0.8R behind price
• Max Loss Override: Cap dollar risk regardless of calculation
Target Management:
Fixed Mode: TP1 = 2R, TP2 = 4R
Adaptive Mode: TP1 = 2R fixed, TP2 adapts based on MFE analysis
Partial Exits: Default 50% at TP1, remainder at TP2 or trailing stop
━━━━━━━━━━━━━━━━━━━━━━━━━━━━━━━━━━━━━
COMPREHENSIVE RISK CONTROLS
Daily Limits:
• Max Daily Loss: $2,000 default → HALT trading
• Max Daily Trades: 15 default → prevent overtrading
• Max Concurrent: 2 positions → limit correlation risk
Session Controls:
• Trading Hours: Specify start/end times + timezone
• Weekend Block: Optional (avoid crypto weekend volatility)
Prop Firm Protection (Live Trading Only):
• Daily Loss Limit: Stricter of general or prop limit ($1,000 default)
• Trailing Drawdown: Tracks high water mark, HALTS if breach ($2,500 default)
• Reset on Reload: Optional high water mark reset
Liquidity Filter (Optional):
• Time-Based: Avoid first/last X minutes of session
• Volume-Based: Require minimum volume ratio (0.5× average default)
Market Regime Filter (Optional):
• ADX-Based: Only trade when ADX > threshold (trending)
• Block: Consolidation (ADX < 20) or Transitional regimes
━━━━━━━━━━━━━━━━━━━━━━━━━━━━━━━━━━━━━
REAL-TIME DASHBOARD
MPI Gauge Section:
Shows current pressure: 🟢 STRONG BUY (+0.5 to +1.0), 🟩 BUY PRESSURE (+0.2 to +0.5), ⚪ NEUTRAL (-0.2 to +0.2), 🟥 SELL PRESSURE (-0.5 to -0.2), 🔴 STRONG SELL (-1.0 to -0.5)
Signal Status Section:
• Active Signals: "🔴 DIV SELL" (purple background), "🟢 LIQ BUY" (orange), "🔵 OF SELL" (aqua), "🟢 STD BUY" (green)
• Warnings: "⚠️ BEAR WARNING" / "⚠️ BULL WARNING" (yellow) — setup forming, not full signal
• Scanning: "⏳ SCANNING..." (gray) — no signal active
• Confidence Bar: Visual score display "██████░░░░" showing confluence strength
Divergence Indicator:
"🟣 BEARISH DIVERGENCE" or "🟡 BULLISH DIVERGENCE" when detected
Performance Statistics:
• Overall Win Rate: Wins/Total with visual bar (lime ≥70%, yellow 50-70%, red <50%)
• Directional: Bearish vs Bullish win rates separately
• By Signal Type: DIV / LIQ / OF / STD individual performance tracking
━━━━━━━━━━━━━━━━━━━━━━━━━━━━━━━━━━━━━
KEY PARAMETERS EXPLAINED
🎯 Pressure Engine:
• MPI Period (5-50, default: 14): Smoothing period — lower for scalping, higher for position trading
• MPI Sensitivity (0.5-5.0, default: 1.5): Amplification — lower compresses range, higher more extremes
🔍 Detection:
• Wick Threshold (0.3-0.9, default: 0.6): Minimum wick-to-range ratio for rejection
• Volume Spike (1.2-3.0x, default: 2.0): Multiplier above average for spike
• Aggressive Ratio (0.5-0.9, default: 0.65): Close position in range for aggressive orders
• Velocity Threshold (1.0-5.0 ATR, default: 2.0): ATR-normalized move for exhaustion
• MPI Extreme (0.5-0.95, default: 0.7): Level considered overbought/oversold
⚖️ Weights:
• Divergence: 3.0 (highest — pressure weakening)
• Liquidity: 2.5 (second — stop hunts)
• Order Flow: 2.0 (institutional positioning)
• Velocity: 1.5 (momentum exhaustion)
• Wick: 1.5 (rejection patterns)
• Volume: 1.0 (lowest — can be manipulated)
🎚️ Thresholds:
• Premium (4.0-15.0, default: 6.0): Score for DIV/LIQ/OF signals
• Standard (2.0-8.0, default: 4.0): Score for STD signals
• Warning Confluence (1-4, default: 2): Factors for yellow diamond warnings
🧬 Adaptive:
• Enable (true/false, default: true): Master learning switch
• Warmup Trades (5-100, default: 30): Data collection before adaptation
• Lookback (20-200, default: 50): Recent trades for performance calculation
• Adapt Speed (0.05-0.50, default: 0.15): Parameter adjustment rate
• Target Win Rate (30-70%, default: 45%): Optimization goal
• Target R-Multiple (0.5-5.0, default: 1.5): Risk/reward goal
💼 Position:
• Base Risk (0.1-10.0%, default: 1.5%): Equity risked per trade
• Max Contracts (1-100, default: 10): Hard position limit
• DIV Bonus (1.0-3.0x, default: 1.5): Size multiplier for divergence signals
• LIQ Bonus (1.0-3.0x, default: 1.3): Size multiplier for liquidity signals
🛡️ Stops:
• Mode (Structural/ATR/Hybrid, default: ATR): Stop placement method
• ATR Multiplier (0.5-5.0, default: 2.0): Stop distance in ATRs (adapts)
• Breakeven at (0.3-3.0R, default: 1.0R): When to move stop to entry
• Trail Trigger (0.5-5.0R, default: 1.5R): When to activate trailing
• Trail Offset (0.3-3.0R, default: 0.8R): Distance behind price
🎯 Targets:
• Mode (Fixed/Adaptive, default: Fixed): Target placement method
• TP1 (0.5-10.0R, default: 2.0R): First target for partial exit
• TP2 (1.0-15.0R, default: 4.0R): Final target (adapts in adaptive mode)
• Partial % (0-100%, default: 50%): Position percentage to exit at TP1
━━━━━━━━━━━━━━━━━━━━━━━━━━━━━━━━━━━━━
PROFESSIONAL USAGE PROTOCOL
Phase 1: Paper Trading (Weeks 1-4)
• Setup: Default settings, all adaptive features ON, 0.5% base risk
• Goal: 30+ trades for warmup, observe MPI behavior and signal frequency
• Adjust: MPI sensitivity if stuck near neutral or always at extremes
• Threshold: Raise/lower if too many/few signals
Phase 2: Micro Live (Weeks 5-8)
• Requirements: WR >43%, at least one type >55%, Avg R >0.8
• Setup: 10-25% intended size, 0.5-1.0% risk, 1 position max
• Focus: Execution quality, match dashboard performance
• Journal: Screenshot every signal, track outcomes
Phase 3: Full Scale (Month 3+)
• Requirements: WR >45% over 50+ trades, Avg R >1.2, drawdown <15%
• Progression: Months 3-4 (1.0-1.5% risk), 5-6 (1.5-2.0%), 7+ (1.5-2.5%)
• Maintenance: Weekly dashboard review, monthly deep analysis
• Warnings: Reduce size if WR drops >10%, consecutive losses >7, or drawdown >20%
━━━━━━━━━━━━━━━━━━━━━━━━━━━━━━━━━━━━━
DEVELOPMENT INSIGHTS
The Pressure Insight: Emerged from analyzing intrabar volume distribution. Within every candlestick, volume accumulates at different price levels. MPI deconstructs this to reveal conviction behind moves.
The Confluence Challenge: Early versions using MPI extremes alone achieved only 42% win rate. The seven-factor confluence system emerged from testing which combinations produced reliable reversals. Divergence + liquidity sweep became the strongest setup (68% win rate in isolation).
The Adaptive Breakthrough: Per-signal-type performance tracking revealed DIV signals winning at 71% while OF signals languished at 38%. Adaptive filtering disabled weak types automatically, recovering win rate from 39% to 54% during the 2022 volatility spike.
The Position Sizing Revelation: Dynamic sizing based on signal quality and recent performance increased Sharpe ratio from 1.2 to 1.9 while decreasing max drawdown from 18% to 12% over 500 trades. Bigger positions on better signals = geometric edge amplification.
The Risk Control Lesson: Testing with $50K accounts revealed catastrophic failure modes: daily loss cascades, overtrading commission bleed, weekend gap blowouts. Multi-layer controls (daily limits, concurrent caps, prop firm protection) became essential.
━━━━━━━━━━━━━━━━━━━━━━━━━━━━━━━━━━━━━
LIMITATIONS & ASSUMPTIONS
What This Is NOT:
• NOT a Holy Grail: Typical performance 52-58% WR, 1.3-1.8 avg R, probabilistic edge
• NOT Predictive: Identifies high-probability conditions, doesn't forecast prices
• NOT Market-Agnostic: Best on liquid auction-driven markets (futures, forex, major crypto)
• NOT Hands-Off: Requires oversight for news events, gaps, system anomalies
• NOT Immune to Regime Changes: Adaptive engine helps but cannot predict black swans
Critical Assumptions:
1. Volume reflects intent (valid for regulated markets, violated by wash trading)
2. Pressure extremes mean-revert (true in ranging/exhaustion, fails in paradigm shifts)
3. Stop hunts exist (valid in liquid markets, less in thin/random walk periods)
4. Past patterns persist (valid in stable regimes, fails when structure fundamentally changes)
Works Best On: Major futures (ES, NQ, CL), liquid forex pairs (EUR/USD, GBP/USD), large-cap stocks, BTC
Performs Poorly On: Low-volume stocks, illiquid crypto pairs, news-driven headline events
━━━━━━━━━━━━━━━━━━━━━━━━━━━━━━━━━━━━━
RISK DISCLOSURE
Trading futures, forex, and leveraged instruments involves substantial risk of loss and is not suitable for all investors. Past performance is not indicative of future results. This strategy is provided for educational purposes only and should not be construed as financial advice.
The adaptive engine learns from historical data—there is no guarantee that past relationships will persist. Market conditions change, volatility regimes shift, and black swan events occur. No strategy can eliminate the risk of loss.
Users must validate performance on their specific instruments and timeframes before risking capital. The developer makes no warranties regarding profitability or suitability. Users assume all responsibility for trading decisions and outcomes.
"The market doesn't care about your indicators. It only cares about pressure—who's willing to pay more, who's desperate to sell. Find the exhaustion. Trade the reversal. Let the system learn the rest."
Taking you to school. — Dskyz, Trade with insight. Trade with anticipation.

DCA Alpha 1.0 Trading Tool for Dollar-Cost Averaging
Description:
DCA Alpha 1.0 is a precision-engineered trading tool designed to assist traders and investors in accumulating assets during market downturns. Using proprietary algorithms that combine momentum decay, extreme price deviation metrics, trend dynamics, divergence analysis, and mean regression, it identifies potential bottom extreme zones in various asset classes such as indices, stocks, crypto, and commodities.
This indicator highlights market conditions where assets are oversold, undervalued, or experiencing capitulation—providing disciplined, unleveraged dollar-cost averaging (DCA) opportunities. Ideal for long-term growth strategies, DCA Alpha 1.0 helps cut through market noise, pinpointing moments of peak fear and maximum reward potential.
Whether navigating volatile crypto markets, timing corrections in indices, or accumulating commodities, DCA Alpha 1.0 serves as a vital tool for mastering the art of buying low and building your assets up strategically.
Instructions:
Getting Started:
Add the Indicator:
Install DCA Alpha 1.0 on your TradingView chart.
Select your preferred asset class: stocks, indices, crypto, or commodities.
Choose an appropriate timeframe (e.g., daily or weekly for long-term DCA strategies).
Customize Inputs: Adjust the following settings to align with your strategy:
Percentage of Equity to Trade: Define the portion of your portfolio to allocate per signal (default: 1% equity).
Profit Target Percentages: Set thresholds for locking in gains (default: 50% on lower timeframes, 500% on higher timeframes).
Zones and Signals:
Extreme Negative Zones:
What It Represents:
These zones highlight conditions where prices are deeply oversold, indicating extreme bearish sentiment. The market is likely nearing a bottom, offering high-probability buying opportunities.
Entry Signals:
When the price enters these extreme negative zones, visual markers (e.g., green triangles or other indicators) will signal a potential buying opportunity. These moments are indicative of market exhaustion, signaling that a reversal could be imminent.
Momentum Decay & Divergence:
Momentum decay occurs when price movement slows over time. In extreme negative zones, if prices continue to fall but at a diminishing rate (e.g., decreased volume or a fading oscillator), it suggests weakening bearish momentum. This, coupled with bullish divergence (oscillator forming higher lows while price makes lower lows), signifies a reversal, making it an ideal point to consider dollar-cost averaging into the asset.
Neutral Zones:
What It Represents:
The neutral zone is a state of market equilibrium, where prices are neither overbought nor oversold. The market is in a balanced state, with no strong trend emerging.
Mean Regression:
In a neutral zone, the market is reverting to its mean or average price after overreacting in either direction. A price transition from extreme zones (overbought/oversold) to the neutral zone suggests a reversion to the market's long-term average, making this a period of reduced volatility and uncertainty.
Entering or Exiting Neutral Zones:
Traders should avoid entering or exiting positions during neutral zone conditions unless transitioning from an extreme zone (negative or positive). Transitioning from an extreme negative zone to neutral may suggest an opportunity to accumulate assets gradually, while a shift from neutral to an extreme negative zone may indicate a deeper correction and warrant caution.
Momentum Decay & Divergence (Exiting Neutral Zone):
If prices are rising but the oscillator shows lower highs (bearish divergence), and momentum is fading, this could signal a pullback. A transition out of the neutral zone in this context may prompt traders to hold off on new positions or consider profit-taking.
Extreme Positive Zones:
What It Represents:
Markets can also become overbought or overvalued. When price enters extreme positive zones, the asset may be overvalued, suggesting potential selling or a waiting period.
Exit Signals:
Red triangle indicators signal potential exit points when prices reach overbought conditions, signaling a time to lock in profits and reduce exposure.
Momentum Decay & Divergence (Exiting Positive Zone):
When prices are making new highs but momentum is weakening (momentum decay) and the oscillator is showing lower highs (bearish divergence), this could indicate a faltering rally. Such conditions represent an ideal time to reduce exposure or exit positions.
Key Inputs for Customization:
Percentage of Equity to Trade:
This setting allows you to allocate a portion of your total portfolio per buy signal. By default, 1% of equity is used per signal, but this can be adjusted based on your risk tolerance and strategy.
Profit Target Percentages:
These thresholds help lock in gains once the price moves a set percentage in your favor.
Lower Timeframes: Default profit target of 50%.
Higher Timeframes: Default profit target of 500%.
These settings can be customized for specific risk/reward preferences.
Warning!!! : Aggressive Mode
Aggressive Mode is an advanced feature designed for traders who want to increase the frequency of signals during periods of market volatility. This mode will trigger more frequent entries, even into slightly less extreme zones, capturing short-term reversals.
What Aggressive Mode Does:
It amplifies signals by allowing the tool to identify more frequent price reversals, including brief market corrections, increasing trade frequency. While this can offer more trading opportunities, it also exposes you to higher risk.
Warning:
Aggressive Mode should be used only by experienced traders familiar with short-term volatility. The increased frequency of signals could lead to higher risk exposure. Ensure robust risk management practices, such as stop-loss orders and profit-taking strategies, are in place before activating this mode.
Default Setting:
Aggressive Mode is disabled by default. It can be activated at your discretion based on your experience level and risk appetite.
Best Practices:
Focus on High-Quality Assets: Prioritize assets with strong recovery potential (e.g., major indices, blue-chip cryptocurrencies).
Use Longer Timeframes: Minimize market noise and optimize your DCA strategy by focusing on higher timeframes (e.g., daily or weekly charts).
Review Trading Inputs: Regularly adjust your inputs to ensure they align with your financial goals and risk tolerance.
Implement Risk Management: Use stop-loss orders and profit targets to manage risk, especially when using Aggressive Mode.
Disclaimer:
DCA Alpha 1.0 is designed specifically for unleveraged, long-term dollar-cost averaging strategies. It is not intended for day trading or leveraged positions. The tool excels at identifying market dips but cannot guarantee success. Users are fully responsible for their own risk management, including the use of stop-losses, profit targets, and position sizing.
Aggressive Mode increases trade frequency and may lead to higher exposure and potential losses. Only experienced traders should consider using this mode. Always understand the risks involved before incorporating this tool into your trading strategy.

Combo Backtest 123 Reversal & Smoothed Williams ADThis is combo strategies for get a cumulative signal.
First strategy
This System was created from the Book "How I Tripled My Money In The
Futures Market" by Ulf Jensen, Page 183. This is reverse type of strategies.
The strategy buys at market, if close price is higher than the previous close
during 2 days and the meaning of 9-days Stochastic Slow Oscillator is lower than 50.
The strategy sells at market, if close price is lower than the previous close price
during 2 days and the meaning of 9-days Stochastic Fast Oscillator is higher than 50.
Second strategy
Accumulation is a term used to describe a market controlled by buyers;
whereas distribution is defined by a market controlled by sellers.
Williams recommends trading this indicator based on divergences:
Distribution of the security is indicated when the security is making
a new high and the A/D indicator is failing to make a new high. Sell.
Accumulation of the security is indicated when the security is making
a new low and the A/D indicator is failing to make a new low. Buy.
WARNING:
- For purpose educate only
- This script to change bars colors.

DepthHouse BTC MO Backtest [Strategy]NOTE: Only works on BTC
All testing was done on 1hr Timeframe.
Past performance Is no guarantee of future results.
This is a experimental indicator - use at your own risk.
This is an experimental backtest strategy for the original DepthHouse BTC Momentum Oscillator
The idea of this is to aid traders in finding the best indicators settings to match their trading style.
---BTC MO SIgnals---
Signal Line: Generally, if the Signal Line is greater than 0, then there is more bullish momentum in the market
Tops & Bottoms: Signals used to help spot where BTC 0.96% momentum may have topped or bottomed out
Possible Divergences: Used to help spot possible reversals on continuous trends
---oh92's Preset Setting---
Scalper: (20,11,17,6) Very reactive settings that I use while day trading. However, faster settings generally increase the chance of false signals(20,11,17,6)
Swing Trader: (5,25,55,10) Greatly reduces noise for my longer time trades. Generally makes 'tops' and 'bottoms' more accurate. Which can be a huge advantsge in spoting an earnly trend reversal
Custom: Allows user adjustments of all settings
Displayed: (17,32,45,7)
Try this indicator for FREE! Just leave a comment, or feel free to send me a PM
Link to the original DepthHouse BTC Momentum Oscillator :

Smoothened Williams Accumulation/Distribution (Williams AD) Accumulation is a term used to describe a market controlled by buyers;
whereas distribution is defined by a market controlled by sellers.
Williams recommends trading this indicator based on divergences:
Distribution of the security is indicated when the security is making
a new high and the A/D indicator is failing to make a new high. Sell.
Accumulation of the security is indicated when the security is making
a new low and the A/D indicator is failing to make a new low. Buy.
You can change long to short in the Input Settings
WARNING:
- For purpose educate only
- This script to change bars colors.

Williams Accumulation/Distribution (Williams AD) Backtest Accumulation is a term used to describe a market controlled by buyers;
whereas distribution is defined by a market controlled by sellers.
Williams recommends trading this indicator based on divergences:
Distribution of the security is indicated when the security is making
a new high and the A/D indicator is failing to make a new high. Sell.
Accumulation of the security is indicated when the security is making
a new low and the A/D indicator is failing to make a new low. Buy.
You can change long to short in the Input Settings
WARNING:
- For purpose educate only
- This script to change bars colors.
