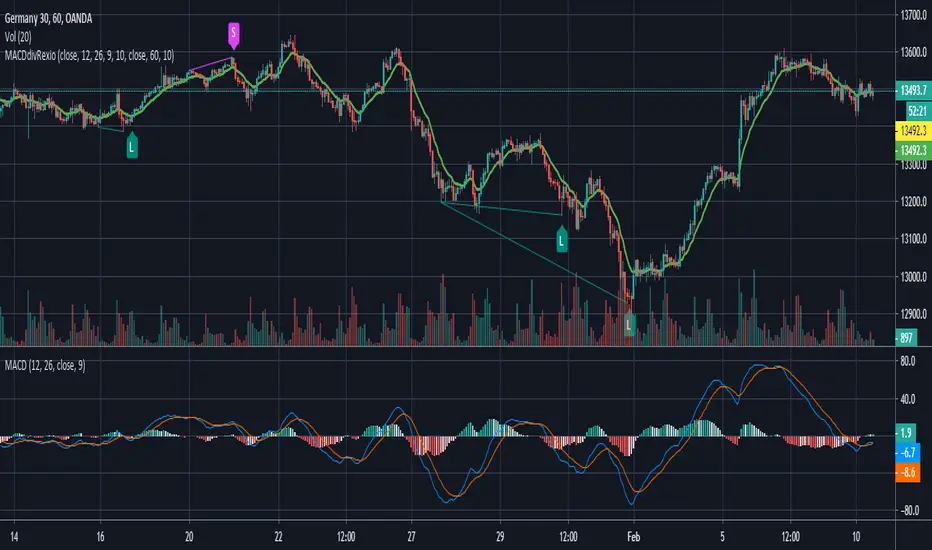
MACD divergence with line drawing by RexioAnother appoach to finding divergences at MACD. This time I think it is much smoother so I could check for divergences between two "peaks" at MACD.
I added my SL line which is last peak +- 1xATR. And the second line is peak between two points of divergence and most of the time it acts like an SR line.
If the higher timeframe trend backs up our divergence (for example: higher trend UP - divergence for L position) I can try to jump in after crossing EMA10.
This indicator is only sugestion for me. I always check price action, trend, SR line before I take any action.
Every people who will test this indicator need to know basics about divergences as THISE ARE NOT BUY/SELL SIGNALS.
If you want to help me and support my coding please contact me via private msg.
Cari dalam skrip untuk "Divergence"
Multi Divergence Overlay +This Indicator overlays Divergences lines and labels on the chart from multiple sources including RSI, RSI Signal Line and 2 Stochastics and more
The Colors and Labels match my other Divergence Indicators
The divergence script is thanks to @RicardoSantos, I've just adjusted it to suite my indicator
Remember that divergences work best when traded with the trend or very late in a trend when going against the trend
The + Part of this indicator is that it now plots
Exhaustion pivots
&
Bob Rooker - Reversal Tabs and Knoxville Divergences

Volume Divergence IndicatorThe Volume Divergence Indicator is a powerful tool that can help traders identify potential price reversals in the market by analyzing volume data. The indicator has several features, including divergences signals, volume spikes, volume contractions, and volume trend signals.
Unlike most divergence indicators, this one is focused on providing non-repainting alerts. That is why I chose not to use pivot points.
The Volume Divergence Indicator can be used as an overlay or a non-overlay. The overlay mode displays the indicator on top of the price chart, while the non-overlay mode displays the indicator below the price chart.
The indicator has five alerts that can be used to generate alerts:
Bullish Divergence : This alert is generated when prices are making lower lows, but volume is making higher lows. This suggests that the selling pressure is weakening, and a bullish reversal may be imminent.
Bearish Divergence : This alert is generated when prices are making higher highs, but volume is making lower highs. This suggests that the buying pressure is weakening, and a bearish reversal may be imminent.
Volume Spike : This alert is generated when volume spikes above a certain threshold, such as two standard deviations above the moving average. This suggests that there is unusual buying or selling activity in the market, and traders may want to pay attention to the price movements that follow.
Volume Contraction : This alert is generated when volume contracts to a certain level, such as two standard deviations below the moving average. This suggests that there is little buying or selling activity in the market, and traders may want to be cautious until volume picks up again.
Volume Trend : This alert is generated when volume trends above or below the moving average for a certain number of periods, such as five or ten. This suggests that there is a sustained increase or decrease in buying or selling pressure, and traders may want to adjust their trading strategy accordingly.
To customize the indicator settings, users can adjust the following inputs:
Choose overlay mode: select either Overlay or Non-Overlay
Price and volume lookback: set the number of bars to look back for price and volume data
Bull and bear sensitivity: adjust the sensitivity of the bullish and bearish divergences
Volume MA length: set the length of the moving average used to calculate volume spikes and contractions
Sensitivity of spikes: adjust the sensitivity of the volume spikes
Sensitivity of contractions: adjust the sensitivity of the volume contractions
Trend sensitivity: set the number of periods to identify the volume trend
The Volume Divergence Indicator can be a valuable addition to any trader's toolkit. It can help traders identify potential price reversals in the market, as well as unusual buying or selling activity.
I am open to suggestions for further updates or additions.

RSI with Divergences, Reverse Formulas, and Bull/Bear ZonesRegular RSI indicator that can underline divergences, turn green or red specifying user specified bull/bear zones, and with a label showing the price needed to turn bull/bear!
Specify the inputs:
+ RSI Length
+ Bull Threshold
+ Bear Threshold
+ Panel Position Offset
Also with toggle-able:
+ Bullish Divergence
+ Bearish Divergence
+ Hidden Bullish Divergence
+ Hidden Bearish Divergence
The zones included in the indicator are default and not meant to be used for all markets. The goal is to alter the bull/bear zones to find good breakout points and selloff points for your chosen security. Does not currently support automatic zone creation, or saving zones for each security (if that is even possible, may just need to create different layouts for each security).
Thanks!

Better Stochastic RSI to find DivergencesThis indicator is a modified version of a stochastic RSI oscillator. I want to share this because it is really good for analysis of divergence between price action and the oscillator. You can also use it to trade overbought and oversold conditions.
To find out more what a divergences is when we talk about trading. Take a look at this: medium.com

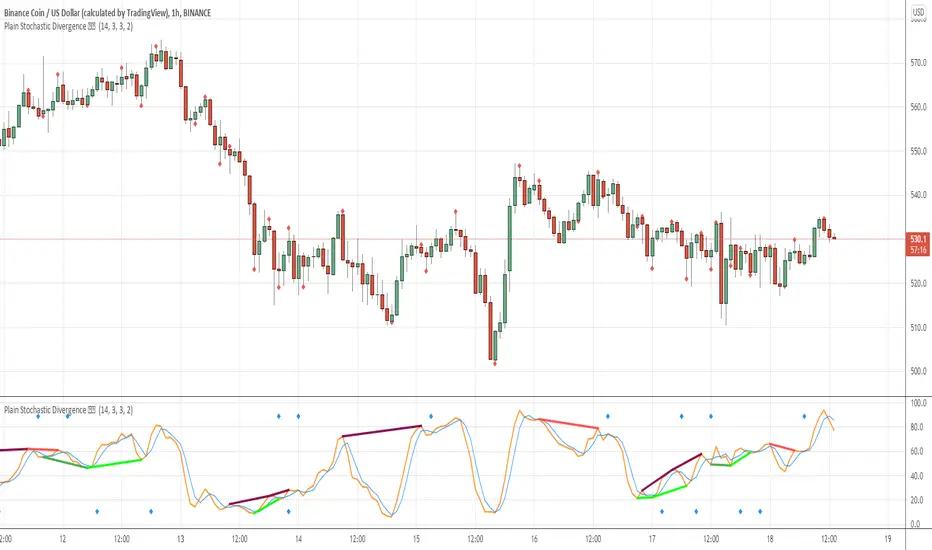
Plain Stochastic Divergence Stochastic Divergence
Plain simple way of calculating divergences
We all have times when we want to see just the divergences and nothning else
This script is minimalised to visualize that
references :
// stochastic // divergence // stoch //

Volume Weighted Average Divergence [DW]This is an experimental study inspired by the volume weighted moving average convergence divergence (VWMACD) concept.
In this formula, divergences between two volume weighted moving averages and two simple moving averages over their respective lookback periods are calculated.
The difference between the divergences is calculated, then the difference between the result and an exponential moving average of the result are calculated to provide a histogram.
Finally, the mean value between the two divergences is calculated to provide the VWAD line.
Custom bar colors are also included.

Price Divergence Detector V3 revised by JustUncleLThis is a revised version of the original "Price Divergence Detector by RicardoSantos".
Description:
Price Divergence detection for various methods : RSI, MACD, STOCH, VOLUME, ACC-DIST, FISHER, CCI, BB %B and Ehlers IdealRSI. Both Hidden and Regular Divergences are detected.
Mofidifications:
Revision 3.0 by JustUncleL
Added option to disable/enable Hidden and Regular Divergence
Added new divergence method BB %B (close only)
Added new divergence mothos Ehlers IdealRSI (close only)
Revision 2.0 - by RicardoSantos
References:
Information on Divergence Trading:
www.babypips.com
www.incrediblecharts.com (BB %B)

CVD Divergence Background By HKOverview This indicator visualizes Delta Divergences (also known as Absorption) directly on your main chart. It highlights candles where the price direction contradicts the underlying net volume flow (CVD). This is a powerful method to spot "traps," limit order absorption, and potential reversals.
How it Works The script calculates the Intrabar Volume Delta based on price action relative to the candle's range. It then compares this Delta with the candle's color (Open vs. Close).
Bearish Divergence (Absorption Top):
Scenario: The candle is GREEN (Price closed higher), but the Volume Delta is NEGATIVE (Net Selling).
Visual: Red Background.
Meaning: Sellers are aggressively absorbing the buying pressure via limit orders. Price struggled to rise despite the volume.
Bullish Divergence (Absorption Bottom):
Scenario: The candle is RED (Price closed lower), but the Volume Delta is POSITIVE (Net Buying).
Visual: Green Background.
Meaning: Buyers are aggressively absorbing the selling pressure via limit orders. Price struggled to fall despite the volume.
Features
Background Highlighting: Instantly spot divergences without checking a separate oscillator window.
Seamless Integration: Works perfectly behind your price candles and other indicators (like Big Trade detectors).
Customizable: You can adjust the colors and transparency to fit your chart theme.
Use Case Use this to identify exhausted moves. If you see a green candle with a red background at a resistance level, it suggests that buyers are running into a wall of sellers, increasing the probability of a reversal.

CDC DivergencesA handy little indicator to help identify different kinds of convergences/divergences
The indicator compares price movements with the momentum and volume movements, Hidden divergences are left out, at least in the first version, because I wanted this indicator to be as simple as possible.
The divergences are shown with labels, user can change the momentum/volume indicator used to identify divergences in the settings.

[fikira] MACD & RSI+Stoch + DivergencesThis is a new version of my "Divergences"
Compared to my "Divergences (Pivots)", this is calculated totally different
There are 3 options:
- MACD
- RSI
- Stoch RSI
Since this script is very heavy in calculation it is limited in time (= inspired from a script of "Che_Trader")
Also it uses "max_bars_back" (=1000)
For MACD and Stoch RSI there is a "custom Divergences Period", which compares more then 7 Pivot Points,
the higher the number, the less reliable, it is not necessary to use this, but it is there,
also you can change the "leftbars" and "rightbars", again, it is not necessary to change, but you can...
Linewidth and style of the Divergences lines can be changed
Thank you!

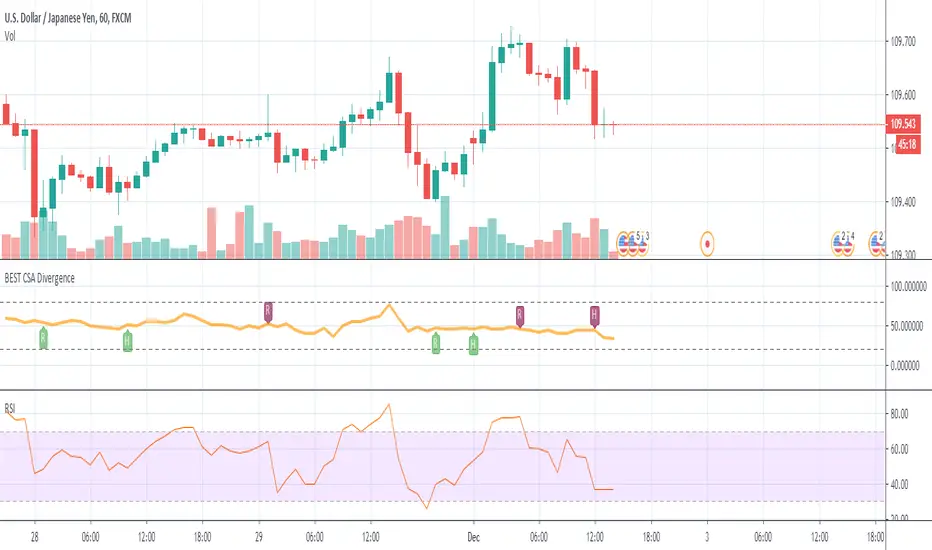
BEST Currency Strength Indicator DivergenceHello traders
Hope you had a great Thanksgiving
Now it's my turn to give and all I ask in return is you to be thankful (did I get the "Thanksgiving" thing right?)
The Currency Strength Indicator plots an average of the selected FX pairs in the indicator.
Someone asked me if I could develop an alternative of that script adding a divergence component.
The script evaluates the divergences between the average of the selected RSI(FOREX pairs) and the RSI(FOREX pair) displayed on the chart.
This version includes new features such as:
- the RSI length can now be selected
- we can select the 6 pairs used for the divergence calculations
All the BEST my aspiring traders and quants
See you tomorrow for another script
Dave
OBV Divergence +This study Plots Divergences for OBV along with 2 MA's
Choose between standard type of OBV and OBV Accumulation / Distribution thanks to spacetrader which seems to be a truer reading
Divergence Alerts are provided so that you dont have to stare at your screen all day

MA Divergence 2060Show the divergence between two moving averages.
If there is a cross between 20 and 60, it is a significant short-term trend change.
Look at the color of the area.
I can see the main trend at the moment.
The center of the change is the intersection of the two MA

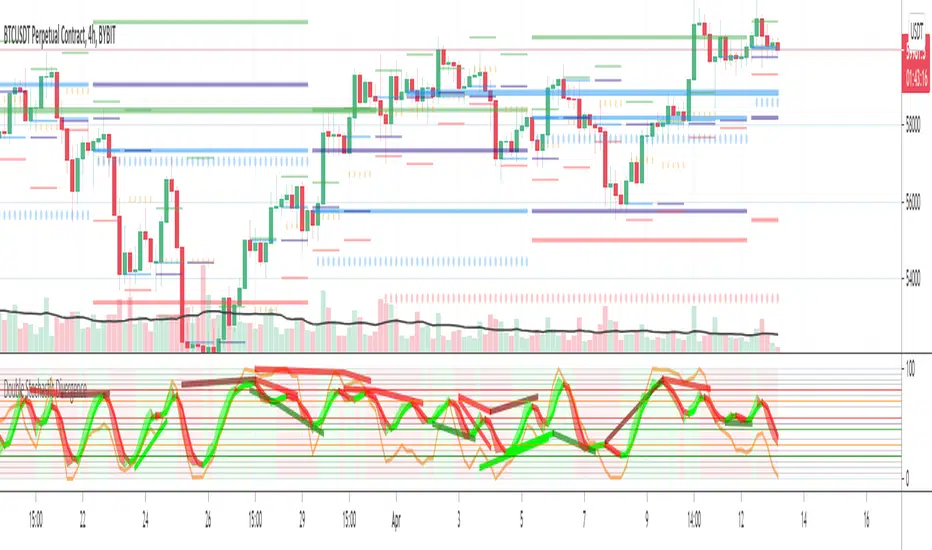
Double Stochastic DivergenceSame as my protected script but you can now see the code
This Study plots divergences and overlays a second %K as a fractal and changes the color of %D for the non fractal
Option to use Stochastic RSI for Fractal
Background Shading according to trend
Feel Free to change the indicator values to suit your style / system
The divergence script is thanks to @RicardoSantos, I've just adjusted it to suite my indicator
Remember that divergences work best when traded with the trend or very late in a trend when going against the trend
Common value for %K is 5, I have chosen 3 as it gives faster entries when using multiple time frames
If you are not using a momentum indicator as a trailing stop and using only cycle indicator
then I would recommended %K be 4 for exits
On-chart Wavetrend Divergence with PivotsThis is an OnChart WaveTrend Divergence Indicator with Pivots and Alerts
LazyBears WaveTrend Indicator or also known as "Market Cipher" is an Indicator that is based on Moving Averages, therefore its an "lagging indicator". Lagging indicators are best used in combination with leading indicators. In this script the "leading indicator" component are Daily, Weekly or Monthly Pivots. These Pivots can be used as dynamic Support and Resistance, Stoploss, Take Profit etc.
This indicator combination is best used in larger timeframes. For lower timeframes you might need to change settings to your liking.
What are those circles?
-These are the WaveTrend Divergences. Red for Regular-Bearish. Orange for Hidden-Bearish. Green for Regular-Bullish. Aqua for Hidden-Bullish.
Please keep in mind that this indicator is a tool and not a strategy, do not blindly trade signals, do your own research first! Use this indicator in conjunction with other indicators to get multiple confirmations.

[fikira] Divergences (RSI)This script can be used with candlesticks, accompanied with " RSI + Divergences"
The calculation is different than my "Divergences (Pivots)"
Thank you!

BUBD+ - Bats Ultimate Bullish Divergence DetectorBUBD checks for price divergence from oscillators across 6 different oscillators - MACD, CCI (Vol. weighted), RSI, Stochastic RSI, Money Flow and Relative Vigor index. Use it to find good entry spots for longs and also to find downtrend reversals. If this gets popular I will release a Bearish divergence indicator as well.
Please check your stock/crypto across all time frames to get a hint of any developing "Bullish" divergences.
In case you get mixed signals -
Blue - RSI
Purple - RVI
Yellow - CCI
Green - MACD
Lime light green - MFI
Orange - Stoch RSI
Dont get confused by signals appearing on top and bottom all are bullish indicators. If you see a signal go to the respective oscillator to check the developing trend.

Effort-Result Divergence [Interakktive]The Effort-Result Divergence (ERD) measures whether volume effort is producing proportional price result. It quantifies the classic Wyckoff principle: when price moves easily, momentum is real; when price struggles despite heavy volume, absorption is occurring.
Think of ERD as "energy efficiency" for price movement — green means price is gliding, red means price is grinding.
█ WHAT IT DOES
• Measures volume EFFORT relative to average volume
• Measures price RESULT relative to ATR-normalized movement
• Computes ERD = Result minus Effort (each scaled 0-100)
• Flags statistical divergences via Z-score analysis
• Absorption events: high effort, low result (negative ERD)
• Vacuum events: low effort, high result (positive ERD)
█ WHAT IT DOES NOT DO
• NO buy/sell signals
• NO entry/exit recommendations
• NO alerts (v1 is educational only)
• NO performance claims or guarantees
This is a context tool for understanding market participation quality.
█ HOW IT WORKS
The ERD analyzes two dimensions of market activity and compares them.
EFFORT (Volume Intensity)
Compares current volume to a moving average baseline:
Effort Ratio = Volume ÷ SMA(Volume, Length)
Effort Score = clamp(100 × Effort Ratio ÷ Effort Cap)
High effort means above-average volume participation.
Low effort means below-average volume participation.
RESULT (Price Efficiency)
Measures how much price moved relative to expected volatility:
Result Ratio = |Close − Previous Close| ÷ ATR
Result Score = clamp(100 × Result Ratio ÷ Result Cap)
High result means price moved significantly for the volatility regime.
Low result means price barely moved despite market activity.
ERD SCORE
ERD = Result − Effort
• Positive ERD: Result exceeds effort → price moved easily (vacuum/thin liquidity)
• Negative ERD: Effort exceeds result → price struggled (absorption/accumulation)
• Near zero: Balanced effort-to-result relationship
STATISTICAL DIVERGENCE DETECTION
Z-score analysis identifies statistically significant extremes:
Z = (ERD − Mean) ÷ StdDev
• Absorption Event: Z ≤ −threshold (extreme negative ERD)
• Vacuum Event: Z ≥ +threshold (extreme positive ERD)
█ INTERPRETATION
GREEN BARS (Positive ERD)
Price moved with relatively little volume effort. This suggests:
• Thin liquidity / low resistance
• Strong directional interest
• Momentum is "real" — not forced
RED BARS (Negative ERD)
Heavy volume was used but price barely moved. This suggests:
• Absorption / accumulation occurring
• Large players opposing the move
• Inefficiency — someone is working hard for little result
THE KEY INSIGHT
When you see:
• Down moves = high effort (red spikes)
• Up moves = low effort (green bars)
This means: It's easier for price to go up than down.
That is asymmetric strength — classic bullish pressure.
The reverse (red on up moves, green on down moves) signals bearish pressure.
PRACTICAL RULES
Without any other indicators:
• Avoid shorting when ERD is mostly green and red spikes appear only on down candles
• Be cautious buying when ERD turns red on up candles (signals absorption of buying pressure)
• Vacuum events (extreme green) often precede continuation or pause — not violent reversal
• Absorption events (extreme red) often precede reversals or range formation
█ VOLUME DATA NOTE
This indicator uses the volume variable which represents:
• Exchange volume on stocks and futures
• Tick volume on Forex and CFD instruments
Tick volume is a proxy for activity, not actual exchange volume. The indicator remains useful on Forex as relative volume comparisons are still meaningful, but interpretation should account for this limitation.
█ INPUTS
Core Settings
• Volume Average Length: Baseline period for effort calculation (default: 20)
• ATR Length: Volatility normalization period (default: 14)
• Effort Cap: Volume ratio that maps to 100% effort (default: 3.0)
• Result Cap: ATR multiple that maps to 100% result (default: 1.0)
Divergence Detection
• Z-Score Lookback: Statistical analysis window (default: 100)
• Z-Score Threshold: Standard deviations for event flags (default: 2.0)
Visual Settings
• Show ERD Histogram: Toggle main display
• Show Zero Line: Toggle reference line
• Show Divergence Markers: Toggle event circles
• Show Effort/Result Lines: Display component breakdown
█ ORIGINALITY
While Wyckoff's effort-versus-result principle is well-established, existing implementations are typically:
• Purely visual with no quantification
• Pattern-based requiring subjective interpretation
• Not statistically normalized for comparison across instruments
ERD is original because it:
1. Normalizes both effort and result to 0-100 scales for direct comparison
2. Uses ATR for result normalization (adapts to volatility regime)
3. Applies statistical Z-score for objective divergence detection
4. Provides quantified output suitable for systematic analysis
█ DATA WINDOW EXPORTS
When enabled, the following values are exported:
• Effort (0-100)
• Result (0-100)
• ERD Score
• Z-Score
• Absorption Event (1/0)
• Vacuum Event (1/0)
█ SUITABLE MARKETS
Works on: Stocks, Futures, Forex, Crypto
Best on: Instruments with reliable volume data (stocks, futures, crypto)
Timeframes: All timeframes — interpretation adapts accordingly
█ RELATED
• Market Efficiency Ratio — measures price path efficiency
• Wyckoff Volume Spread Analysis — conceptual foundation
█ DISCLAIMER
This indicator is for educational purposes only. It does not constitute financial advice. Past performance does not guarantee future results. Always conduct your own analysis before making trading decisions.

SCOTTGO - RSI Divergence IndicatorRSI Divergence Indicator
This indicator combines the Relative Strength Index (RSI) with an automatic divergence detection system.
It is designed to help traders spot potential trend changes by:
Color-Coded RSI: The main RSI line dynamically changes color (e.g., green/red) above and below a user-defined threshold (default 50) to highlight strong or weak momentum instantly.
Divergence Signals: It automatically identifies and plots four types of RSI divergences (Regular Bullish, Hidden Bullish, Regular Bearish, and Hidden Bearish) between the price and the oscillator.
Custom Alerts: Includes alerts for all divergence types so you can be notified when a new signal is found.
This tool helps visualize momentum shifts and potential reversals in the market.

RSI Multi Length With Divergence Alert [Skiploss]This is a modified indicator base code from RSI Multi Length and we will add some of functions by finding a classic/hidden divergence and alert.
The indicator returns information over RSI using multiple periods and calculates the percentage of overbought and oversold by overbought divided by oversold.
To find the divergence and hidden divergence we use base code from platform (Divergence Indicator) but change the input from normal to the average (RSI Multi Length).
RSI Settings
Maximum Length is maximum period.
Minimum Length is minimum period.
Overbought Level is value of the overbought level .
Oversold Level is value of the oversold level.
Source is input source of the indicator.
Divergence Settings
Pivot Right is value look back to the right side.
Pivot Left is value look back to the left side.
Max Range is maximum range value.
Min Range is minimum range value.
Alert Settings
It will be part of display of Divergence and Hidden Divergence.
Style Settings
Color of overbought/oversold/Bullish/Bearish which you can change as you wish.

MACD DivergencesUpdate of MACD indicator which shows the most recent, and developing, price action divergences with the histogram.
