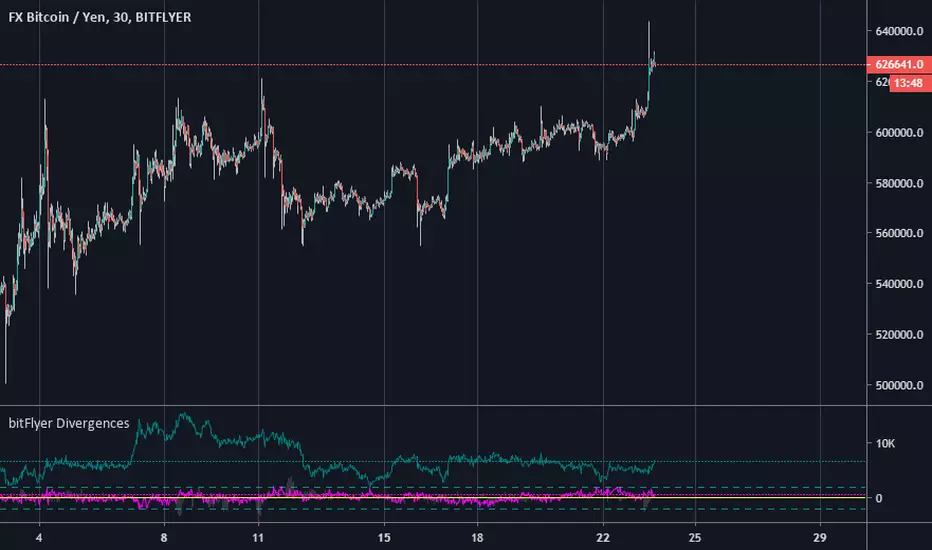
bitFlyer DivergencebitFlyer Divergence.
Basis is BitMEX:BXBT(converted into JPY).
*bitFlyer BTCJPY spot
*bitFlyer FXBTCJPY
Fuchsia(pink) = BTCJPY spot - BXBT
Teal(dark green) = FXBTCJPY - BTCJPY spot
Lime(light green) = BTCspot - BXBT
Cari dalam skrip untuk "Divergence"
KAMA Divergence [DW]This study is a simple experiment that expresses divergences between price and Kaufman's Adaptive Moving Average as a percentage. The result is then smoothed using KAMA to provide a signal line.

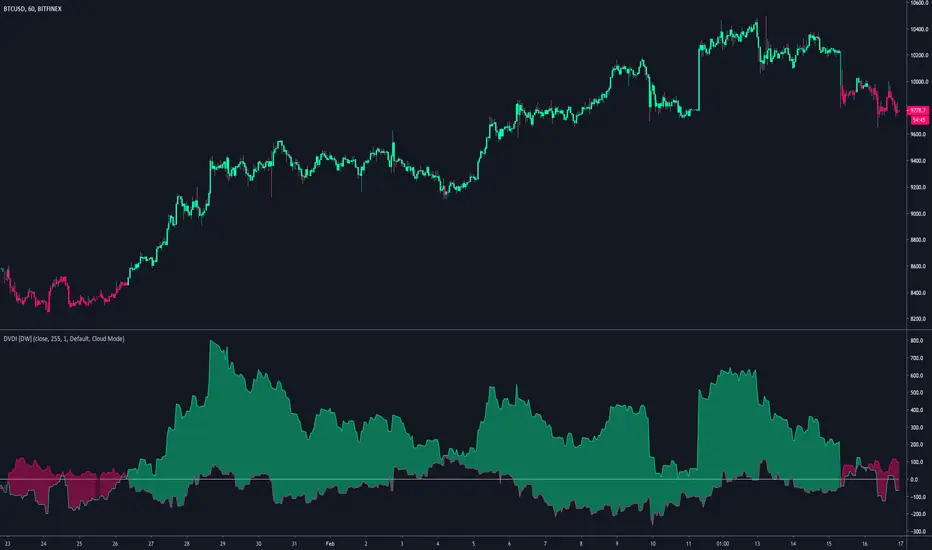
Dual Volume Divergence Index [DW]This is an experimental variation of Paul L. Dysart's Positive Volume Index and Negative Volume Index that tracks the divergences between the PVI and its EMA, and the NVI and its EMA, then plots both together for comparison.
This tool can be used to identify trending price activity.
MgGinley Dynamic Divergence [DW]This is an experimental study designed to visualize momentum and average range by expressing divergences between price and a McGinley Dynamic as a percentage.

Stochastic RSI with DivergencesTook my other Log RSI script and plugged in Stochastic RSI to see how divergences play on an oscillator with two lines. Turns out divergences are good at predicting changes in the oscillator but that doesn't mean that the oscillator will always mimic price action.
Log vs. no log is virtually the same.
Credits to
@fskrypt for introducing geometric mean
Divergences by @RicardoSantos (@JustUncleL's edit)

Money Flow Index (MFI) w/ Multi Time Frame DivergencesBack color MTF
Money Flow Index (MFI) w/ Multi Time Frame Divergences

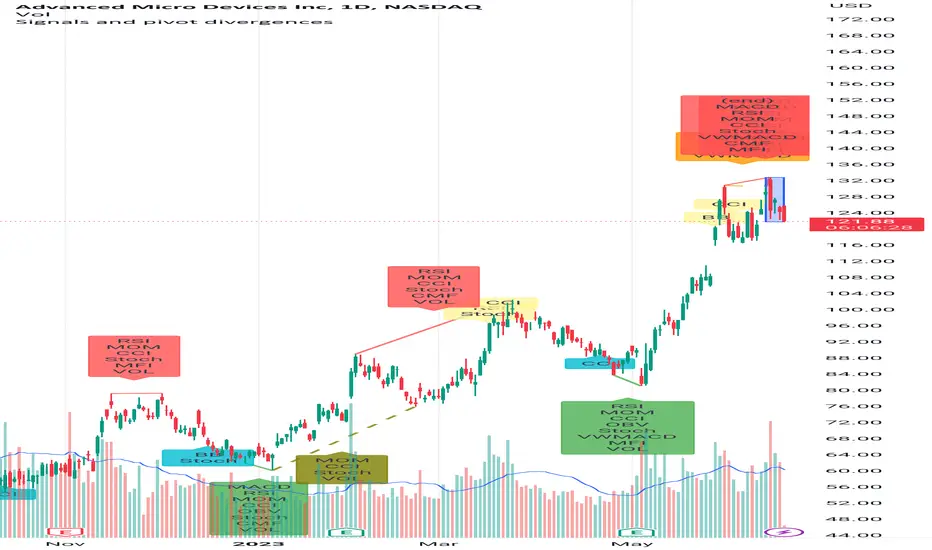
Signals and pivot divergencesScript that shows buy and sell signals for multiple indicators and divergences when there's a pivot in the price chart. The defaults are from my own laboration and don't hesitate to share your settings!
Best of trading luck!
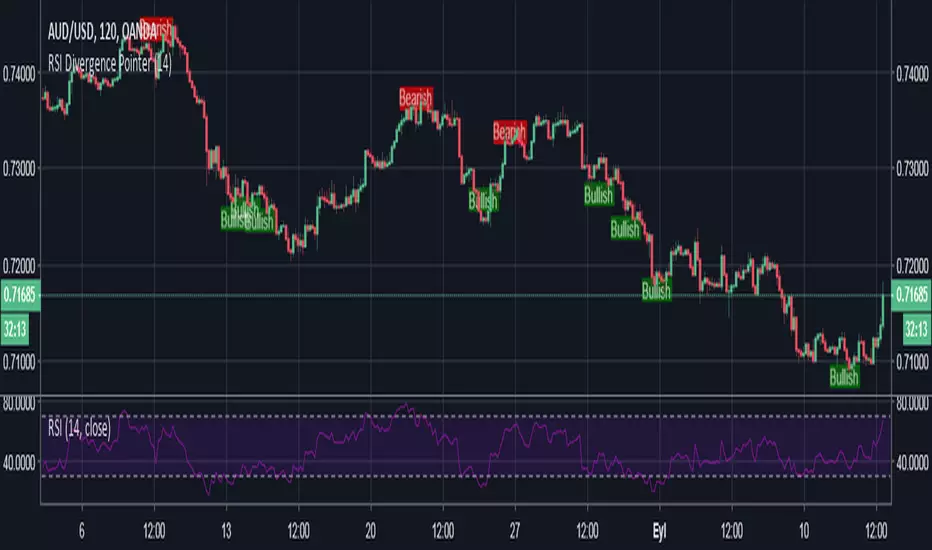
Relative Strength Index - Divergences - LibertusHello all,
To ease everyone's trading experience I made this script which colors RSI overbought and oversold conditions and as a bonus displays bullish or bearish divergences in last 50 candles (by default, you can change it).
Script is open source, part of code is from Trading View examples. If you have suggestions or you already made some improvements, please report in comment.
Happy trading and good luck!


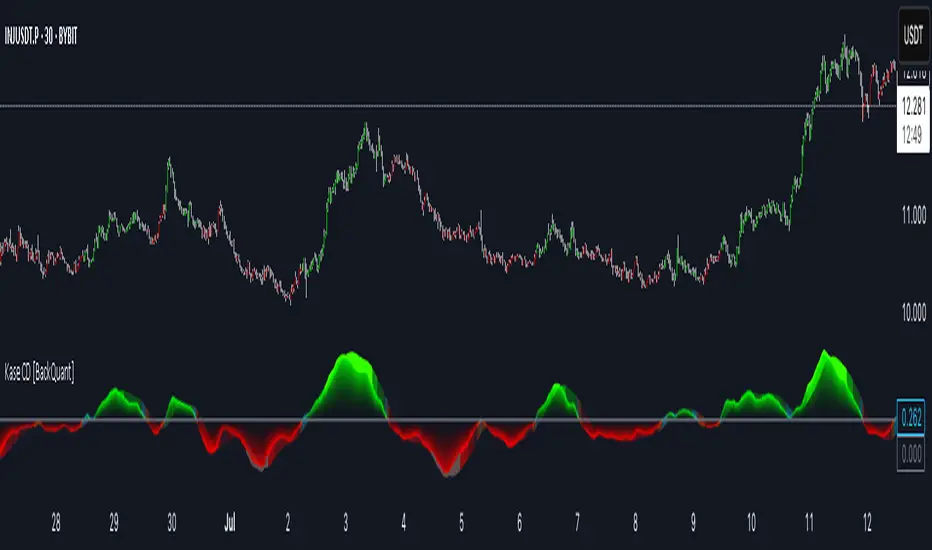
Kase Convergence Divergence [BackQuant]Kase Convergence Divergence
The Kase Convergence Divergence is a sophisticated oscillator designed to measure directional market strength through the lens of volatility-adjusted log return structures. Inspired by Cynthia Kase’s work on statistical momentum and price projection ranges, this unique indicator offers a hybrid framework that merges signal processing, multi-length sweep logic, and adaptive smoothing techniques.
Unlike traditional momentum oscillators like MACD or RSI, which rely on static moving average differences, KCD introduces a dual-process system combining:
Kase-style statistical range projection (via log returns and volatility),
A sweeping loop of lookback lengths for robustness,
First and second derivative modes to capture both velocity and acceleration of price movement.
Core Logic & Computation
The KCD calculation is centered on two volatility-normalized transforms:
KSDI Up: Measures how far the current high has moved relative to a past low, normalized by return volatility.
KSDI Down: Measures how far the current low has moved relative to a past high, also normalized.
For every length in a user-defined sweep range (e.g., 25–35), both KSDI_up and KSDI_dn are computed, and their maximum values across the loop are retained. The difference between these two max values produces the raw signal:
KPO (Kase Projection Oscillator): Measures directional skew.
KCD (Kase Convergence Divergence): Defined as KPO – MA(KPO) — similar in spirit to MACD but structurally different.
Users can choose to visualize either the first derivative (KPO) , or the second derivative (KCD) , depending on market conditions or strategy style.
Key Features
✅ Multi-Length Sweep Logic: Improves signal reliability by aggregating statistical range projections across a set of lookbacks.
✅ Advanced Smoothing Modes: Supports DEMA, HMA, TEMA, LINREG, WMA and more for dynamic adaptation.
✅ Dual Derivative Modes: Choose between speed (first derivative) or smoothness (second derivative) to fit your trading regime.
✅ Color-Encoded Signal Bands: Heatmap-style oscillator coloring enhances visual feedback on trend strength.
✅ Candlestick Painting: Optional bar coloring makes it easy to spot trend shifts on the main chart.
✅ Adaptive Fill Zones: Green and red fills between the oscillator and zero line help distinguish bullish and bearish regimes at a glance.
Practical Applications
📈 Trend Confirmation: Use KCD as a secondary confirmation layer after breakout or pullback entries.
📉 Momentum Shifts: Crossover and crossunder of the zero line highlight potential regime changes.
📊 Strategy Filters: Incorporate into algos to avoid trendless or mean-reverting environments.
🧪 Derivative Switching: Flip between KPO and KCD modes depending on whether you want to measure acceleration or deceleration of price flow.
Alerts & Signals
Two built-in alerts help you catch regime shifts in real time:
Long Signal: Triggered when the selected oscillator crosses above zero.
Short Signal: Triggered when it crosses below zero.
These events can be used to generate entries, exits, or trend validation cues in multi-layer systems.
Conclusion
The Kase Convergence Divergence goes beyond traditional oscillators by offering a volatility-normalized, derivative-aware signal engine with enhanced visual dynamics. Its sweeping architecture and dynamic fill logic make it especially powerful for identifying trending environments, filtering chop, and adding statistical rigor to your trading toolkit.
Whether you’re a discretionary trader seeking precision, or a quant looking to model more robust return structures, KCD offers a creative yet analytically grounded solution.
RSI Divergence Method█ OVERVIEW
This is a divergence indicator based on Relative Strength Index (RSI).
My attempt to make this indicator updated based on latest pine script features such as type, object and method.
█ FEATURES
1. Color of plot and label is based on contrast color of chart background. Able to customize color from style menu.
2. Big divergence (Regular Divergence) is based on lime / red color.
3. Small divergence (Hidden Divergence) is based on contrast color of chart background.
█ EXAMPLES / USAGES
[JL] Stochastic Divergence AlertCompare two cross area:
k is increasing, low is lower and previous k is less than bottom level then it is bottom divergence
k is decrease, high is higher and previous k is more than top level then it is top divergence
With long term moving average(400), seems that Stochastic Divergence is more accurate than RSI Divergence on 1m chart.

Macd Divergence + MTF EMA MACD Divergence + Multi Time Frame EMA
This Strategy uses 3 indicators: the Macd and two emas in different time frames
The configuration of the strategy is:
Macd standar configuration (12, 26, 9) in 1H resolution
10 periods ema, in 1H resolution
5 periods ema, in 15 minutes resolution
We use the two emas to filter for long and short positions.
If 15 minutes ema is above 1H ema, we look for long positions
If 15 minutes ema is below 1H ema, we look for short positions
We can use an aditional filter using a 100 days ema, so when the 15' and 1H emas are above the daily ema we take long positions
Using this filter improves the strategy
We wait for Macd indicator to form a divergence between histogram and price
If we have a bullish divergence, and 15 minutes ema is above 1H ema, we wait for macd line to cross above signal line and we open a long position
If we have a bearish divergence, and 15 minutes ema is below 1H ema, we wait for macd line to cross below signal line and we open a short position
We close both position after a cross in the oposite direction of macd line and signal line
Also we can configure a Take profit parameter and a trailing stop loss

Price Divergence AccumulatePrice divergence is a good indicator to detect a trend change.
But only check the divergence value is not enough, the time range of how long the trend continues also needs to be measured.
This indicator accumulated Price Divergence until it turns from plus to minus or minus to plus.
From this Accumulated Price Divergence
1. The upper-level (long term) trend should be supported by the lower-level (short term) trend.
if the peaks of the lower-level trend become lower and lower, it is indicating the upper-level trend might get an adjustment.
2. At the beginning of the upper-level trend
The 1st lower-level trend peak might exceed the upper-level trend. But often we see it will be corrected and 2nd lower-level trend will be underneath the upper-level trend.

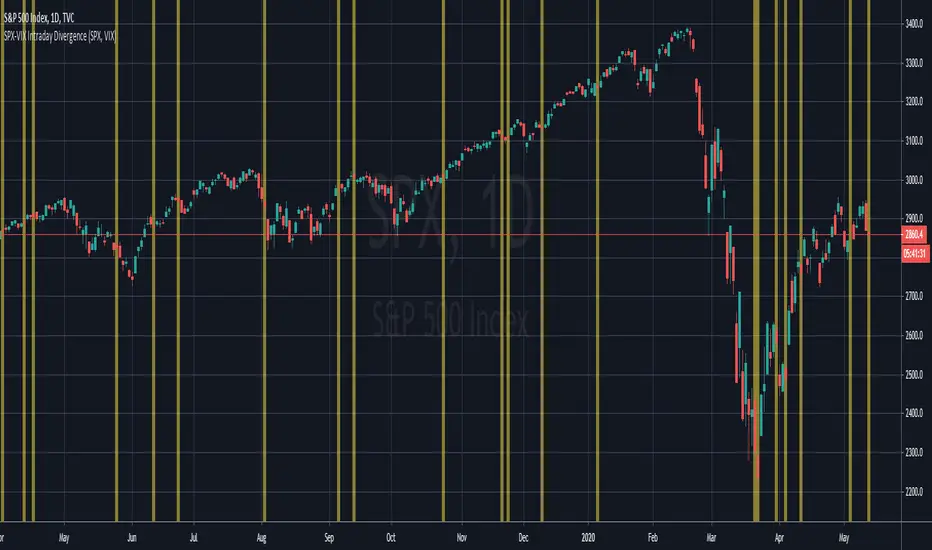
SPX-VIX Intraday DivergenceAs a long-term buyer/short-seller, you will always find different ways to enter the market , moving average crossovers, breakouts , overbought/oversold conditions being some of the classy methods. However, they are decreasingly effective... 😢
Recently I have realized that analysis beyond the technical indicators will bring trading to the next level because I will be able to confirm my trading signals without relying too much on basic price actions and patterns which are easily manipulated by big banks and institutions. 👍
Today I will introduce you to my divergence indicator making use of SPX and VIX. Unlike MacD or RSI divegence , which would involve normative judgement , it will take account of the unusual move by SPX alongwith the VIX , to the exploit chances that options market, where most experienced investors participated in has a preceding insight into the equity market about the upcoming moves.
I have divided signals into two groups.
Bullish divergence - SPX Down , VIX also Down 👇
Bearish divergence - SPX Up , VIX also Up 👆
I hope this script will enable us to take advantage of the options market activities , to provide a REAL divergence signal, and be used coupled with our own chart patterns or other price signals, and more importantly to score more and more winning trades!!!
If you want more useful scripts from me, please like and share my posts. And don't forget to follow my account to grab the latest ideas and tools! 😘
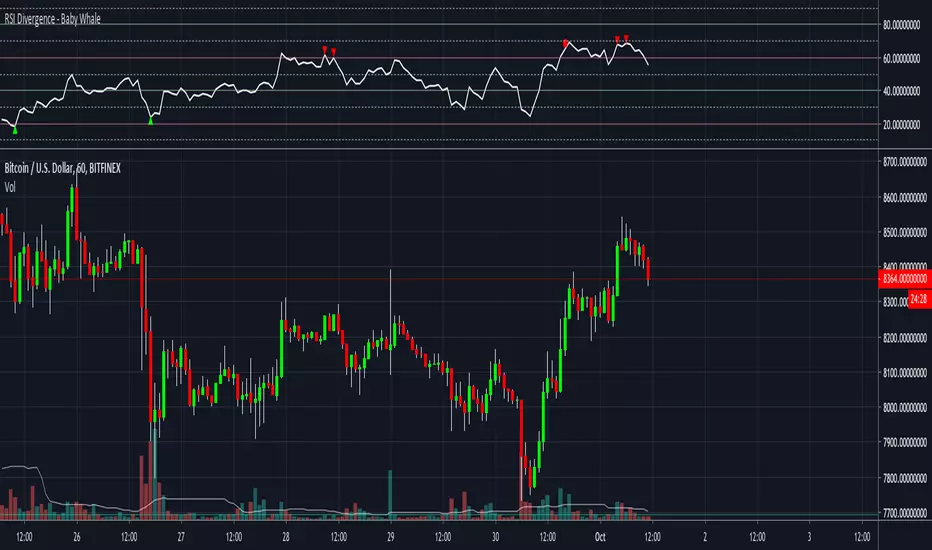
RSI Divergence - Baby WhaleHey guys!
BabyWhale here!
I will open source my scripts, so everyone can use them and update.
In this RSI Divergence script I added Hidden Divergence (beta) as well.
This script will show you:
Bullish Divergence (green triangle)
Hidden Bullish Divergence (green circle)
Bearish Divergence (red triangle)
Hidden Bearish Divergence (red circle)
You can set the RSI values.
I recommend 60 / 40 or 70 / 30.
Last but not least, you can set alarms when a Divergence or Hidden Divergence is found.
Feedback is always welcome!
Credits to @Libertus, I used his script as inspiration.
Good luck with trading!
BabyWhale
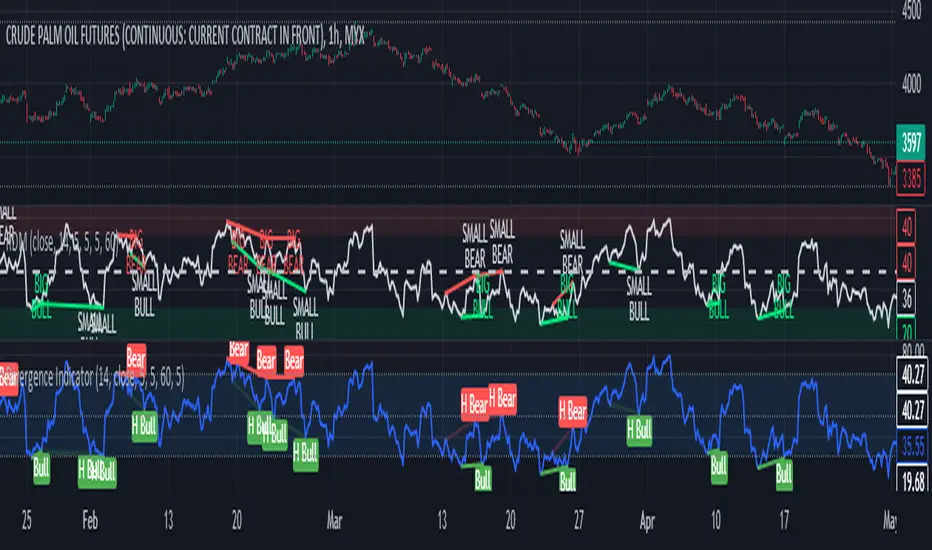
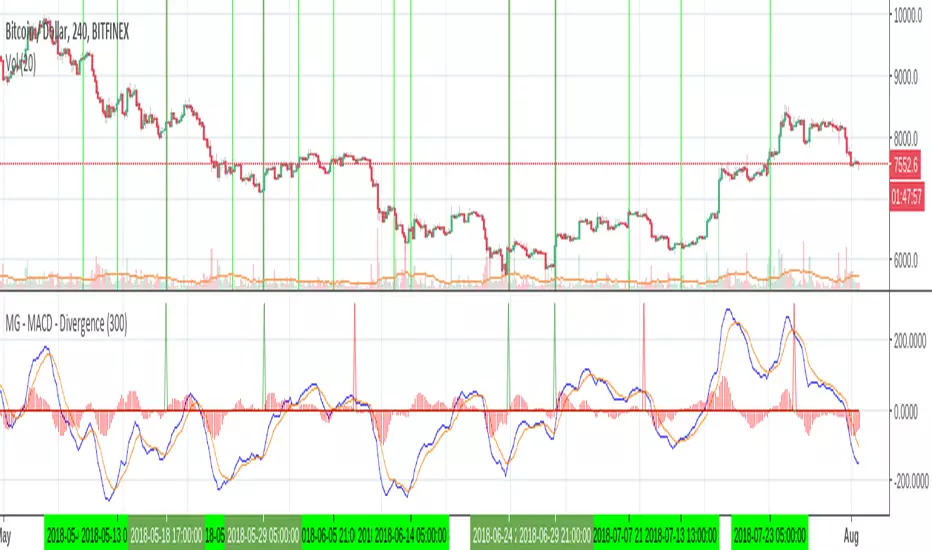
MG - MACD - Divergence - 1.0The MACD indicator can produce some powerful divergence signals which can be useful confirmation for entering / exiting a trade.
This indicator generates and alert and plots (if enabled), when a divergence is detected. For example, if bullish (above zero) and two bearish MACD crosses are detected with the second being lower than the first, a bearish divergence alert is triggered. Theoretically a good place to take profit / possibly enter a short position if you have further confirmation.
Can also be configured to include continuation signals i.e. a bullish trend with two bullish MACD crosses where the second is higher than the first. This could indicate more bullish action ahead.
In order to illustrate how this indicator helps to sift out a good amount of false signals, I have highlighted in the above image in dark green, all of the divergence buy signals highlighted by the indicator and in light green, the rest of the MACD buy signals.
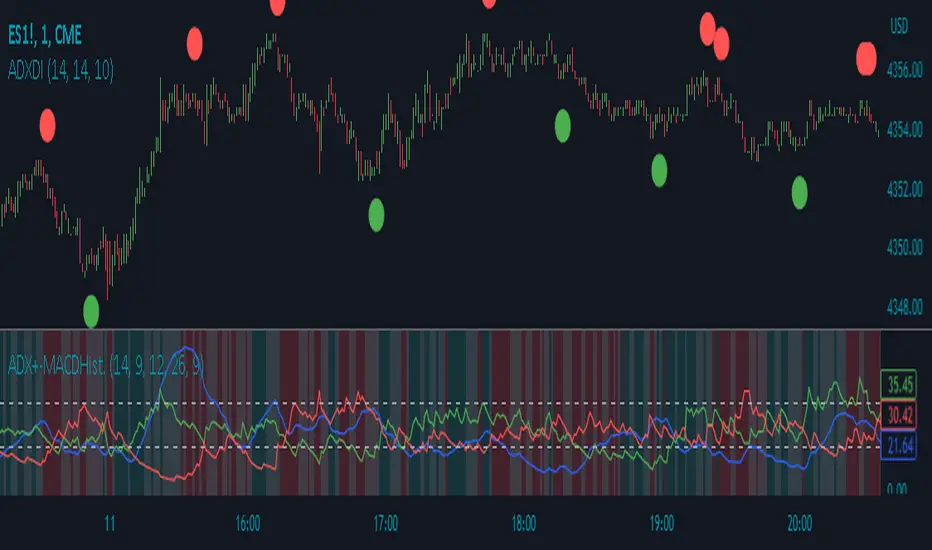
ADX Divergence IndicatorDescription:
The ADX Divergence Indicator (ADXDI) is a technical analysis tool designed to identify potential bullish and bearish signals based on the Average Directional Index (ADX), the Positive Directional Indicator (+DI), and the Negative Directional Indicator (-DI) lines. This overlay indicator plots circles on the chart to highlight these signals.
How it Works:
The ADXDI calculates the ADX, +DI, and -DI values using user-defined parameters. It then evaluates specific conditions to determine potential bullish and bearish signals. The indicator considers rising and falling trends of the +DI and -DI lines, as well as changes in the ADX values. Additionally, it detects a bounce condition when the current ADX is less than the previous ADX value and that ADX value is higher than the one previous to it.
Usage:
To effectively utilize the ADX Divergence Indicator, follow these steps:
1. Apply the ADX Divergence Indicator to your chart by adding it from the available indicators.
2. Observe the circles plotted on the chart:
- Bullish circles (green by default) indicate potential bullish signals.
- Bearish circles (red by default) indicate potential bearish signals.
4. Interpret the signals provided by the indicator:
- A bullish signal occurs when the +DI line rises and the -DI line falls.
- A bearish signal occurs when the -DI line rises and the +DI line falls.
- The presence of a bounce condition (ADX < ADX and ADX > ADX) further strengthens the signal.
5. Combine the signals from the ADX Signals indicator with other technical analysis tools, such as support and resistance levels, trend lines, or candlestick patterns, to confirm potential trade setups.
6. Customize the indicator's parameters, such as the lengths of the DI and ADX calculations or the colors of the plotted circles, to suit your trading preferences.
7. Implement appropriate risk management strategies, including setting stop-loss orders and position sizing, to manage your trades effectively and protect your capital.
AMACD - All Moving Average Convergence DivergenceThis indicator displays the Moving Average Convergane and Divergence ( MACD ) of individually configured Fast, Slow and Signal Moving Averages. Buy and sell alerts can be set based on moving average crossovers, consecutive convergence/divergence of the moving averages, and directional changes in the histogram moving averages.
The Fast, Slow and Signal Moving Averages can be set to:
Exponential Moving Average ( EMA )
Volume-Weighted Moving Average ( VWMA )
Simple Moving Average ( SMA )
Weighted Moving Average ( WMA )
Hull Moving Average ( HMA )
Exponentially Weighted Moving Average (RMA) ( SMMA )
Symmetrically Weighted Moving Average ( SWMA )
Arnaud Legoux Moving Average ( ALMA )
Double EMA ( DEMA )
Double SMA (DSMA)
Double WMA (DWMA)
Double RMA ( DRMA )
Triple EMA ( TEMA )
Triple SMA (TSMA)
Triple WMA (TWMA)
Triple RMA (TRMA)
Linear regression curve Moving Average ( LSMA )
Variable Index Dynamic Average ( VIDYA )
Fractal Adaptive Moving Average ( FRAMA )
If you have a strategy that can buy based on External Indicators use 'Backtest Signal' which returns a 1 for a Buy and a 2 for a sell.
'Backtest Signal' is plotted to display.none, so change the Style Settings for the chart if you need to see it for testing.

EMA Cross + Divergence strategy (Div. signals by The Divergent)A sample strategy demonstrating the usage of The Divergent divergence indicator and The Divergent Library .
The Divergent is an advanced divergence indicator which you can easily incorporate into your own strategies.
In order to use this strategy (and to use the signals in your own strategy), you need to have the Pro version of The Divergent applied to your chart.
For more information, please see the comments inlined in the code.

RSI Overbought Oversold Divergence Strategy w/ Buy/Sell SignalsThis indicator is a copy of my RSI Overbought/Oversold Divergence Indicator with-Alerts
Only difference is that the alerts are disabled, instead it uses tradingviews strategy tester signals
If you want alerts just use the other indicator

Multi Oscillator Divergence IndicatorTradingview Built-in Divergence Indicator with RSI is extended for Price Divergence with
- RSI
- MACD
- Sochastic
- Money Flow
- Demand Index
- Chaikin Money Flow
Thanks to tradingview for providing this unique indicator.
