Clean Multi-Indicator Alignment System
Overview
A sophisticated multi-indicator alignment system designed for 24/7 trading across all markets, with pure signal-based exits and no time restrictions. Perfect for futures, forex, and crypto markets that operate around the clock.
Key Features
🎯 Multi-Indicator Confluence System
EMA Cross Strategy: Fast EMA (5) and Slow EMA (10) for precise trend direction
VWAP Integration: Institution-level price positioning analysis
RSI Momentum: 7-period RSI for momentum confirmation and reversal detection
MACD Signals: Optimized 8/17/5 configuration for scalping responsiveness
Volume Confirmation: Customizable volume multiplier (default 1.6x) for signal validation
🚀 Advanced Entry Logic
Initial Full Alignment: Requires all 5 indicators + volume confirmation
Smart Continuation Entries: EMA9 pullback entries when trend momentum remains intact
Flexible Time Controls: Optional session filtering or 24/7 operation
🎪 Pure Signal-Based Exits
No Forced Closes: Positions exit only on technical signal reversals
Dual Exit Conditions: EMA9 breakdown + RSI flip OR MACD cross + EMA20 breakdown
Trend Following: Allows profitable trends to run their full course
Perfect for Swing Scalping: Ideal for multi-session position holding
📊 Visual Interface
Real-Time Status Dashboard: Live alignment monitoring for all indicators
Color-Coded Candles: Instant visual confirmation of entry/exit signals
Clean Chart Display: Toggle-able EMAs and VWAP with professional styling
Signal Differentiation: Clear labels for entries, X-crosses for exits
🔔 Alert System
Entry Notifications: Separate alerts for buy/sell signals
Exit Warnings: Technical breakdown alerts for position management
Mobile Ready: Push notifications to TradingView mobile app
Market Applications
Perfect For:
Gold Futures (GC): 24-hour precious metals trading
NASDAQ Futures (NQ): High-volatility index scalping
Forex Markets: Currency pairs with continuous operation
Crypto Trading: 24/7 cryptocurrency momentum plays
Energy Futures: Oil, gas, and commodity swing trades
Optimal Timeframes:
1-5 Minutes: Ultra-fast scalping during high volatility
5-15 Minutes: Balanced approach for most markets
15-30 Minutes: Swing scalping for trend following
🧠 Smart Position Management
Tracks implied position direction
Prevents conflicting signals
Allows trend continuation entries
State-aware exit logic
⚡ Scalping Optimized
Fast-reacting indicators with shorter periods
Volume-based confirmation reduces false signals
Clean entry/exit visualization
Minimal lag for time-sensitive trades
Configuration Options
All parameters fully customizable:
EMA Lengths: Adjustable from 1-30 periods
RSI Period: 1-14 range for different market conditions
MACD Settings: Fast (1-15), Slow (1-30), Signal (1-10)
Volume Confirmation: 0.5-5.0x multiplier range
Visual Preferences: Colors, displays, and table options
Risk Management Features
Clear visual exit signals prevent emotion-based decisions
Volume confirmation reduces false breakouts
Multi-indicator confluence improves signal quality
Optional time filtering for session-specific strategies
Best Use Cases
Futures Scalping: NQ, ES, GC during active sessions
Forex Swing Trading: Major pairs during overlap periods
Crypto Momentum: Bitcoin, Ethereum trend following
24/7 Automated Systems: Algorithmic trading implementation
Multi-Market Scanning: Portfolio-wide signal monitoring
Cari dalam skrip untuk "Futures"

Market Regime IndexThe Market Regime Index is a top-down macro regime nowcasting tool that offers a consolidated view of the market’s risk appetite. It tracks 32 of the world’s most influential markets across asset classes to determine investor sentiment by applying trend-following signals to each independent asset. It features adjustable parameters and a built-in alert system that notifies investors when conditions transition between Risk-On and Risk-Off regimes. The selected markets are grouped into equities (7), fixed income (9), currencies (7), commodities (5), and derivatives (4):
Equities = S&P 500 E-mini Index Futures, Nasdaq-100 E-mini Index Futures, Russell 2000 E-mini Index Futures, STOXX Europe 600 Index Futures, Nikkei 225 Index Futures, MSCI Emerging Markets Index Futures, and S&P 500 High Beta (SPHB)/Low Beta (SPLV) Ratio.
Fixed Income = US 10Y Treasury Yield, US 2Y Treasury Yield, US 10Y-02Y Yield Spread, German 10Y Bund Yield, UK 10Y Gilt Yield, US 10Y Breakeven Inflation Rate, US 10Y TIPS Yield, US High Yield Option-Adjusted Spread, and US Corporate Option-Adjusted Spread.
Currencies = US Dollar Index (DXY), Australian Dollar/US Dollar, Euro/US Dollar, Chinese Yuan/US Dollar, Pound Sterling/US Dollar, Japanese Yen/US Dollar, and Bitcoin/US Dollar.
Commodities = ICE Brent Crude Oil Futures, COMEX Gold Futures, COMEX Silver Futures, COMEX Copper Futures, and S&P Goldman Sachs Commodity Index (GSCI) Futures.
Derivatives = CBOE S&P 500 Volatility Index (VIX), ICE US Bond Market Volatility Index (MOVE), CBOE 3M Implied Correlation Index, and CBOE VIX Volatility Index (VVIX)/VIX.
All assets are directionally aligned with their historical correlation to the S&P 500. Each asset contributes equally based on its individual bullish or bearish signal. The overall market regime is calculated as the difference between the number of Risk-On and Risk-Off signals divided by the total number of assets, displayed as the percentage of markets confirming each regime. Green indicates Risk-On and occurs when the number of Risk-On signals exceeds Risk-Off signals, while red indicates Risk-Off and occurs when the number of Risk-Off signals exceeds Risk-On signals.
Bullish Signal = (Fast MA – Slow MA) > (ATR × ATR Margin)
Bearish Signal = (Fast MA – Slow MA) < –(ATR × ATR Margin)
Market Regime = (Risk-On signals – Risk-Off signals) ÷ Total assets
This indicator is designed with flexibility in mind, allowing users to include or exclude individual assets that contribute to the market regime and adjust the input parameters used for trend signal detection. These parameters apply to each independent asset, and the overall regime signal is smoothed by the signal length to reduce noise and enhance reliability. Investors can position according to the prevailing market regime by selecting factors that have historically outperformed under each regime environment to minimise downside risk and maximise upside potential:
Risk-On Equity Factors = High Beta > Cyclicals > Low Volatility > Defensives.
Risk-Off Equity Factors = Defensives > Low Volatility > Cyclicals > High Beta.
Risk-On Fixed Income Factors = High Yield > Investment Grade > Treasuries.
Risk-Off Fixed Income Factors = Treasuries > Investment Grade > High Yield.
Risk-On Commodity Factors = Industrial Metals > Energy > Agriculture > Gold.
Risk-Off Commodity Factors = Gold > Agriculture > Energy > Industrial Metals.
Risk-On Currency Factors = Cryptocurrencies > Foreign Currencies > US Dollar.
Risk-Off Currency Factors = US Dollar > Foreign Currencies > Cryptocurrencies.
In summary, the Market Regime Index is a comprehensive macro risk-management tool that identifies the current market regime and helps investors align portfolio risk with the market’s underlying risk appetite. Its intuitive, color-coded design makes it an indispensable resource for investors seeking to navigate shifting market conditions and enhance risk-adjusted performance by selecting factors that have historically outperformed. While it has proven historically valuable, asset-specific characteristics and correlations evolve over time as market dynamics change.

Synthetic Implied APROverview
The Synthetic Implied APR is an artificial implied APR, designed to imitate the implied APR seen when trading cryptocurrency funding rates. It combines real-time funding rates with premium data to calculate an artificial market expectation of the annualized funding rate.
The (actual) implied APR is the market's expectation of the annualized funding rate. This is dependent on bid/ask impacts of the implied APR, something which is currently unavailable to fetch with TradingView. In essence, an implied APR of X% means traders believe that asset's funding fees to average X% when annualized.
What's important to understand, is that the actual value of the synthetic implied APR is not relevant. We only simply use its relative changes when we trade (i.e if it crosses above/below its MA for a given weight). Even for the same asset, the implied APRs will change depending on days to maturity.
How it calculates
The synthetic implied APR is calculated with these steps:
Collects premium data from perpetual futures markets using optimized lower timeframe requests (check my 'Predicted Funding Rates' indicator)
Calculates the funding rate by adding the premium to an interest rate component (clamped within exchange limits)
Derives the underlying APR from the 8-hour funding rate (funding rate × 3 × 365)
Apply a weighed formula that imitates both the direction (underlying APR) with the volatility of prices (from the premium index and funding)
premium_component = (prem_avg / 50 ) * 365
weighedprem = (weight * fr) + ((1 - weight) * apr) + (premium_component * 0.3)
impliedAPR = math.avg(weighedprem, ta.sma(apr, maLength))
How to use it: Generally
Preface: Funding rates are an indication of market sentiment
If funding is positive, generally the market is bullish as longs are willing to pay shorts funding
If funding is negative, generally the market is bearish as shorts are willing to pay longs funding
So, this script can be used like a typical oscillator:
Bullish: If implied APR > MA OR if implied APR MA is green
Bearish: If implied APR < MA OR if implied APR MA is red
The components:
Synthetic Implied APR: The main metric. At current setting of 0.7, it imitates volatility
Weight: The higher the value, the smoother the synthetic implied APR is (and MA too). This value is very important to the imitation. At 0.7, it imitates the actual volatility of the implied APR. At weight = 1, it becomes very smooth. Perfect for trading
Synthetic Implied APR Moving Average: A moving average of the Synthetic implied APR. Can choose from multiple selections, (SMA, EMA, WMA, HMA, VWMA, RMA)
How to use it: Trading Funding
When trading funding there're multiple ways to use it with different settings
Trade funding rates with trend changes
Settings: Weight = 1
Method 1: When the implied APR MA turns green, long funding rates (or short if red)
Method 2: When the implied APR crosses above the MA, long funding rates (or short when crosses below)
Trade funding rates with MA pullbacks
Settings: Weight = 0.7, timeframe 15m
In an uptrend: When implied APR crosses below then above the script, long funding opportunity
In an downtrend: When implied APR crosses above then below the script, shortfunding opportunity
You can determine the trend with the method before, using a weight of 1
To trade funding rates, it's best to have these 3 scripts at these settings:
Predicted Funding Rates: This allows you to see the predicted funding rates and see if they've maxxed out for added confluence too (+/-0.01% usually for Binance BTC futures)
Synthetic implied APR: At weight 1, the MA provides a good trend (whether close above/below or colour change)
Synthetic implied APR: At weight 0.7, it provides a good imitation of volatility
How to use it: Trading Futures
When trading futures:
You can determine roughly what the trend is, if the assumption is made that funding rates can help identify trends if used as a sentiment indicator. It should be supplemented with traditional trend trading methods
To prevent whipsaws, weight should remain high
Long trend: When the implied APR MA turns green OR when it crosses above its MA
Short trend: When the implied APR MA turns red OR when it below above its MA
Why it's original
This indicator introduces a unique synthetic weighting system that combines funding rates, underlying APR, and premium components in a way not found in existing TradingView scripts. Trading funding rates is a niche area, there aren't that many scripts currently available. And to my knowledge, there's no synthetic implied APR scripts available on TradingView either. So I believe this script to be original in that sense.
Notes
Because it depends on my triangular weighting algos, optimal accuracy is found on timeframes that are 4H or less. On higher timeframes, the accuracy drops off. Best timeframes for intraday trading using this are 15m or 1 hour
The higher the timeframe, the lower the MA one should use. At 1 hour, 200 or higher is best. At say, 4h, length of 50 is best
Only works for coins that have a Binance premium index
Inputs
Funding Period - Select between "1 Hour" or "8 Hour" funding cycles. 8 hours is standard for Binance
Table - Toggle the information dashboard on/off to show or hide real-time metrics including funding rate, premium, and APR value
Weight - Controls the balance between funding rate (higher values = smoother) and APR (lower values = more responsive) in the calculation, ranging from 0.0 to 1.0. Default is 0.7, this imitates the volatility
Auto Timeframe Implied Length - Automatically calculates optimal smoothing length based on your chart timeframe for consistent behavior across different time periods
Manual Implied Length - Sets a fixed smoothing length (in bars) when auto mode is disabled, with lower values being more responsive and higher values being smoother
Show Implied APR MA - Displays an additional moving average line of the Synthetic Implied APR to help identify trend direction and crossover signals
MA Type for Implied APR - Selects the calculation method (SMA, EMA, WMA, HMA, VWMA, or RMA) for the moving average, each offering different responsiveness and lag characteristics
MA Length for Implied APR - Sets the lookback period (1-500 bars) for the moving average, with shorter lengths providing more signals and longer lengths filtering noise
Show Underlying APR - Displays the raw APR calculation (without synthetic weighting) as a reference line to compare against the main indicator
Bullish Color - Sets the color for positive values in the table and rising MA line
Bearish Color - Sets the color for negative values in the table and falling MA line
Table Background - Customizes the background color and transparency of the information dashboard
Table Text Color - Sets the color for label text in the left column of the information table
Table Text Size - Controls the font size of table text with options from Tiny to Huge

VWAP Momentum Oscillator How It Works
Core Calculation Method
The oscillator combines four key market measurements into a single, normalized reading:
1. Price-VWAP Deviation: `(Close - VWAP) / VWAP × 100`
2. VWAP-MA Momentum: `(VWAP - MovingAverage) / MovingAverage × 100`
3. Anchored VWAP Strength: Average of high/low anchor deviations from rolling VWAP
4. Range Position: `(Close - PeriodLow) / (PeriodHigh - PeriodLow) × 100 - 50`
Dynamic Signal Line
The signal line uses an EMA that automatically adjusts its length based on your chart timeframe:
- Futures: Always covers 23 hours of trading (1,380 minutes)
- Stocks: Always covers 6.5 hours of trading (390 minutes)
- Examples: 276 periods on 5-min futures chart, 1,380 periods on 1-min futures chart
Trading Signals
🟢 Buy Signals
- Condition: Main oscillator crosses above signal line while below zero
- Logic: Momentum turning bullish from oversold conditions
- Visual: Green "BUY" label below price action
🔴 Sell Signals
- Condition: Main oscillator crosses below signal line while above zero
- Logic: Momentum turning bearish from overbought conditions
- Visual: Red "SELL" label above price action
⚠️ Extreme Warnings
- Extreme Overbought: Red triangle when oscillator crosses above +4.0
- Extreme Oversold: Green triangle when oscillator crosses below -4.0
- Purpose: Risk management alerts, not entry/exit signals
Oscillator Zones
Interpretation Guide
- Above +2.0: Strong bullish momentum zone (green background)
- 0 to +2.0: Mild bullish territory
- 0 to -2.0: Mild bearish territory
- Below -2.0: Strong bearish momentum zone (red background)
- Above +4.0: Extreme overbought (caution advised)
- Below -4.0: Extreme oversold (potential reversal zone)
Customization Options
Moving Average Settings
- EMA/SMA Toggle: Choose between exponential or simple moving average
- Color Customization: Adjust MA line color and width
Visual Controls
- Bullish/Bearish Colors: Customize momentum zone colors
- Signal Line: Toggle visibility and adjust color
- Line Widths: Control thickness of all plot lines
Anchor Modes
- NY Session Only: Anchors reset at NY market open (9:30 AM ET)
- 24H NY Day: Anchors reset at NY calendar day change (midnight ET)
Best Practices
Timeframe Selection
- Scalping: 1-5 minute charts for quick momentum changes
- Day Trading: 5-15 minute charts for clearer trend signals
- Swing Trading: 1-4 hour charts for major momentum shifts
Signal Confirmation
- Wait for crossovers: Don't trade on oscillator position alone
- Respect extreme levels: Exercise caution above +4 or below -4
- Use with price action: Combine with support/resistance levels
Risk Management
- Extreme zones: Reduce position size when oscillator is extended
- Failed signals: Exit quickly if momentum doesn't follow through
- Market context: Consider overall trend direction and market volatility
Technical Specifications
Calculation Components
- Base Length: 1,380 periods (futures) / 390 periods (stocks)
- Signal Line: Dynamic EMA covering one full trading day
- Smoothing: 3-period SMA on raw oscillator (adjustable)
- Update Frequency: Real-time on every price tick
Performance Notes
- Resource Efficient: Optimized calculations minimize CPU usage
- Memory Friendly: Uses incremental VWAP calculations
- Fast Loading: Minimal historical data requirements
Version History & Development
This oscillator evolved from advanced VWAP overlay strategies, transforming complex multi-line analysis into a single, actionable momentum gauge. The indicator maintains the sophistication of institutional VWAP analysis while providing the clarity needed for retail trading decisions.
Core Philosophy
Traditional VWAP indicators show where price is relative to volume-weighted averages, but they don't quantify momentum or provide clear entry/exit signals. This oscillator solves that problem by normalizing all VWAP relationships into a single, bounded indicator that works consistently across all timeframes and asset classes.
---
Open Source License: This indicator is provided free for the TradingView community. Feel free to modify and enhance according to your trading needs.

Commitment of Traders: Legacy Metrics█ OVERVIEW
This indicator displays the Commitment of Traders (COT) legacy data for futures markets.
█ CONCEPTS
Commitment of Traders (COT) data is tallied by the Commodity Futures Trading Commission (CFTC) , a US federal agency that oversees the trading of derivative markets such as futures in the US. It is weekly data that provides traders with information about open interest for an asset. The CFTC oversees derivative markets traded on different exchanges, so COT data is available for assets that can be traded on CBOT, CME, NYMEX, COMEX, and ICEUS.
A detailed description of the COT report can be found on the CFTC's website .
COT data is separated into three notable reports: Legacy, Disaggregated, and Financial. This indicator presents data from the legacy report, which is broken down by exchange. Legacy reports break down the reportable open interest positions into two classifications: non-commercial and commercial traders.
Our other COT indicators are:
• Commitment of Traders: Disaggregated Metrics
• Commitment of Traders: Financial Metrics
• Commitment of Traders: Total
█ HOW TO USE IT
Load the indicator on an active chart (see here if you don't know how).
By default, the indicator uses the chart's symbol to derive the COT data it displays. You can also specify a CFTC code in the "CFTC code" field of the script's inputs to display COT data from a symbol different than the chart's.
The rest of this section documents the script's input fields.
Metric
Each metric represents a different column of the Commitment of Traders report. Details are available in the explanatory notes on the CFTC's website .
Here is a summary of the metrics:
• "Open Interest" is the total of all futures and/or option contracts entered into and not yet offset by a transaction, by delivery, by exercise, etc.
The aggregate of all long open interest is equal to the aggregate of all short open interest.
• "Traders Total" is the number of all unique reportable traders, regardless of the trading direction.
• "Traders Total Reportable/Traders Noncommercial/Traders Commercial" are the quantities of traders reported to hold any position with the specified direction.
All of a trader's reported futures positions in a commodity are classified as commercial if the trader uses futures contracts in that particular commodity for hedging.
To determine the total number of reportable traders in a market, a trader is counted only once, whether or not the trader appears in more than one category.
• "Total Reportable/Noncommercial/Commercial Positions" are all positions held by all reportable/non-commercial/commercial traders.
• "Non-reportable Positions" is derived by subtracting total long and short "Reportable Positions" from the total open interest.
Accordingly, the number of traders involved and the commercial/non-commercial classification of each trader are unknown.
• "Concentration Gross/Net LT 4/8 TDR" is the percentage of open interest held by 4/8 of the largest traders, by gross/net positions,
without regard to whether they are classified as commercial or non-commercial. The Net position ratios are computed after offsetting each trader’s equal long and short positions.
A reportable trader with relatively large, balanced long and short positions in a single market, therefore,
may be among the four and eight largest traders in both the gross long and gross short categories, but will probably not be included among the four and eight largest traders on a net basis.
Direction
Each metric is available for a particular set of directions. Valid directions for each metric are specified with its name in the "Metric" field's dropdown menu.
Type
Possible values are: All, Old, Other. When commodities have a well-defined marketing season or crop year (e.g. Wheat or Lean Hogs futures), this determines how the data is aggregated. Detailed explanation can be found in the "Old and Other Futures" section of the CTFC Explanatory Notes linked above. The "Major Markets for Which the COT Data Is Shown by Crop Year" table in the Explanatory Notes specifies the commodities that this distinction applies to; selecting "Old" for any of the commodities not in that list will return the same data as in "All", while selecting "Other" will return 0.
COT Selection Mode
This field's value determines how the script determines which COT data to return from the chart's symbol:
- "Root" uses the root of a futures symbol ("ES" for "ESH2020").
- "Base currency" uses the base currency in a forex pair ("EUR" for "EURUSD").
- "Currency" uses the quote currency, i.e., the currency the symbol is traded in ("JPY" for "TSE:9984" or "USDJPY").
- "Auto" tries all modes, in turn.
If no COT data can be found, a runtime error is generated.
Note that if the "CTFC Code" input field contains a code, it will override this input.
Futures/Options
Specifies the type of Commitment of Traders data to display: data concerning only Futures, only Options, or both.
CTFC Code
Instead of letting the script generate the CFTC COT code from the chart and the "COT Selection Mode" input when this field is empty, you can specify an unrelated CFTC COT code here, e.g., 001602 for wheat futures.
Look first. Then leap.

Commitment of Traders: Disaggregated Metrics█ OVERVIEW
This indicator displays the Commitment of Traders (COT) Disaggregated data for futures markets.
█ CONCEPTS
Commitment of Traders (COT) data is tallied by the Commodity Futures Trading Commission (CFTC) , a US federal agency that oversees the trading of derivative markets such as futures in the US. It is weekly data that provides traders with information about open interest for an asset. The CFTC oversees derivative markets traded on different exchanges, so COT data is available for assets that can be traded on CBOT, CME, NYMEX, COMEX, and ICEUS.
A detailed description of the COT report can be found on the CFTC's website .
COT data is separated into three notable reports: Legacy, Disaggregated, and Financial. This indicator presents data from the Disaggregated report. The disaggregated reports are broken down by agriculture, petroleum and products, natural gas and products, electricity and metals and other physical contracts. The Disaggregated reports break down the reportable open interest positions into four classifications: Producer/Merchant/Processor/User, Swap Dealers, Managed Money, and Other Reportables.
Our other COT indicators are:
• Commitment of Traders: Legacy Metrics
• Commitment of Traders: Financial Metrics
• Commitment of Traders: Total
█ HOW TO USE IT
Load the indicator on an active chart (see here if you don't know how).
By default, the indicator uses the chart's symbol to derive the COT data it displays. You can also specify a CFTC code in the "CFTC code" field of the script's inputs to display COT data from a symbol different than the chart's.
The rest of this section documents the script's input fields.
Metric
Each metric represents a different column of the Commitment of Traders report. Details are available in the explanatory notes on the CFTC's website .
Here is a summary of the metrics:
• "Open Interest" is the total of all futures and/or option contracts entered into and not yet offset by a transaction, by delivery, by exercise, etc.
The aggregate of all long open interest is equal to the aggregate of all short open interest.
• "Traders Total" is the quantity of all unique reportable traders, regardless of the trading direction.
• "Traders Producer Merchant" is the number of traders classified as a "producer/merchant/processor/user" reported holding any position with the specified direction.
A "producer/merchant/processor/user" is an entity that predominantly engages in the production, processing, packing or handling of a physical commodity and
uses the futures markets to manage or hedge risks associated with those activities.
• "Traders Swap" is the number of traders classified as "swap dealers" reported holding any position with the specified direction.
A "swap dealer" is an entity that deals primarily in swaps for a commodity and uses the futures markets to manage or hedge the risk associated with those swaps transactions.
The swap dealer’s counterparties may be speculative traders, like hedge funds, or traditional commercial clients that are managing risk arising from their dealings in the physical commodity.
• "Traders Managed Money" is the number of traders classified as "money managers" reported holding any position with the specified direction.
A "money manager" is a registered trader that is engaged in managing and conducting organized futures trading on behalf of clients.
• "Traders Other Reportable" is the number of reportable traders that are not placed in any of the three categories specified above.
• "Traders Total Reportable" is the number of traders reported holding any position with the specified direction.
To determine the total number of reportable traders in a market, a trader is counted only once whether or not the trader appears in more than one category.
As a result, the sum of the numbers of traders in each separate category typically exceeds the total number of reportable traders.
• "Producer Merchant/Swap/Managed Money/Total Reportable/Other Reportable Positions" is all positions held by the traders of the specified category.
• "Nonreportable Positions" is the long and short open interest derived by subtracting the total long and short reportable positions from the total open interest.
Accordingly, the number of traders involved and the classification of each trader are unknown.
• "Concentration Gross/Net LE 4/8 TDR" is the percentage of open interest held by 4/8 of the largest traders (entities), by Gross/Net positions, without regard to how they are classified.
The Net position ratios are computed after offsetting each trader’s equal long and short positions.
A reportable trader with relatively large, balanced long and short positions in a single market,
therefore, may be among the four and eight largest traders in both the gross long and gross short categories,
but will probably not be included among the four and eight largest traders on a net basis.
Direction
Each metric is available for a particular set of directions. Valid directions for each metric are specified with its name in the "Metric" field's dropdown menu.
Type
Possible values are: All, Old, Other. When commodities have a well-defined marketing season or crop year (e.g. Wheat or Lean Hogs futures), this determines how the data is aggregated. Detailed explanation can be found in the "Old and Other Futures" section of the CTFC Explanatory Notes linked above. The "Major Markets for Which the COT Data Is Shown by Crop Year" table in the Explanatory Notes specifies the commodities that this distinction applies to; selecting "Old" for any of the commodities not in that list will return the same data as in "All", while selecting "Other" will return 0.
Futures/Options
Specifies the type of Commitment of Traders data to display: data concerning only Futures, only Options, or both.
CTFC Code
Instead of letting the script generate the CFTC COT code from the chart and the "COT Selection Mode" input when this field is empty, you can specify an unrelated CFTC COT code here, e.g., 001602 for wheat futures.
Look first. Then leap.

Commitment of Traders: Financial Metrics█ OVERVIEW
This indicator displays the Commitment of Traders (COT) financial data for futures markets.
█ CONCEPTS
Commitment of Traders (COT) data is tallied by the Commodity Futures Trading Commission (CFTC) , a US federal agency that oversees the trading of derivative markets such as futures in the US. It is weekly data that provides traders with information about open interest for an asset. The CFTC oversees derivative markets traded on different exchanges, so COT data is available for assets that can be traded on CBOT, CME, NYMEX, COMEX, and ICEUS.
A detailed description of the COT report can be found on the CFTC's website .
COT data is separated into three notable reports: Legacy, Disaggregated, and Financial. This indicator presents data from the COT Financial (Traders in Financial Futures) report. The Financial report includes financial contracts, such as currencies, US Treasury securities, Eurodollars, stocks, VIX and Bloomberg commodity index. As such, the TFF data is limited to financial-related tickers. The TFF report breaks down the reportable open interest positions into four classifications: Dealer/Intermediary, Asset Manager/Institutional, Leveraged Funds, and Other Reportables.
Our other COT indicators are:
• Commitment of Traders: Legacy Metrics
• Commitment of Traders: Disaggregated Metrics
• Commitment of Traders: Total
█ HOW TO USE IT
Load the indicator on an active chart (see here if you don't know how).
By default, the indicator uses the chart's symbol to derive the COT data it displays. You can also specify a CFTC code in the "CFTC code" field of the script's inputs to display COT data from a symbol different than the chart's.
The rest of this section documents the script's input fields.
Metric
Each metric represents a different column of the Commitment of Traders report. Details are available in the explanatory notes on the CFTC's website .
Here is a summary of the metrics:
• "Open Interest" is the total of all futures and/or option contracts entered into and not yet offset by a transaction, by delivery, by exercise, etc.
The aggregate of all long open interest is equal to the aggregate of all short open interest.
• "Traders Total" is the number of all unique reportable traders, regardless of the trading direction.
• "Traders Dealer" is the number of traders classified as a "Dealer/Intermediary" reported holding any position with the specified direction.
A "producer/merchant/processor/user" is an entity typically described as the “sell side” of the market.
Though they may not predominately sell futures, they do design and sell various financial assets to clients.
They tend to have matched books or offset their risk across markets and clients.
Futures contracts are part of the pricing and balancing of risk associated with the products they sell and their activities.
• "Traders Asset Manager" is the number of traders classified as "Asset Manager/Institutional" reported holding any position with the specified direction.
These are institutional investors, including pension funds, endowments, insurance companies,
mutual funds and those portfolio/investment managers whose clients are predominantly institutional.
• "Traders Leveraged Funds" is the number of traders classified as "Leveraged Funds" reported holding any position with the specified direction.
These are typically hedge funds and various types of money managers. The traders may be engaged in managing and
conducting proprietary futures trading and trading on behalf of speculative clients.
• "Traders Other Reportable" is the number of reportable traders that are not placed in any of the three categories specified above.
The traders in this category mostly are using markets to hedge business risk, whether that risk is related to foreign exchange, equities or interest rates.
This category includes corporate treasuries, central banks, smaller banks, mortgage originators, credit unions and any other reportable traders not assigned to the other three categories.
• "Traders Total Reportable" is the number of all traders reported holding any position with the specified direction.
To determine the total number of reportable traders in a market, a trader is counted only once whether or not the trader appears in more than one category.
As a result, the sum of the numbers of traders in each separate category typically exceeds the total number of reportable traders.
• "Dealer/Asset Manager/Leveraged Funds/Total Reportable/Other Reportable Positions -- all positions held by the traders of the specified category.
• "Nonreportable Positions" is the long and short open interest derived by subtracting the total long and short reportable positions from the total open interest.
Accordingly, the number of traders involved and the commercial/non-commercial classification of each trader are unknown.
• "Concentration Gross/Net LT 4/8 TDR" is the percentage of open interest held by 4/8 of the largest traders, by gross/net positions,
without regard to whether they are classified as commercial or non-commercial. The Net position ratios are computed after offsetting each trader’s equal long and short positions.
A reportable trader with relatively large, balanced long and short positions in a single market, therefore,
may be among the four and eight largest traders in both the gross long and gross short categories, but will probably not be included among the four and eight largest traders on a net basis.
Direction
Each metric is available for a particular set of directions. Valid directions for each metric are specified with its name in the "Metric" field's dropdown menu.
COT Selection Mode
This field's value determines how the script determines which COT data to return from the chart's symbol:
- "Root" uses the root of a futures symbol ("ES" for "ESH2020").
- "Base currency" uses the base currency in a forex pair ("EUR" for "EURUSD").
- "Currency" uses the quote currency, i.e., the currency the symbol is traded in ("JPY" for "TSE:9984" or "USDJPY").
- "Auto" tries all modes, in turn.
If no COT data can be found, a runtime error is generated.
Note that if the "CTFC Code" input field contains a code, it will override this input.
Futures/Options
Specifies the type of Commitment of Traders data to display: data concerning only Futures, only Options, or both.
CTFC Code
Instead of letting the script generate the CFTC COT code from the chart and the "COT Selection Mode" input when this field is empty, you can specify an unrelated CFTC COT code here, e.g., 001602 for wheat futures.
Look first. Then leap.

Binance TRX & BTTShows TRX with BTT, subtracted or added to. Subtracting makes it in line with BitMEX futures. The option to add is considered for 'true value'. Airdrops, like new coin forks, can split value: a good example being BCHABC and BCHSV.
Getting TRX futures to match TRX on Binance is likely tied to the monthly airdrop rate as defined here: support.binance.com
I'm guessing it has something to do with (spot price * estimated airdrop rate) trading too far from futures. Maybe even too close. Or because futures are trading above spot near a monthly airdrop snapshot. Much complicate. Such guess. Wow.
Binance is chosen as pricing source for its liquidity and earliest open date.

Etherium CME gaps multi-timeframe auto finderThis indicator is a powerful tool that automatically detects and visualizes price gaps (Gaps) in the Ethereum CME futures market across multiple timeframes and also provides alert functionality. Price gaps occur when the futures market is inactive for a certain period, often acting as potential support or resistance zones.
What is an Ethereum CME Gap?
CME (Chicago Mercantile Exchange) is one of the largest derivatives exchanges globally. The Ethereum CME futures market is closed on weekends and certain holidays. When the market reopens, a price difference may occur between the previous closing price and the new opening price, referred to as a "CME Gap."
Key Features of the Indicator
Multi-timeframe gap detection: Detects and displays gaps across 5m, 15m, 30m, 1h, 4h, 1d timeframes simultaneously.
Customizable CME Symbol: You can specify Ethereum CME futures symbols, such as ETH1!.
Two gap price display methods:
CME_price: Displays the gap based on the actual price levels in the CME futures market.
Chart_price: Adjusts the gap to match the price levels on the chart being viewed (e.g., spot market). This helps visualize the impact of futures gaps on the spot market.
Visual customization:
Individual color settings for bullish/bearish gap boxes for each timeframe.
Adjust the extension (display length) of gap boxes in bars.
Configure label display, position, text size, background, and text color.
Highlight significant gaps: Emphasize gaps above a specified percentage with a unique color and border thickness.
Alert functionality: Receive notifications when a gap is detected, with options to enable alerts only for specific timeframes.
Why CME Gaps Matter
Traders often consider CME gaps as significant price zones.
Gap Fill: Historical data shows that many gaps tend to get "filled" over time, meaning the price returns to the gap area, reaching the start or end point of the gap.
Support/Resistance: Unfilled gaps can serve as potential support (Bullish Gap) or resistance (Bearish Gap) zones.
Bullish Gap: Occurs when the current opening price is higher than the previous closing price. Typically leaves an unfilled gap below (previous high), which can act as potential support.
Bearish Gap: Occurs when the current opening price is lower than the previous closing price. Typically leaves an unfilled gap above (previous low), which can act as potential resistance.
How to Use the Indicator
Add Indicator on TradingView: Click the "Indicators" button on the TradingView chart.
Find the indicator in "My Scripts" or "Invite-Only Scripts" and add it to the chart.
Adjust Settings: Once the indicator is added, click the settings (gear) icon to adjust inputs.
CME Symbol (ETH): ETH1! is typically the default symbol for Ethereum CME futures. Confirm based on your broker or data feed.
Min gap %: Set the minimum gap size in percentage; smaller gaps will not be displayed.
Select Exchanges to Display gap price: Choose between "CME_price" or "Chart_price." For viewing futures gaps on a spot chart, "Chart_price" is recommended.
Show Xm/h/d gap boxes: Select which timeframe gap boxes to display.
Color, Extension, Label settings: Customize the visual aspects of gap boxes and labels.
Highlight gap % (>=): Set the minimum percentage for highlighting significant gaps.
Enable Alerts: Choose whether to receive alerts when a gap is detected.
Alert Timeframe: Select whether alerts apply to all timeframes or specific ones only.
Chart Analysis
Once the indicator is applied, gap boxes for the selected timeframes appear on the chart.
Green shades indicate Bullish Gaps, and red shades indicate Bearish Gaps (default green can be customized, and bearish gap color can be set separately).
Highlighted gaps may carry higher significance and should be monitored carefully.
Potential trading opportunities can be explored when the price approaches or attempts to fill a gap.
Usage Strategies (Examples)
Support/Resistance Confirmation: The lower boundary of a bullish gap can act as potential support, while the upper boundary of a bearish gap can act as potential resistance. Observe for reversals or breakouts when price reaches these areas.
Retracement Trading: Trade when the price returns to fill a gap after leaving it through a sharp move up or down.
Multi-timeframe Analysis: Gaps overlapping across multiple timeframes can form stronger support/resistance zones.
Considerations
* "Gap Filled" Condition: The indicator does not draw a gap if it determines that the gap has already been filled by the current bar’s low (bullish gap) or high (bearish gap).
* Tool Only: This indicator is a gap detection tool and should not be used alone for trading decisions. Always combine with other technical analysis tools and your trading strategy.
* Past Data ≠ Future Guarantee: Historical gap fill trends do not guarantee future occurrences.
This indicator allows effective tracking of Ethereum CME futures gaps and provides valuable insights for enhancing your trading strategy.

MACD StrategyOverview
The "MACD Strategy" is a straightforward trading strategy tested for BTCUSDT Futures on the 1-minute timeframe, leveraging the Moving Average Convergence Divergence (MACD) indicator to identify momentum-based buy and sell opportunities. Developed with input from expert trading analyst insights, this strategy combines technical precision with risk management, making it suitable for traders of all levels on platforms like TradingView. It focuses on capturing trend reversals and momentum shifts, with clear visual cues and automated alerts for seamless integration with trading bots (e.g., Bitget webhooks).
#### How It Works
This strategy uses the MACD indicator to generate trading signals based on momentum and trend direction:
- **Buy Signal**: Triggered when the MACD line crosses above the signal line, and the MACD histogram turns positive (above zero). This suggests increasing bullish momentum.
- **Sell Signal**: Triggered when the MACD line crosses below the signal line, and the MACD histogram turns negative (below zero), indicating growing bearish momentum.
Once a signal is detected, the strategy opens a position (long for buy, short for sell) with a position size calculated based on your risk tolerance. It includes a stop-loss to limit losses and a take-profit to lock in gains, both dynamically adjusted using the Average True Range (ATR) for adaptability to market volatility.
#### Key Features
- **MACD-Based Signals**: Relies solely on MACD for entry points, plotted in a separate pane for clear momentum analysis.
- **Risk Management**: Automatically calculates position size based on a percentage of your account balance and sets stop-loss and take-profit levels using ATR multipliers and a risk:reward ratio.
- **Visual Feedback**: Plots entry, stop-loss, and take-profit lines on the chart with labeled markers for easy tracking.
- **Alerts**: Includes Bitget webhook-compatible alerts for automated trading, notifying you of buy and sell signals in real-time.
#### Input Parameters
- **Account Balance**: Default 10000 – Set your initial trading capital to determine position sizing.
- **MACD Fast Length**: Default 12 – The short-term EMA period for MACD sensitivity.
- **MACD Slow Length**: Default 26 – The long-term EMA period for MACD calculation.
- **MACD Signal Length**: Default 9 – The smoothing period for the signal line.
- **Risk Per Trade (%)**: Default 3.0 – The percentage of your account balance risked per trade (e.g., 3% of 10000 = 300).
- **Risk:Reward Ratio**: Default 3.0 – The ratio of potential profit to risk (e.g., 3:1 means risking 1 to gain 3).
- **SL Multiplier**: Default 1.0 – Multiplies ATR to set the stop-loss distance (e.g., 1.0 x ATR).
- **TP Multiplier**: Default 3.0 – Multiplies ATR to set the take-profit distance, adjusted by the risk:reward ratio.
- **Line Length (bars)**: Default 25 – Duration in bars for displaying trade lines on the chart.
- **Label Position**: Default 'left' – Position of text labels (left or right) relative to trade lines.
- **ATR Period**: Default 14 – The number of periods for calculating ATR to measure volatility.
#### How to Use
1. **Add to Chart**: Load the "MACD Strategy" as a strategy and the "MACD Indicator" as a separate indicator on your TradingView chart (recommended for BTCUSDT Futures on the 1-minute timeframe).
2. **Customize Settings**: Adjust the input parameters based on your risk tolerance and market conditions. For BTCUSDT Futures, consider reducing `Risk Per Trade (%)` during high volatility (e.g., 1%) or increasing `SL Multiplier` for wider stops.
3. **Visual Analysis**: Watch the main chart for trade entry lines (green for buy, red for sell), stop-loss (red), and take-profit (green) lines with labels. Use the MACD pane below to confirm momentum shifts.
4. **Set Alerts**: Create alerts in TradingView for "Buy Signal" and "Sell Signal" to automate trades via Bitget webhooks.
5. **Backtest and Optimize**: Test the strategy on historical BTCUSDT Futures 1-minute data to fine-tune parameters. The short timeframe requires quick execution, so monitor closely for slippage or latency.
#### Tips for Success
- **Market Conditions**: This strategy performs best in trending markets on the 1-minute timeframe. Avoid choppy conditions where MACD crossovers may produce false signals.
- **Risk Management**: Start with the default 3% risk per trade and adjust downward (e.g., 1%) during volatile periods like BTCUSDT news events. The 3:1 risk:reward ratio targets consistent profitability.
- **Timeframe**: Optimized for 1-minute charts; switch to 5-minute or 15-minute for less noise if needed.
- **Confirmation**: Cross-check MACD signals with price action or support/resistance levels for higher accuracy on BTCUSDT Futures.
#### Limitations
- This strategy relies solely on MACD, so it may lag in fast-moving or sideways markets. Consider adding a secondary filter (e.g., RSI) if needed.
- Stop-loss and take-profit are ATR-based and may need adjustment for BTCUSDT Futures’ high volatility, especially during leverage trading.
#### Conclusion
The "MACD Strategy" offers a simple yet effective way to trade momentum shifts using the MACD indicator, tested for BTCUSDT Futures on the 1-minute timeframe, with robust risk management and visual tools. Whether you’re scalping crypto futures or exploring short-term trends, this strategy provides a solid foundation for automated or manual trading. Share your feedback or customizations in the comments, and happy trading!

HL2 Moving Average with BandsThis indicator is designed to assist traders in identifying potential trade entries and exits for S&P 500 (ES) and Nasdaq-100 (NQ) futures. It calculates a Simple Moving Average (SMA) based on the HL2 value (average of high and low prices) of the current candle over a user-defined lookback period (default: 200 periods). The indicator plots this SMA as a blue line, providing a smoothed reference for price trends.
Additionally, it includes upper and lower bands calculated as a percentage (default: 0.5%) above and below the SMA, plotted as green and red lines, respectively. These bands act as dynamic thresholds to identify overbought or oversold conditions. The indicator generates trade signals based on price action relative to these bands:
Long Entry: A green upward triangle is plotted below the candle when the close crosses above the upper band, signaling a potential buy.
Close Long: A red square is plotted above the candle when the close crosses back below the upper band, indicating an exit for the long position.
Short Entry: A red downward triangle is plotted above the candle when the close crosses below the lower band, signaling a potential sell.
Close Short: A green square is plotted below the candle when the close crosses back above the lower band, indicating an exit for the short position.
The script is customizable, allowing users to adjust the SMA length and band percentage to suit their trading style or market conditions. It is plotted as an overlay on the price chart for easy integration with other technical analysis tools.
Recommended Time Frame and Settings for Trading S&P 500 and Nasdaq-100 Futures
Based on research and market dynamics for S&P 500 (ES) and Nasdaq-100 (NQ) futures, the 5-minute chart is recommended as the optimal time frame for day trading with this indicator. This time frame strikes a balance between capturing intraday trends and filtering out excessive noise, which is critical for futures trading due to their high volatility and leverage. The 5-minute chart aligns well with periods of high liquidity and volatility, such as the U.S. market open (9:30 AM–11:00 AM EST) and the afternoon session (2:00 PM–4:00 PM EST), when institutional traders are most active.
Why 5-minute? It allows traders to react to short-term price movements while avoiding the rapid fluctuations of 1-minute charts, which can be prone to false signals in choppy markets. It also provides enough data points to make the SMA and bands meaningful without the lag associated with longer time frames like 15-minute or hourly charts.
Recommended Settings
SMA Length: Set to 200 periods. This longer lookback period smooths the HL2 data, reducing noise and providing a reliable trend reference for the 5-minute chart. A 200-period SMA helps identify significant trend shifts without being overly sensitive to minor price fluctuations.
Band Percentage: 0.5% is more suitable for the volatility of ES and NQ futures on a 5-minute chart, as it generates fewer but higher-probability signals. Wider bands (e.g., 1%) may miss short-term opportunities, while narrower bands (e.g., 0.1%) may produce excessive false signals.
Trading Session Recommendations
Futures markets for ES and NQ are open nearly 24 hours (Sunday 6:00 PM EST to Friday 5:00 PM EST, with a daily break from 4:00 PM–5:00 PM EST), but not all hours are equally optimal due to varying liquidity and volatility. The best times to trade with this indicator are:
U.S. Market Open (9:30 AM–11:00 AM EST): This period is characterized by high volume and volatility, driven by the opening of U.S. equity markets and economic data releases (e.g., 8:30 AM EST reports like CPI or GDP). The indicator’s signals are more reliable during this window due to strong order flow and price momentum.
Afternoon Session (2:00 PM–4:00 PM EST): After the lunchtime lull, volume picks up as institutional traders return, and news or FOMC announcements often drive price action. The indicator can capture breakout moves as prices test the upper or lower bands.
Pre-Market (7:30 AM–9:30 AM EST): For traders comfortable with lower liquidity, this period can offer opportunities, especially around 8:30 AM EST economic releases. However, use tighter risk management due to wider spreads and potential volatility spikes.
Additional Tips
Avoid Low-Volume Periods: Steer clear of trading during low-liquidity hours, such as the overnight session (11:00 PM–3:00 AM EST), when spreads widen and price movements can be erratic, leading to false signals from the indicator.
Combine with Other Tools: Enhance the indicator’s effectiveness by pairing it with support/resistance levels, Fibonacci retracements, or volume analysis to confirm signals. For example, a long entry signal above the upper band is stronger if it coincides with a breakout above a key resistance level.
Risk Management: Given the leverage in futures (e.g., Micro E-mini contracts require ~$1,200 margin for ES), use tight stop-losses (e.g., below the lower band for longs or above the upper band for shorts) to manage risk. Aim for a risk-reward ratio of at least 1:2.
Test Settings: Backtest the indicator on a demo account to optimize the SMA length and band percentage for your specific trading style and risk tolerance. Micro E-mini contracts (MES for S&P 500, MNQ for Nasdaq-100) are ideal for testing due to their lower capital requirements.
Why These Settings and Time Frame?
The 5-minute chart with a 200-period SMA and 0.5% bands is tailored for the volatility and liquidity of ES and NQ futures during peak trading hours. The longer SMA period ensures the indicator captures meaningful trends, while the 0.5% bands are tight enough to signal actionable breakouts but wide enough to avoid excessive whipsaws. Trading during high-volume sessions maximizes the likelihood of valid signals, as institutional participation drives clearer price action.
By focusing on these settings and time frames, traders can leverage the indicator to capitalize on the dynamic price movements of S&P 500 and Nasdaq-100 futures while managing the inherent risks of these markets.

Request█ OVERVIEW
This library is a tool for Pine Script™ programmers that consolidates access to a wide range of lesser-known data feeds available on TradingView, including metrics from the FRED database, FINRA short sale volume, open interest, and COT data. The functions in this library simplify requests for these data feeds, making them easier to retrieve and use in custom scripts.
█ CONCEPTS
Federal Reserve Economic Data (FRED)
FRED (Federal Reserve Economic Data) is a comprehensive online database curated by the Federal Reserve Bank of St. Louis. It provides free access to extensive economic and financial data from U.S. and international sources. FRED includes numerous economic indicators such as GDP, inflation, employment, and interest rates. Additionally, it provides financial market data, regional statistics, and international metrics such as exchange rates and trade balances.
Sourced from reputable organizations, including U.S. government agencies, international institutions, and other public and private entities, FRED enables users to analyze over 825,000 time series, download their data in various formats, and integrate their information into analytical tools and programming workflows.
On TradingView, FRED data is available from ticker identifiers with the "FRED:" prefix. Users can search for FRED symbols in the "Symbol Search" window, and Pine scripts can retrieve data for these symbols via `request.*()` function calls.
FINRA Short Sale Volume
FINRA (the Financial Industry Regulatory Authority) is a non-governmental organization that supervises and regulates U.S. broker-dealers and securities professionals. Its primary aim is to protect investors and ensure integrity and transparency in financial markets.
FINRA's Short Sale Volume data provides detailed information about daily short-selling activity across U.S. equity markets. This data tracks the volume of short sales reported to FINRA's trade reporting facilities (TRFs), including shares sold on FINRA-regulated Alternative Trading Systems (ATSs) and over-the-counter (OTC) markets, offering transparent access to short-selling information not typically available from exchanges. This data helps market participants, researchers, and regulators monitor trends in short-selling and gain insights into bearish sentiment, hedging strategies, and potential market manipulation. Investors often use this data alongside other metrics to assess stock performance, liquidity, and overall trading activity.
It is important to note that FINRA's Short Sale Volume data does not consolidate short sale information from public exchanges and excludes trading activity that is not publicly disseminated.
TradingView provides ticker identifiers for requesting Short Sale Volume data with the format "FINRA:_SHORT_VOLUME", where "" is a supported U.S. equities symbol (e.g., "AAPL").
Open Interest (OI)
Open interest is a cornerstone indicator of market activity and sentiment in derivatives markets such as options or futures. In contrast to volume, which measures the number of contracts opened or closed within a period, OI measures the number of outstanding contracts that are not yet settled. This distinction makes OI a more robust indicator of how money flows through derivatives, offering meaningful insights into liquidity, market interest, and trends. Many traders and investors analyze OI alongside volume and price action to gain an enhanced perspective on market dynamics and reinforce trading decisions.
TradingView offers many ticker identifiers for requesting OI data with the format "_OI", where "" represents a derivative instrument's ticker ID (e.g., "COMEX:GC1!").
Commitment of Traders (COT)
Commitment of Traders data provides an informative weekly breakdown of the aggregate positions held by various market participants, including commercial hedgers, non-commercial speculators, and small traders, in the U.S. derivative markets. Tallied and managed by the Commodity Futures Trading Commission (CFTC) , these reports provide traders and analysts with detailed insight into an asset's open interest and help them assess the actions of various market players. COT data is valuable for gaining a deeper understanding of market dynamics, sentiment, trends, and liquidity, which helps traders develop informed trading strategies.
TradingView has numerous ticker identifiers that provide access to time series containing data for various COT metrics. To learn about COT ticker IDs and how they work, see our LibraryCOT publication.
█ USING THE LIBRARY
Common function characteristics
• This library's functions construct ticker IDs with valid formats based on their specified parameters, then use them as the `symbol` argument in request.security() to retrieve data from the specified context.
• Most of these functions automatically select the timeframe of a data request because the data feeds are not available for all timeframes.
• All the functions have two overloads. The first overload of each function uses values with the "simple" qualifier to define the requested context, meaning the context does not change after the first script execution. The second accepts "series" values, meaning it can request data from different contexts across executions.
• The `gaps` parameter in most of these functions specifies whether the returned data is `na` when a new value is unavailable for request. By default, its value is `false`, meaning the call returns the last retrieved data when no new data is available.
• The `repaint` parameter in applicable functions determines whether the request can fetch the latest unconfirmed values from a higher timeframe on realtime bars, which might repaint after the script restarts. If `false`, the function only returns confirmed higher-timeframe values to avoid repainting. The default value is `true`.
`fred()`
The `fred()` function retrieves the most recent value of a specified series from the Federal Reserve Economic Data (FRED) database. With this function, programmers can easily fetch macroeconomic indicators, such as GDP and unemployment rates, and use them directly in their scripts.
How it works
The function's `fredCode` parameter accepts a "string" representing the unique identifier of a specific FRED series. Examples include "GDP" for the "Gross Domestic Product" series and "UNRATE" for the "Unemployment Rate" series. Over 825,000 codes are available. To access codes for available series, search the FRED website .
The function adds the "FRED:" prefix to the specified `fredCode` to construct a valid FRED ticker ID (e.g., "FRED:GDP"), which it uses in request.security() to retrieve the series data.
Example Usage
This line of code requests the latest value from the Gross Domestic Product series and assigns the returned value to a `gdpValue` variable:
float gdpValue = fred("GDP")
`finraShortSaleVolume()`
The `finraShortSaleVolume()` function retrieves EOD data from a FINRA Short Sale Volume series. Programmers can call this function to retrieve short-selling information for equities listed on supported exchanges, namely NASDAQ, NYSE, and NYSE ARCA.
How it works
The `symbol` parameter determines which symbol's short sale volume information is retrieved by the function. If the value is na , the function requests short sale volume data for the chart's symbol. The argument can be the name of the symbol from a supported exchange (e.g., "AAPL") or a ticker ID with an exchange prefix ("NASDAQ:AAPL"). If the `symbol` contains an exchange prefix, it must be one of the following: "NASDAQ", "NYSE", "AMEX", or "BATS".
The function constructs a ticker ID in the format "FINRA:ticker_SHORT_VOLUME", where "ticker" is the symbol name without the exchange prefix (e.g., "AAPL"). It then uses the ticker ID in request.security() to retrieve the available data.
Example Usage
This line of code retrieves short sale volume for the chart's symbol and assigns the result to a `shortVolume` variable:
float shortVolume = finraShortSaleVolume(syminfo.tickerid)
This example requests short sale volume for the "NASDAQ:AAPL" symbol, irrespective of the current chart:
float shortVolume = finraShortSaleVolume("NASDAQ:AAPL")
`openInterestFutures()` and `openInterestCrypto()`
The `openInterestFutures()` function retrieves EOD open interest (OI) data for futures contracts. The `openInterestCrypto()` function provides more granular OI data for cryptocurrency contracts.
How they work
The `openInterestFutures()` function retrieves EOD closing OI information. Its design is focused primarily on retrieving OI data for futures, as only EOD OI data is available for these instruments. If the chart uses an intraday timeframe, the function requests data from the "1D" timeframe. Otherwise, it uses the chart's timeframe.
The `openInterestCrypto()` function retrieves opening, high, low, and closing OI data for a cryptocurrency contract on a specified timeframe. Unlike `openInterest()`, this function can also retrieve granular data from intraday timeframes.
Both functions contain a `symbol` parameter that determines the symbol for which the calls request OI data. The functions construct a valid OI ticker ID from the chosen symbol by appending "_OI" to the end (e.g., "CME:ES1!_OI").
The `openInterestFutures()` function requests and returns a two-element tuple containing the futures instrument's EOD closing OI and a "bool" condition indicating whether OI is rising.
The `openInterestCrypto()` function requests and returns a five-element tuple containing the cryptocurrency contract's opening, high, low, and closing OI, and a "bool" condition indicating whether OI is rising.
Example usage
This code line calls `openInterest()` to retrieve EOD OI and the OI rising condition for a futures symbol on the chart, assigning the values to two variables in a tuple:
= openInterestFutures(syminfo.tickerid)
This line retrieves the EOD OI data for "CME:ES1!", irrespective of the current chart's symbol:
= openInterestFutures("CME:ES1!")
This example uses `openInterestCrypto()` to retrieve OHLC OI data and the OI rising condition for a cryptocurrency contract on the chart, sampled at the chart's timeframe. It assigns the returned values to five variables in a tuple:
= openInterestCrypto(syminfo.tickerid, timeframe.period)
This call retrieves OI OHLC and rising information for "BINANCE:BTCUSDT.P" on the "1D" timeframe:
= openInterestCrypto("BINANCE:BTCUSDT.P", "1D")
`commitmentOfTraders()`
The `commitmentOfTraders()` function retrieves data from the Commitment of Traders (COT) reports published by the Commodity Futures Trading Commission (CFTC). This function significantly simplifies the COT request process, making it easier for programmers to access and utilize the available data.
How It Works
This function's parameters determine different parts of a valid ticker ID for retrieving COT data, offering a streamlined alternative to constructing complex COT ticker IDs manually. The `metricName`, `metricDirection`, and `includeOptions` parameters are required. They specify the name of the reported metric, the direction, and whether it includes information from options contracts.
The function also includes several optional parameters. The `CFTCCode` parameter allows programmers to request data for a specific report code. If unspecified, the function requests data based on the chart symbol's root prefix, base currency, or quoted currency, depending on the `mode` argument. The call can specify the report type ("Legacy", "Disaggregated", or "Financial") and metric type ("All", "Old", or "Other") with the `typeCOT` and `metricType` parameters.
Explore the CFTC website to find valid report codes for specific assets. To find detailed information about the metrics included in the reports and their meanings, see the CFTC's Explanatory Notes .
View the function's documentation below for detailed explanations of its parameters. For in-depth information about COT ticker IDs and more advanced functionality, refer to our previously published COT library .
Available metrics
Different COT report types provide different metrics . The tables below list all available metrics for each type and their applicable directions:
+------------------------------+------------------------+
| Legacy (COT) Metric Names | Directions |
+------------------------------+------------------------+
| Open Interest | No direction |
| Noncommercial Positions | Long, Short, Spreading |
| Commercial Positions | Long, Short |
| Total Reportable Positions | Long, Short |
| Nonreportable Positions | Long, Short |
| Traders Total | No direction |
| Traders Noncommercial | Long, Short, Spreading |
| Traders Commercial | Long, Short |
| Traders Total Reportable | Long, Short |
| Concentration Gross LT 4 TDR | Long, Short |
| Concentration Gross LT 8 TDR | Long, Short |
| Concentration Net LT 4 TDR | Long, Short |
| Concentration Net LT 8 TDR | Long, Short |
+------------------------------+------------------------+
+-----------------------------------+------------------------+
| Disaggregated (COT2) Metric Names | Directions |
+-----------------------------------+------------------------+
| Open Interest | No Direction |
| Producer Merchant Positions | Long, Short |
| Swap Positions | Long, Short, Spreading |
| Managed Money Positions | Long, Short, Spreading |
| Other Reportable Positions | Long, Short, Spreading |
| Total Reportable Positions | Long, Short |
| Nonreportable Positions | Long, Short |
| Traders Total | No Direction |
| Traders Producer Merchant | Long, Short |
| Traders Swap | Long, Short, Spreading |
| Traders Managed Money | Long, Short, Spreading |
| Traders Other Reportable | Long, Short, Spreading |
| Traders Total Reportable | Long, Short |
| Concentration Gross LE 4 TDR | Long, Short |
| Concentration Gross LE 8 TDR | Long, Short |
| Concentration Net LE 4 TDR | Long, Short |
| Concentration Net LE 8 TDR | Long, Short |
+-----------------------------------+------------------------+
+-------------------------------+------------------------+
| Financial (COT3) Metric Names | Directions |
+-------------------------------+------------------------+
| Open Interest | No Direction |
| Dealer Positions | Long, Short, Spreading |
| Asset Manager Positions | Long, Short, Spreading |
| Leveraged Funds Positions | Long, Short, Spreading |
| Other Reportable Positions | Long, Short, Spreading |
| Total Reportable Positions | Long, Short |
| Nonreportable Positions | Long, Short |
| Traders Total | No Direction |
| Traders Dealer | Long, Short, Spreading |
| Traders Asset Manager | Long, Short, Spreading |
| Traders Leveraged Funds | Long, Short, Spreading |
| Traders Other Reportable | Long, Short, Spreading |
| Traders Total Reportable | Long, Short |
| Concentration Gross LE 4 TDR | Long, Short |
| Concentration Gross LE 8 TDR | Long, Short |
| Concentration Net LE 4 TDR | Long, Short |
| Concentration Net LE 8 TDR | Long, Short |
+-------------------------------+------------------------+
Example usage
This code line retrieves "Noncommercial Positions (Long)" data, without options information, from the "Legacy" report for the chart symbol's root, base currency, or quote currency:
float nonCommercialLong = commitmentOfTraders("Noncommercial Positions", "Long", false)
This example retrieves "Managed Money Positions (Short)" data, with options included, from the "Disaggregated" report:
float disaggregatedData = commitmentOfTraders("Managed Money Positions", "Short", true, "", "Disaggregated")
█ NOTES
• This library uses dynamic requests , allowing dynamic ("series") arguments for the parameters defining the context (ticker ID, timeframe, etc.) of a `request.*()` function call. With this feature, a single `request.*()` call instance can flexibly retrieve data from different feeds across historical executions. Additionally, scripts can use such calls in the local scopes of loops, conditional structures, and even exported library functions, as demonstrated in this script. All scripts coded in Pine Script™ v6 have dynamic requests enabled by default. To learn more about the behaviors and limitations of this feature, see the Dynamic requests section of the Pine Script™ User Manual.
• The library's example code offers a simple demonstration of the exported functions. The script retrieves available data using the function specified by the "Series type" input. The code requests a FRED series or COT (Legacy), FINRA Short Sale Volume, or Open Interest series for the chart's symbol with specific parameters, then plots the retrieved data as a step-line with diamond markers.
Look first. Then leap.
█ EXPORTED FUNCTIONS
This library exports the following functions:
fred(fredCode, gaps)
Requests a value from a specified Federal Reserve Economic Data (FRED) series. FRED is a comprehensive source that hosts numerous U.S. economic datasets. To explore available FRED datasets and codes, search for specific categories or keywords at fred.stlouisfed.org Calls to this function count toward a script's `request.*()` call limit.
Parameters:
fredCode (series string) : The unique identifier of the FRED series. The function uses the value to create a valid ticker ID for retrieving FRED data in the format `"FRED:fredCode"`. For example, `"GDP"` refers to the "Gross Domestic Product" series ("FRED:GDP"), and `"GFDEBTN"` refers to the "Federal Debt: Total Public Debt" series ("FRED:GFDEBTN").
gaps (simple bool) : Optional. If `true`, the function returns a non-na value only when a new value is available from the requested context. If `false`, the function returns the latest retrieved value when new data is unavailable. The default is `false`.
Returns: (float) The value from the requested FRED series.
finraShortSaleVolume(symbol, gaps, repaint)
Requests FINRA daily short sale volume data for a specified symbol from one of the following exchanges: NASDAQ, NYSE, NYSE ARCA. If the chart uses an intraday timeframe, the function requests data from the "1D" timeframe. Otherwise, it uses the chart's timeframe. Calls to this function count toward a script's `request.*()` call limit.
Parameters:
symbol (series string) : The symbol for which to request short sale volume data. If the specified value contains an exchange prefix, it must be one of the following: "NASDAQ", "NYSE", "AMEX", "BATS".
gaps (simple bool) : Optional. If `true`, the function returns a non-na value only when a new value is available from the requested context. If `false`, the function returns the latest retrieved value when new data is unavailable. The default is `false`.
repaint (simple bool) : Optional. If `true` and the chart's timeframe is intraday, the value requested on realtime bars may change its time offset after the script restarts its executions. If `false`, the function returns the last confirmed period's values to avoid repainting. The default is `true`.
Returns: (float) The short sale volume for the specified symbol or the chart's symbol.
openInterestFutures(symbol, gaps, repaint)
Requests EOD open interest (OI) and OI rising information for a valid futures symbol. If the chart uses an intraday timeframe, the function requests data from the "1D" timeframe. Otherwise, it uses the chart's timeframe. Calls to this function count toward a script's `request.*()` call limit.
Parameters:
symbol (series string) : The symbol for which to request open interest data.
gaps (simple bool) : Optional. If `true`, the function returns non-na values only when new values are available from the requested context. If `false`, the function returns the latest retrieved values when new data is unavailable. The default is `false`.
repaint (simple bool) : Optional. If `true` and the chart's timeframe is intraday, the value requested on realtime bars may change its time offset after the script restarts its executions. If `false`, the function returns the last confirmed period's values to avoid repainting. The default is `true`.
Returns: ( ) A tuple containing the following values:
- The closing OI value for the symbol.
- `true` if the closing OI is above the previous period's value, `false` otherwise.
openInterestCrypto(symbol, timeframe, gaps, repaint)
Requests opening, high, low, and closing open interest (OI) data and OI rising information for a valid cryptocurrency contract on a specified timeframe. Calls to this function count toward a script's `request.*()` call limit.
Parameters:
symbol (series string) : The symbol for which to request open interest data.
timeframe (series string) : The timeframe of the data request. If the timeframe is lower than the chart's timeframe, it causes a runtime error.
gaps (simple bool) : Optional. If `true`, the function returns non-na values only when new values are available from the requested context. If `false`, the function returns the latest retrieved values when new data is unavailable. The default is `false`.
repaint (simple bool) : Optional. If `true` and the `timeframe` represents a higher timeframe, the function returns unconfirmed values from the timeframe on realtime bars, which repaint when the script restarts its executions. If `false`, it returns only confirmed higher-timeframe values to avoid repainting. The default is `true`.
Returns: ( ) A tuple containing the following values:
- The opening, high, low, and closing OI values for the symbol, respectively.
- `true` if the closing OI is above the previous period's value, `false` otherwise.
commitmentOfTraders(metricName, metricDirection, includeOptions, CFTCCode, typeCOT, mode, metricType)
Requests Commitment of Traders (COT) data with specified parameters. This function provides a simplified way to access CFTC COT data available on TradingView. Calls to this function count toward a script's `request.*()` call limit. For more advanced tools and detailed information about COT data, see TradingView's LibraryCOT library.
Parameters:
metricName (series string) : One of the valid metric names listed in the library's documentation and source code.
metricDirection (series string) : Metric direction. Possible values are: "Long", "Short", "Spreading", and "No direction". Consult the library's documentation or code to see which direction values apply to the specified metric.
includeOptions (series bool) : If `true`, the COT symbol includes options information. Otherwise, it does not.
CFTCCode (series string) : Optional. The CFTC code for the asset. For example, wheat futures (root "ZW") have the code "001602". If one is not specified, the function will attempt to get a valid code for the chart symbol's root, base currency, or main currency.
typeCOT (series string) : Optional. The type of report to request. Possible values are: "Legacy", "Disaggregated", "Financial". The default is "Legacy".
mode (series string) : Optional. Specifies the information the function extracts from a symbol. Possible modes are:
- "Root": The function extracts the futures symbol's root prefix information (e.g., "ES" for "ESH2020").
- "Base currency": The function extracts the first currency from a currency pair (e.g., "EUR" for "EURUSD").
- "Currency": The function extracts the currency of the symbol's quoted values (e.g., "JPY" for "TSE:9984" or "USDJPY").
- "Auto": The function tries the first three modes (Root -> Base currency -> Currency) until it finds a match.
The default is "Auto". If the specified mode is not available for the symbol, it causes a runtime error.
metricType (series string) : Optional. The metric type. Possible values are: "All", "Old", "Other". The default is "All".
Returns: (float) The specified Commitment of Traders data series. If no data is available, it causes a runtime error.

MM Day Trader LevelsAs an intraday trader, there are certain key levels that I care about for short-term price action on every single chart. When I first began day trading, each morning I would painstakingly mark those key levels off on the charts I planned to trade each day. Depending on the number of charts I was watching, this would take up quite a bit of my time that I felt would have been much better spent doing other things. It also meant that those levels would often be left behind, and on later days I might be trading a symbol and get confused when a line appeared and I'd be paying attention to it only to later discover that it wasn't from prior day, but from some other day in the past when I had marked it off.
I looked all over TradingView to find indicators that did this automatically for me, and I found a lot of them. One by one I tried them, and inevitably I would always find that something was wrong with them. Often they didn't have all of the levels I wanted (so I would have to combine multiple indicators), but more often I found that the levels would be incorrect, or they would be buggy and not appear consistently, or they would not appear at the right time, or they would not work on futures! The list of problems went on and on. And the biggest issue I found was that nobody knew how to get session volume profile in an indicator.
So, over the course of a few years I figured out how to solve all of those problems and now I'm thrilled to present this free indicator for everyone like me who trades intraday and wants a clean consistent way to see the prior day levels that they care about automatically on every single chart (even futures). The levels the indicator provides are:
Yesterday High & Low
Value Area High & Low & Point of Control
Today's Open
Yesterday's Close (aka "Settlement" on futures)
Premarket High & Low (non-futures only)
Overnight High & Low (futures only)
These levels are extremely important, and I expect price to be reactive to them, so each level has a shaded background behind it so that the levels stand out against other lines you may have on your chart. I try to keep configuration as simple as possible, but there are configuration options that allow you to:
Hide any of the levels
Change the color for the levels
Shade the value area (or not)
Change the label text, size, type (basic label or plain text) and location (how far to the right of last candle to place the label
Adjust session volume profile value area volume & number of rows
The biggest advantage to this indicator over others on TradingView is how it handles session volume profile. When it comes to futures, TradingView does differentiate between regular trading hours and "electronic" trading hours on the charts, but their timeframes for those sessions are unusual, and they do not provide any programmatic way to differentiate between them. So, I created a whole new library for dealing with futures sessions that is fully integrated into both my Session Volume Profile library and this indicator, allowing me to bring you the best and only custom indicator available on TradingView that provides you with true regular session volume profile information across every type of symbol, including futures.
I'm incredibly proud of everything I've been able to provide with this indicator, and even more thrilled to say that I'm proud of how the indicator has been implemented. Once again releasing this indicator and all associated code for free and open source. I encourage you to take a look at the source code to see how it all works, take advantage of the free underlying libraries I created to make all of this possible: Session Library and Session Volume Profile Library.

Commitment of Traders: Total█ OVERVIEW
This indicator displays the Commitment of Traders (COT) totals data for futures markets.
█ CONCEPTS
Commitment of Traders (COT) data is tallied by the Commodity Futures Trading Commission (CFTC) , a US federal agency that oversees the trading of derivative markets such as futures in the US. It is weekly data that provides traders with information about open interest for an asset. The CFTC oversees derivative markets traded on different exchanges, so COT data is available for assets that can be traded on CBOT, CME, NYMEX, COMEX, and ICEUS.
A detailed description of the COT report can be found on the CFTC's website .
COT data is separated into three notable reports: Legacy, Disaggregated, and Financial. This indicator presents specific data from the COT Legacy report. The Total data details the positions held by various traders: Commercial Hedgers (traders registered with CFTC that use futures contracts in that particular commodity for hedging), Large Traders (traders registered with CFTC that do not hedge that particular commodity) and Small Traders (not registered with CFTC).
Our other COT indicators are:
• Commitment of Traders: Legacy Metrics
• Commitment of Traders: Disaggregated Metrics
• Commitment of Traders: Financial Metrics
█ HOW TO USE IT
Load the indicator on an active chart (see here if you don't know how).
By default, the indicator uses the chart's symbol to derive the COT data it displays. You can also specify a CFTC code in the "CFTC code" field of the script's inputs to display COT data from a symbol different than the chart's.
The rest of this section documents the script's input fields.
COT Selection Mode
This field's value determines how the script determines which COT data to return from the chart's symbol:
- "Root" uses the root of a futures symbol ("ES" for "ESH2020").
- "Base currency" uses the base currency in a forex pair ("EUR" for "EURUSD").
- "Currency" uses the quote currency, i.e., the currency the symbol is traded in ("JPY" for "TSE:9984" or "USDJPY").
- "Auto" tries all modes, in turn.
If no COT data can be found, a runtime error is generated.
Note that if the "CTFC Code" input field contains a code, it will override this input.
Futures/Options
Specifies the type of Commitment of Traders data to display: data concerning only Futures, only Options, or both.
Display
Determines the direction of the metrics requested from the CTFC report.
CTFC Code
Instead of letting the script generate the CFTC COT code from the chart and the "COT Selection Mode" input when this field is empty, you can specify an unrelated CFTC COT code here, e.g., 001602 for wheat futures.
Look first. Then leap.

Al Brooks_BarCount_Start from Opening🔹 Key Features
Counts from the RTH open every trading day
Stocks: 09:30–16:00 (New York Time)
Futures: 08:30–15:15 (Chicago Time)
Automatically detects stocks vs futures
Always displays the first bar of the session
Optional display every N bars to reduce chart clutter
Custom highlight rules
Highlight specific bar numbers (e.g. bar 18)
Highlight bar multiples (e.g. every 12 bars)
Fully customizable label size and colors
🔹 Why count from the open?
In Al Brooks’ Price Action framework:
The first 30–60 bars after the open often define the day’s structure
Trends, failed breakouts, and trading ranges frequently align with specific bar counts
Counting across overnight or pre-market sessions can distort intraday analysis
👉 This indicator resets precisely at the RTH open, keeping the count aligned with real trading decisions.
🔹 Inputs Overview
Display at every X bars
Show bar numbers at fixed intervals (bar 1 is always shown)
Count From RTH Open (Session Filter)
Limits counting strictly to regular trading hours (recommended ON)
Special Color Multiple
Highlights every N-th bar
Special Number 1 / 2
Highlights specific bar numbers
Label Size / Colors
Visual customization options
🔹 Markets Supported
✅ US index futures (ES, MES, NQ, MNQ, GC, CL – RTH)
✅ US stocks and indices (NYSE / NASDAQ)
❗ Not intended for 24h markets (e.g. crypto)
🔹 Usage Tips (Al Brooks Style)
Observe price behavior around early session bars (5–10)
Watch key counts like 12, 18, 24 for acceleration or failure
Combine with EMAs, trend lines, and trading-range highs/lows

Dynamic 5DMA/EMA with Color for Multiple Products🔹 Dynamic 5DMA/EMA with Slope-Based Coloring (All Timeframes)
This indicator plots a dynamic 5-period moving average that adapts intelligently to your chart's timeframe and product type — giving you a clean, slope-sensitive visual edge across intraday, daily, and weekly views.
✅ Key Features:
📈 Dynamic MA Length Scaling:
On intraday timeframes, the MA adjusts for your selected market session (RTH, ETH, VIX, or Futures), calculating a true 5-day average based on actual session length — not just a flat bar count.
🔄 Automatic Timeframe Detection:
Daily Chart: Uses standard 5DMA or 5EMA.
Weekly Chart: Applies a true 5-week MA.
Intraday Charts: Converts 5 days into bar-length equivalent dynamically.
🎨 Color-Coded Slope Logic:
Green = Rising MA (bullish slope)
Red = Falling MA (bearish slope)
Neutral slope = previous color held for visual continuity
No more guessing — direction is instantly clear.
⚠️ Built-In Slope Flip Alerts:
Set alerts when the slope of the MA turns up or down. Ideal for timing pullback entries or exits across any product.
⚙️ Session Settings for Proper Scaling:
Choose your product's market structure to ensure accurate 5-day conversion on intraday charts:
Stocks - RTH: 390 mins/day
Stocks - ETH: 780 mins/day
VIX: 855 mins/day
Futures: 1440 mins/day
This ensures the MA reflects 5 full trading days, regardless of session irregularities or bar interval.
📌 Why Use This Indicator?
Most MAs misrepresent trend direction on intraday charts because they assume static daily bar counts. This tool corrects that, then adds slope-based coloring to give you a fast, visual read on short-term momentum. Whether you’re swing trading SPY, scalping VIX, or position trading futures, this indicator keeps your view aligned with how institutions see moving averages across timeframes.
🔧 Best For:
VIX & volatility traders
Short-term SPY/SPX traders
Swing traders who value clean setups
Anyone wanting a true 5-day trend anchor on any chart
Dskyz (DAFE) Aurora Divergence – Quant Master Dskyz (DAFE) Aurora Divergence – Quant Master
Introducing the Dskyz (DAFE) Aurora Divergence – Quant Master , a strategy that’s your secret weapon for mastering futures markets like MNQ, NQ, MES, and ES. Born from the legendary Aurora Divergence indicator, this fully automated system transforms raw divergence signals into a quant-grade trading machine, blending precision, risk management, and cyberpunk DAFE visuals that make your charts glow like a neon skyline. Crafted with care and driven by community passion, this strategy stands out in a sea of generic scripts, offering traders a unique edge to outsmart institutional traps and navigate volatile markets.
The Aurora Divergence indicator was a cult favorite for spotting price-OBV divergences with its aqua and fuchsia orbs, but traders craved a system to act on those signals with discipline and automation. This strategy delivers, layering advanced filters (z-score, ATR, multi-timeframe, session), dynamic risk controls (kill switches, adaptive stops/TPs), and a real-time dashboard to turn insights into profits. Whether you’re a newbie dipping into futures or a pro hunting reversals, this strat’s got your back with a beginner guide, alerts, and visuals that make trading feel like a sci-fi mission. Let’s dive into every detail and see why this original DAFE creation is a must-have.
Why Traders Need This Strategy
Futures markets are a battlefield—fast-paced, volatile, and riddled with institutional games that can wipe out undisciplined traders. From the April 28, 2025 NQ 1k-point drop to sneaky ES slippage, the stakes are high. Meanwhile, platforms are flooded with unoriginal, low-effort scripts that promise the moon but deliver noise. The Aurora Divergence – Quant Master rises above, offering:
Unmatched Originality: A bespoke system built from the ground up, with custom divergence logic, DAFE visuals, and quant filters that set it apart from copycat clutter.
Automation with Precision: Executes trades on divergence signals, eliminating emotional slip-ups and ensuring consistency, even in chaotic sessions.
Quant-Grade Filters: Z-score, ATR, multi-timeframe, and session checks filter out noise, targeting high-probability reversals.
Robust Risk Management: Daily loss and rolling drawdown kill switches, plus ATR-based stops/TPs, protect your capital like a fortress.
Stunning DAFE Visuals: Aqua/fuchsia orbs, aurora bands, and a glowing dashboard make signals intuitive and charts a work of art.
Community-Driven: Evolved from trader feedback, this strat’s a labor of love, not a recycled knockoff.
Traders need this because it’s a complete, original system that blends accessibility, sophistication, and style. It’s your edge to trade smarter, not harder, in a market full of traps and imitators.
1. Divergence Detection (Core Signal Logic)
The strategy’s core is its ability to detect bullish and bearish divergences between price and On-Balance Volume (OBV), pinpointing reversals with surgical accuracy.
How It Works:
Price Slope: Uses linear regression over a lookback (default: 9 bars) to measure price momentum (priceSlope).
OBV Slope: OBV tracks volume flow (+volume if price rises, -volume if falls), with its slope calculated similarly (obvSlope).
Bullish Divergence: Price slope negative (falling), OBV slope positive (rising), and price above 50-bar SMA (trend_ma).
Bearish Divergence: Price slope positive (rising), OBV slope negative (falling), and price below 50-bar SMA.
Smoothing: Requires two consecutive divergence bars (bullDiv2, bearDiv2) to confirm signals, reducing false positives.
Strength: Divergence intensity (divStrength = |priceSlope * obvSlope| * sensitivity) is normalized (0–1, divStrengthNorm) for visuals.
Why It’s Brilliant:
- Divergences catch hidden momentum shifts, often exploited by institutions, giving you an edge on reversals.
- The 50-bar SMA filter aligns signals with the broader trend, avoiding choppy markets.
- Adjustable lookback (min: 3) and sensitivity (default: 1.0) let you tune for different instruments or timeframes.
2. Filters for Precision
Four advanced filters ensure signals are high-probability and market-aligned, cutting through the noise of volatile futures.
Z-Score Filter:
Logic: Calculates z-score ((close - SMA) / stdev) over a lookback (default: 50 bars). Blocks entries if |z-score| > threshold (default: 1.5) unless disabled (useZFilter = false).
Impact: Avoids trades during extreme price moves (e.g., blow-off tops), keeping you in statistically safe zones.
ATR Percentile Volatility Filter:
Logic: Tracks 14-bar ATR in a 100-bar window (default). Requires current ATR > 80th percentile (percATR) to trade (tradeOk).
Impact: Ensures sufficient volatility for meaningful moves, filtering out low-volume chop.
Multi-Timeframe (HTF) Trend Filter:
Logic: Uses a 50-bar SMA on a higher timeframe (default: 60min). Longs require price > HTF MA (bullTrendOK), shorts < HTF MA (bearTrendOK).
Impact: Aligns trades with the bigger trend, reducing counter-trend losses.
US Session Filter:
Logic: Restricts trading to 9:30am–4:00pm ET (default: enabled, useSession = true) using America/New_York timezone.
Impact: Focuses on high-liquidity hours, avoiding overnight spreads and erratic moves.
Evolution:
- These filters create a robust signal pipeline, ensuring trades are timed for optimal conditions.
- Customizable inputs (e.g., zThreshold, atrPercentile) let traders adapt to their style without compromising quality.
3. Risk Management
The strategy’s risk controls are a masterclass in balancing aggression and safety, protecting capital in volatile markets.
Daily Loss Kill Switch:
Logic: Tracks daily loss (dayStartEquity - strategy.equity). Halts trading if loss ≥ $300 (default) and enabled (killSwitch = true, killSwitchActive).
Impact: Caps daily downside, crucial during events like April 27, 2025 ES slippage.
Rolling Drawdown Kill Switch:
Logic: Monitors drawdown (rollingPeak - strategy.equity) over 100 bars (default). Stops trading if > $1000 (rollingKill).
Impact: Prevents prolonged losing streaks, preserving capital for better setups.
Dynamic Stop-Loss and Take-Profit:
Logic: Stops = entry ± ATR * multiplier (default: 1.0x, stopDist). TPs = entry ± ATR * 1.5x (profitDist). Longs: stop below, TP above; shorts: vice versa.
Impact: Adapts to volatility, keeping stops tight but realistic, with TPs targeting 1.5:1 reward/risk.
Max Bars in Trade:
Logic: Closes trades after 8 bars (default) if not already exited.
Impact: Frees capital from stagnant trades, maintaining efficiency.
Kill Switch Buffer Dashboard:
Logic: Shows smallest buffer ($300 - daily loss or $1000 - rolling DD). Displays 0 (red) if kill switch active, else buffer (green).
Impact: Real-time risk visibility, letting traders adjust dynamically.
Why It’s Brilliant:
- Kill switches and ATR-based exits create a safety net, rare in generic scripts.
- Customizable risk inputs (maxDailyLoss, dynamicStopMult) suit different account sizes.
- Buffer metric empowers disciplined trading, a DAFE signature.
4. Trade Entry and Exit Logic
The entry/exit rules are precise, filtered, and adaptive, ensuring trades are deliberate and profitable.
Entry Conditions:
Long Entry: bullDiv2, cooldown passed (canSignal), ATR filter passed (tradeOk), in US session (inSession), no kill switches (not killSwitchActive, not rollingKill), z-score OK (zOk), HTF trend bullish (bullTrendOK), no existing long (lastDirection != 1, position_size <= 0). Closes shorts first.
Short Entry: Same, but for bearDiv2, bearTrendOK, no long (lastDirection != -1, position_size >= 0). Closes longs first.
Adaptive Cooldown: Default 2 bars (cooldownBars). Doubles (up to 10) after a losing trade, resets after wins (dynamicCooldown).
Exit Conditions:
Stop-Loss/Take-Profit: Set per trade (ATR-based). Exits on stop/TP hits.
Other Exits: Closes if maxBarsInTrade reached, ATR filter fails, or kill switch activates.
Position Management: Ensures no conflicting positions, closing opposites before new entries.
Built To Be Reliable and Consistent:
- Multi-filtered entries minimize false signals, a stark contrast to basic scripts.
- Adaptive cooldown prevents overtrading, especially after losses.
- Clean position handling ensures smooth execution, even in fast markets.
5. DAFE Visuals
The visuals are a DAFE hallmark, blending function with clean flair to make signals intuitive and charts stunning.
Aurora Bands:
Display: Bands around price during divergences (bullish: below low, bearish: above high), sized by ATR * bandwidth (default: 0.5).
Colors: Aqua (bullish), fuchsia (bearish), with transparency tied to divStrengthNorm.
Purpose: Highlights divergence zones with a glowing, futuristic vibe.
Divergence Orbs:
Display: Large/small circles (aqua below for bullish, fuchsia above for bearish) when bullDiv2/bearDiv2 and canSignal. Labels show strength (0–1).
Purpose: Pinpoints entries with eye-catching clarity.
Gradient Background:
Display: Green (bullish), red (bearish), or gray (neutral), 90–95% transparent.
Purpose: Sets the market mood without clutter.
Strategy Plots:
- Stop/TP Lines: Red (stops), green (TPs) for active trades.
- HTF MA: Yellow line for trend context.
- Z-Score: Blue step-line (if enabled).
- Kill Switch Warning: Red background flash when active.
What Makes This Next-Level?:
- Visuals make complex signals (divergences, filters) instantly clear, even for beginners.
- DAFE’s unique aesthetic (orbs, bands) sets it apart from generic scripts, reinforcing originality.
- Functional plots (stops, TPs) enhance trade management.
6. Metrics Dashboard
The top-right dashboard (2x8 table) is your command center, delivering real-time insights.
Metrics:
Daily Loss ($): Current loss vs. day’s start, red if > $300.
Rolling DD ($): Drawdown vs. 100-bar peak, red if > $1000.
ATR Threshold: Current percATR, green if ATR exceeds, red if not.
Z-Score: Current value, green if within threshold, red if not.
Signal: “Bullish Div” (aqua), “Bearish Div” (fuchsia), or “None” (gray).
Action: “Consider Buying”/“Consider Selling” (signal color) or “Wait” (gray).
Kill Switch Buffer ($): Smallest buffer to kill switch, green if > 0, red if 0.
Why This Is Important?:
- Consolidates critical data, making decisions effortless.
- Color-coded metrics guide beginners (e.g., green action = go).
- Buffer metric adds transparency, rare in off-the-shelf scripts.
7. Beginner Guide
Beginner Guide: Middle-right table (shown once on chart load), explains aqua orbs (bullish, buy) and fuchsia orbs (bearish, sell).
Key Features:
Futures-Optimized: Tailored for MNQ, NQ, MES, ES with point-value adjustments.
Highly Customizable: Inputs for lookback, sensitivity, filters, and risk settings.
Real-Time Insights: Dashboard and visuals update every bar.
Backtest-Ready: Fixed qty and tick calc for accurate historical testing.
User-Friendly: Guide, visuals, and dashboard make it accessible yet powerful.
Original Design: DAFE’s unique logic and visuals stand out from generic scripts.
How to Use
Add to Chart: Load on a 5min MNQ/ES chart in TradingView.
Configure Inputs: Adjust instrument, filters, or risk (defaults optimized for MNQ).
Monitor Dashboard: Watch signals, actions, and risk metrics (top-right).
Backtest: Run in strategy tester to evaluate performance.
Live Trade: Connect to a broker (e.g., Tradovate) for automation. Watch for slippage (e.g., April 27, 2025 ES issues).
Replay Test: Use bar replay (e.g., April 28, 2025 NQ drop) to test volatility handling.
Disclaimer
Trading futures involves significant risk of loss and is not suitable for all investors. Past performance is not indicative of future results. Backtest results may not reflect live trading due to slippage, fees, or market conditions. Use this strategy at your own risk, and consult a financial advisor before trading. Dskyz (DAFE) Trading Systems is not responsible for any losses incurred.
Backtesting:
Frame: 2023-09-20 - 2025-04-29
Fee Typical Range (per side, per contract)
CME Exchange $1.14 – $1.20
Clearing $0.10 – $0.30
NFA Regulatory $0.02
Firm/Broker Commis. $0.25 – $0.80 (retail prop)
TOTAL $1.60 – $2.30 per side
Round Turn: (enter+exit) = $3.20 – $4.60 per contract
Final Notes
The Dskyz (DAFE) Aurora Divergence – Quant Master isn’t just a strategy—it’s a movement. Crafted with originality and driven by community passion, it rises above the flood of generic scripts to deliver a system that’s as powerful as it is beautiful. With its quant-grade logic, DAFE visuals, and robust risk controls, it empowers traders to tackle futures with confidence and style. Join the DAFE crew, light up your charts, and let’s outsmart the markets together!
(This publishing will most likely be taken down do to some miscellaneous rule about properly displaying charting symbols, or whatever. Once I've identified what part of the publishing they want to pick on, I'll adjust and repost.)
Use it with discipline. Use it with clarity. Trade smarter.
**I will continue to release incredible strategies and indicators until I turn this into a brand or until someone offers me a contract.
Created by Dskyz, powered by DAFE Trading Systems. Trade fast, trade bold.

Adaptivity: Measures of Dominant Cycles and Price Trend [Loxx]Adaptivity: Measures of Dominant Cycles and Price Trend is an indicator that outputs adaptive lengths using various methods for dominant cycle and price trend timeframe adaptivity. While the information output from this indicator might be useful for the average trader in one off circumstances, this indicator is really meant for those need a quick comparison of dynamic length outputs who wish to fine turn algorithms and/or create adaptive indicators.
This indicator compares adaptive output lengths of all publicly known adaptive measures. Additional adaptive measures will be added as they are discovered and made public.
The first released of this indicator includes 6 measures. An additional three measures will be added with updates. Please check back regularly for new measures.
Ehers:
Autocorrelation Periodogram
Band-pass
Instantaneous Cycle
Hilbert Transformer
Dual Differentiator
Phase Accumulation (future release)
Homodyne (future release)
Jurik:
Composite Fractal Behavior (CFB)
Adam White:
Veritical Horizontal Filter (VHF) (future release)
What is an adaptive cycle, and what is Ehlers Autocorrelation Periodogram Algorithm?
From his Ehlers' book Cycle Analytics for Traders Advanced Technical Trading Concepts by John F. Ehlers , 2013, page 135:
"Adaptive filters can have several different meanings. For example, Perry Kaufman's adaptive moving average (KAMA) and Tushar Chande's variable index dynamic average (VIDYA) adapt to changes in volatility . By definition, these filters are reactive to price changes, and therefore they close the barn door after the horse is gone.The adaptive filters discussed in this chapter are the familiar Stochastic , relative strength index (RSI), commodity channel index (CCI), and band-pass filter.The key parameter in each case is the look-back period used to calculate the indicator. This look-back period is commonly a fixed value. However, since the measured cycle period is changing, it makes sense to adapt these indicators to the measured cycle period. When tradable market cycles are observed, they tend to persist for a short while.Therefore, by tuning the indicators to the measure cycle period they are optimized for current conditions and can even have predictive characteristics.
The dominant cycle period is measured using the Autocorrelation Periodogram Algorithm. That dominant cycle dynamically sets the look-back period for the indicators. I employ my own streamlined computation for the indicators that provide smoother and easier to interpret outputs than traditional methods. Further, the indicator codes have been modified to remove the effects of spectral dilation.This basically creates a whole new set of indicators for your trading arsenal."
What is this Hilbert Transformer?
An analytic signal allows for time-variable parameters and is a generalization of the phasor concept, which is restricted to time-invariant amplitude, phase, and frequency. The analytic representation of a real-valued function or signal facilitates many mathematical manipulations of the signal. For example, computing the phase of a signal or the power in the wave is much simpler using analytic signals.
The Hilbert transformer is the technique to create an analytic signal from a real one. The conventional Hilbert transformer is theoretically an infinite-length FIR filter. Even when the filter length is truncated to a useful but finite length, the induced lag is far too large to make the transformer useful for trading.
From his Ehlers' book Cycle Analytics for Traders Advanced Technical Trading Concepts by John F. Ehlers , 2013, pages 186-187:
"I want to emphasize that the only reason for including this section is for completeness. Unless you are interested in research, I suggest you skip this section entirely. To further emphasize my point, do not use the code for trading. A vastly superior approach to compute the dominant cycle in the price data is the autocorrelation periodogram. The code is included because the reader may be able to capitalize on the algorithms in a way that I do not see. All the algorithms encapsulated in the code operate reasonably well on theoretical waveforms that have no noise component. My conjecture at this time is that the sample-to-sample noise simply swamps the computation of the rate change of phase, and therefore the resulting calculations to find the dominant cycle are basically worthless.The imaginary component of the Hilbert transformer cannot be smoothed as was done in the Hilbert transformer indicator because the smoothing destroys the orthogonality of the imaginary component."
What is the Dual Differentiator, a subset of Hilbert Transformer?
From his Ehlers' book Cycle Analytics for Traders Advanced Technical Trading Concepts by John F. Ehlers , 2013, page 187:
"The first algorithm to compute the dominant cycle is called the dual differentiator. In this case, the phase angle is computed from the analytic signal as the arctangent of the ratio of the imaginary component to the real component. Further, the angular frequency is defined as the rate change of phase. We can use these facts to derive the cycle period."
What is the Phase Accumulation, a subset of Hilbert Transformer?
From his Ehlers' book Cycle Analytics for Traders Advanced Technical Trading Concepts by John F. Ehlers , 2013, page 189:
"The next algorithm to compute the dominant cycle is the phase accumulation method. The phase accumulation method of computing the dominant cycle is perhaps the easiest to comprehend. In this technique, we measure the phase at each sample by taking the arctangent of the ratio of the quadrature component to the in-phase component. A delta phase is generated by taking the difference of the phase between successive samples. At each sample we can then look backwards, adding up the delta phases.When the sum of the delta phases reaches 360 degrees, we must have passed through one full cycle, on average.The process is repeated for each new sample.
The phase accumulation method of cycle measurement always uses one full cycle's worth of historical data.This is both an advantage and a disadvantage.The advantage is the lag in obtaining the answer scales directly with the cycle period.That is, the measurement of a short cycle period has less lag than the measurement of a longer cycle period. However, the number of samples used in making the measurement means the averaging period is variable with cycle period. longer averaging reduces the noise level compared to the signal.Therefore, shorter cycle periods necessarily have a higher out- put signal-to-noise ratio."
What is the Homodyne, a subset of Hilbert Transformer?
From his Ehlers' book Cycle Analytics for Traders Advanced Technical Trading Concepts by John F. Ehlers , 2013, page 192:
"The third algorithm for computing the dominant cycle is the homodyne approach. Homodyne means the signal is multiplied by itself. More precisely, we want to multiply the signal of the current bar with the complex value of the signal one bar ago. The complex conjugate is, by definition, a complex number whose sign of the imaginary component has been reversed."
What is the Instantaneous Cycle?
The Instantaneous Cycle Period Measurement was authored by John Ehlers; it is built upon his Hilbert Transform Indicator.
From his Ehlers' book Cybernetic Analysis for Stocks and Futures: Cutting-Edge DSP Technology to Improve Your Trading by John F. Ehlers, 2004, page 107:
"It is obvious that cycles exist in the market. They can be found on any chart by the most casual observer. What is not so clear is how to identify those cycles in real time and how to take advantage of their existence. When Welles Wilder first introduced the relative strength index (rsi), I was curious as to why he selected 14 bars as the basis of his calculations. I reasoned that if i knew the correct market conditions, then i could make indicators such as the rsi adaptive to those conditions. Cycles were the answer. I knew cycles could be measured. Once i had the cyclic measurement, a host of automatically adaptive indicators could follow.
Measurement of market cycles is not easy. The signal-to-noise ratio is often very low, making measurement difficult even using a good measurement technique. Additionally, the measurements theoretically involve simultaneously solving a triple infinity of parameter values. The parameters required for the general solutions were frequency, amplitude, and phase. Some standard engineering tools, like fast fourier transforms (ffs), are simply not appropriate for measuring market cycles because ffts cannot simultaneously meet the stationarity constraints and produce results with reasonable resolution. Therefore i introduced maximum entropy spectral analysis (mesa) for the measurement of market cycles. This approach, originally developed to interpret seismographic information for oil exploration, produces high-resolution outputs with an exceptionally short amount of information. A short data length improves the probability of having nearly stationary data. Stationary data means that frequency and amplitude are constant over the length of the data. I noticed over the years that the cycles were ephemeral. Their periods would be continuously increasing and decreasing. Their amplitudes also were changing, giving variable signal-to-noise ratio conditions. Although all this is going on with the cyclic components, the enduring characteristic is that generally only one tradable cycle at a time is present for the data set being used. I prefer the term dominant cycle to denote that one component. The assumption that there is only one cycle in the data collapses the difficulty of the measurement process dramatically."
What is the Band-pass Cycle?
From his Ehlers' book Cycle Analytics for Traders Advanced Technical Trading Concepts by John F. Ehlers , 2013, page 47:
"Perhaps the least appreciated and most underutilized filter in technical analysis is the band-pass filter. The band-pass filter simultaneously diminishes the amplitude at low frequencies, qualifying it as a detrender, and diminishes the amplitude at high frequencies, qualifying it as a data smoother. It passes only those frequency components from input to output in which the trader is interested. The filtering produced by a band-pass filter is superior because the rejection in the stop bands is related to its bandwidth. The degree of rejection of undesired frequency components is called selectivity. The band-stop filter is the dual of the band-pass filter. It rejects a band of frequency components as a notch at the output and passes all other frequency components virtually unattenuated. Since the bandwidth of the deep rejection in the notch is relatively narrow and since the spectrum of market cycles is relatively broad due to systemic noise, the band-stop filter has little application in trading."
From his Ehlers' book Cycle Analytics for Traders Advanced Technical Trading Concepts by John F. Ehlers , 2013, page 59:
"The band-pass filter can be used as a relatively simple measurement of the dominant cycle. A cycle is complete when the waveform crosses zero two times from the last zero crossing. Therefore, each successive zero crossing of the indicator marks a half cycle period. We can establish the dominant cycle period as twice the spacing between successive zero crossings."
What is Composite Fractal Behavior (CFB)?
All around you mechanisms adjust themselves to their environment. From simple thermostats that react to air temperature to computer chips in modern cars that respond to changes in engine temperature, r.p.m.'s, torque, and throttle position. It was only a matter of time before fast desktop computers applied the mathematics of self-adjustment to systems that trade the financial markets.
Unlike basic systems with fixed formulas, an adaptive system adjusts its own equations. For example, start with a basic channel breakout system that uses the highest closing price of the last N bars as a threshold for detecting breakouts on the up side. An adaptive and improved version of this system would adjust N according to market conditions, such as momentum, price volatility or acceleration.
Since many systems are based directly or indirectly on cycles, another useful measure of market condition is the periodic length of a price chart's dominant cycle, (DC), that cycle with the greatest influence on price action.
The utility of this new DC measure was noted by author Murray Ruggiero in the January '96 issue of Futures Magazine. In it. Mr. Ruggiero used it to adaptive adjust the value of N in a channel breakout system. He then simulated trading 15 years of D-Mark futures in order to compare its performance to a similar system that had a fixed optimal value of N. The adaptive version produced 20% more profit!
This DC index utilized the popular MESA algorithm (a formulation by John Ehlers adapted from Burg's maximum entropy algorithm, MEM). Unfortunately, the DC approach is problematic when the market has no real dominant cycle momentum, because the mathematics will produce a value whether or not one actually exists! Therefore, we developed a proprietary indicator that does not presuppose the presence of market cycles. It's called CFB (Composite Fractal Behavior) and it works well whether or not the market is cyclic.
CFB examines price action for a particular fractal pattern, categorizes them by size, and then outputs a composite fractal size index. This index is smooth, timely and accurate
Essentially, CFB reveals the length of the market's trending action time frame. Long trending activity produces a large CFB index and short choppy action produces a small index value. Investors have found many applications for CFB which involve scaling other existing technical indicators adaptively, on a bar-to-bar basis.
What is VHF Adaptive Cycle?
Vertical Horizontal Filter (VHF) was created by Adam White to identify trending and ranging markets. VHF measures the level of trend activity, similar to ADX DI. Vertical Horizontal Filter does not, itself, generate trading signals, but determines whether signals are taken from trend or momentum indicators. Using this trend information, one is then able to derive an average cycle length.

Is it Time for a Pullback? Check Bars Since MA TestAn old market adage declares that “prices never move in a straight line.” Dips occur even in bullish markets. But how can traders know when prices may be due for a pullback?
Today’s script tries to answer that question by asking how many bars have passed since a stock, index or other symbol has tested a given moving average. Long periods of time without touching a line such as the 50-day simple moving average, for example, could prompt traders to be more patient.
Bars Since MA Test counts how many bars have passed since prices touched or crossed the MA in question. The resulting value is plotted in a simple histogram. Users can set the MA length and type. By default, it uses the 50-day simple moving average (SMA).
The chart above applies Bars Since MA Test to the S&P 500. It shows that the index has gone 129 bars without testing its 50-day SMA. That’s the longest since a 146-bar stretch between July 2006 and February 2007.
Other longer runs include January-August 1995 (156 bars), November 1960-June 1961 (144 bars) and April-November 1958 (158 bars).
Given the small number of comparable readings, could traders suspect the current advance is getting long in the tooth?
TradeStation has, for decades, advanced the trading industry, providing access to stocks, options and futures. If you're born to trade, we could be for you. See our Overview for more.
Past performance, whether actual or indicated by historical tests of strategies, is no guarantee of future performance or success. There is a possibility that you may sustain a loss equal to or greater than your entire investment regardless of which asset class you trade (equities, options or futures); therefore, you should not invest or risk money that you cannot afford to lose. Online trading is not suitable for all investors. View the document titled Characteristics and Risks of Standardized Options at www.TradeStation.com . Before trading any asset class, customers must read the relevant risk disclosure statements on www.TradeStation.com . System access and trade placement and execution may be delayed or fail due to market volatility and volume, quote delays, system and software errors, Internet traffic, outages and other factors.
Securities and futures trading is offered to self-directed customers by TradeStation Securities, Inc., a broker-dealer registered with the Securities and Exchange Commission and a futures commission merchant licensed with the Commodity Futures Trading Commission). TradeStation Securities is a member of the Financial Industry Regulatory Authority, the National Futures Association, and a number of exchanges.
TradeStation Securities, Inc. and TradeStation Technologies, Inc. are each wholly owned subsidiaries of TradeStation Group, Inc., both operating, and providing products and services, under the TradeStation brand and trademark. When applying for, or purchasing, accounts, subscriptions, products and services, it is important that you know which company you will be dealing with. Visit www.TradeStation.com for further important information explaining what this means.
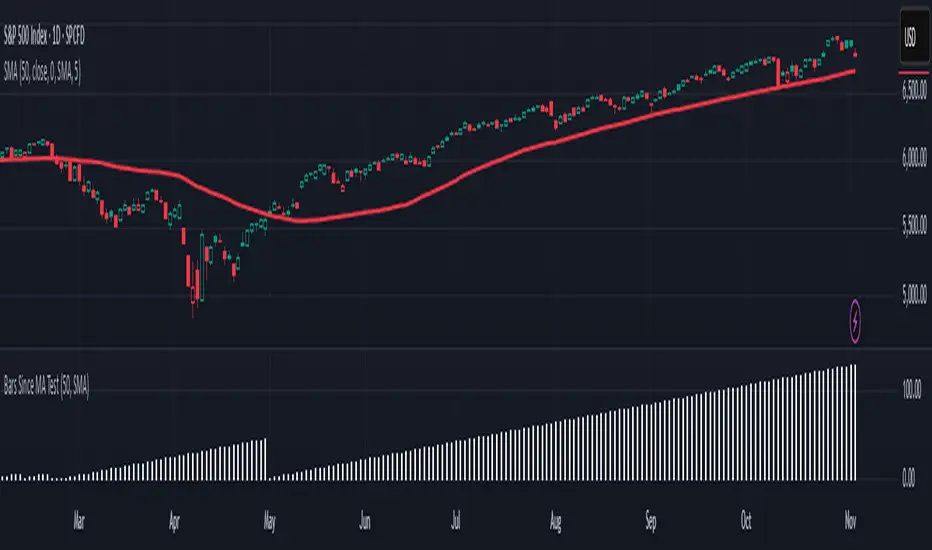
Breakdown or Buyable Dip? Pullback Depth Can HelpAs a common adage says, “the market doesn’t move in a straight line.” But when prices have fallen, it’s not always clear whether buying makes sense. That’s where today’s script may help.
Most traditional indicators judge movement based on price. That’s obviously important, but time can also be helpful. After all, there’s a big difference between probing a low from 2-3 weeks ago versus a low from months or even years in the past.
Pullback Depth clearly illustrates this by answering the question: “Today’s low is the lowest in how many bars?”
The resulting integer is plotted in a simple histogram. Values are always negative because bars with higher absolute values (meaning more negative, or further below zero) are potentially more bearish.
The study also has a maximum lookback period to avoid overwhelming the study with too many bars. Its default setting of 125 bars includes enough history to illustrate the trend.
The stock market’s recent run has seen only shallow pullbacks. Most dips have probed 1-2 weeks in the past, while Friday’s selloff only turned back the clock a month.
Consider two other previous moments.
First, the great bull run of 1995 saw only shallow pullbacks. (None exceeded 50 days.):
In contrast, early 2022 saw the S&P 500 test levels more than 100 candles into the past. It soon fell into an official “bear market:”
TradeStation has, for decades, advanced the trading industry, providing access to stocks, options and futures. If you're born to trade, we could be for you. See our Overview for more.
Past performance, whether actual or indicated by historical tests of strategies, is no guarantee of future performance or success. There is a possibility that you may sustain a loss equal to or greater than your entire investment regardless of which asset class you trade (equities, options or futures); therefore, you should not invest or risk money that you cannot afford to lose. Online trading is not suitable for all investors. View the document titled Characteristics and Risks of Standardized Options at www.TradeStation.com . Before trading any asset class, customers must read the relevant risk disclosure statements on www.TradeStation.com . System access and trade placement and execution may be delayed or fail due to market volatility and volume, quote delays, system and software errors, Internet traffic, outages and other factors.
Securities and futures trading is offered to self-directed customers by TradeStation Securities, Inc., a broker-dealer registered with the Securities and Exchange Commission and a futures commission merchant licensed with the Commodity Futures Trading Commission). TradeStation Securities is a member of the Financial Industry Regulatory Authority, the National Futures Association, and a number of exchanges.
TradeStation Securities, Inc. and TradeStation Technologies, Inc. are each wholly owned subsidiaries of TradeStation Group, Inc., both operating, and providing products and services, under the TradeStation brand and trademark. When applying for, or purchasing, accounts, subscriptions, products and services, it is important that you know which company you will be dealing with. Visit www.TradeStation.com for further important information explaining what this means.

Binomial Option Pricing ModelA binomial option pricing model is an option pricing model that calculates an option's price using binomial trees. The BOPM method of calculating option prices is different from the Black-Scholes Model because it provides more flexibility in the type of options you want to price. The BOPM, unlike the BS model typically used for European style options, allows you to price options which have the ability to exercise early, such as American or Bermudan options. Although you can use the BOPM for any option style.
This specific model allows you to price both American and European vanilla options.
The way the BOPM calculates option prices is by:
First, dividing up the time until expiry into equal parts called steps. This specific model presented only uses 2 steps. For example, say you have an option with an expiry of 60 days, and your binomial tree has only two steps. Then each step will contain 30 days.
Second, the model will project the expected price of the underlying at the end of each step, called a node. The expected price is calculated by using the underlying's volatility and projecting what the price of the underlying would be if it were to rise and fall. This step is repeated until the terminal node, aka the end of the tree, is reached.
Third, once the terminal node's expected underlying prices are calculated, their expected option prices must be calculated.
Finally, after calculating the terminal option prices, backwards induction must be used to calculate the option prices at the previous nodes, until you reach Node 0, aka the current option price.
In order to use this model:
1st. Enter your option's strike price.
2nd. Enter the risk-free-rate of the currency the option is based in.
3rd. Enter the dividend yield of the underlying if it's a stock, or the foreign risk-free-rate if it's an FX option.
*For example, if you were trading an AAPL stock option, in the risk-free-rate box mentioned in step 2, you would enter the US risk-free-rate because AAPL options are traded in US dollars. In the dividend yield box mentioned in step 3, you would enter the stock's dividend yield, which for AAPL is 0.82.
*If you were, for example, trading an option on the EUR/JPY currency pair, the risk-free-rate mentioned in step 2, would be the Japanese risk-free-rate. Then in the the dividend yield box from step 3, you'd input the Eurozone risk-free-rate.
*If you were trading an options on futures contract, the risk-free-rate mentioned in step 2, would be the risk-free-rate for whatever currency the futures contract is denominated in. For example EUR futures are denominated in USD, so you would input the US risk-free-rate. Meanwhile, something like FTSE futures are denominated in GBP, so you would input the British risk-free-rate. As for the dividend yield box mentioned in step 3, for all options on futures, enter 0.
4th. Pick what type of underlying the option is based on: stock, FX, or futures.
5th. Pick the style of option: American or European.
6th. Pick the type of option: Long Call or Long Put.
7th. Input your time until expiry. You can express this in terms of days, hours, and minutes.
8th. Lastly, input your chart time-frame in term of minutes. For example, if you're using the 1 min time-frame enter 1, 4hr time-frame enter 480, daily time-frame enter 1440.
*Disclaimer, because this particular model only uses 2 steps, it won't work on stocks with high prices (over $100). If you want to use this on stocks with prices greater than $100, you would need to add more steps to the code, shown below. The model in its current form should work for stocks below $100.
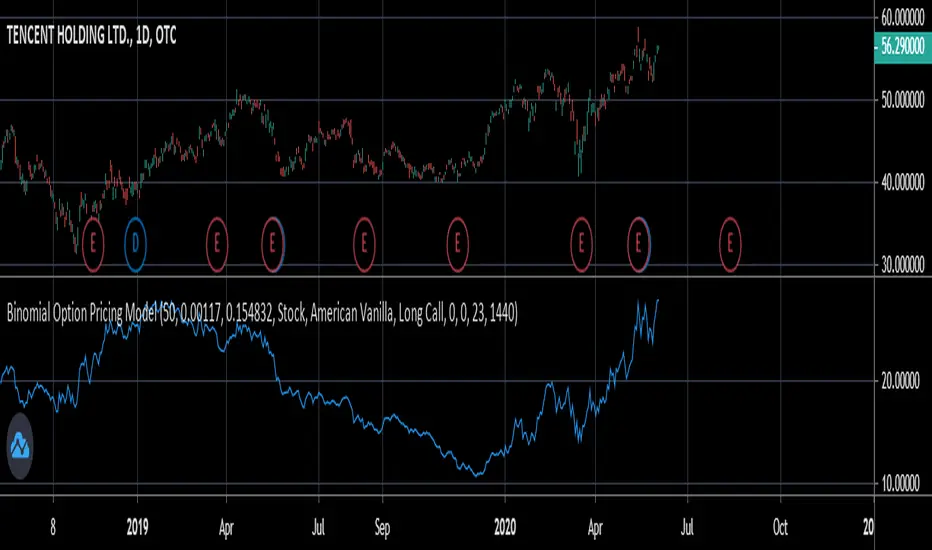
cephxs / New X Opening Gaps [Pro +]NWOG & NDOG - OPENING GAPS
Smart Gap Detection with Intelligent Filtering
Visualizes New Week Opening Gaps (NWOGs) and New Day Opening Gaps (NDOGs) with built-in intelligence to show you only what matters. No more cluttered charts with gaps from 3 months ago that price will never revisit.
THE PROBLEM WITH GAP INDICATORS
Most gap indicators dump every single gap on your chart and call it a day. You end up with 50 boxes cluttering your screen, half of which are miles away from current price and the other half are so tiny they're basically noise.
This one's different and I explain why below.
SMART FILTERING (THE GOOD STUFF)
Two filters work together to keep your chart clean:
Size Filter: Uses ATR-based detection to filter out insignificant gaps, dynamic with less volatile time periods
- Filter None: Show everything (if you really want chaos)
- Filter Insignificant: Hide the micro-gaps that don't matter
- Juicy Gaps Only: Only show gaps worth paying attention to
Distance Filter: Only displays gaps within range of current price
- Really Close: 0.5 ATR - tight focus on immediate levels
- Balanced: 1 ATR - sweet spot for most traders
- Slightly Far: 3 ATR - wider view for swing traders
Cleanup Interval: Controls how quickly out-of-range gaps disappear
- Immediately: Gaps hide/show every bar as price moves
- 5 / 15 / 30 Minutes: Gaps only update visibility at interval boundaries - reduces visual noise during choppy price action
The magic: gaps appear and disappear as price moves toward or away from them. Old gaps that price has left behind fade out, and gaps that become relevant fade back in. Use delayed cleanup intervals if you want gaps to "stick around" a bit longer before disappearing.
GAP TYPES EXPLAINED
New Week Opening Gaps (NWOGs):
The gap between Friday's close and Monday's open. These form over the weekend when markets are closed and often act as significant support/resistance.
Two classifications:
Void Gaps: Gap direction aligns with Friday's candle direction (continuation)
Overlap Gaps: Gap direction conflicts with Friday's candle (potential reversal)
New Day Opening Gaps (NDOGs):
The gap between one day's close and the next day's open. Smaller but frequent - useful for intraday traders looking for fill targets.
FEATURES
Automatic Week/Day Detection: Handles forex (17:00 ET open) and futures (18:00 ET open) correctly
DST-Aware: Uses New York timezone with automatic daylight saving adjustments
50% Equilibrium Line: Marks the midpoint of each gap - key level for entries
Days Ago Labels: Shows how old each gap is at a glance
Extension Modes: Choose between live-extending boxes or fixed-width boxes
Separate Color Schemes: Different colors for void vs overlap NWOGs, bullish vs bearish NDOGs
INPUTS
NWOG Display
Show NWOGs: Master toggle
Extension Mode: "Extend Live" or "Extend to Week Close"
Maximum NWOGs: Limit displayed gaps (1-50)
Show Void/Overlap Gaps: Toggle each type independently
Show NWOG Labels: Toggle gap labels
NDOG Display
Show NDOGs: Master toggle
Extension Mode: "Extend Live" or "Extend to Day Close"
Maximum NDOGs: Limit displayed gaps (1-50)
Show NDOG Labels: Toggle gap labels
Filter Settings
Size Filter: Filter None / Filter Insignificant / Juicy Gaps Only
Only Show Near Price: Enable/disable distance filtering
Distance Filter: Really Close / Balanced / Slightly Far
Cleanup Interval: Immediately / 5 Minutes / 15 Minutes / 30 Minutes - controls how often gaps update visibility
ATR Period: Period for ATR calculation (default: 14)
Right Edge Offset: How many bars ahead boxes extend
Styling
Box Transparency: Fill and border opacity
Midline Style: Solid / Dotted / Dashed
Label Style: Simple ("NWOG, 5d ago") or Descriptive ("NWOG (Void Bull), 5d ago")
Label Size: Tiny / Small / Normal / Large
RECOMMENDED SETTINGS
For intraday (1m-15m):
Size Filter: Filter Insignificant
Distance Filter: Really Close or Balanced
Show NDOGs: On
Maximum NDOGs: 5-10
For swing trading (1H-4H):
Size Filter: Juicy Gaps Only
Distance Filter: Balanced or Slightly Far
Show NWOGs: On
Maximum NWOGs: 10-20
TIMEFRAME NOTES
Works on daily timeframe and below. Above daily, the indicator disables itself since NWOG/NDOG gap detection requires daily open/close data.
ASSET SUPPORT
Automatically handles different market open times:
Forex: Week opens Sunday 17:00 ET, closes Friday 17:00 ET
Futures: Week opens Sunday 18:00 ET, closes Friday 16:15 ET
Stocks/Other: Uses session-based detection
FAQ
Why do gaps appear and disappear?
That's the distance filter working. As price moves, gaps that were far away become relevant and appear. Gaps that price leaves behind disappear. This keeps your chart focused on actionable levels.
What's the difference between void and overlap gaps?
Void gaps continue Friday's direction (trend continuation). Overlap gaps conflict with Friday's direction (potential reversal setup). Different traders prefer different types.
Why can't I see any gaps?
Check your filter settings. "Juicy Gaps Only" with "Really Close" distance filter is very selective. Try "Filter Insignificant" with "Balanced" for more gaps.
DISCLAIMER
This indicator is for educational purposes only. Opening gaps are one tool among many - they don't guarantee fills or reversals. Always use proper risk management and never trade based on a single indicator. Past gap fills don't guarantee future performance. Do your own analysis.
CHANGELOG
Pro +: Added smart size/distance filtering, void/overlap classification, NDOG support, DST-aware timezone handling
Base: Initial NWOG visualization
Made with ❤️ by fstarlabs

HA Trend Reclaim Daily Structure Pullback🔹 HA Trend Reclaim — Daily Structure Pullback System
HA Trend Reclaim is a professional-grade trend continuation indicator designed to highlight high-probability LONG and SHORT setups using a combination of:
Heikin Ashi candle structure
EMA trend alignment (9 & 50 EMA)
Daily High / Low market structure
Pullback → momentum reclaim logic
This indicator is built for traders who want clarity, discipline, and structure, not noise or over-signaling.
It focuses on trading with the dominant trend, entering only after price pulls back and confirms strength via momentum reclaim.
🔑 What Makes This Different
✔ No counter-trend signals
✔ No breakout chasing
✔ Built-in structure awareness
✔ Clear visual entries & risk levels
✔ Works across stocks, crypto, and futures
This script is ideal for traders who prefer fewer, higher-quality trades rather than constant signals.
2️⃣ HOW TO USE (FEATURED-FRIENDLY VERSION)
🟢 LONG Conditions
A LONG signal appears when:
EMA 9 is above EMA 50
Price is above EMA 50
Price pulls back into the EMA zone
Price reclaims EMA 9 upward
Heikin Ashi candle closes bullish (not a doji)
🔴 SHORT Conditions
A SHORT signal appears when:
EMA 9 is below EMA 50
Price is below EMA 50
Price pulls back into the EMA zone
Price reclaims EMA 9 downward
Heikin Ashi candle closes bearish (not a doji)
📦 Daily Structure Boxes
The indicator highlights the daily high–low range:
Green box → bullish daily bias
Red box → bearish daily bias
These boxes help traders avoid:
Mid-range chop
Late entries
Trading against daily momentum
3️⃣ BEST SETTINGS (VERY IMPORTANT FOR USERS)
Recommended Timeframes
Stocks: 5m, 15m, 1H
Crypto: 15m, 1H, 4H
Futures: 5m, 15m
Recommended Inputs
Setting Value
EMA Fast 9
EMA Slow 50
Swing Lookback 15
Runner RR 2.0
Heikin Ashi Enabled
Show Daily Boxes Enabled
Notes
Higher timeframes = fewer, stronger signals
Avoid low-liquidity instruments
Best used during active sessions (London / NY)
