Binance Futures/Spot PriceShows the last price of either the spot or futures market on Binance, for the current coin.
It shows futures if you are in a spot market, and spot if you are in futures.
Currently this only works for USD stable coin pairs (BUSD, USDT, USDC, ...).
I don't plan to add COIN future pairs, it's not useful to me.
Additionally, it allows you to show the lowest and highest traded price (in the opposite market you are currently on: spot/futures) for a given period, and the respective chart, if you are into that sort of thing.
Bye :D
Cari dalam skrip untuk "Futures"

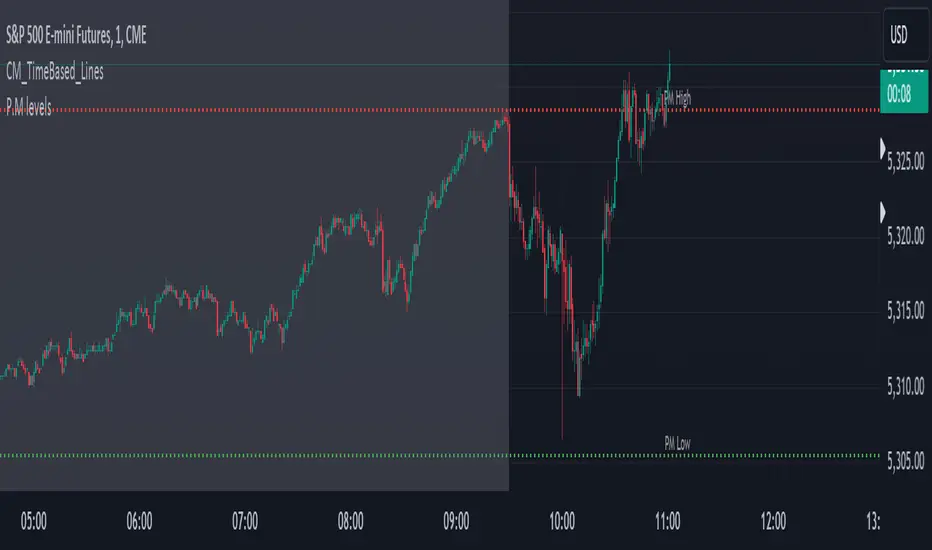
Pre-Market levels for Futures This indicator draws the Pre-Market Low and High for futures. Futures do not really have "P.M" because they are almost always open, but I chart /ES and trade $SPY options, so this has been useful in finding P.M levels.
ICT Index Futures Session LinesICT Index Futures Session Lines
Description:
The script is based on one of ICT's concepts on trading Index Futures. The script lays out the daily range from an intraday basis.
Range:
00:00 - New York Midnight
08:30 – New York Open (News events come out)
12:00/13:00 - New York Lunch (No trade time period)
13:30 - (Algorithm)
16:30 - Close
* The open, high and low lines are plotted from 00:00 to 08:30
How To Use:
You will need to check the daily bias. Prior to 8:30 you are to look for previous swing points where liquidity may exist. During the open you want to see if a high or low is taken out, and then wait for an energetic break/displacement for a potential FVG/imbalance retracement entry.
Strategy is for LTF (1 to 15m)
Default time zone is set to America/New_York (UTC New York), so lines will be plotted correctly regardless of user’s local UTC chart setting.

Crypto Spot/Futures Dominance Indicator with AlertsFutures/Spot Dominance Indicator:
Overview:
The futures/spot dominance indicator is a versatile tool used by traders and analysts to assess the relative strength or dominance of the futures market in relation to the spot (or cash) market for a specific asset. It offers insights into market sentiment, potential arbitrage opportunities, and risk management while incorporating the VWAP indicator for added context.
How It Works:
This indicator automatically detects and adapts to the futures symbol applied to the chart, simplifying the setup for traders. However, it still necessitates manual input of the corresponding spot pair to ensure accuracy.
Automatic Futures Symbol Detection: The indicator starts by automatically detecting the futures symbol on the trading chart, eliminating the need for manual configuration. This ensures that the indicator is applied to the correct futures contract.
Manual Spot Pair Entry: To provide a reliable reference point for the comparison, traders must manually input the corresponding spot symbol via the indicator's inputs. For instance, if the indicator detects the BTCUSDT.P futures symbol, traders would manually enter the BTCUSDT spot symbol.
Gathering Data: The indicator collects historical price data for both the detected futures contract and the manually specified spot symbol. This data includes open, high, low, and close prices, as well as trading volume.
VWAP Calculation: To gain a deeper understanding of price trends and market dynamics, the indicator calculates the VWAP (Volume Weighted Average Price) for both the futures and spot markets. The VWAP places more weight on prices with higher trading volume, offering a weighted average that reflects market consensus.
Premium/Discount Calculation: By subtracting the VWAP of the spot market from the VWAP of the futures market, the indicator quantifies the premium or discount of the futures price concerning the spot price. A positive value indicates a premium, while a negative value suggests a discount.
Plotting: The premium/discount value is displayed as a line on the chart, often alongside moving averages or other smoothing techniques for improved trend analysis.
Alerts: In addition to its analysis capabilities, this indicator now includes alerts to enhance your trading experience. It alerts you in the following scenarios:
Premium Above Average: Notifies you when the premium crosses above the average line.
Premium Below Average: Alerts you when the premium crosses below the average line.
Premium Above Zero: Provides an alert when the premium crosses above the zero line.
Premium Below Zero: Generates an alert when the premium crosses below the zero line.
Benefits of the Futures/Spot Dominance Indicator:
Sentiment Analysis: Traders use the indicator to assess market sentiment. A futures premium might signify bullish sentiment, while a discount could indicate bearish sentiment.
Arbitrage Opportunities: Identifying price discrepancies between futures and spot markets can help traders spot arbitrage opportunities, where they can profit from price differentials.
Risk Management: The indicator assists in evaluating risks associated with futures positions, helping traders manage their exposure effectively.
Trend Confirmation: When used in conjunction with other technical indicators, futures/spot dominance, along with VWAP, can provide additional confirmation of price trends.
Hedging: Investors and corporations use this tool to gauge the effectiveness of hedging strategies based on futures contracts.
Speculative Trading: Traders and investors use the indicator to inform speculative positions, aligning their trades with perceived market strength or weakness.
Insightful Analysis: Futures/spot dominance analysis, enriched by VWAP data, offers insights into market behavior during specific events or changes in economic conditions.
In summary, the futures/spot dominance indicator, with its integration of VWAP and automatic futures symbol detection, provides traders and investors with a comprehensive tool to assess market dynamics. It aids in sentiment analysis, risk management, and trend confirmation while offering potential arbitrage opportunities. The newly added alerts enhance the indicator's functionality, providing timely notifications of key market events. However, it relies on manual input of the corresponding spot pair to ensure precise comparisons between futures and spot markets. It should be used alongside other analysis techniques for a well-rounded view of the market.

Spot-Futures SpreadSpot-Futures Spread Indicator
A comprehensive indicator that automatically calculates and visualizes the percentage spread between spot and perpetual futures prices across multiple exchanges.
Key Features:
Automatic Exchange Detection - Automatically detects your current exchange and finds the corresponding spot/futures pair
Smart Fallback System - If the counterpart isn't available on your exchange, it automatically searches across 7+ major exchanges (Binance, Bybit, OKX, Gate.io, MEXC, KuCoin, HTX) and uses the first valid match
Multi-Exchange Support - Works with 14 exchanges including Binance, Bybit, OKX, MEXC, BitGet, Gate.io, KuCoin, and more
Clear Exchange Attribution - Shows exactly which exchanges are providing spot and futures data in the statistics table
Configurable Moving Average - Track the average spread with customizable period
Standard Deviation Bands - Identify unusual spread conditions with Bollinger-style bands
Built-in Alerts - Get notified when spread crosses bands or zero (parity)
Statistics Table - Real-time stats showing current spread, MA, std dev, and bands
Manual Override Options - Advanced users can manually specify exchanges and symbols
How It Works:
The indicator calculates the spread as: (Futures Price - Spot Price) / Spot Price × 100
Positive spread = Futures trading at a premium (contango)
Negative spread = Futures trading at a discount (backwardation)
Zero = Parity between spot and futures
Use Cases:
Funding Rate Analysis - Correlates with perpetual funding rates
Arbitrage Opportunities - Identify significant spot-futures divergences
Market Sentiment - Premium/discount indicates bullish/bearish positioning
Cross-Exchange Analysis - Compare spreads when spot and futures are on different exchanges
Smart Features:
Works whether you're viewing a spot or futures chart
Automatically handles exchange-specific perpetual contract naming (.P, PERP, SWAP, etc.)
Color-coded visualization (green for premium, red for discount)
Customizable colors and display options
Background shading based on spread direction
Perfect For:
Crypto traders monitoring funding rates, arbitrage traders, market makers, and anyone interested in spot-futures dynamics across multiple exchanges.
Getting Started:
Simply add the indicator to any spot or perpetual futures chart. It will automatically detect the exchange and find the corresponding pair. The statistics table shows which exchanges are being used for maximum transparency.
Note: The indicator automatically ignores invalid symbols, so you'll never see errors even if a specific pair doesn't exist on a particular exchange.
Kudos to @AlekMel that made the "Spot - Fut Spread v2" indicator that I enhance the Automatic detection feature which was not working in some case.

Qullamagi EMA Breakout Autotrade (Crypto Futures L+S)Title: Qullamagi EMA Breakout – Crypto Autotrade
Overview
A crypto-focused, Qullamagi-style EMA breakout strategy built for autotrading on futures and perpetual swaps.
It combines a 5-MA trend stack (EMA 10/20, SMA 50/100/200), volatility contraction boxes, volume spikes and an optional higher-timeframe 200-MA filter. The script supports both long and short trades, partial take profit, trailing MA exits and percent-of-equity position sizing for automated crypto futures trading.
Key Features (Crypto)
Qullamagi MA Breakout Engine – trades only when price is aligned with a strong EMA/SMA trend and breaks out of a tight consolidation range. Longs use: Close > EMA10 > EMA20 > SMA50 > SMA100 > SMA200. Shorts are the mirror condition with all MAs sloping in the trend direction.
Strict vs Loose Modes – Strict (Daily) is designed for cleaner swing trades on 1H–4H (full MA stack, box+ATR and volume filters, optional HTF filter). Loose (Intraday) focuses on 10/20/50 alignment with relaxed filters for more frequent 15m–30m signals.
Volatility & Volume Filters for Crypto – ATR-based box height limit to detect volatility contraction, wide-candle filter to avoid chasing exhausted breakouts, and a volume spike condition requiring current volume to exceed an SMA of volume.
Higher-Timeframe Trend Filter (Optional) – uses a 200-period SMA on a higher timeframe (default: 1D). Longs only when HTF close is above the HTF 200-SMA, shorts only when it is below, helping avoid trading against dominant crypto trends.
Autotrade-Oriented Trade Management – position size as % of equity, initial stop anchored to a chosen MA (EMA10 / EMA20 / SMA50) with optional buffer, partial take profit at a configurable R-multiple, trailing MA exit for the remainder, and an optional cooldown after a full exit.
Markets & Timeframes
Best suited for BTC, ETH and major altcoin futures/perpetuals (Binance, Bybit, OKX, etc.).
Strict preset: 1H–4H charts for classic Qullamagi-style trend structure and fewer fake breakouts.
Loose preset: 15m–30m charts for higher trade frequency and more active intraday trading.
Always retune ATR length, box length, volume multiplier and position size for each symbol and exchange.
Strategy Logic (Quick Summary)
Long (Strict): MA stack in bullish alignment with all MAs sloping up → tight volatility box (ATR-based) → volume spike above SMA(volume) × multiplier → breakout above box high (close or intrabar) → optional HTF close above 200-SMA.
Short: Mirror logic: bearish MA stack, tight box, volume spike and breakdown below box low with optional HTF downtrend.
Best Practices for Crypto
Backtest on each symbol and timeframe you plan to autotrade, including commissions and slippage.
Start on higher timeframes (1H/4H) to learn the behavior, then move to 15m–30m if you want more signals.
Use the higher-timeframe filter when markets are strongly trending to reduce counter-trend trades.
Keep position-size percentage conservative until you fully understand the drawdowns.
Forward-test / paper trade before connecting to live futures accounts.
Webhook / Autotrade Integration
Designed to work with TradingView webhooks and external crypto trading bots.
Alert messages include structured fields such as: EVENT=ENTRY / SCALE_OUT / EXIT, SIDE=LONG / SHORT, STRATEGY=Qullamagi_MA.
Map each EVENT + SIDE combination to your bot logic (open long/short, partial close, full close, etc.) on your preferred exchange.
Important Notes & Disclaimer
Crypto markets are highly volatile and can change regime quickly. Backtest and forward-test thoroughly before using real capital. Higher timeframes generally produce cleaner MA structures and fewer fake breakouts.
This strategy is for educational and informational purposes only and does not constitute financial advice. Trading leveraged crypto products involves substantial risk of loss. Always do your own research, manage risk carefully, and never trade with money you cannot afford to lose.

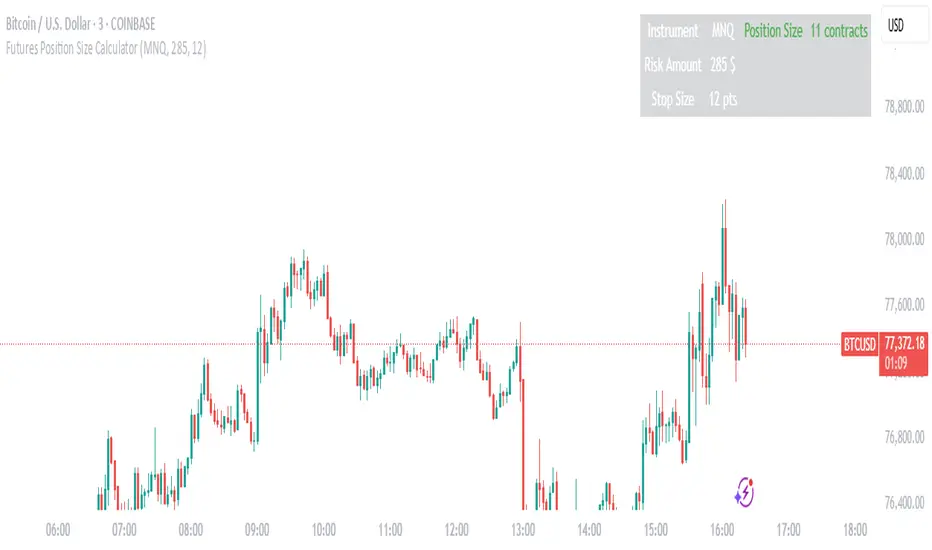
Futures Position Size CalculatorFutures Position Size Calculator by vmkhats
Streamline your futures trading risk management with this intuitive Pine Script utility designed for TradingView. Created by vmkhats, this tool automates position sizing calculations for popular futures contracts, ensuring precise risk control while eliminating manual errors.
Key Features:
Supports 15+ Instruments: Trade confidently with preconfigured settings for indices (ES, NQ, RTY), commodities (CL, GC), currencies (6E), and micro contracts (MES, MNQ, MCL).
Customizable Inputs: Set your risk amount (e.g., $1,000) and stop-loss size in points, tailored to your strategy.
Automatic Calculations: The script computes stop-loss size in ticks, risk per contract, and optimal position size using floor rounding to prevent over-leveraging.
Clear Visual Output: A table displays results (instrument, risk, stop size, contracts) with color-coded alerts for invalid configurations (e.g., zero position size).
Ideal for both novice and seasoned traders, this utility enforces disciplined risk management while saving time. Enhance your TradingView workspace with this essential tool and trade futures with confidence.
Created by vmkhats — ensuring traders stay precise, proactive, and risk-aware.
BTC Futures BasisShows various basis percentages in a table and plots historical basis. Also has an alert function for backwardation events. Useful for tracking bullish/bearish sentiment in BTC futures markets.
*Currently displays March and June futures for the following exchanges: Bitmex, Binance, Deribit, Okex, and FTX
Also displays CME Continuous Next Contract. All of the symbols are customizable.
-----------
Market-wide backwardation usually occurs during a heavy sell-off (such as a liquidation cascade).
**For getting alerts of backwardation events, I recommend creating an alert on the 1 minute chart with the condition "Any alert() function call". Alert level is customizable as well.
-----------
*NOTE!! : Futures contracts expire (obviously), so the contract symbols will need to be updated periodically. I will try to keep them updated going into the future.
**NOTE2!! : The alert() function does not track the CME contract. This is to avoid false triggers.

FTX Futures Premium %Charts the Futures Premium % for FTX futures markets
Change the asset name from BTC to ETH in settings to switch assets, and will work with all assets with long-dated futures markets on FTX as they are added

Apex-Wallet - Risk & Reward Calc (Futures/Prop-Firm)Overview The Apex Risk & Reward Calc is a specialized utility tool designed for Futures traders, particularly those working with Prop Firms (Apex, MyFundedFutures, etc.). It eliminates the need for manual calculations by providing an instant, clear visualization of your Risk/Reward parameters directly on the chart.
How it works Trading Futures (ES, NQ, MES, MNQ) requires knowing exactly how many ticks correspond to your financial target. This script automatically detects the active instrument and calculates the precise number of ticks needed for both your Take Profit (TP) and Stop Loss (SL) based on your desired cash outcome and chosen ratio.
Key Features:
Automatic Ticker Recognition: Supports ES, NQ, MES, and MNQ with built-in tick values.
Cash-Based Planning: Enter your desired profit in dollars (e.g., $50), and the script tells you the required tick move.
Dynamic Ratio Selection: Choose from 9 different R:R ratios (from 1/5 to 5/1) to instantly see the impact on your Stop Loss.
Compact Professional UI: A clean, 3-column dashboard at the bottom-right of your screen showing active lots, ticks, and gross cash values.
Trading Application Perfect for intraday scalpers who need to set their ATM strategies in platforms like Tradovate or NinjaTrader. It ensures your execution remains consistent with your risk management plan.

Futures Psychological Levels PROFutures Psychological Levels PRO – Professional Usage Guide
Indicator Overview
This elite psychological levels tool dynamically plots the most institutionally relevant round-number clusters across futures markets (ES, NQ, YM, CL, GC, SI, BTC, and custom instruments). It separates levels into three hierarchical tiers — Major, Tradable, and Sniper — while intelligently filtering distant levels using an ATR-based proximity engine. The result is a clean, adaptive overlay that scales perfectly from scalping precision on 1-minute charts to big-picture context on daily/weekly timeframes.
Core Philosophy
Psychological levels are where order flow clusters: stops, limits, and institutional positioning accumulate around round numbers. This indicator turns static round numbers into a dynamic decision framework by:
Prioritizing confluence zones
Reducing clutter in ranging or low-volatility environments
Highlighting only price-relevant levels in real time
Key Features
Instrument Presets – One-click optimized spacing for major futures contracts
Three-Tier Hierarchy – Major (institutional anchors), Tradable (active defense zones), Sniper (precise entry/exit triggers)
ATR Proximity Filter – Automatically hides irrelevant distant levels
Zones or Lines – Visual magnet areas or clean horizontal lines
Price Labels & Summary Table – Instant reference for next major levels above/below
Full Customization – Colors, thickness, styles, and manual overrides
How to Best Use This Indicator (Professional Workflow)
Select the Correct Instrument Preset
Start with the built-in preset matching your chart (e.g., "ES (S&P 500)" for /ES or MES). This instantly applies battle-tested increments. Use "Custom" only for non-standard assets (forex pairs, micros with different tick values, or crypto alts).
Match Settings to Your Trading Style & Timeframe
Reading the Levels – Decision Framework
Major Levels (thick red by default): Highest probability reaction zones. Expect strong reversals, breakouts with volume, or liquidity sweeps. Treat as primary support/resistance.
Tradable Levels (orange): Active trader defense zones. Excellent for limit order placement, partial profit taking, or fading weak moves.
Sniper Levels (thin gray): Precision entries/exits, stop runs, and scalping targets. Confluence with order blocks or volume profile nodes dramatically increases edge.
Trade Setup Examples
Rejection Play: Price approaches a Major level from below → long wick rejection + close back inside → enter in direction of rejection with stop beyond wick extremity.
Break & Retest: Clean breakout through Tradable/Major → retest as new support/resistance → enter on confirmation candle.
Liquidity Sweep: Price briefly breaches Sniper/Major (stop hunt) → rapid reclaim → aggressive counter-trend entry.
Confluence Boost: When a level aligns with daily/weekly open, VWAP, or prior high/low volume node → dramatically increase position size or conviction.
Risk Management Integration
Always place stops just beyond the next logical level (typically a Sniper or Tradable beyond your entry zone). Use the summary table to quickly identify invalidation points. Target the next level in the direction of your bias for minimum 1:2 risk-reward (often 1:3–1:5 achievable at Major levels).
Pro Optimization Tips
High-volatility sessions (NY open, FOMC, NFP): Increase ATR Multiplier slightly to avoid excessive clutter.
Low-volatility Asian/range sessions: Decrease ATR Multiplier for tighter precision.
Combine with Volume Profile (Fixed Range or Session) to confirm high-volume nodes at psych levels.
Pair with anchored/session VWAP for additional confluence layers.
On higher timeframes, disable Sniper levels and zones entirely for minimalist structural analysis.
Important Disclaimer
This indicator is a professional decision-support tool, not a standalone trading system. All trading involves substantial risk of loss. Past performance is not indicative of future results. Always conduct your own analysis, manage risk appropriately, and consider your financial situation before placing trades.
Mastering psychological levels is one of the highest-edge concepts in institutional trading. Used correctly, this indicator gives you the same reference framework that prop desks and market makers watch every day. Trade smart, stay disciplined, and let price action at these levels guide your executions.

Predicta Futures – Scalping Predictor with Confidence FilterPredicta Futures is an advanced short-term forecasting indicator that combines historical pattern similarity analysis with weighted technical signals to predict price movements 1–10 minutes ahead.
**Core Functionality**
The script scans up to 5,000 historical bars to identify structurally similar price patterns. It aggregates forward outcomes from matched patterns and integrates real-time signals from RSI, MACD, Bollinger Bands, volume momentum, and volatility. A composite confidence score filters signals, displaying only those meeting the user-defined threshold (default ≥68%).
**Key Outputs**
- Buy/sell triangles with text labels
- Dashed projection line to predicted price
- Dotted target and ATR-based stop lines
- Info panel showing forecast direction, confidence %, expected move %, pattern count, order book status, and data access details
**Customization & Performance**
- Execution modes: Fast, Balanced, Accurate
- Adaptive sampling with recency bias option
- Filters for volatility and market hours
- Adjustable weights, lookback period, and prediction horizon
**Use Cases**
Scalping, intraday trading, futures, cryptocurrencies, equities.
*Order book metrics are simulated (platform limitation). Technical analysis tool; not financial advice.*

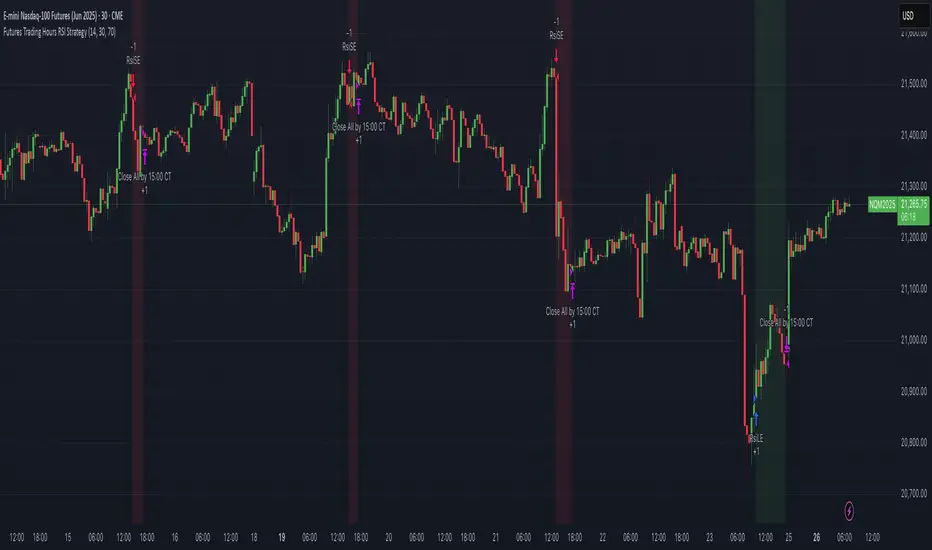
Futures Trading Hours RSI StrategyFutures Trading Hours RSI Strategy
A lightweight, session-filtered RSI strategy designed for equity-index futures (e.g. NQ, ES, YM) on a 30-minute chart. It dynamically enters long when RSI crosses above your oversold threshold and short when RSI crosses below your overbought threshold—but only during regular U.S. trading hours (08:30–15:00 CT, Monday–Friday). All positions are set to close at 15:00 CT to avoid overnight risk, and optional background shading highlights your open longs (green) and shorts (red).
⸻
Key Features
• RSI-based entries: configurable length, oversold, and overbought levels
• Session filter: trades only between 08:30–15:00 CT, Monday through Friday
• Automatic exit: closes all positions at or after 15:00 CT each day
• Visual cues: optional background shading for open long/short positions
• Easy customization: adjust length, overSold, overBought, and time offsets
Backtest Performance (NQ Jun 2025, 30 min)
• Total P&L: +$10,230 (+1.02%)
• Profit Factor: 4.61
• Win Rate: 57.1% (4 wins / 7 trades)
• Max Drawdown: $2,215 (0.22%)
(Results shown are for illustrative purposes only; past performance does not guarantee future returns.)
How to Use
1. Add this script to your 30-minute futures chart.
2. Tweak the RSI parameters and time-zone offset to suit your instrument.
3. Enable “background shading” if you’d like a visual reminder of open positions.
4. Run in paper-trade mode to validate performance before going live.
⸻
⚠️ Disclaimer: Trading carries risk. Always backtest and paper-trade before using real capital. Adjust position sizing and risk controls to your own tolerance.
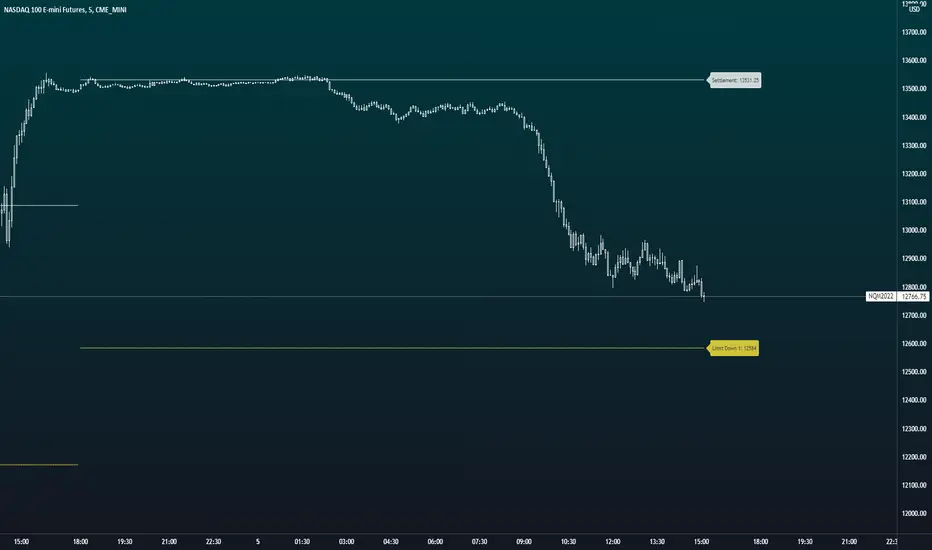
U.S. Futures Price LimitsThis scripts plots settlement and the circuit breaker limits for U.S. Equity Indexes. The current limits for the equity index futures are + and - 7%, 13%, and 20% from the previous day's settlement price. If price reaches these levels trading is either paused briefly or for the remainder of the day. The full resource (CME Website) is below.
There are plans to add the remainder of the most actively traded U.S. Futures Markets.
To find out more about the price limits it is best to use the CME's website as a reference.
www.cmegroup.com
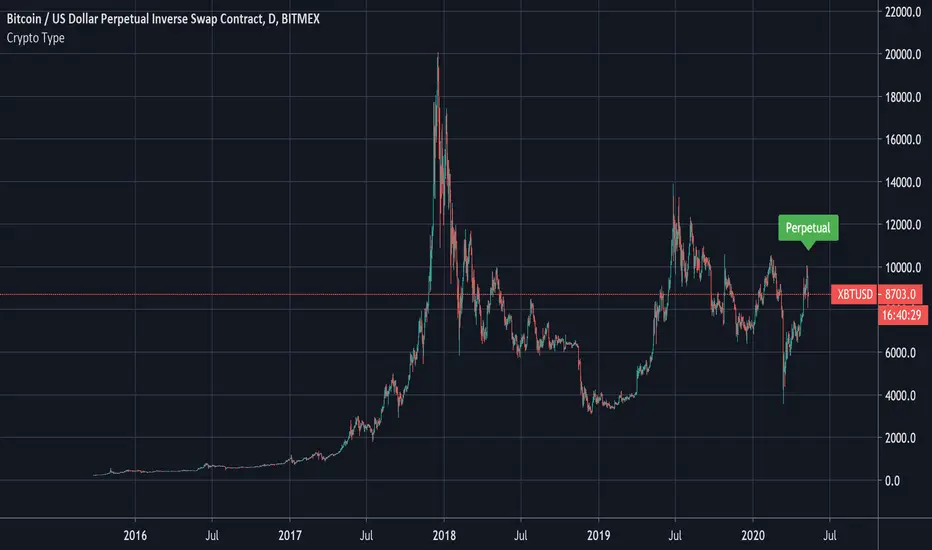
Crypto Type: Regular, Perpetual, Or Futures?A simple way to find out if the security in question is a regular, perpetual, or futures pair.
This reads the data of the security's description and sees if the word perpetual or futures is mentioned.
The method to check if a string has the letters we seek was first introduced by MichelT .
Thank you for checking this out and I hope this helps unlocking new hidden potential.
BTC Volume absolute (fiat vs Tether vs futures)BTC volume split by fiat, Tether and futures in USD
fiat = COINBASE + BITFLYER + BITSTAMP + KRAKEN
Tether = BITFINEX + BINANCE + HUOBI + HITBTC
futures = BITMEX + BYBIT

BTC: CME Futures vs. Exchange SpreadsAs you can see, this script plots the current (10-min. delayed) CME Futures price versus Bitfinex, Bitstamp, and Coinbase prices.
It's displayed here on a 30 minute view because at the time of writing the futures have been alive for approximately one day. The script will likely be more useful on longer time frames as a macro-level indicator.
It's pretty simple to adapt this to additional exchanges

[Bitcoin] Spot price vs Futures indicatorA handy script to detect opportunities in the futures market during extreme movement.
During rallies, futures usually tend to be US$10 above spot price, on the other hand it can be $1 below spot price when the price starts to decline.
You could also draw a trendline to it :) measuring the amount of risk people are willing to take just to predict future prices in the rally/decline.
Credits to lowstrife for the idea, I'm just implementing it :)

Futures Trend Signaler Final VersionFutures Trend Signaler is a compact, multi-timeframe EMA “trend dashboard” built for intraday futures/index trading.
It displays a clean table (1m + two lower timeframes you choose, e.g., 15s and 1s) that shows:
EMA 9 vs EMA 21 (short-term momentum / immediate trend direction)
EMA 21 vs EMA 50 (trend “sustainability” / broader continuation bias)
Price vs 1m EMA 9 (LTF/Ultra price position relative to the 1-minute momentum line)
Each cell is color-coded (green = bullish, red = bearish, gray = neutral/na) so you can read bias at a glance. When a new EMA crossover occurs, the table also flags it (and tracks the most recent bull/bear cross) so you can quickly see if momentum just flipped—without cluttering the chart with overlapping markers.
Fully customizable table position and text size. Designed to stay lightweight by using minimal higher/lower timeframe requests.
Disclaimer: This indicator is for informational/educational purposes only and is not financial advice. Always use proper risk management.

Futures Calendar Spread Mean Reversion Strategyfutures calendar spread strategy:
Make sure you type in the correct spread in your chart
3 standard deviations for entry, with a stop at 4 standard deviations, seems to work best
don't select tp at mean
Use with energies and grains futures, anything very seasonal

Futures Risk-Based Position CalculatorFutures Risk‑Based Position Calculator — Description
This TradingView indicator automatically calculates and displays Entry, Stop Loss (SL), and Take Profit (TP) levels for futures trades based on a fixed dollar‑risk amount.
What it does
Uses your account balance, dollar risk, number of contracts, point value, and tick size to compute how far the stop should be from the entry.
Determines the take‑profit level using a chosen risk‑to‑reward ratio.
Draws three lines on the chart:
Entry line
Stop loss line
Take profit line
Places labels next to the SL and TP lines showing prices and point distances.
Key features
Supports long or short calculation mode.
Configurable line styling:
Width, style (solid/dashed/dotted), color, opacity.
Separate styling for entry, SL, and TP.
Configurable label behavior:
Optional background.
Text color choices.
Adjustable vertical offset to avoid overlapping the lines.
Lines extend left/right by user‑defined bar amounts.
Values are always rounded to the market's tick size.
How levels are calculated
Entry = current close rounded to tick size.
Stop distance (points) = dollarRisk / (contracts × pointValue).
SL = entry − distance (long) or entry + distance (short).
TP = entry + distance × RR (long) or entry − distance × RR (short).
Visual behavior
Lines and labels update only on the last bar to avoid clutter.
Labels show:
SL: price, point distance, and contract count.
TP: price and point distance.

Position Sizing Calculator (Real-Time) - Futures Edition█ SUMMARY
The following indicator is a Position Sizing Calculator based on Average True Range (ATR), originally developed by market technician J. Welles Wilder Jr., intended for real-time trading.
This script utilizes the user's account size, acceptable risk percentage, and a stop-loss distance based on ATR to dynamically calculate the appropriate position size for each trade in real time.
█ BACKGROUND
Developed for use on the Micro E-mini Nasdaq-100 futures (MNQ), this script provides traders with continuously updated dynamic position sizes. It enables traders to instantly determine the exact number of contracts to use when entering a trade while staying within their acceptable risk tolerance.
This real-time position sizing tool helps traders make well-informed decisions when planning trade entries and calculating maximum stop-loss levels, ultimately enhancing risk management.
█ USER INPUTS
Trading Account Size: Total dollar value of the user's trading account.
Acceptable Risk (%): Maximum percentage of the trading account that the user is willing to risk per trade.
ATR Multiplier for Stop-Loss: Multiplier used to determine the distance of the stop-loss from the current price, based on the ATR value.
ATR Length: The length of the lookback period used to calculate the ATR value.
Show Target Risk Row: Toggle to hide/show the Target Risk Row
SL Levels Display: Option to see Both, Long Only, Short Only, or None of the Stop Loss Level Values.
Contract Point Value ($): Point value per contract. Tooltip highlights common values.
Tick Size: Minimum Price Movement (Default set to 0.25)
Minimum Contracts: Override the Minimum Contracts per trade to a user selected value.
(May Exceed User's Target Risk)

Futures Dollar Profit Target VisualizerFutures Profit Target Visualizer
A simple visual tool that shows exactly where price needs to go to hit your dollar profit target (and stop loss) — ideal for prop traders managing daily drawdown limits.
━━━━━━━━━━━━━━━━━━━━━━━━━━━━━━━━━━━━━━
HOW IT WORKS
Enter your target profit in dollars, and the indicator draws lines showing:
• Green line — Your take profit level
• Red line — Your stop loss level
• Blue line — Your entry (current price)
It auto-detects the futures contract you're viewing (NQ, ES, MNQ, MES, etc.) and calculates the correct point value automatically.
━━━━━━━━━━━━━━━━━━━━━━━━━━━━━━━━━━━━━━
WHY IT'S USEFUL FOR PROP TRADERS
If your prop firm allows a $500 daily drawdown and you want to risk $100 per trade with a 1:1 R:R, just enter:
• Target Profit: $100
• Risk:Reward: 1
The indicator instantly shows you the exact price levels — no mental math needed.
━━━━━━━━━━━━━━━━━━━━━━━━━━━━━━━━━━━━━━
KEY FEATURES
• Auto-detects contract type (NQ, ES, MNQ, MES, CL, GC, and more)
• Separate inputs for Mini and Micro contract quantities — switch between charts and it automatically uses the right position size
• Supports Long and Short trades
• Adjustable Risk:Reward ratio
• Labels show price, dollar amount, and points to target
• Lines are offset to the right so they don't affect chart auto-scaling
━━━━━━━━━━━━━━━━━━━━━━━━━━━━━━━━━━━━━━
SETTINGS
Profit Settings:
• Target Profit ($) — Your desired profit in dollars
• Risk:Reward Ratio — e.g., 1 = equal risk/reward, 2 = target is 2x your stop
• Mini Contracts — Position size when viewing mini contracts (NQ, ES, etc.)
• Micro Contracts — Position size when viewing micro contracts (MNQ, MES, etc.)
Trade Settings:
• Trade Direction — Long or Short
• Entry Price — Leave at 0 to use current price, or set a specific entry
Display:
• Show Price Labels — Toggle the price/profit labels
• Show Fill — Toggle the shaded zones between entry and target/stop
• Line Offset — Push lines further right (helps avoid auto-scale issues)
• Line Length — How long the lines extend
• Colors — Customize target, stop, and entry line colors
━━━━━━━━━━━━━━━━━━━━━━━━━━━━━━━━━━━━━━
SUPPORTED CONTRACTS
Equity Index: NQ, ES, YM, RTY + Micros (MNQ, MES, MYM, M2K)
Energy: CL, MCL, NG
Metals: GC, MGC, SI, SIL
Treasuries: ZB, ZN, ZF, ZT
Currencies: 6E, 6J, 6B, 6A, 6C
Ags: ZC, ZS, ZW
If your contract isn't listed, use "Custom" and enter the tick value manually.
━━━━━━━━━━━━━━━━━━━━━━━━━━━━━━━━━━━━━━
EXAMPLE
You trade MNQ with 5 contracts and want to make $100:
• Set Micro Contracts: 5
• Set Target Profit: $100
• MNQ = $2/point × 5 contracts = $10/point
• Indicator shows target 10 points above entry
Switch to NQ with 1 contract:
• Set Mini Contracts: 1
• Same $100 target
• NQ = $20/point × 1 contract = $20/point
• Indicator shows target 5 points above entry
No need to change settings when switching charts — it adjusts automatically.
