DforDimasik - Premium IndicatorThe indicator is used to show the difference between the futures and spot asset price on cryptocurrencies like BINANCE:BTCUSDTPERP and BINANCE:BTCUSDT
Premium is calculated as Futures Asset Price - Spot Asset Price
Cari dalam skrip untuk "Futures"

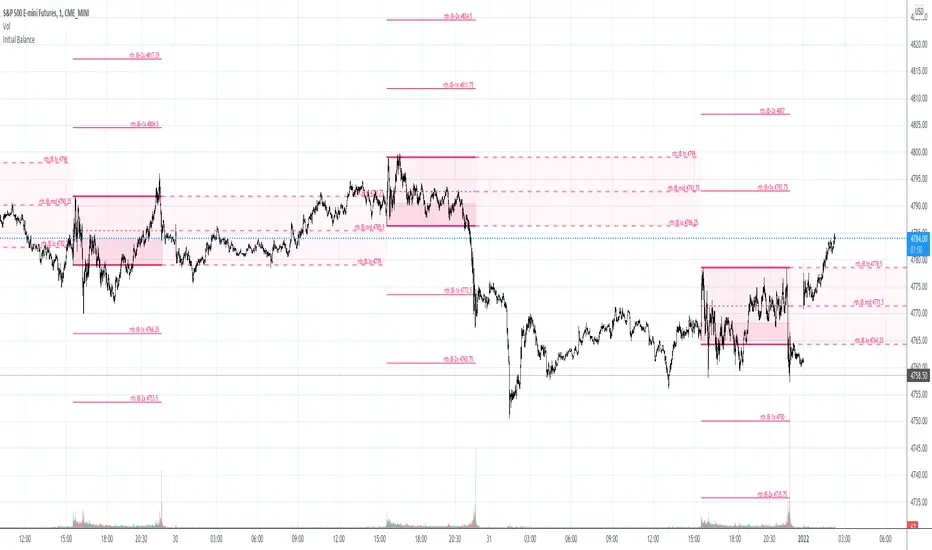
Initial Balance & extensions Custom session time and IB durationThe indicator will plot Initial Balance levels and extensions. The session start and end times are configurable depending on instrument, as well as the Initial Balance end time. The session times must be entered in the underlying instrument's timezone, for example:
ES-futures (Chicago Timezone)
Session Start: 0830
Initial Balance End: 0930
Session End: 1515
US-Stocks (New York Timezone)
Session Start: 0930
Initial Balance End: 1030
Session End: 1600
Europe Futures (Madrid Timezone)
Session Start: 0800
Initial balance End: 0900
Session End: 2200
Colors and linewidths are also customisable.
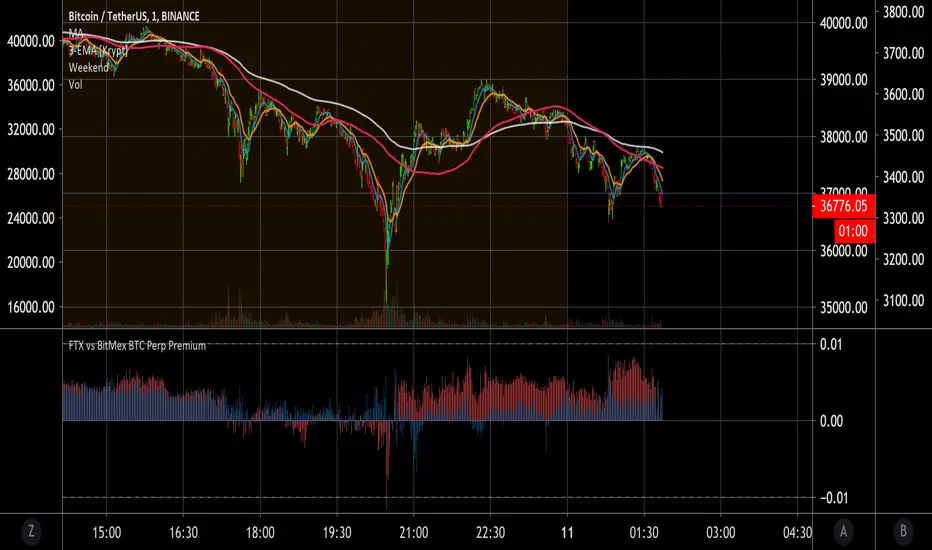
FTX vs BitMex BTC Perp PremiumThis script compares FTX BTC/PERP (BTC perpetual futures contract) price to Binance BTC/USDT spot and colors it red. It also plots Bitmex's BTC perpetual futures compared to Binance spot and colors it blue.
FTX = red
Bitmex = blue
Now you can easily see that you can get a 1% discount on FTX perpetuals when it is tanking. This tells you that you can set your limit buy orders extra low if you like to catch crashes. Also, you can see what your average trader on each platform is willing to pay above or below the spot premium. In general you want to do the opposite of what the average trading is doing on these exchanges unless you're in the main bull or mania phase of the Bitcoin cycle.
If you want to use Bitstamp or your favorite exchange it can be changed in the settings. Let me know if you find any settings that work well for you.
May you profit and enjoy! :)
Zignaly TutorialThis strategy serves as a beginner's guide to connect TradingView signals to Zignaly Crypto Trading Platform.
It was originally tested at BTCUSDT pair and 1D timeframe.
Before using this documentation it's recommended that you:
Use default TradingView strategy script or another script and setup its associated alert manually. Just make the alert pop-up in the screen.
Create a 'Copy-Trader provider' (or Signal Provider) in Zignaly and send signals to it either thanks to your browser or with some basic programming.
SETTINGS
__ SETTINGS - Capital
(CAPITAL) Capital quote invested per order in USDT units {100.0}. This setting is only used when '(ZIG) Provider type' is set to 'Signal Provider'.
(CAPITAL) Capital percentage invested per order (%) {25.0}. This setting is only used when '(ZIG) Provider type' is set to 'Copy Trader Provider'.
__ SETTINGS - Misc
(ZIG) Enable Alert message {True}: Whether to enable alert message or not.
(DEBUG) Enable debug on order comments {True}: Whether to show alerts on order comments or not.
Number of decimal digits for Prices {2}.
(DECIMAL) Maximum number of decimal for contracts {3}.
__ SETTINGS - Zignaly
(ZIG) Integration type {TradingView only}: Hybrid : Both TradingView and Zignaly handle take profit, trailing stops and stop losses. Useful if you are scared about TradingView not firing an alert. It might arise problems if TradingView and Zignaly get out of sync. TradingView only : TradingView sends entry and exit orders to Zignaly so that Zignaly only buys or sells. Zignaly won't handle stop loss or other settings on its own.
(ZIG) Zignaly Alert Type {WebHook}: 'Email' or 'WebHook'.
(ZIG) Provider type {Copy Trader Provider}: 'Copy Trader Provider' or 'Signal Provider'. 'Copy Trader Provider' sends a percentage to manage. 'Signal Provider' sends a quote to manage.
(ZIG) Exchange: 'Binance' or 'Kucoin'.
(ZIG) Exchange Type {Spot}: 'Spot' or 'Futures'.
(ZIG) Leverage {1}. Set it to '1' when '(ZIG) Exchange Type' is set to 'Spot'.
__ SETTINGS - Strategy
(STRAT) Strategy Type: 'Long and Short', 'Long Only' or 'Short Only'.
(STOPTAKE) Take Profit? {false}: Whether to enable Take Profit.
(STOPTAKE) Stop Loss? {True}: Whether to enable Stop Loss.
(TRAILING) Enable Trailing Take Profit (%) {True}: Whether to enable Trailing Take Profit.
(STOPTAKE) Take Profit % {3.0}: Take profit percentage. This setting is only used when '(STOPTAKE) Take Profit?' setting is set to true.
(STOPTAKE) Stop Loss % {2.0}: Stop loss percentage. This setting is only used when '(STOPTAKE) Stop Loss?' setting is set to true.
(TRAILING) Trailing Take Profit Trigger (%) {2.5}: Trailing Stop Trigger Percentage. This setting is only used when '(TRAILING) Enable Trailing Take Profit (%)' setting is set to true.
(TRAILING) Trailing Take Profit as a percentage of Trailing Take Profit Trigger (%) {25.0}: Trailing Stop Distance Percentage. This setting is only used when '(TRAILING) Enable Trailing Take Profit (%)' setting is set to true.
(RECENT) Number of minutes to wait to open a new order after the previous one has been opened {6}.
DEFAULT SETTINGS
By default this strategy has been setup with these beginner settings:
'(ZIG) Integration type' : TradingView only
'(ZIG) Provider type' : 'Copy Trader Provider'
'(ZIG) Exchange' : 'Binance'
'(ZIG) Exchange Type' : 'Spot'
'(STRAT) Strategy Type' : 'Long Only'
'(ZIG) Leverage' : '1' (Or no leverage)
but you can change those settings if needed.
FIRST STEP
For both future of spot markets you should make sure to change '(ZIG) Zignaly Alert Type' to match either WebHook or Email. If you have a non paid account in TradingView as in October 2020 you would have to use Email which it's free to use.
RECOMMENDED SETTINGS
__ RECOMMENDED SETTINGS - Spot markets
'(ZIG) Exchange Type' setting should be set to 'Spot'
'(STRAT) Strategy Type' setting should be set to 'Long Only'
'(ZIG) Leverage' setting should be set to '1'
__ RECOMMENDED SETTINGS - Future markets
'(ZIG) Exchange Type' setting should be set to 'Futures'
'(STRAT) Strategy Type' setting should be set to 'Long and Short'
'(ZIG) Leverage' setting might be changed if desired.
__ RECOMMENDED SETTINGS - Signal Providers
'(ZIG) Provider type' setting should be set to 'Signal Provider'
'(CAPITAL) Capital quote invested per order in USDT units' setting might be changed if desired.
__ RECOMMENDED SETTINGS - Copy Trader Providers
'(ZIG) Provider type' setting should be set to 'Copy Trader Provider'
'(CAPITAL) Capital percentage invested per order (%)' setting might be changed if desired.
Strategy Properties setting: 'Initial Capital' might be changed if desired.
INTEGRATION TYPE EXPLANATION
'Hybrid': Both TradingView and Zignaly handle take profit, trailing stops and stop losses. Useful if you are scared about TradingView not firing an alert. It might arise problems if TradingView and Zignaly get out of sync.
'TradingView only': TradingView sends entry and exit orders to Zignaly so that Zignaly only buys or sells. Zignaly won't handle stop loss or other settings on its own.
HOW TO USE THIS STRATEGY
Beginner: Copy and paste the strategy and change it to your needs. Turn off '(DEBUG) Enable debug on order comments' setting.
Medium: Reuse functions and inputs from this strategy into your own as if it was a library.
Advanced: Check Strategy Tester. List of trades. Copy and paste the different suggested 'alert_message' variable contents to your script.
Expert: I needed a way to pass data from TradingView script to the alert. Now I know it's the 'alert_message' variable. I can do this own my own.
ALERTS SETUP
This is the important piece of information that allows you to connect TradingView to Zignaly in a semi-automatic manner.
__ ALERTS SETUP - WebHook
Webhook URL: https : // zignaly . com / api / signals.php?key=MYSECRETKEY
Message: { {{strategy.order.alert_message}} , "key" : "MYSECRETKEY" }
__ ALERTS SETUP - Email
Setup a new Hotmail account
Add it as an 'SMS email' in TradingView Profile settings page.
Confirm your own the email address
Create a rule in your Hotmail account that 'Redirects' (not forwards) emails to 'signals @ zignaly . email' when (1): 'Subject' includes 'Alert', (2): 'Email body' contains string 'MYZIGNALYREDIRECTTRIGGER' and (3): 'From' contains 'noreply @ tradingview . com'.
In 'More Actions' check: Send Email-to-SMS
Message: ||{{strategy.order.alert_message}}||key=MYSECRETKEY||
MYZIGNALYREDIRECTTRIGGER
'(DEBUG) Enable debug on order comments' is turned on by default so that you can see in the Strategy Tester. List of Trades. The different orders alert_message that would have been sent to your alert. You might want to turn it off it some many letters in the screen is problem.
STRATEGY ADVICE
If you turn on 'Take Profit' then turn off 'Trailing Take Profit'.
ZIGNALY SIDE ADVICE
If you are a 'Signal Provider' make sure that 'Allow reusing the same signalId if there isn't any open position using it?' setting in the profile tab is set to true.
You can find your 'MYSECRETKEY' in your 'Copy Trader/Signal' provider Edit tab at 'Signal URL'.
ADDITIONAL ZIGNALY DOCUMENTATION
docs . zignaly . com / signals / how-to -- How to send signals to Zignaly
3 Ways to send signals to Zignaly
SIGNALS
FINAL REMARKS
This strategy tries to match the Pine Script Coding Conventions as best as possible.

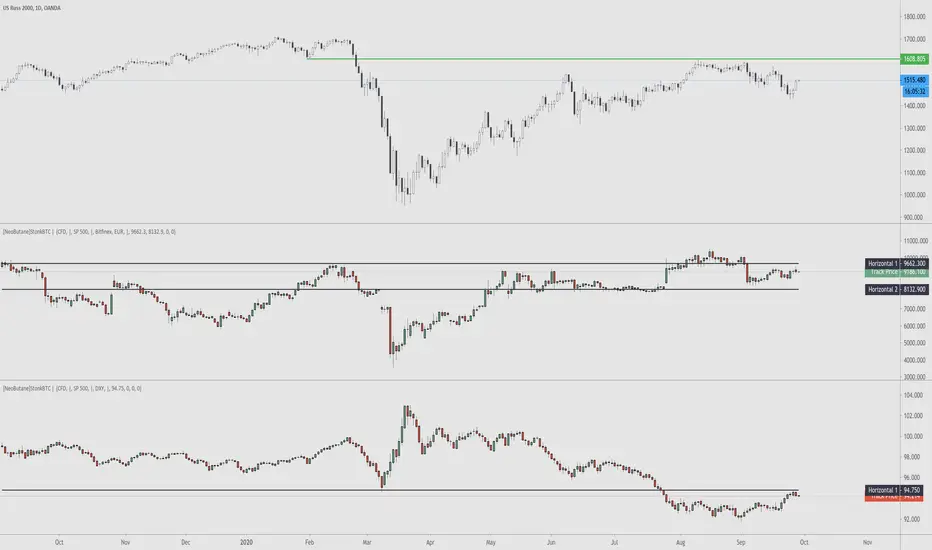
StonkBTC - autoswitch secondary series for scalpersSince the drop in March of 2020, the U.S. ETF , SPY, has been correlated with bitcoin's moves, especially during the NY session.
This tool is meant to help traders who want to take advantage of that without having to switch the secondary series between BTCUSD and (generally) SPY when changing the ticker they are viewing.
How this works:
The indicator will automatically switch between bitcoin or equity index depending on what ticker your current chart is. Ideally this tool would be very simple to use.
Options:
Show/hide a 'track price' line
Index choice of SP500, Nasdaq 100, and Russell 2000. Further selection by ETF, futures, and CFD
Varied bitcoin price sources
Notes:
You will need a separate subscription to TradingView to view realtime CME futures data (if not, it will be delayed by 10 minutes). Because of this, the default option chosen is the CFD for the most complete chart when viewing bitcoin.
NY Core Trading Session: 9:30 a.m. to 4:00 p.m. ET
www.nyse.com
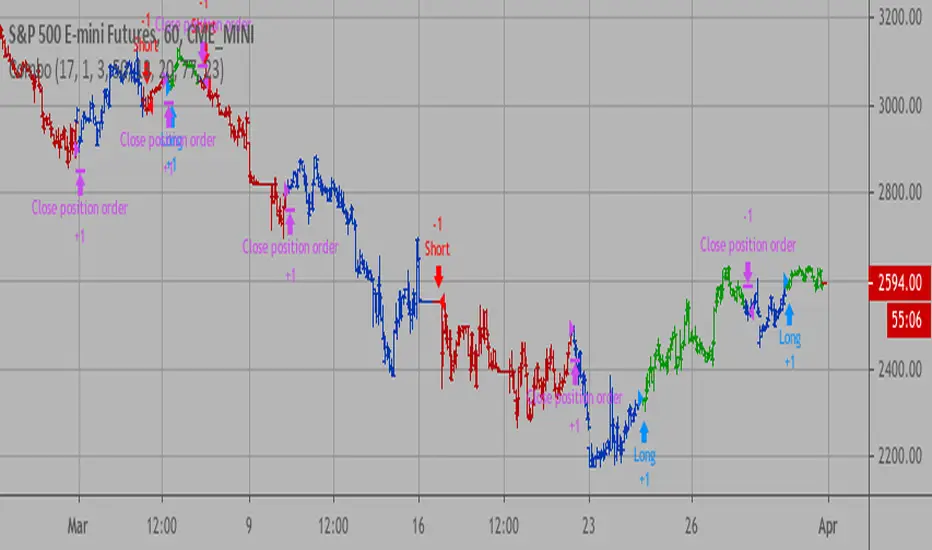
Combo Backtest 123 Reversal & Dynamo This is combo strategies for get a cumulative signal.
First strategy
This System was created from the Book "How I Tripled My Money In The
Futures Market" by Ulf Jensen, Page 183. This is reverse type of strategies.
The strategy buys at market, if close price is higher than the previous close
during 2 days and the meaning of 9-days Stochastic Slow Oscillator is lower than 50.
The strategy sells at market, if close price is lower than the previous close price
during 2 days and the meaning of 9-days Stochastic Fast Oscillator is higher than 50.
Second strategy
In July 1996 Futures magazine, E. Marshall Wall introduces the
Dynamic Momentum Oscillator (Dynamo). Please refer to this article
for interpretation.
The Dynamo oscillator is a normalizing function which adjusts the
values of a standard oscillator for trendiness by taking the difference
between the value of the oscillator and a moving average of the oscillator
and then subtracting that value from the oscillator midpoint.
WARNING:
- For purpose educate only
- This script to change bars colors.
Combo Strategy 123 Reversal & DynamoThis is combo strategies for get a cumulative signal.
First strategy
This System was created from the Book "How I Tripled My Money In The
Futures Market" by Ulf Jensen, Page 183. This is reverse type of strategies.
The strategy buys at market, if close price is higher than the previous close
during 2 days and the meaning of 9-days Stochastic Slow Oscillator is lower than 50.
The strategy sells at market, if close price is lower than the previous close price
during 2 days and the meaning of 9-days Stochastic Fast Oscillator is higher than 50.
Second strategy
In July 1996 Futures magazine, E. Marshall Wall introduces the
Dynamic Momentum Oscillator (Dynamo). Please refer to this article
for interpretation.
The Dynamo oscillator is a normalizing function which adjusts the
values of a standard oscillator for trendiness by taking the difference
between the value of the oscillator and a moving average of the oscillator
and then subtracting that value from the oscillator midpoint.
WARNING:
- For purpose educate only
- This script to change bars colors.

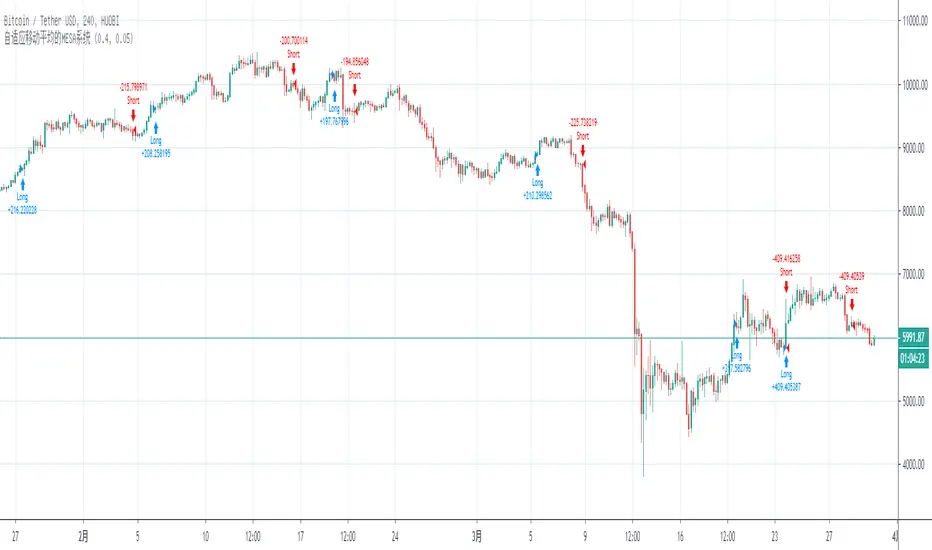
MAMA (Ehlers) MESA Adaptive Moving AverageMAMA ( Ehlers ) MESA Adaptive Moving Average:
What it is and how it works
MESA Phasor is the most advanced futures trading program on the market!
MESA Phasor derives its name from the sinewave generator you probably recall from your high school trigonometry class. As you can see in the diagram, the rotating phasor generates a sine wave in the time domain, visualized as a shadow from the arrow tip of the phasor on the vertical axis. A cycle is completed on each full rotation of the phasor. The angle of the phasor increases at a constant rate, and is reset to zero when 360 degrees of rotation have been achieved. The idea of the trading system is to buy low at the valley of the sine wave , when phasor passes the lower angle, and to sell short at the crest of the sine wave , when the phasor passes the upper angle. Now the trade entries and exits are defined in terms of angles, which are in the frequency domain. Therefore, trading decisions are removed from waveform vagaries in the time domain. This means that the trading decisions are robust across various futures contracts and across all kinds of market conditions.
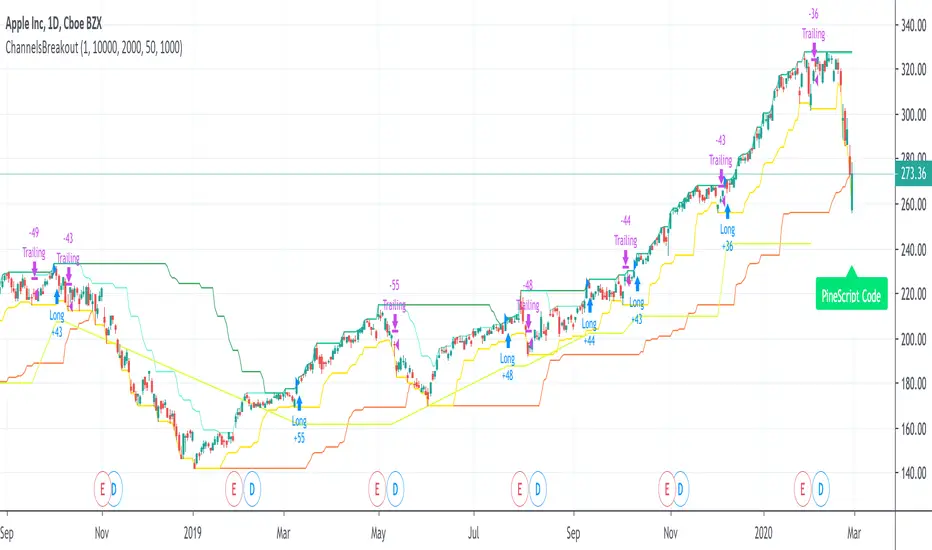
ChannelsBreakoutThis script allows you to intercept price channel breakouts (Donchian channel) in a bullish perspective. Applicable both on Equities/ETFs and on Futures (Index Futures).
We open a position when closes crosses the upper channel. The trade ends with a trailing associated with a fast lower Donchian or a monetary stop loss.
It is an educational code and does not constitute a solicitation for public savings.
Volume Profile [Makit0]VOLUME PROFILE INDICATOR v0.5 beta
Volume Profile is suitable for day and swing trading on stock and futures markets, is a volume based indicator that gives you 6 key values for each session: POC, VAH, VAL, profile HIGH, LOW and MID levels. This project was born on the idea of plotting the RTH sessions Value Areas for /ES in an automated way, but you can select between 3 different sessions: RTH, GLOBEX and FULL sessions.
Some basic concepts:
- Volume Profile calculates the total volume for the session at each price level and give us market generated information about what price and range of prices are the most traded (where the value is)
- Value Area (VA): range of prices where 70% of the session volume is traded
- Value Area High (VAH): highest price within VA
- Value Area Low (VAL): lowest price within VA
- Point of Control (POC): the most traded price of the session (with the most volume)
- Session HIGH, LOW and MID levels are also important
There are a huge amount of things to know of Market Profile and Auction Theory like types of days, types of openings, relationships between value areas and openings... for those interested Jim Dalton's work is the way to come
I'm in my 2nd trading year and my goal for this year is learning to daytrade the futures markets thru the lens of Market Profile
For info on Volume Profile: TV Volume Profile wiki page at www.tradingview.com
For info on Market Profile and Market Auction Theory: Jim Dalton's book Mind over markets (this is a MUST)
BE AWARE: this indicator is based on the current chart's time interval and it only plots on 1, 2, 3, 5, 10, 15 and 30 minutes charts.
This is the correlation table TV uses in the Volume Profile Session Volume indicator (from the wiki above)
Chart Indicator
1 - 5 1
6 - 15 5
16 - 30 10
31 - 60 15
61 - 120 30
121 - 1D 60
This indicator doesn't follow that correlation, it doesn't get the volume data from a lower timeframe, it gets the data from the current chart resolution.
FEATURES
- 6 key values for each session: POC (solid yellow), VAH (solid red), VAL (solid green), profile HIGH (dashed silver), LOW (dashed silver) and MID (dotted silver) levels
- 3 sessions to choose for: RTH, GLOBEX and FULL
- select the numbers of sessions to plot by adding 12 hours periods back in time
- show/hide POC
- show/hide VAH & VAL
- show/hide session HIGH, LOW & MID levels
- highlight the periods of time out of the session (silver)
- extend the plotted lines all the way to the right, be careful this can turn the chart unreadable if there are a lot of sessions and lines plotted
SETTINGS
- Session: select between RTH (8:30 to 15:15 CT), GLOBEX (17:00 to 8:30 CT) and FULL (17:00 to 15:15 CT) sessions. RTH by default
- Last 12 hour periods to show: select the deph of the study by adding periods, for example, 60 periods are 30 natural days and around 22 trading days. 1 period by default
- Show POC (Point of Control): show/hide POC line. true by default
- Show VA (Value Area High & Low): show/hide VAH & VAL lines. true by default
- Show Range (Session High, Low & Mid): show/hide session HIGH, LOW & MID lines. true by default
- Highlight out of session: show/hide a silver shadow over the non session periods. true by default
- Extension: Extend all the plotted lines to the right. false by default
HOW TO SETUP
BE AWARE THIS INDICATOR PLOTS ONLY IN THE FOLLOWING CHART RESOLUTIONS: 1, 2, 3, 5, 10, 15 AND 30 MINUTES CHARTS. YOU MUST SELECT ONE OF THIS RESOLUTIONS TO THE INDICATOR BE ABLE TO PLOT
- By default this indicator plots all the levels for the last RTH session within the last 12 hours, if there is no plot try to adjust the 12 hours periods until the seesion and the periods match
- For Globex/Full sessions just select what you want from the dropdown menu and adjust the periods to plot the values
- Show or hide the levels you want with the 3 groups: POC line, VA lines and Session Range lines
- The highlight and extension options are for a better visibility of the levels as POC or VAH/VAL
THANKS TO
@watsonexchange for all the help, ideas and insights on this and the last two indicators (Market Delta & Market Internals) I'm working on my way to a 'clean chart' but for me it's not an easy path
@PineCoders for all the amazing stuff they do and all the help and tools they provide, in special the Script-Stopwatch at that was key in lowering this indicator's execution time
All the TV and Pine community, open source and shared knowledge are indeed the best way to help each other
IF YOU REALLY LIKE THIS WORK, please send me a comment or a private message and TELL ME WHAT you trade, HOW you trade it and your FAVOURITE SETUP for pulling out money from the market in a consistent basis, I'm learning to trade (this is my 2nd year) and I need all the help I can get
GOOD LUCK AND HAPPY TRADING

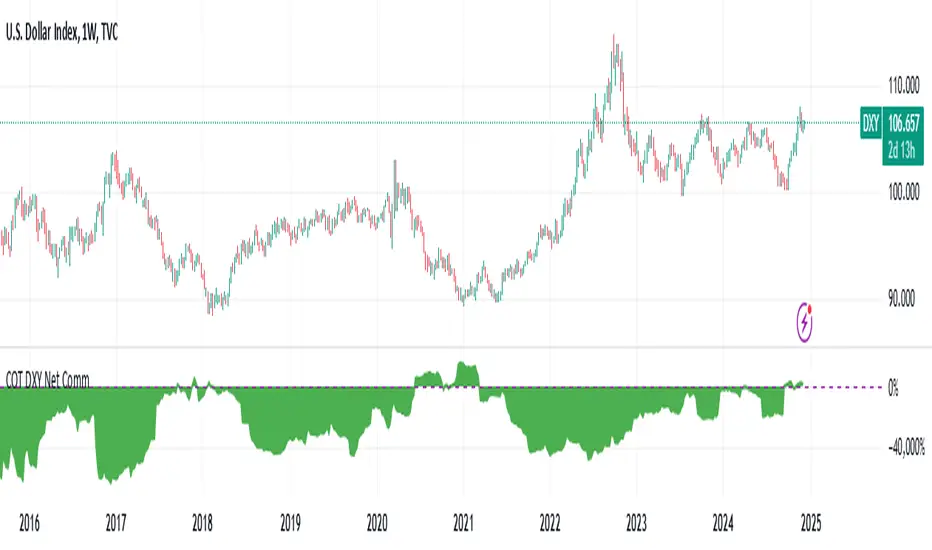
DXY COT Commercial Net PositionsThis script was created due to the lack of position of US Dollar Index Futures (DXY).
It is designed to perform a much more liquid and inclusive position analysis.
As the exponential ratios do not mean anything to positions, weights are used as multipliers instead of exponential functions.
Swedish Krona (SEK) Futures are not directly quoted in Quandl, therefore weighted in Euro / dollar parity.
By perceiving these positions as inverse correlations, you can also identify where the world economy is doing well.
COT Commercial Net Positions are calculated as (Short - Long) because of Commercials act according to the reverse of the market.
In this way, you can follow up normally instead of reverse correlation.
Because except in extreme cases, in which case capitals usually shift to Gold.
This is not the case, since there is no capital inflow to other currencies, it is not a strong sell position to the dollar index.
When there is a shift in bonds, we see the effect of the dollar in general.
I created for the Dollar Index in order not to deviate from the concept.
I wanted to share it with everyone as I thought that you have important clues about how investors take positions.
Modified currency weights :
Euro : % 61.8
Japanese Yen : % 13.6
British Pound : %11.9
Canadian Dollar : % 9.1
Swiss Franc : % 3.6
NOTE : You can use it for all instruments except crypto coins, especially US Dollar Index (DXY).
Since the COT data is taken, it will not repaint in 1 week (1W) timeframe.
The log can also be repaint according to the time of data publication.
It will repaint in lower time frames.
I hope it will help your analysis and your scripts,regards.
Open Interest Stochastic Money Flow IndexThis is the improved version of Stochastic Money Flow Index script that uses Open Interest instead of volume in Future markets.
I think it will make a difference especially in Future and CFD markets.
Since the system will pull data from Quandl, CFTC reports may cause repaint when disclosed.
So if you use it during the weekly time frame (1W), it will definitely not repaint.
You can also use the volume by selecting "Others" from the menu.This option applies to each instrument, you can use it on any financial instrument with or without COT data.
Bitcoin is included in the "Futures" option.
In Futures, you can observe the difference of Open Interest's success by comparing, since it counts exchanges between the two parties singularly, it reacts more firmly to speculative movements.
This script also includes alerts and bar color options, you can use from the menu.
It is also suitable for mutable variables.This script was freed from the integer loads.You can modify it in any adaptive or fractional period.
I hope it will help your analyzes, regards .

Open Interest Rank-BuschiEnglish:
One part of the "Commitment of Traders-Report" is the Open Interest which is shown in this indicator (source: Quandl database).
Unlike my also published indicator "Open Interest-Buschi", the values here are not absolute but in a ranking system from 0 to 100 with individual time frames-
The following futures are included:
30-year Bonds (ZB)
10-year Notes ( ZN )
Soybeans (ZS)
Soybean Meal (ZM)
Soybean Oil (ZL)
Corn ( ZC )
Soft Red Winter Wheat (ZW)
Hard Red Winter Wheat (KE)
Lean Hogs (HE)
Live Cattle ( LE )
Gold ( GC )
Silver (SI)
Copper (HG)
Crude Oil ( CL )
Heating Oil (HO)
RBOB Gasoline ( RB )
Natural Gas ( NG )
Australian Dollar (A6)
British Pound (B6)
Canadian Dollar (D6)
Euro (E6)
Japanese Yen (J6)
Swiss Franc (S6)
Sugar ( SB )
Coffee (KC)
Cocoa ( CC )
Cotton ( CT )
S&P 500 E-Mini (ES)
Russell 2000 E-Mini (RTY)
Dow Jones Industrial Mini (YM)
Nasdaq 100 E-Mini (NQ)
Platin (PL)
Palladium (PA)
Aluminium (AUP)
Steel ( HRC )
Ethanol (AEZ)
Brent Crude Oil (J26)
Rice (ZR)
Oat (ZO)
Milk (DL)
Orange Juice (JO)
Lumber (LS)
Feeder Cattle (GF)
S&P 500 ( SP )
Dow Jones Industrial Average Index (DJIA)
New Zealand Dollar (N6)
Deutsch:
Ein Bestandteil des "Commitment of Traders-Report" ist das Open Interest, das in diesem Indikator dargestellt wird (Quelle: Quandl Datenbank).
Anders als in meinem ebenfalls veröffentlichten Indikator "Open Interest-Buschi" werden hier nicht die absoluten Werte dargestellt, sondern in einem Ranking-System von 0 bis 100 mit individuellen Zeitrahmen.
Folgende Futures sind enthalten:
30-jährige US-Staatsanleihen (ZB)
10-jährige US-Staatsanleihen ( ZN )
Sojabohnen(ZS)
Sojabohnen-Mehl (ZM)
Sojabohnen-Öl (ZL)
Mais( ZC )
Soft Red Winter-Weizen (ZW)
Hard Red Winter-Weizen (KE)
Magerschweine (HE)
Lebendrinder ( LE )
Gold ( GC )
Silber (SI)
Kupfer(HG)
Rohöl ( CL )
Heizöl (HO)
Benzin ( RB )
Erdgas ( NG )
Australischer Dollar (A6)
Britisches Pfund (B6)
Kanadischer Dollar (D6)
Euro (E6)
Japanischer Yen (J6)
Schweizer Franken (S6)
Zucker ( SB )
Kaffee (KC)
Kakao ( CC )
Baumwolle ( CT )
S&P 500 E-Mini (ES)
Russell 2000 E-Mini (RTY)
Dow Jones Industrial Mini (YM)
Nasdaq 100 E-Mini (NQ)
Platin (PL)
Palladium (PA)
Aluminium (AUP)
Stahl ( HRC )
Ethanol (AEZ)
Brent Rohöl (J26)
Reis (ZR)
Hafer (ZO)
Milch (DL)
Orangensaft (JO)
Holz (LS)
Mastrinder (GF)
S&P 500 ( SP )
Dow Jones Industrial Average Index (DJIA)
Neuseeland Dollar (N6)

Open Interest-Buschi
English:
One part of the "Commitment of Traders-Report" is the Open Interest which is shown in this indicator (source: Quandl database).
The following futures are included:
30-year Bonds (ZB)
10-year Notes (ZN)
Soybeans (ZS)
Soybean Meal (ZM)
Soybean Oil (ZL)
Corn (ZC)
Soft Red Winter Wheat (ZW)
Hard Red Winter Wheat(KE)
Lean Hogs (HE)
Live Cattle (LE)
Gold (GC)
Silver (SI)
Copper (HG)
Crude Oil (CL)
Heating Oil (HO)
RBOB Gasoline (RB)
Natural Gas (NG)
Australian Dollar (A6)
British Pound (B6)
Canadian Dollar (D6)
Euro (E6)
Japanese Yen (J6)
Swiss Franc (S6)
Sugar (SB)
Coffee (KC)
Cocoa (CC)
Cotton (CT)
S&P 500 E-Mini (ES)
Russell 2000 E-Mini (RTY)
Dow Jones Industrial Mini (YM)
Nasdaq 100 E-Mini (NQ)
Platin (PL)
Palladium (PA)
Aluminium (AUP)
Steel (HRC)
Ethanol (AEZ)
Brent Crude Oil (J26)
Rice (ZR)
Oat (ZO)
Milk (DL)
Orange Juice (JO)
Lumber (LS)
Feeder Cattle (GF)
S&P 500 (SP)
Dow Jones Industrial Average Index (DJIA)
New Zealand Dollar (N6)
Deutsch:
Ein Bestandteil des "Commitment of Traders-Report" ist das Open Interest, das in diesem Indikator dargestellt wird (Quelle: Quandl Datenbank).
Folgende Futures sind enthalten:
30-jährige US-Staatsanleihen (ZB)
10-jährige US-Staatsanleihen (ZN)
Sojabohnen(ZS)
Sojabohnen-Mehl (ZM)
Sojabohnen-Öl (ZL)
Mais(ZC)
Soft Red Winter-Weizen (ZW)
Hard Red Winter-Weizen (KE)
Magerschweine (HE)
Lebendrinder (LE)
Gold (GC)
Silber (SI)
Kupfer(HG)
Rohöl (CL)
Heizöl (HO)
Benzin (RB)
Erdgas (NG)
Australischer Dollar (A6)
Britisches Pfund (B6)
Kanadischer Dollar (D6)
Euro (E6)
Japanischer Yen (J6)
Schweizer Franken (S6)
Zucker (SB)
Kaffee (KC)
Kakao (CC)
Baumwolle (CT)
S&P 500 E-Mini (ES)
Russell 2000 E-Mini (RTY)
Dow Jones Industrial Mini (YM)
Nasdaq 100 E-Mini (NQ)
Platin (PL)
Palladium (PA)
Aluminium (AUP)
Stahl (HRC)
Ethanol (AEZ)
Brent Rohöl (J26)
Reis (ZR)
Hafer (ZO)
Milch (DL)
Orangensaft (JO)
Holz (LS)
Mastrinder (GF)
S&P 500 (SP)
Dow Jones Industrial Average Index (DJIA)
Neuseeland Dollar (N6)

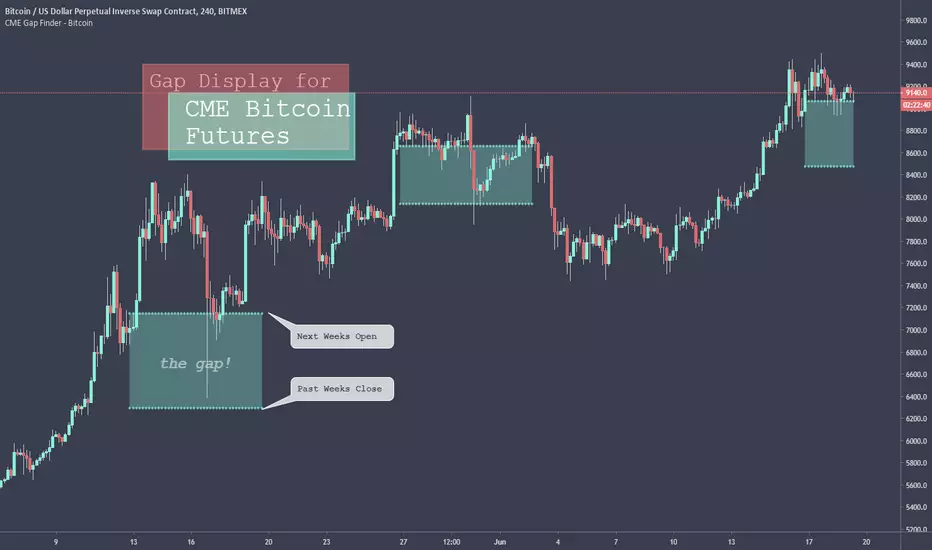
CME Gap Finder - BitcoinOnly for Bitcoin!
This indicator locates weekly gaps created by the CME Futures market for Bitcoin.
As you can see, Bitcoin tends to close the weekly gaps created in the futures market so I thought this could be a very useful tool.
Instead of having to look between multiple charts, this simply overlays the past weeks open and close should a gap appear.
I hope you find this indicator useful!
Cheers!
COT total by categoriesWill plot the sum of all positions (total) for selected categories
Configure&select:
-futures/futures+options
-plot sum by num_contracts/percent
-plot sum of all spreads positions across all categories

COT disaggregatedCFTC COT data is exported by quandl.com to tradingview
COT@quandl:
www.quandl.com
COT@tradingview
www.tradingview.com
How to use this script:
Select and load CFTC COT data for the commodity ticker in the chart
Will by default take current ticker, or allow to avvverride it with another
Traders' categories are those for commodities , not financial futs
Select And Configure :
-categories to be plotted
-Futures/Futures+Options
-by num_contracts/percent
-plot "Tot Spreads %" selection (only when also "Show as % of OI" selected)
will plot the total of spreads positions across all categories
This script supercedes my other "MY_ CFTC GC/SI/CL (Disaggregated)" script
Just changed name
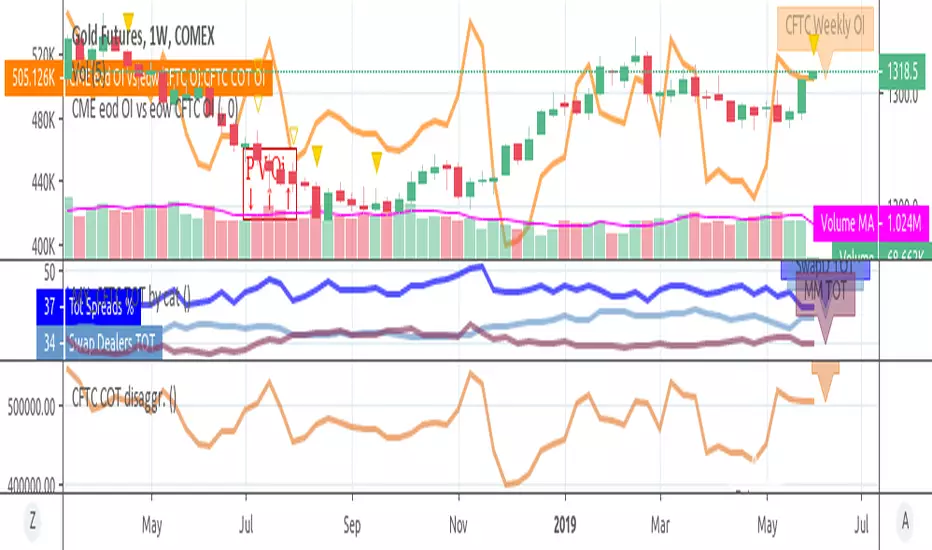
Open Interest:CME e-o-d vs CFTC e-o-wCFTC only publishes total OI on fridays, related to last Tuesday.
But what happened since last Tuesday?
CME Vol & Open Interest data is recorded&exported daily by quandl.com to tradingview
via the che CHRIS/CME datasets
www.quandl.com
Eg. Nat Gas next outstanding cntract n. 20, field n. 7(OI)
@quandl.com:
www.quandl.com
is exported @tradingview:
www.tradingview.com
Every outstanding contract's OI & vol is exported (black column), but not the total (yellow line):
tiny.cc
This script sums up all the existing outstanding contract's OI for the future (the black column), so one can have an idea of the total OI for the day (Yellow line).
As numer of outstanding contracts varies from future to future,Eg:
E-mini (ES) has 4 contracts, Gold(GC) 16 cntrcts, NatGas(NG) has 43, WTI(CL) has 38 etc
the scrips tries to guess how many exist for it and sums them up, to have the total OI for tha day
Number ofoutstanding contracts exported by quandl.com to tradingview is taken from
s3.amazonaws.com
There are 2 params you can enter on the script:
* override the ticket symbol on the chart ,if script cannot guessit or you need a different one
* enter the "preliminary" OI that is published by CME early the next day, butb not yet exported by quandl to tradingview
This script is Open so anyone can copy and modifyit for its use.
Please post comments and ideas if you find it useful
I try to keep a log of my work here:

Colored Volume Bars All Markets: Combining Volume SourcesUsing volume in Forex is potentially misleading as we are only provided the broker volume or futures exchange volume for the currency or commodity in a decentralised market. This code combines the volumes from FXCM, Onanda and futures for the instrument being studied. The combination of the volumes could improve the reliability of the volume being considered. Using this approach other volume indicators can also be improved.

Bitmex Bitcoin BasisInspired by the Ugly Old Goat's articles about the Bitcoin basis - medium.com
with the help of @Plumptoiletduck this indicator was created to show the Bitmex futures premium or discount.
Note you need to add in the new futures ticker every 3 months.

ACM22 not repaintedДелал данный скрипт для FORTS.Идеально подойдет тем,кто использует трейлинг стопы.В основе стратегии лежит RSI.Как по мне,хорошая вещь для проверки стратегии и ее оптимизиации.На скрине 50 контрактов,так что не сильно радуйтесь,а просто делите на 50 и получите показатели на 1 контракт.
Script make for futures on MICEX.U can change paramets of RSI,traling stop and stop loss .On a ps 50 futures USDollar-russian ruble.Use for testing and optimisation.

Vertical Horizontal Filter BacktestVertical Horizontal Filter was initiated by Adam White. It was first published
in a magazine called “Issues of Futures” in August, 1991. The Vertical Horizontal
Filter (VHF) is a very common Indicator used by traders to find out the Phase of
a Price Trend. Normally, a price trend can be in a Trending Phase or a Congestion
Phase/Choppy Movement Phase. Adam White created this particular Technical Indicator
to determine whether prices are trending in a particular direction or are they going
through a transitional period. He used it to measure the range of Futures available
in the market.
You can change long to short in the Input Settings
WARNING:
- For purpose educate only
- This script to change bars colors.

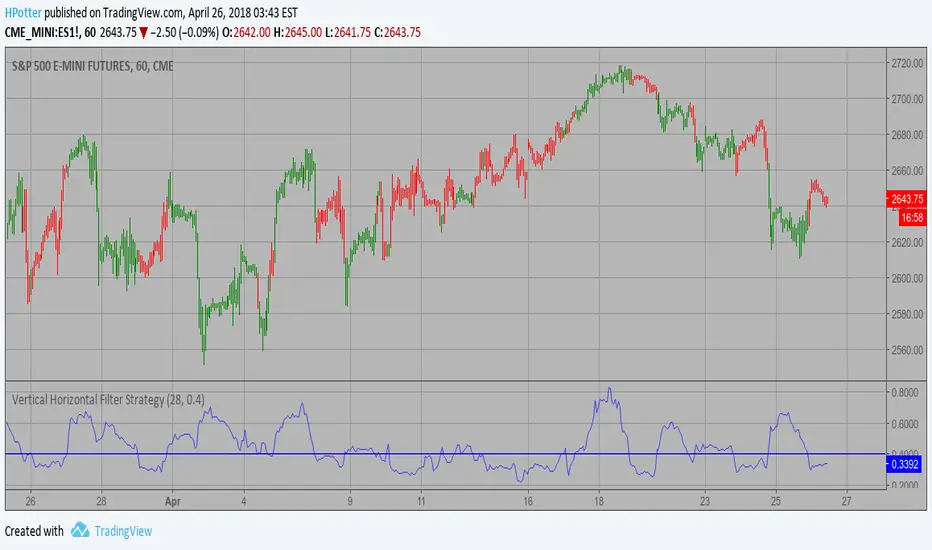
Vertical Horizontal Filter Strategy Vertical Horizontal Filter was initiated by Adam White. It was first published
in a magazine called “Issues of Futures” in August, 1991. The Vertical Horizontal
Filter (VHF) is a very common Indicator used by traders to find out the Phase of
a Price Trend. Normally, a price trend can be in a Trending Phase or a Congestion
Phase/Choppy Movement Phase. Adam White created this particular Technical Indicator
to determine whether prices are trending in a particular direction or are they going
through a transitional period. He used it to measure the range of Futures available
in the market.
WARNING:
- This script to change bars colors.