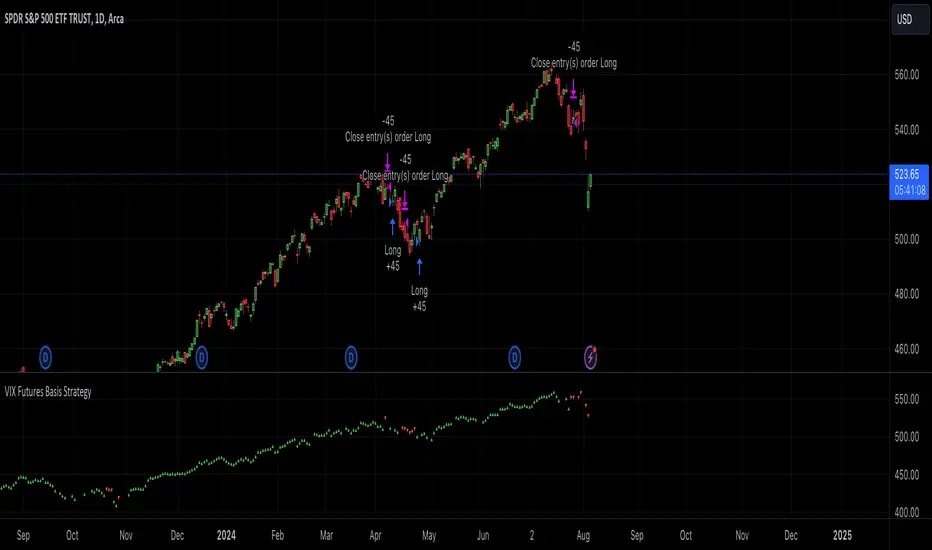
VIX Futures Basis StrategyVIX Futures Basis Strategy
The VIX Futures Basis Strategy is a trading approach that takes advantage of the unique characteristics of the VIX index and its futures market. The VIX, often referred to as the "fear index," measures market expectations of near-term volatility. This strategy focuses on how the VIX futures contracts behave in relation to the spot VIX index and seeks to capitalize on the market's contango and backwardation phases.
Key Concepts:
VIX Index and VIX Futures:
The VIX index reflects the market's expectation of volatility over the next 30 days.
VIX futures allow traders to speculate on the future value of the VIX index.
Contango and Backwardation:
Contango occurs when the futures price is higher than the spot price, often indicating that the market expects volatility to rise in the future.
Backwardation is when the futures price is lower than the spot price, suggesting that the market expects a decrease in volatility.
Basis:
The basis is the difference between the futures price and the spot price. This strategy examines the basis for two consecutive VIX futures contracts.
Strategy Overview:
The VIX Futures Basis Strategy uses the relationship between the VIX index and its futures contracts to generate trading signals:
Long Position on Contango:
When both the front month and the second month VIX futures contracts are in contango (their prices are above the spot VIX index by a specified threshold), the strategy takes a long position.
This implies an expectation that the market will move from a state of expected higher future volatility to a more stable state, allowing profits to be made as the futures prices converge toward the spot price.
Closing Position on Backwardation:
If the basis for both futures contracts indicates backwardation (their prices are below the spot VIX index by a threshold), the strategy closes any long positions.
This condition suggests that the market anticipates decreasing volatility, and closing positions helps to avoid potential losses.
Cari dalam skrip untuk "Futures"
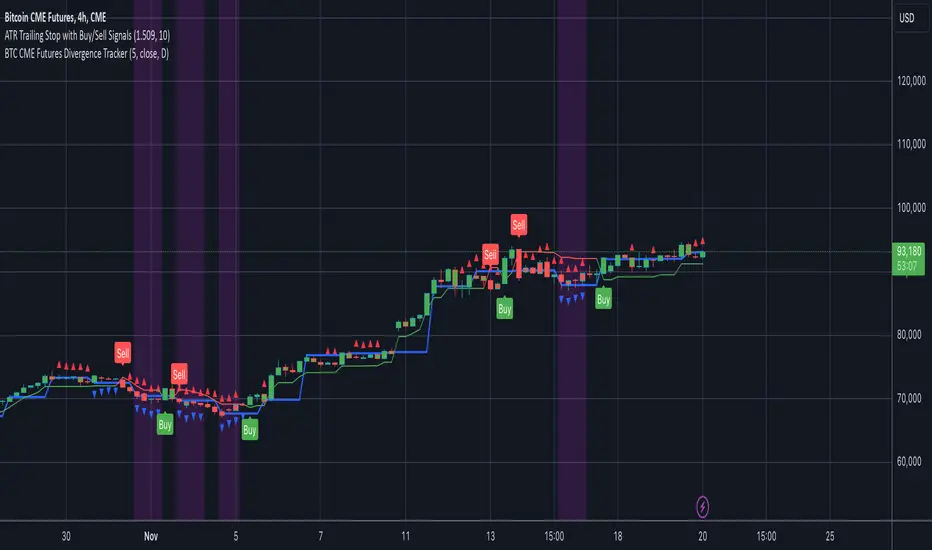
BTC CME Futures Divergence TrackerThis script tracks divergences between price action and open interest for the BTC CME Futures contract (symbol "BTC1!") using the following components:
Key Features:
1. Price Analysis: Identifies lower highs in the price over a specified lookback period. Marks these points with red upward-facing triangles above the bars.
2. Open Interest Analysis: Retrieves open interest (OI) data for the BTC CME Futures contract via request.security. Detects lower highs in open interest over the same lookback period. Highlights these points with blue downward-facing triangles below the bars.
3. Divergence Detection: A divergence is identified when both price and open interest form lower highs simultaneously. Highlights such occurrences with a purple background, indicating potential bearish sentiment or weakening momentum.
4. Alerts: If divergences are detected, an alert is triggered (if enabled), notifying the trader to take action.
5. Visualization: Open interest is plotted as a blue line in a separate pane for added context. Red and blue markers highlight significant points in price and open interest trends.
Use Cases:
- Spot Weakening Trends: Divergences between price and open interest may indicate a loss of momentum or bearish sentiment, allowing traders to preemptively adjust their strategies.
- Monitor Institutional Activity: Open interest changes reflect shifts in market participation, especially in derivative markets like CME Futures.
- Set Alerts for Key Signals: With automated alerts, traders can stay informed of potential divergence signals without constant monitoring.
Customization Options:
- Lookback Period: Adjust the number of bars used to detect lower highs.
- Timeframe: Choose the timeframe for fetching open interest data (e.g., daily, hourly).
- Alert Activation: Enable or disable alerts for divergences.
This tool combines price action with open interest dynamics to provide a robust method for identifying market trends and potential reversals in BTC CME Futures.
SessionLibrary "Session"
Helper functions for trading sessions. TradingView doesn't provide correct data when
calling some of the convenience methods like session.ismarket when you are looking at futures charts. This library corrects those mistakes by providing functions with the same names as the TradingView default properties. that reference a custom defined set of session hours for futures. It also provides a way for consumers to customize the map values by calling getSessionMap() and then overwriting (or adding) custom session definitions.
getSessionMap()
Returns a map of the futures rth & eth session hours. The map is keyed with symbol:session format (eg. ES:market or ES:overnight).
Returns: A map of futures symbols and their associated session hours.
getSessionString(session, symbol, sessionMap)
Returns a session string representing the session hours (and days) for the requested symbol (or the chart's symbol if the symbol value is not provided). If the session string is not found in the collection, it will return a blank string.
Parameters:
session (string) : A string representing the session hour being requested. One of: market (regular trading hours), overnight (extended/electronic trading hours), postmarket (after-hours), premarket
symbol (string) : The symbol to check. Optional. Defaults to chart symbol.
sessionMap (map) : The map of futures session hours. Optional. Uses default if not provided.
inSession(session, sessionMap, barsBack)
Returns true if the current symbol is currently in the session parameters defined by sessionString.
Parameters:
session (string) : A string representing the session hour being requested. One of: market (regular trading hours), overnight (extended/electronic trading hours), postmarket (after-hours), premarket
sessionMap (map) : The map of futures session hours. Optional. Uses default if not provided.
barsBack (int) : Private. Only used by futures to check islastbar. Optional. The default is 0.
ismarket(sessionMap)
Returns true if the current bar is a part of the regular trading hours (i.e. market hours), false otherwise. Works for futures (TradingView's methods do not).
Parameters:
sessionMap (map) : The map of futures session hours. Optional. Uses default if not provided.
Returns: bool
isfirstbar()
Returns true if the current bar is the first bar of the day's session, false otherwise. If extended session information is used, only returns true on the first bar of the pre-market bars. Works for futures (TradingView's methods do not).
Returns: bool
islastbar()
Returns true if the current bar is the last bar of the day's session, false otherwise. If extended session information is used, only returns true on the last bar of the post-market bars. Works for futures (TradingView's methods do not).
Returns: bool
ispremarket(sessionMap)
Returns true if the current bar is a part of the pre-market, false otherwise. On non-intraday charts always returns false. Works for futures (TradingView's methods do not).
Parameters:
sessionMap (map) : The map of futures session hours. Optional. Uses default if not provided.
Returns: bool
ispostmarket(sessionMap)
Returns true if the current bar is a part of the post-market, false otherwise. On non-intraday charts always returns false. Works for futures (TradingView's methods do not).
Parameters:
sessionMap (map) : The map of futures session hours. Optional. Uses default if not provided.
Returns: bool
isfirstbar_regular(sessionMap)
Returns true on the first regular session bar of the day, false otherwise. The result is the same whether extended session information is used or not. Works for futures (TradingView's methods do not).
Parameters:
sessionMap (map) : The map of futures session hours. Optional. Uses default if not provided.
Returns: bool
islastbar_regular(sessionMap)
Returns true on the last regular session bar of the day, false otherwise. The result is the same whether extended session information is used or not. Works for futures (TradingView's methods do not).
Parameters:
sessionMap (map) : The map of futures session hours. Optional. Uses default if not provided.
Returns: bool
isovernight(sessionMap)
Returns true if the current bar is a part of the pre-market or post-market, false otherwise. On non-intraday charts always returns false.
Parameters:
sessionMap (map) : The map of futures session hours. Optional. Uses default if not provided.
Returns: bool
getSessionHighAndLow(session, sessionMap)
Returns a tuple containing the high and low print during the specified session.
Parameters:
session (string) : The session for which to get the high & low prints. Defaults to market.
sessionMap (map) : The map of futures session hours. Optional. Uses default if not provided.
Returns: A tuple containing

Risk-On / Risk-Off Toolkit [SB1] (NQ, RTY, YM) VIXDescription:
The Risk-On / Risk-Off Toolkit is a professional-grade market context indicator designed to help traders quickly identify broad market sentiment shifts and gauge risk appetite. By combining major US equity futures (NQ, RTY, YM) with VIX dynamics, this toolkit provides clear visual signals of “Risk-On” (bullish, lower volatility environment) and “Risk-Off” (bearish, higher volatility environment) conditions. This is ideal for traders using discretionary analysis, swing strategies, intraday scalping, or portfolio positioning decisions.
My Personal Thoughts: Utilize all 3 charts to Identify which is Leading and who is lagging between the 3 (NQ, RTY, YM) Key Features:
Futures Trend Analysis:
Monitors the Nasdaq 100 (NQ), Russell 2000 (RTY), and Dow Jones (YM) futures in real-time.
Determines bullish/bearish bias based on each futures contract’s current close relative to its open.
Identifies when all three indices are moving in sync, highlighting broad market directional alignment.
VIX Confirmation:
Integrates the CBOE Volatility Index (VIX) to gauge market risk sentiment.
Confirms Risk-On conditions when VIX is falling while all three futures are bullish.
Confirms Risk-Off conditions when VIX is rising while all three futures are bearish.
Optional background shading visually highlights Risk-On (green) and Risk-Off (red) conditions for quick, intuitive assessment.
Strong Body Candle Signals:
Detects high conviction candlestick moves where the body represents at least 85% of the total range.
Confirms whether the candle closes near its extreme (top for bullish, bottom for bearish) within 15% of the range.
Plots arrows for strong bullish or bearish candles:
Green triangle-up for bullish strong candles
Red triangle-down for bearish strong candles
Provides a visual cue for intraday or swing traders to confirm trend momentum without cluttering the chart with labels.
Alert System:
Alerts can be set for Risk-On alignment: all monitored futures are bullish and VIX is falling.
Alerts can also be set for Risk-Off alignment: all monitored futures are bearish and VIX is rising.
Ensures traders never miss shifts in broad market sentiment, suitable for both intraday and end-of-day review.
Table Summary:
Provides a top-right summary table of each monitored market and VIX:
Displays Index Name and Current Bias (Bullish/Bearish/Neutral).
Highlights bullish conditions in green and bearish conditions in red.
Includes VIX status as “↓ Falling”, “↑ Rising”, or “Flat”, providing a quick visual reference of volatility trends.
Customizable Visuals:
Control the visibility of strong candle arrows.
Maintains dynamic bar coloring for strong candle moves (green for bullish, red for bearish).
How to Use the Risk-On / Risk-Off Toolkit:
Trend Confirmation: Use the alignment of NQ, RTY, and YM to determine whether the overall market environment is bullish or bearish.
Risk Sentiment Filter: Use VIX confirmation to identify if traders are in a risk-on or risk-off sentiment. This is especially useful for adjusting position sizing, hedging, or timing entries.
Momentum Validation: Strong candle arrows indicate decisive moves, providing additional confirmation for trade entries, breakouts, or trend continuation.
Alerts & Visual Cues: Set alerts to be notified whenever Risk-On or Risk-Off conditions are met, helping you act in real-time.
Quick Reference: Use the summary table for a bird’s-eye view of market alignment across indices and VIX, avoiding the need to track multiple charts simultaneously.
Why This Indicator is Unique:
Combines three major US indices with volatility confirmation to identify true macro market sentiment shifts.
Provides both visual and alert-based signals for actionable insights.
The inclusion of strong candle arrows gives intraday and swing traders a clear, low-latency cue for high-probability moves.
Perfect for multi-timeframe analysis and adaptable to both short-term and long-term strategies.
Indicator Name Justification:
The name “Risk-On / Risk-Off Toolkit ” accurately reflects the core function: identifying broad market risk appetite and sentiment alignment across key indices with volatility confirmation. It communicates instantly that the tool helps traders understand when the market is favoring risk-taking (Risk-On) versus risk-aversion (Risk-Off).

FlowSpike ES — BB • RSI • VWAP + AVWAP + News MuteThis indicator is purpose-built for E-mini S&P 500 (ES) futures traders, combining volatility bands, momentum filters, and session-anchored levels into a streamlined tool for intraday execution.
Key Features:
• ES-Tuned Presets
Automatically optimized settings for scalping (1–2m), daytrading (5m), and swing trading (15–60m) timeframes.
• Bollinger Band & RSI Signals
Entry signals trigger only at statistically significant extremes, with RSI filters to reduce false moves.
• VWAP & Anchored VWAPs
Session VWAP plus anchored VWAPs (RTH open, weekly, monthly, and custom) provide high-confidence reference levels used by professional order-flow traders.
• Volatility Filter (ATR in ticks)
Ensures signals are only shown when the ES is moving enough to offer tradable edges.
• News-Time Mute
Suppresses signals around scheduled economic releases (customizable windows in ET), helping traders avoid whipsaw conditions.
• Clean Alerts
Long/short alerts are generated only when all conditions align, with optional bar-close confirmation.
Why It’s Tailored for ES Futures:
• Designed around ES tick size (0.25) and volatility structure.
• Session settings respect RTH hours (09:30–16:00 ET), the period where most liquidity and institutional flows concentrate.
• ATR thresholds and RSI bands are pre-tuned for ES market behavior, reducing the need for manual optimization.
⸻
This is not a generic indicator—it’s a futures-focused tool created to align with the way ES trades day after day. Whether you scalp the open, manage intraday swings, or align to weekly/monthly anchored flows, FlowSpike ES gives you a clear, rules-based signal framework.

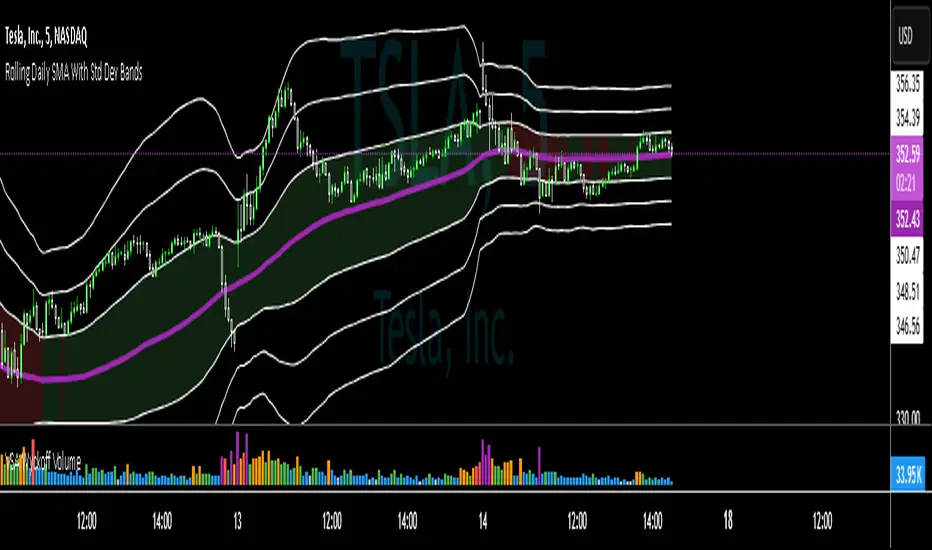
SMA with Std Dev Bands (Futures/US Stocks RTH)Rolling Daily SMA With Std Dev Bands
Upgrade your technical analysis with Rolling Daily SMA With Std Dev Bands, a powerful indicator that dynamically adjusts to your trading instrument. Whether you’re analyzing futures or US stocks during regular trading hours (RTH), this indicator seamlessly applies the correct logic to calculate a rolling daily Simple Moving Average (SMA) with customizable standard deviation bands for precise trend and volatility tracking.
Key Features:
✅ Automatic Instrument Detection– The indicator automatically recognizes whether you're trading futures or US equities and applies the correct daily lookback period based on your chart’s timeframe.
- Futures: Uses full trading day lengths (e.g., 1380 bars for 1‑minute charts).
- US Stocks (RTH): Uses regular session lengths (e.g., 390 bars for 1‑minute charts).
✅ Rolling Daily SMA (3‑pt Purple Line) – A continuously updated daily moving average, giving you an adaptive trend indicator based on market structure.
✅ Three Standard Deviation Bands (1‑pt White Lines) –
- Customizable multipliers allow you to adjust each band’s width.
- Toggle each band on or off to tailor the indicator to your strategy.
- The inner band area is color-filled: light green when the SMA is rising, light red when falling, helping you quickly identify trend direction.
✅ Works on Any Chart Timeframe – Whether you trade on 1-minute, 3-minute, 5-minute, or 15-minute charts, the indicator adjusts dynamically to provide accurate rolling daily calculations.
# How to Use:
📌 Identify Trends & Volatility Zones – The rolling daily SMA acts as a dynamic trend guide, while the standard deviation bands help spot potential overbought/oversold conditions.
📌 Customize for Precision – Adjust band multipliers and toggle each band on/off to match your trading style.
📌 Trade Smarter – The filled inner band offers instant visual feedback on market momentum, while the outer bands highlight potential breakout zones.
🔹 This is the perfect tool for traders looking to combine trend-following with volatility analysis in an easy-to-use, adaptive indicator.
🚀 Add Rolling Daily SMA With Std Dev Bands to your chart today and enhance your market insights!
---
*Disclaimer: This indicator is for informational and educational purposes only and should not be considered financial advice. Always use proper risk management and conduct your own research before trading.*
Crude Oil: Backwardation Vs ContangoCrude Oil, CL
Plots Futures Curve: Futures contract prices over the next 3.5 years; to easily visualize Backwardation Vs Contango(carrying charge) markets.
Carrying charge (contract prices increasing into the future) = normal, representing the costs of carrying/storage of a commodity. When this is flipped to Backwardation(As the above; contract prices decreasing into the future): it's a bullish sign: Buyers want this commodity, and they want it NOW.
Note: indicator does not map to time axis in the same way as price; it simply plots the progression of contract months out into the future; left to right; so timeframe DOESN'T MATTER for this plot
TO UPDATE (every year or so): in REQUEST CONTRACTS section, delete old contracts (top) and add new ones (bottom). Then in PLOTTING section, Delete old contract labels (bottom); add new contract labels (top); adjust the X in 'bar_index-(X+_historical)' numbers accordingly
This is one of several similar Futures Curve indicators: Meats | Metals | Grains | VIX | Crude Oil
If you want to build from this; to work on other commodities; be aware that Tradingview limits the number of contract calls to 40 (hence the multiple indicators)
Tips:
-Right click and reset chart if you can't see the plot; or if you have trouble with the scaling.
-Right click and add to new scale if you prefer this not to overlay directly on price. Or move to new pane below.
-If this takes too long to load (due to so many security calls); comment out the more distant future half of the contracts; and their respective labels. Or comment out every other contract and every other label if you prefer.
--Added historical input: input days back in time; to see the historical shape of the Futures curve via selecting 'days back' snapshot
updated 20th June 2022
© twingall

LibraryCOT█ OVERVIEW
This library is a Pine programmer's tool that provides functions to access Commitment of Traders (COT) data for futures. Four of our scripts use it:
• Commitment of Traders: Legacy Metrics
• Commitment of Traders: Disaggregated Metrics
• Commitment of Traders: Financial Metrics
• Commitment of Traders: Total
If you do not program in Pine and want to use COT data, please see the indicators linked above.
█ CONCEPTS
Commitment of Traders (COT) data is tallied by the Commodity Futures Trading Commission (CFTC) , a US federal agency that oversees the trading of derivative markets such as futures in the US. It is weekly data that provides traders with information about open interest for an asset. The CFTC oversees derivative markets traded on different exchanges, so COT data is available for assets that can be traded on CBOT, CME, NYMEX, COMEX, and ICEUS.
Accessing COT data from a Pine script requires the generation of a ticker ID string for use with request.security() . The ticker string must be encoded in a special format that includes both CFTC and TradingView-specific content. The format of the ticker IDs is somewhat complex; this library's functions make their generation easier. Note that if you know the COT ticker ID string for specific data, you can enter it from the chart's "Symbol Search" dialog box.
A ticker for COT data in Pine has the following structure:
COT:__<_metricDirection><_metricType>
where an underscore prefixing a component name inside <> is only included if the component is not a null string, and:
Is a digit representing the type of the COT report the data comes from: "" for legacy COT data, "2" for disaggregated data and "3" for financial data.
Is a six digit code that represents a commodity. Example: wheat futures (root "ZW") have the code "001602".
Is either "F" if the report data should exclude Options data, or "FO" if such data is included.
Is the TradingView code of the metric. This library's `metricNameAndDirectionToTicker()` function creates both
the and components of a COT ticker from the metric names and directions listed in the above chart.
The different metrics are explained in the CFTC's Explanatory Notes .
Is the direction of the metric: "Long", "Short", "Spreading" or "No direction".
Not all directions are applicable to all metrics. The valid ones are listed next to each metric in the above chart.
Is the type of the metric, possible values are "All", "Old" and "Other".
The difference between the types is explained in the "Old and Other Futures" section of the CFTC's Explanatory Notes .
As an example, the Legacy report Open Interest data for ZW futures (options included) in the old standard has the ticker "COT:001602_FO_OI_OLD". The same data using the current standard without futures has the ticker "COT:001602_F_OI".
█ USING THE LIBRARY
The first functions in the library are helper functions that generate components of a COT ticker ID. The last function, `COTTickerid()`, is the one that generates the full ticker ID string by calling some of the helper functions. We use it like this in our example:
exampleTicker = COTTickerid(
COTType = "Legacy",
CFTCCode = convertRootToCOTCode("Auto"),
includeOptions = false,
metricName = "Open Interest",
metricDirection = "No direction",
metricType = "All")
This library's chart displays the valid values for the `metricName` and `metricDirection` arguments. They vary for each of the three types of COT data (the `COTType` argument). The chart also displays the COT ticker ID string in the `exampleTicker` variable.
Look first. Then leap.
The library's functions are:
rootToCFTCCode(root)
Accepts a futures root and returns the relevant CFTC code.
Parameters:
root : Root prefix of the future's symbol, e.g. "ZC" for "ZC1!"" or "ZCU2021".
Returns: The part of a COT ticker corresponding to `root`, or "" if no CFTC code exists for the `root`.
currencyToCFTCCode(curr)
Converts a currency string to its corresponding CFTC code.
Parameters:
curr : Currency code, e.g., "USD" for US Dollar.
Returns: The corresponding to the currency, if one exists.
optionsToTicker(includeOptions)
Returns the part of a COT ticker using the `includeOptions` value supplied, which determines whether options data is to be included.
Parameters:
includeOptions : A "bool" value: 'true' if the symbol should include options and 'false' otherwise.
Returns: The part of a COT ticker: "FO" for data that includes options and "F" for data that doesn't.
metricNameAndDirectionToTicker(metricName, metricDirection)
Returns a string corresponding to a metric name and direction, which is one component required to build a valid COT ticker ID.
Parameters:
metricName : One of the metric names listed in this library's chart. Invalid values will cause a runtime error.
metricDirection : Metric direction. Possible values are: "Long", "Short", "Spreading", and "No direction".
Valid values vary with metrics. Invalid values will cause a runtime error.
Returns: The part of a COT ticker ID string, e.g., "OI_OLD" for "Open Interest" and "No direction",
or "TC_L" for "Traders Commercial" and "Long".
typeToTicker(metricType)
Converts a metric type into one component required to build a valid COT ticker ID.
See the "Old and Other Futures" section of the CFTC's Explanatory Notes for details on types.
Parameters:
metricType : Metric type. Accepted values are: "All", "Old", "Other".
Returns: The part of a COT ticker.
convertRootToCOTCode(mode, convertToCOT)
Depending on the `mode`, returns a CFTC code using the chart's symbol or its currency information when `convertToCOT = true`.
Otherwise, returns the symbol's root or currency information. If no COT data exists, a runtime error is generated.
Parameters:
mode : A string determining how the function will work. Valid values are:
"Root": the function extracts the futures symbol root (e.g. "ES" in "ESH2020") and looks for its CFTC code.
"Base currency": the function extracts the first currency in a pair (e.g. "EUR" in "EURUSD") and looks for its CFTC code.
"Currency": the function extracts the quote currency ("JPY" for "TSE:9984" or "USDJPY") and looks for its CFTC code.
"Auto": the function tries the first three modes (Root -> Base Currency -> Currency) until a match is found.
convertToCOT : "bool" value that, when `true`, causes the function to return a CFTC code.
Otherwise, the root or currency information is returned. Optional. The default is `true`.
Returns: If `convertToCOT` is `true`, the part of a COT ticker ID string.
If `convertToCOT` is `false`, the root or currency extracted from the current symbol.
COTTickerid(COTType, CTFCCode, includeOptions, metricName, metricDirection, metricType)
Returns a valid TradingView ticker for the COT symbol with specified parameters.
Parameters:
COTType : A string with the type of the report requested with the ticker, one of the following: "Legacy", "Disaggregated", "Financial".
CTFCCode : The for the asset, e.g., wheat futures (root "ZW") have the code "001602".
includeOptions : A boolean value. 'true' if the symbol should include options and 'false' otherwise.
metricName : One of the metric names listed in this library's chart.
metricDirection : Direction of the metric, one of the following: "Long", "Short", "Spreading", "No direction".
metricType : Type of the metric. Possible values: "All", "Old", and "Other".
Returns: A ticker ID string usable with `request.security()` to fetch the specified Commitment of Traders data.
█ AVAILABLE METRICS
Different COT types provide different metrics. The table of all metrics available for each of the types can be found below.
+------------------------------+------------------------+
| Legacy (COT) Metric Names | Directions |
+------------------------------+------------------------+
| Open Interest | No direction |
| Noncommercial Positions | Long, Short, Spreading |
| Commercial Positions | Long, Short |
| Total Reportable Positions | Long, Short |
| Nonreportable Positions | Long, Short |
| Traders Total | No direction |
| Traders Noncommercial | Long, Short, Spreading |
| Traders Commercial | Long, Short |
| Traders Total Reportable | Long, Short |
| Concentration Gross LT 4 TDR | Long, Short |
| Concentration Gross LT 8 TDR | Long, Short |
| Concentration Net LT 4 TDR | Long, Short |
| Concentration Net LT 8 TDR | Long, Short |
+------------------------------+------------------------+
+-----------------------------------+------------------------+
| Disaggregated (COT2) Metric Names | Directions |
+-----------------------------------+------------------------+
| Open Interest | No Direction |
| Producer Merchant Positions | Long, Short |
| Swap Positions | Long, Short, Spreading |
| Managed Money Positions | Long, Short, Spreading |
| Other Reportable Positions | Long, Short, Spreading |
| Total Reportable Positions | Long, Short |
| Nonreportable Positions | Long, Short |
| Traders Total | No Direction |
| Traders Producer Merchant | Long, Short |
| Traders Swap | Long, Short, Spreading |
| Traders Managed Money | Long, Short, Spreading |
| Traders Other Reportable | Long, Short, Spreading |
| Traders Total Reportable | Long, Short |
| Concentration Gross LE 4 TDR | Long, Short |
| Concentration Gross LE 8 TDR | Long, Short |
| Concentration Net LE 4 TDR | Long, Short |
| Concentration Net LE 8 TDR | Long, Short |
+-----------------------------------+------------------------+
+-------------------------------+------------------------+
| Financial (COT3) Metric Names | Directions |
+-------------------------------+------------------------+
| Open Interest | No Direction |
| Dealer Positions | Long, Short, Spreading |
| Asset Manager Positions | Long, Short, Spreading |
| Leveraged Funds Positions | Long, Short, Spreading |
| Other Reportable Positions | Long, Short, Spreading |
| Total Reportable Positions | Long, Short |
| Nonreportable Positions | Long, Short |
| Traders Total | No Direction |
| Traders Dealer | Long, Short, Spreading |
| Traders Asset Manager | Long, Short, Spreading |
| Traders Leveraged Funds | Long, Short, Spreading |
| Traders Other Reportable | Long, Short, Spreading |
| Traders Total Reportable | Long, Short |
| Concentration Gross LE 4 TDR | Long, Short |
| Concentration Gross LE 8 TDR | Long, Short |
| Concentration Net LE 4 TDR | Long, Short |
| Concentration Net LE 8 TDR | Long, Short |
+-------------------------------+------------------------+

Daily Floor PivotsDaily Floor Pivots with Comprehensive Statistical Analysis
Overview
This indicator combines traditional floor pivot levels with golden zone analysis and comprehensive statistical insights derived from 15 years of historical NQ futures data. While the pivot levels and golden zones can be applied to any instrument, the statistical tables are specifically calibrated for NQ/MNQ futures based on analysis of 2,482 NY Regular Trading Hours (RTH) sessions from 2010-2025.
What Makes This Indicator Original
Unlike standard pivot indicators that merely plot levels, this tool provides:
Enhanced Golden Zone Analysis: Calculates not only the main golden zone (0.5-0.618 retracement of previous day's range) but also golden zones between each pivot pair (PP-R1, R1-R2, R2-R3, PP-S1, S1-S2, S2-S3)
Data-Driven Statistical Tables: Two comprehensive tables displaying real statistics from 2,482 trading days of NQ analysis, including:
Probability-based touch rates and continuation patterns
Context-aware statistics based on opening position
Gap analysis and behavioral patterns
First touch dynamics and time-to-reach averages
Granular Customization: Every visual element and statistical section can be independently toggled, allowing traders to focus on what matters most to their strategy
How It Works
Pivot Calculation Methodology
The indicator uses the standard floor pivot formula based on the previous day's price action:
Pivot Point (PP) = (Previous High + Previous Low + Previous Close) / 3
Resistance Levels: R1, R2, R3 calculated from PP and previous range
Support Levels: S1, S2, S3 calculated from PP and previous range
Golden Zone Calculations
Main Golden Zone: The 0.5 to 0.618 Fibonacci retracement of the previous day's range, representing a key reversal and continuation area.
Inter-Pivot Golden Zones: For each adjacent pivot pair, golden zones are calculated as:
Resistance pairs (PP→R1, R1→R2, R2→R3): 0.5-0.618 range from the lower pivot
Support pairs (PP→S1, S1→S2, S2→S3): 0.382-0.5 range from the upper pivot
These zones represent high-probability areas where price tends to react when moving between pivot levels.
Statistical Analysis Source
All statistics displayed in the tables are derived from external Python analysis of 15 years of 1-minute NQ futures data (2010-2025), specifically analyzing NY RTH sessions (9:30 AM - 4:00 PM EST). The analysis tracked:
2,482 complete trading days
Intraday pivot touches and closes
Opening position context
Gap behavior relative to previous day
Time-of-day patterns
Sequential pivot interactions
IMPORTANT: While the pivot levels and golden zones are universally applicable mathematical calculations that work on any instrument, the statistical percentages shown in the tables are specific to NQ/MNQ behavior only. Do not assume these statistics transfer to other instruments.
Configuration Guide
Basic Settings
Number of Periods Back (1-20, default: 3)
Controls how many historical pivot periods are displayed on the chart
Setting to 1 shows only current day's pivots
Higher values show more historical context
Labels Position (Left/Right)
Choose whether pivot labels appear on the left or right side of each level line
Line Width (1-5, default: 2)
Adjust the thickness of all pivot and golden zone lines
Golden Zone Customization
Show Daily Golden Zone (0.5-0.618)
Toggle the main golden zone on/off
When enabled, displays a shaded box between the 0.5 and 0.618 retracement levels
Line Color / Fill Color
Customize the appearance of the main golden zone
Fill color determines the shaded box transparency
Show Labels / Show Prices
Control whether "0.5" and "0.618" labels appear
Control whether price values are displayed on labels
Inter-Pivot Golden Zones
Six toggle options allow you to show/hide individual golden zones:
PP to R1 / PP to S1: Most frequently touched (60.8% / 50.9%)
R1 to R2 / S1 to S2: Moderately touched (25.2% / 24.0%)
R2 to R3 / S2 to S3: Rarely touched (9.4% / 10.5%)
Line Color / Fill Color: Customize appearance of all inter-pivot zones
Show Labels / Show Prices: Control labeling for inter-pivot zones
Usage Tip: Disable outer zones (R2-R3, S2-S3) on lower volatility days to reduce chart clutter.
Pivot Display
Show Support/Resistance Levels: Master toggle for all pivot lines
Show SR Labels / Show SR Prices: Control labeling on pivot levels
Individual level toggles and colors:
PP (Pivot Point): The central reference point
R1/S1: Primary resistance/support (38.9% / 35.4% touch rate)
R2/S2: Secondary levels (15.6% / 16.1% touch rate)
R3/S3: Extended levels (5.1% / 7.3% touch rate)
Color Customization: Each level's color can be independently set
Overall Statistics Table
Show Overall Statistics Table: Master toggle
Table Size: tiny/small/normal/large/huge/auto
Table Position: Top Left/Top Right/Bottom Left/Bottom Right
Section Toggles (enable/disable individual sections):
Current Session Info
Touch & Close Rates
Continue & Reject Rates
First Touch Statistics
Golden Zone Statistics
Daily Close Distribution
Highest/Lowest Levels Reached
Context Statistics Table
Show Context Statistics Table: Master toggle
Table Size: tiny/small/normal/large/huge/auto
Table Position: Top Left/Top Right/Bottom Left/Bottom Right
Section Toggles:
Current Opening Zone
Opening Zone Statistics
Previous Day Gap Context
Understanding the Statistical Tables
TABLE 1: OVERALL STATISTICS
This table presents universal statistics from 2,482 days of NQ analysis.
Current Session Info
Displays real-time context for the active session:
Open: Where the current RTH session opened relative to pivots (e.g., "GZ_TO_R1" means opened between the PP-R1 golden zone and R1)
Now: Current price position relative to pivots
Direction: Bull (close > open), Bear (close < open), or Flat
How to use: This section helps you quickly understand where price opened and where it currently is, providing immediate context for the day's action.
Touch & Close Rates
Shows probability that each pivot level will be reached during RTH:
Touch %: Percentage of days where price touched this level at any point
Example: R1 touched 38.9% of days, PP touched 57.5% of days
Close %: Percentage of days where price closed beyond this level
Example: R1 close beyond happened 39.8% of days
How to interpret:
Higher touch rates indicate more reliable levels for intraday targeting
The difference between touch and close rates shows rejection frequency
PP has the highest touch rate (57.5%), making it the most magnetic level
Outer levels (R3/S3) have low touch rates (5.1%/7.3%), indicating rare extension days
Continue & Reject Rates
When a level is touched, these statistics show what happens next:
Continue %: Probability price continues through the level
Example: When PP is touched, price continues 88.1% of the time
Reject %: Probability price rejects from the level and reverses
Example: When R1 is touched, price rejects 50.9% of the time
How to interpret:
PP shows highest continuation (88.1%), confirming it's a poor reversal level
Support levels (S1/S2/S3) show strong rejection rates (62.5%/60.7%/56.1%), making them better reversal candidates
Continuation rates above 80% suggest the level is better as a target than an entry
First Touch Statistics
Analyzes which pivot is typically touched first during RTH:
1st Touch %: Probability this level is the first pivot encountered
PP is first touched 37.1% of days (most common)
R1 is first touched 26.0% of days
S1 is first touched 10.9% of days
1st→Continue: If this level is touched first, probability of continuation
S1-S3 show 95.6%-100% continuation when touched first
This means when price reaches support first, it usually continues lower
Avg Time: Minutes after 9:30 AM EST before first touch
PP: 1h 6m average
S3: 19m average (when bearish)
R3: 3h 19m average (when bullish)
How to interpret:
Opening away from PP means higher probability of reaching extremes (R2/R3 or S2/S3)
When support is touched first (within first 2 hours), expect continuation lower
Late-day first touches (after 2 PM) often indicate strong trending days
Multi-Touch: Shows how often levels are tested multiple times (92.8%-95.0% across all levels)
Golden Zone Statistics
Main GZ: 58.5% touch rate for the 0.5-0.618 zone
Inter-Pivot zones:
PP-R1: 60.8% (highest probability)
PP-S1: 50.9%
R1-R2: 25.2%
S1-S2: 24.0%
R2-R3: 9.4%
S2-S3: 10.5%
How to interpret:
Main GZ is touched more often than any individual resistance level
PP-R1 and PP-S1 golden zones are high-probability mean reversion areas
Outer golden zones (R2-R3, S2-S3) are only relevant on high volatility days
Daily Close Distribution
Shows where RTH sessions typically close:
Above/Below PP: 58.5% close above, 41.5% below (slight bullish bias)
Above R1: 24.5% of days
Below S1: 18.7% of days
In GZ: Only 6.3% close in the golden zone (typically transits through it)
How to interpret:
Most days (58.5%) have bullish bias (close above PP)
Less than 25% of days are strong trending days (beyond R1/S1)
Golden zone is an action area, not a resting area
Highest/Lowest Levels Reached
Distribution of the most extreme level reached:
High Resist: R1 (26.0%), R2 (10.8%), R3 (5.1%)
Low Support: S1 (35.4%), S2 (1.9%), S3 (0.6%)
How to interpret:
Most days don't reach beyond R1 or S1
R3/S3 are rare events (5.1%/0.6%), indicating major trending days
S1 is reached as lowest level more often than R1 as highest, suggesting downside is more frequently tested
TABLE 2: CONTEXT STATISTICS
This table provides conditional statistics based on how the session opened.
Current Opening Zone
Displays which of 13 possible zones the RTH session opened in:
ABOVE_R3, R2_TO_R3, R1_TO_R2, GZ_TO_R1, IN_GZ, PP_TO_GZ, AT_PP, GZ_TO_PP, S1_TO_GZ, S2_TO_S1, S3_TO_S2, BELOW_S3
How to use: This immediately tells you the market structure and what type of day to expect.
Opening Zone Statistics
Detailed statistics for the current opening zone (only shows for 6 major zones):
For each zone, you see:
Occurs: How often this opening scenario happens
GZ_TO_R1: 38.4% (most common)
AT_PP: 12.8%
S1_TO_GZ: 24.2%
R1_TO_R2: 9.4%
S2_TO_S1: 6.3%
IN_GZ: 3.8%
Bull/Bear %: Close direction probability
Example: GZ_TO_R1 is perfectly balanced (50.0% bull / 49.6% bear)
R1_TO_R2 is bullish (58.1% bull / 41.0% bear)
Levels Hit: Probability of reaching each pivot level from this opening
Helps identify high-probability targets
Example: From GZ_TO_R1, PP is hit 52.9%, R1 is hit 49.0%, S1 is hit 21.6%
How to interpret:
GZ_TO_R1 (most common): Balanced day, watch PP and GZ for direction clues
AT_PP: Slight bullish bias (56.9%), high chance of touching both PP (92.8%) and GZ (90.3%)
R1_TO_R2: Bullish bias (58.1%), expect continuation to R2 (58.1% chance)
S2_TO_S1: Bullish reversal setup (59.9%), very high chance of S1 touch (82.8%)
IN_GZ: Rare opening (3.8%), bullish bias, virtually guaranteed GZ touch (100%)
Previous Day Gap Context
Shows current gap scenario and typical behavior:
Three scenarios:
GAP UP: Opened Above Yesterday's High (20.5% of days)
R1 Touch: 65.9% (high probability)
R2 Touch: 42.1%
S1 Touch: 15.0% (low probability)
Bias: Bullish continuation
GAP DOWN: Opened Below Yesterday's Low (11.3% of days)
S1 Touch: 71.5% (high probability)
S2 Touch: 55.2%
R1 Touch: 12.1% (low probability)
Bias: Bearish continuation
NO GAP: Opened Within Yesterday's Range (68.2% of days)
PP Touch: 69.5%
GZ Touch: 71.7%
R1 Touch: 35.2%
Bias: Balanced (watch for direction at PP/GZ)
How to interpret:
Gap days (up or down) tend to continue in the gap direction
When gapping, fade trades are low probability (15.0% and 12.1%)
Most days (68.2%) open within previous range, making PP and GZ critical decision zones
The "bias" line provides clear directional guidance for trade selection
Practical Application Examples
Example 1: Standard Day Setup
Scenario: RTH opens at 20,450
PP: 20,400
GZ: 20,390-20,395
R1: 20,425
Previous day high: 20,460
What the tables tell you:
Opening Zone: "GZ_TO_R1" (38.4% occurrence)
Gap Context: "NO GAP" (68.2% occurrence)
Expected behavior: Balanced (50/50 bull/bear)
High probability: PP touch (52.9%), GZ touch (56.8%)
Moderate probability: R1 touch (49.0%), S1 touch (21.6%)
Trade plan:
Wait for price to reach PP (52.9% chance) or GZ (56.8% chance)
Look for directional confirmation at these levels
First target R1 if bullish, S1 if bearish
Avoid assuming direction without confirmation (perfectly balanced opening)
Example 2: Gap Up Day
Scenario: RTH opens at 20,510
Previous day high: 20,460
R1: 20,425
R2: 20,475
What the tables tell you:
Gap Context: "GAP UP" (20.5% occurrence)
R1 touch: 65.9% probability
R2 touch: 42.1% probability
S1 touch: Only 15.0% probability
Bias: Bullish continuation
Trade plan:
Favor long setups
Target R1 first (65.9% chance), then R2 (42.1%)
If R1 breaks, R2 becomes likely target
Shorting is low probability (only 15.0% reach S1)
Example 3: Opening in Golden Zone
Scenario: RTH opens at 20,393
PP: 20,400
GZ: 20,390-20,395
What the tables tell you:
Opening Zone: "IN_GZ" (rare, only 3.8% occurrence)
Bullish bias: 58.1%
GZ touch: 100% (guaranteed - already there)
PP touch: 75.3%
R1 touch: 41.9%
Trade plan:
Expect price to test PP (75.3% chance)
Slight bullish bias suggests long setups better than shorts
Watch how price reacts at PP - likely to continue to R1 (41.9%)
This is an uncommon opening, suggesting potential for larger moves
Best Practices
Match Your Instrument: Remember, statistics are NQ-specific. If trading other instruments, use the levels but disregard the statistical percentages.
Combine with Price Action: Use the statistics for probability context, not as standalone signals. Always confirm with price action, volume, and your trading methodology.
Adapt Table Display: Don't display all sections all the time. Toggle based on your trading phase:
Pre-market: Focus on "Gap Context" to understand the setup
Market open: Watch "Opening Zone Statistics" for directional bias
Intraday: Monitor "Current Session Info" for position tracking
Understand Context: A 60% touch rate doesn't mean guaranteed—it means 40% of days don't touch. Use these probabilities to size positions and manage expectations.
Inter-Pivot Golden Zones: These are most useful when price is already in motion toward a level. For example, if price breaks above PP heading to R1, the PP-R1 golden zone (60.8% touch rate) becomes a high-probability pullback area.
Time Awareness: The "Avg Time" statistics help you understand urgency. If it's 10:30 AM and S1 hasn't been touched (average is 55 minutes), the window for bearish moves is closing.
Technical Notes
Time Zone: All times referenced are NY/EST
Session Definition: RTH is 9:30 AM - 4:00 PM EST
Calculation Period: Pivots update daily based on previous 24-hour period (18:00 previous day to 17:00 current day)
Data Source: Statistics derived from 12 years of NQ 1-minute futures data (2013-2025)
Sample Size: 2,482 complete RTH trading sessions
Disclaimer
This indicator provides statistical probabilities based on historical NQ futures data. Past performance does not guarantee future results. The statistical tables are educational tools and should not be the sole basis for trading decisions. Always:
Use proper risk management
Combine with your own analysis
Understand that probabilities are not certainties
Remember that statistics are instrument-specific (NQ/MNQ only)
Credits
Statistical analysis performed using Python analysis of 12 years of historical NQ futures data. All pivot and golden zone calculations use standard mathematical formulas applicable to any instrument.

4H HOD/LOD Checkpoint Analysis4H HOD/LOD Checkpoint Analysis - Detailed User Guide
OVERVIEW
This indicator is a data-driven probability framework for NQ Futures traders that predicts High-of-Day (HOD) and Low-of-Day (LOD) placement based on statistical analysis of 3,136+ trading days (2013-2025). Unlike traditional indicators that rely on technical signals, this tool uses checkpoint-based state analysis with zero forward-looking bias to provide real-time probabilities of whether the daily range is complete.
⚠️ IMPORTANT: This indicator is specifically designed for NQ FUTURES ONLY. All probabilities, patterns, and statistics were derived from a 10+ year historical dataset of NQ 1-minute bars. Using this on other instruments will produce inaccurate results.
CORE CONCEPT: CHECKPOINT METHODOLOGY
What is a Checkpoint?
A checkpoint occurs when a 4-hour candle closes. At this moment, the indicator "locks" the current market state and calculates probabilities for the remainder of the trading day. The key innovation is that state never changes after locking - probabilities remain constant throughout the session until the next checkpoint.
The Six 4-Hour Candles (EST):
6PM (18:00-22:00) - Evening/Globex open
10PM (22:00-02:00) - Asia session
2AM (02:00-06:00) - Early London
6AM (06:00-10:00) - Late London + NY Open
10AM (10:00-14:00) - NY Morning
2PM (14:00-17:00) - NY Afternoon (3 hours only)
Five Checkpoints:
10PM Checkpoint - After 6PM closes
2AM Checkpoint - After 10PM closes
6AM Checkpoint - After 2AM closes
10AM Checkpoint - After 6AM closes (most critical)
2PM Checkpoint - After 10AM closes (highest conviction fade signals)
HOW IT WORKS: THE THREE-FACTOR STATE SYSTEM
At each checkpoint, the indicator evaluates three critical factors to determine probability:
1. ELIMINATIONS (Quantity)
An "elimination" occurs when a candle trades beyond a previous candle's high or low, effectively removing that candle from contention for HOD/LOD.
Example at 10AM Checkpoint:
6PM high = 18,000
10PM high = 18,050 (eliminates 6PM high)
2AM high = 18,100 (eliminates 10PM high)
6AM high = 18,075 (does NOT eliminate 2AM high)
Result: 2 eliminations
The number of eliminations indicates trend strength:
0 eliminations = Range-bound, high probability extremes already set
1-2 eliminations = Moderate trend
3-4 eliminations = Strong trend day, range likely to extend
2. STRUCTURE (Pattern Type)
The indicator distinguishes between two elimination patterns:
Sequential: Eliminations occur in order (6pm → 10pm → 2am → 6am → 10am)
Indicates smooth, consistent trend
Example: 10pm eliminates 6pm, then 2am eliminates 10pm (sequential)
Skip: Eliminations skip candles
Indicates choppy/reversal behavior
Example: 2am eliminates 6pm but NOT 10pm (skip pattern)
Why it matters: Skip patterns show 2X probability differences compared to sequential patterns. At 10AM checkpoint with 2 eliminations, skip pattern shows 64% participation rate vs 36% for sequential pattern with previous survived.
3. PREVIOUS CANDLE STATUS
Did the immediately prior candle get eliminated?
Eliminated: Previous candle's high/low was taken out
Indicates relentless trend
Higher probability of continuation
Survived: Previous candle's high/low still intact
Indicates trend pause
Higher probability of mean reversion or range completion
Critical insight: High and low are tracked separately. At 2AM checkpoint, 10PM might have eliminated 6PM high (relentless uptrend) but NOT eliminated 6PM low (low survived). This creates different probabilities for HOD vs LOD.
VISUAL ELEMENTS
4-Hour Candle Boxes
Each 4H candle is displayed as a colored box showing its range:
Gray = 6PM (evening)
Blue = 10PM (Asia)
Purple = 2AM (early London)
Orange = 6AM (London + NY Open) - THE CURVE SESSION
Teal = 10AM (NY morning) - THE MONEY SESSION
Red = 2PM (NY afternoon) - THE FADE SESSION
HOD/LOD Lines
Black horizontal lines extend from current HOD/LOD with labels showing:
Which candle set the extreme
Current price level
THE CHECKPOINT TABLE EXPLAINED
Table Header:
Shows current checkpoint (e.g., "🎯 10AM CHECKPOINT") or "⏳ PRE-CHECKPOINT" if between checkpoints.
Main Metrics (Side-by-Side Comparison):
The table displays HOD and LOD separately in two columns because they can have different patterns:
METRIC
HODLOD Eliminations
Number of candles eliminated so far for highs
Number of candles eliminated so far for lows
Structure
Sequential or Skip pattern for highs
Sequential or Skip pattern for lows
Prev Candle
Was previous candle's high eliminated or did it survive?
Was previous candle's low eliminated or did it survive?
Pattern
Combined interpretation: Relentless/Paused/Skip/Early
Combined interpretation: Relentless/Paused/Skip/Early
Color Coding:
Structure Row:
White = Sequential (smooth trend)
Orange = Skip (choppy/reversal)
Previous Candle Row:
Red = Eliminated (relentless trend continuing)
Blue = Survived (trend paused)
Pattern Row:
Red = Relentless (previous eliminated + sequential = strong trend)
Blue = Paused (previous survived + sequential = trend pause)
Orange = Skip/Chop (skip pattern = reversal likely)
Gray = Early (0-1 eliminations, too early to tell)
Probability Section:
Prob Already In: Percentage chance that HOD/LOD has already been set
Color coding:
Green (>75%) = High confidence extreme is in, FADE
Yellow (45-75%) = Moderate confidence
Red (<45%) = Low confidence extreme is in, CONTINUATION likely
Sample Size: Shows how many historical occurrences match this exact state (n=XXX)
Larger samples = higher confidence
Most common states have n=500-2,000+
Current: Which candle currently holds HOD/LOD
Pattern Guide Section:
Appears when you have 2+ eliminations. Provides interpretation:
📈 Paused: Trend has paused, 2pm more likely to set extreme
📈 Relentless: Breaking higher/lower, continuation expected
📈 Skip/Chop: Choppy pattern, next session likely
Same for lows with 📉 symbol.
PRACTICAL TRADING EXAMPLES
Example 1: High Conviction Fade Setup
State at 10AM Checkpoint:
Eliminations: 0 (both HOD/LOD)
Structure: None (no eliminations yet)
Prev Candle: Survived
Table shows:
HOD Prob Already In: 68.9% (n=582)
LOD Prob Already In: 73.6% (n=785)
Interpretation: Range is likely complete. Fade extremes. With 0 eliminations and 70%+ probability, this is a high-conviction mean reversion signal.
Example 2: Strong Continuation Signal
State at 10AM Checkpoint:
Eliminations: 3 (both HOD/LOD)
Structure: Sequential
Prev Candle: Eliminated (relentless)
Table shows:
HOD Prob Already In: 29.8% (n=1,758)
LOD Prob Already In: 34.6% (n=1,451)
Pattern: 📈 Relentless / 📉 Relentless
Interpretation: Strong trend day. Only 30-35% chance range is complete. Look for breakouts in direction of trend. 10AM and 2PM likely to extend range.
Example 3: Pattern Structure Edge
State at 10AM Checkpoint:
Eliminations: 2 (HOD)
Structure: Skip (orange background)
Prev Candle: Eliminated vs Alternative State:
Eliminations: 2 (HOD)
Structure: Sequential
Prev Candle: Survived
Result: Skip pattern shows 64% chance 10AM participates vs 36% for sequential+survived. Skip pattern = 2X more likely to see 10AM high. This structural edge is unique to this indicator.
Example 4: Different HOD vs LOD Patterns
State at 10AM Checkpoint:
HOD: 2 eliminations, Sequential, Previous Eliminated (Relentless) = 46.7% in
LOD: 2 eliminations, Skip, Previous Eliminated (Choppy) = 48.4% in
Interpretation: Highs show relentless uptrend but lows show choppy behavior. This divergence suggests potential for upside continuation but with volatility. Not a clean trend day.
KEY CHECKPOINT STATISTICS (DERIVED FROM 10-YEAR DATASET)
10PM Checkpoint (After 6PM):
Very early in day
13.5% HOD in, 21.3% LOD in
Most likely outcome: Range extends into 6AM/10AM
2AM Checkpoint (After 10PM):
Still early
With 0 elims: 22-31% in (balanced)
With 1 elim: 8-12% in (strong trend signal)
6AM Checkpoint (After 2AM) - Critical Decision Point:
With 0 elims: 40-47% in (balanced, could go either way)
With 2 elims: 18-22% in (strong trend into 6AM/10AM)
Most likely outcome: 10AM sets extremes (~38-40%)
10AM Checkpoint (After 6AM) - Highest Conviction:
With 0 elims: 69-74% in → FADE (high confidence)
With 3 elims: 30-35% in → BUY/SELL continuation
This is THE money checkpoint for high-probability setups
2PM Checkpoint (After 10AM) - Maximum Fade Conviction:
With 0-3 elims: 67-95% in → FADE strongly
With 4 elims: 49-61% in (monster trend, weaker fade)
2PM is primarily a mean reversion session
UNDERSTANDING THE UNDERLYING DATA
All probabilities are derived from analysis of:
Instrument: NQ Futures (E-mini NASDAQ-100)
Timeframe: 1-minute bars
Period: January 2013 - December 2025
Sample: 3,136+ complete trading days
Methodology: Real-time checkpoint analysis with zero forward-looking bias
Why NQ-Specific?
Each futures contract has unique:
Session characteristics (6AM in NQ shows 60-64% curve behavior, other sessions differ)
Timing patterns (NQ's 10AM session has 67-74% immediate takeouts)
Volatility profiles (NQ 2PM shows 56% bullish bias vs ES shows different bias)
Using this indicator on ES, RTY, or other instruments will produce inaccurate results because the probability tables are NQ-specific.
ORIGINALITY & INNOVATION
What Makes This Indicator Unique:
Zero Forward-Looking Bias: State locks at checkpoint moments. Traditional indicators recalculate continuously, introducing bias. This indicator freezes probabilities at the exact moment a 4H candle closes.
Three-Factor State System: Combines elimination count, structure pattern, and previous candle status. Most indicators only track one dimension. This multi-factor approach provides 2X+ probability differentials.
Separate HOD/LOD Tracking: Highs and lows can have different patterns simultaneously (relentless high with choppy low). This indicator tracks them separately for precision.
Pattern Structure Analysis: Distinguishes between sequential and skip patterns, a concept not found in standard indicators. Skip patterns show mean reversion while sequential shows continuation.
10+ Year Statistical Foundation: Every probability is backed by hundreds to thousands of historical occurrences (sample sizes shown in table). Not based on theories or assumptions.
Checkpoint-Specific Probabilities: Different checkpoints have different probability profiles. 10AM checkpoint with 0 eliminations = 70%+ fade. 6AM checkpoint with same state = 40%+ fade. Context matters.
HOW TO USE THIS INDICATOR
Step 1: Wait for Checkpoint
The table will show "⏳ PRE-CHECKPOINT" until a 4H candle closes. Probabilities are only valid at checkpoint moments.
Step 2: Read the State
Check the three factors:
How many eliminations?
Sequential or skip?
Previous candle eliminated or survived?
Step 3: Check Probability
Look at "Prob Already In" percentage:
>75% (Green) = High confidence extreme is set, fade
45-75% (Yellow) = Moderate confidence, use other confirmation
<45% (Red) = Low confidence extreme is set, continuation likely
Step 4: Check Sample Size
Larger sample (n=1,000+) = higher confidence
Smaller sample (n=50-200) = use caution, edge is real but less robust
Step 5: Consider Pattern
Read the pattern guide:
Relentless = trend continuing
Paused = trend stalled, mean reversion
Skip/Chop = reversal/range likely
Step 6: Compare HOD vs LOD
If both show similar patterns = cleaner signal
If divergent patterns = complex day, be cautious
BEST PRACTICES
Focus on 10AM and 2PM checkpoints - These have the highest conviction signals
Combine with price action - Don't fade blindly at 90% probability if price is breaking out strongly
Larger samples = better edges - Prioritize setups with n=500+
Watch for pattern divergence - When HOD and LOD show different patterns, expect complexity
Remember session characteristics:
6AM = THE CURVE SESSION (60-64% mean reversion when Q2 breaks Q1)
10AM = THE MONEY SESSION (67-74% immediate takeouts, highest conviction)
2PM = THE FADE SESSION (67-95% extremes already in)
SETTINGS
Show 4H Candle Boxes - Display colored boxes for each 4H candle
Show HOD/LOD Lines - Display horizontal lines at current extremes
Show Checkpoint Analysis - Display probability table
Table Position - Choose where to place the checkpoint table
Table Size - Tiny/Small/Normal
Colors - Customize box colors for each session
LIMITATIONS & DISCLAIMERS
NQ FUTURES ONLY - Do not use on other instruments
Not a standalone system - Use as confluence with your strategy
Historical data - Past performance doesn't guarantee future results
Sample size variance - Some states have smaller samples, use judgment
Requires understanding - Read this guide fully before trading with this tool
FINAL NOTES
This indicator represents 10+ years of NQ futures data distilled into actionable, real-time probabilities. The checkpoint methodology ensures zero forward-looking bias, while the three-factor state system provides granular edge that traditional indicators miss.
Remember: This tool provides probabilities, not certainties. Trade with proper risk management, and use this as one input in your decision-making process.

First presented FVG (w/stats) w/statistical hourly ranges & biasOverview
This indicator identifies the first Fair Value Gap (FVG) that forms during each hourly session and provides comprehensive statistical analysis based on 12 years of historical NASDAQ (NQ) data. It combines price action analysis with probability-based statistics to help traders make informed decisions.
⚠️ IMPORTANT - Compatibility
Market: This indicator is designed exclusively for NASDAQ futures (NQ/MNQ)
Timeframe: Statistical data is based on FVGs formed on the 5-minute timeframe
FVG Detection: Works on any timeframe, but use 5-minute for accuracy matching the statistical analysis
All hardcoded statistics are derived from 12 years of NQ historical data
What It Does
1. FVG Detection & Visualization
Automatically detects the first FVG (bullish or bearish) that forms each hour
Draws colored boxes around FVGs:
Blue boxes = Bullish FVG (gap up)
Red boxes = Bearish FVG (gap down)
FVG boxes extend to the end of the hour
Optional midpoint lines show the center of each FVG
Uses volume imbalance logic (outside prints) to refine FVG boundaries
2. Hourly Reference Lines
Vertical Delimiter: Marks the start of each hour
Hourly Open Line: Shows where the current hour opened
Expected Range Lines: Projects the anticipated high/low based on historical data
Choose between Mean (average) or Median (middle value) statistics
Upper range line (teal/green)
Lower range line (red)
All lines span exactly one hour from the moment it opens
Optional labels show price values at line ends
3. Real-Time Statistics Table
The table displays live data for the current hour only:
Hour: Current hour in 12-hour format (AM/PM)
FVG Status: Shows if a Bull FVG, Bear FVG, or no FVG has formed yet
Green background = Bullish FVG detected
Red background = Bearish FVG detected
1st 15min: Direction of the first 15 minutes (Bullish/Bearish/Neutral/Pending)
Continuation %: Historical probability that the hour continues in the first 15-minute direction
Color-coded: Green for bullish, red for bearish
Avg Range %: Expected percentage range for the current hour (based on 12-year mean)
FVG Effect %: Historical probability that FVG direction predicts hourly close direction
Shows BISI→Bull % for bullish FVGs
Shows SIBI→Bear % for bearish FVGs
Blank if no FVG has formed yet
Time Left: Countdown timer showing MM:SS remaining in the hour (updates in real-time)
Hourly Bias: Historical directional tendency (bullish % or bearish %)
H Open: Current hour's opening price
Exp Range: Projected price range (Low - High) based on historical average
Customization Options
Detection Settings:
Lower Timeframe Selection (15S, 1min, 5min) - controls FVG detection granularity
Display Settings:
FVG box colors (bullish/bearish)
Midpoint lines (show/hide, color, style)
Table Settings:
Position (9 locations: corners, edges, center)
Text size (Tiny, Small, Normal, Large)
Hourly Lines:
Toggle each line type on/off
Hour delimiter (color, width)
Open line (color, width, style)
Range lines (color, width, style)
Choose Mean or Median statistics for range calculation
Show/hide labels with customizable text size
How to Use
Apply to NQ futures chart (NQ1! or MNQ1!)
Set chart to 5-minute timeframe for optimal FVG detection matching the statistical data
Watch for the first FVG to form each hour
Reference the table for probability-based decision support:
High continuation % = strong directional bias
FVG Effect % shows reliability of the FVG signal
Time Left helps manage entries/exits within the hour
Use range lines as potential targets or reversal zones
Statistical Foundation
All statistics are derived from:
12 years of NASDAQ (NQ) historical data
Hourly analysis of FVG formation patterns
First 15-minute directional analysis
Mean and Median calculations for range expectations
Data encompasses 2,400+ samples per hour
Best Practices
✅ Use on NQ/MNQ futures only
✅ Best on 5-minute charts (matches statistical data)
✅ Combine FVG signals with continuation probabilities
✅ Use range lines as potential profit targets
✅ Watch the countdown timer for hour-end setups
❌ Do not use on other markets (statistics won't apply)
❌ Avoid using during low-liquidity hours (5PM ET has minimal data)
Technical Notes
Timezone: America/New_York (EST/EDT)
Weekend filtering: Automatically hides data during market closure
Updates in real-time on live bars
Maximum 500 boxes/lines for performance
FVG detection includes volume imbalance (body gap) refinement
Credits
Statistical analysis based on 12 years of NASDAQ historical data. FVG detection methodology follows ICT concepts with volume imbalance refinement.
Disclaimer: This indicator provides statistical analysis based on historical data. Past performance does not guarantee future results. Always use proper risk management.
Would you like me to adjust any section or add/remove anything?6-9 Session & Levels - Customizable Range Analysis Indicator
Description:
This indicator provides comprehensive session-based range analysis designed for intraday traders. It calculates and displays key levels based on a customizable session period (default 6:00-9:00 AM ET).
Core Features:
Sespastedthis is a summary for another indicator- i was hoping for something more like this in terms of content etc22:23Architected comprehensive indicator summary matching professional documentation style.The user wants me to rewrite the summary for their FVG indicator in a similar style to the example provided. The example is more structured, detailed, and professional. Let me create a comprehensive summary that follows that format:
Clear title
Description/Overview
Core Features (broken down into sections)
Input Settings Explained (detailed breakdown of all customization options)
How It Works section
Use Case
Note/Disclaimer
Let me make it thorough and match the style while being accurate to their indicator's functionality.Here's a detailed summary in that format:
Every Hour 1st FVG with Statistical Analysis - NASDAQ Hourly Trading Intelligence
Description:
This indicator identifies the first Fair Value Gap (FVG) that forms during each hourly session and provides comprehensive probability-based statistical analysis derived from 12 years of NASDAQ (NQ) historical data. It combines real-time FVG detection with hardcoded statistical probabilities to help intraday traders make informed decisions based on historical patterns and hourly price action dynamics.
IMPORTANT: This indicator is specifically calibrated for NASDAQ futures (NQ/MNQ) only. All statistical data is derived from 12 years of NQ historical analysis with FVGs detected on the 5-minute timeframe. Using this indicator on other markets will produce invalid statistical results.
Core Features:
FVG Detection & Visualization
Automatically detects and displays the first Fair Value Gap (bullish or bearish) that forms within each hourly session
Color-coded boxes mark FVG zones: Blue for bullish FVGs (gap up), Red for bearish FVGs (gap down)
FVG boxes extend precisely to the end of the hour boundary
Optional midpoint lines show the center point of each FVG
Uses volume imbalance logic (outside prints) to refine FVG boundaries beyond simple wick-to-wick gaps
Supports both chart timeframe detection and lower timeframe detection via request.security_lower_tf
Hourly Reference Lines
Vertical Hour Delimiter: Marks the exact start of each new hour with an extendable vertical line
Hourly Open Line: Displays the opening price of the current hour
Expected Range Lines: Projects anticipated high and low levels based on 12 years of statistical data
Choose between Mean (average) or Median (middle value) calculations
Upper range line shows expected high
Lower range line shows expected low
All lines span exactly one hour from open to close
Optional labels display exact price values at the end of each line
Real-Time Statistics Table
Displays comprehensive live data for the current hour only:
Hour: Current hour in 12-hour format (e.g., "9AM", "2PM")
FVG Status: Shows detection state with color coding
"None Yet" (white background) - No FVG detected
"Bull FVG" (green background) - Bullish FVG identified
"Bear FVG" (red background) - Bearish FVG identified
1st 15min: Direction of first 15 minutes (Bullish/Bearish/Neutral/Pending)
Continuation %: Historical probability that the hour closes in the direction of the first 15 minutes
Green background with up arrow (↑) for bullish continuation probability
Red background with down arrow (↓) for bearish continuation probability
Avg Range %: Expected percentage range for the current hour based on 12-year mean
FVG Effect %: Historical effectiveness of FVG directional prediction
Shows "BISI→Bull %" for bullish FVGs (gap up predicting bullish hourly close)
Shows "SIBI→Bear %" for bearish FVGs (gap down predicting bearish hourly close)
Displays blank if no FVG has formed yet
Time Left: Real-time countdown timer showing minutes and seconds remaining in the hour (MM:SS format)
Hourly Bias: Historical directional tendency showing bullish or bearish percentage bias
H Open: Current hour's opening price
Exp Range: Projected price range showing "Low - High" based on selected statistic (mean or median)
Input Settings Explained:
Detection Settings
Lower Timeframe: Select the base timeframe for FVG detection
Options: 15S (15 seconds), 1 (1 minute), 5 (5 minutes)
Recommendation: Use 5-minute to match the statistical data sample
The indicator uses this timeframe to scan for FVG patterns even when viewing higher timeframes
Display Settings
Bullish FVG Color: Set the color and transparency for bullish (upward) FVG boxes
Bearish FVG Color: Set the color and transparency for bearish (downward) FVG boxes
Show Midpoint Lines: Toggle horizontal lines at the center of each FVG box
Midpoint Line Color: Customize the midpoint line color
Midpoint Line Style: Choose between Solid, Dotted, or Dashed line styles
Table Settings
Table Position: Choose from 9 locations:
Top: Left, Center, Right
Middle: Left, Center, Right
Bottom: Left, Center, Right
Table Text Size: Select from Tiny, Small, Normal, or Large for readability on different screen sizes
Hourly Lines Settings
Show Hourly Lines: Master toggle for all hourly reference lines
Show Hour Delimiter: Toggle the vertical line marking each hour's start
Delimiter Color: Customize color and transparency
Delimiter Width: Set line thickness (1-5)
Show Hourly Open: Toggle the horizontal line at the hour's opening price
Open Line Color: Customize color
Open Line Width: Set thickness (1-5)
Open Line Style: Choose Solid, Dashed, or Dotted
Show Range Lines: Toggle the expected high/low projection lines
Range Statistic: Choose "Mean" (12-year average) or "Median" (12-year middle value)
Range High Color: Customize upper range line color and transparency
Range Low Color: Customize lower range line color and transparency
Range Line Width: Set thickness (1-5)
Range Line Style: Choose Solid, Dashed, or Dotted
Show Line Labels: Toggle price labels at the end of all horizontal lines
Label Text Size: Choose Tiny, Small, or Normal
How It Works:
FVG Detection Logic:
The indicator scans price action on the selected lower timeframe (default: 1-minute) looking for Fair Value Gaps using a 3-candle pattern:
Bullish FVG: Formed when candle 's high is below candle 's low, creating an upward gap
Bearish FVG: Formed when candle 's low is above candle 's high, creating a downward gap
The detection is refined using volume imbalance logic by checking for body gaps (outside prints) on both sides of the middle candle. This narrows the FVG zone to areas where bodies don't touch, indicating stronger imbalances.
Only the first FVG that forms during each hour is displayed. If a bullish FVG forms first, it takes priority. The FVG box is drawn from the formation time through to the end of the hour.
Statistical Analysis:
All probability statistics are hardcoded from 12 years (2,400+ samples per hour) of NASDAQ futures analysis:
First 15-Minute Direction: At 15 minutes into each hour, the indicator determines if price closed above, below, or equal to the hour's opening price
Continuation Probability: Historical analysis shows the likelihood that the hour closes in the same direction as the first 15 minutes
Example: If 9AM's first 15 minutes are bullish, there's a 60.1% chance the entire 9AM hour closes bullish (lowest continuation hour)
4PM shows the highest continuation at 86.1% for bullish first 15 minutes
FVG Effectiveness: Tracks how often the first FVG's direction correctly predicts the hourly close direction
BISI (Bullish Imbalance/Sell-side Inefficiency) → Bullish close probability
SIBI (Bearish Imbalance/Buy-side Inefficiency) → Bearish close probability
Range Expectations: Mean and median values represent typical price movement percentage for each hour
9AM and 10AM show the largest ranges (~0.6%)
5PM shows minimal range (~0.06%) due to low liquidity
Hourly Reference Lines:
When each new hour begins:
Vertical delimiter marks the hour's start
Hourly open line plots at the first bar's opening price
Range projection lines calculate expected high/low:
Upper Range = Hourly Open + (Range% / 100 × Hourly Open)
Lower Range = Hourly Open - (Range% / 100 × Hourly Open)
Lines extend exactly to the hour's end time
Labels appear at line endpoints showing exact prices
Real-Time Updates:
FVG Status: Updates immediately when the first FVG forms
First 15min Direction: Locked in at the 15-minute mark
Countdown Timer: Uses timenow to update every second
Table Statistics: Refresh on every bar close
Timezone Handling:
All times are in America/New_York (Eastern Time)
Automatically filters weekend periods (Saturday and Sunday before 6PM)
Hour detection accounts for daylight saving time changes
Use Cases:
Intraday Trading Strategy Development:
FVG Entry Signals: Use the first hourly FVG as a directional bias
Bullish FVG + High continuation % = Strong long setup
Bearish FVG + High continuation % = Strong short setup
First 15-Minute Breakout: Combine first 15-min direction with continuation probabilities
Wait for first 15 minutes to complete
If continuation % is above 70%, trade in that direction
Example: 4PM bullish first 15 min = 86.1% chance hour closes bullish
Range Targeting: Use expected high/low lines as profit targets or reversal zones
Price approaching mean high = potential resistance
Price approaching mean low = potential support
Compare mean vs median for different risk tolerance (median is more conservative)
Hour Selection: Focus trading on hours with:
High FVG effectiveness (11AM: 81.5% BISI→Bull)
High continuation rates (4PM: 86.1% bull continuation)
Avoid low-continuation hours like 9AM (60.1%)
Time Management: Use the countdown timer to:
Enter early in the hour when FVG forms
Exit before hour-end if no follow-through
Avoid late-hour entries with <15 minutes remaining
Statistical Edge Identification:
Compare current hour's FVG against historical effectiveness
Identify when first 15-min direction contradicts FVG direction (conflict = caution)
Use hourly bias to confirm or contradict FVG signals
Monitor if price stays within expected range or breaks out (outlier moves)
Risk Management:
Expected range lines provide logical stop-loss placement
FVG Effect % helps size positions (higher % = larger position)
Time Left countdown aids in time-based stop management
Avoid trading hours with neutral bias or low continuation rates
Statistical Foundation:
All embedded statistics are derived from:
12 years of NASDAQ futures (NQ) continuous contract data
5-minute timeframe FVG detection methodology
24 hours per day analysis (excluding weekends)
2,400+ samples per hour for robust statistical validity
America/New_York timezone for session alignment
Data includes:
Hourly range analysis (mean, median, standard deviation)
First 15-minute directional analysis
FVG formation frequency and effectiveness
Continuation probability matrices
Bullish/bearish bias percentages
Best Practices:
✅ Do:
Use exclusively on NASDAQ futures (NQ1! or MNQ1!)
Apply on 5-minute charts for optimal FVG detection matching statistical samples
Wait for first 15 minutes to complete before acting on continuation probabilities
Combine FVG signals with continuation % and FVG Effect % for confluence
Use expected range lines as initial profit targets
Monitor the countdown timer for time-based trade management
Focus on hours with high statistical edges (4PM, 11AM, 10AM)
❌ Don't:
Use on other markets (ES, RTY, YM, stocks, forex, crypto) - statistics will be invalid
Rely solely on FVG without confirming with continuation probabilities
Trade during low-liquidity hours (5PM shows only 0.06% average range)
Ignore the first 15-minute direction when it conflicts with FVG direction
Apply to timeframes significantly different from 5-minute for FVG detection
Use median range expectations aggressively (they're conservative)
Technical Implementation Notes:
Timezone: Fixed to America/New_York with automatic DST adjustment
Weekend Filtering: Automatically hides data Saturday and Sunday before 6PM ET
Performance: Maximum 500 boxes and 500 lines for optimal chart rendering
Update Frequency: Table updates on every bar close; timer updates every second using timenow
FVG Priority: Bullish FVGs take precedence when both form simultaneously
Lower Timeframe Detection: Uses request.security_lower_tf for accurate sub-chart-timeframe FVG detection
Precision: All price labels use format.mintick for appropriate decimal precision
Big thanks to @Trades-Dont-Lie for the FPFVG code in his excellent indicator that I've used here

4H Candle Curves4H Candle Curves - Detailed User Guide
OVERVIEW
This indicator reveals curve vs continuation behavior in NQ Futures by analyzing how price responds after breaking the first-hour range. Based on 10+ years of statistical analysis (2013-2025, 3,136+ trading days), it identifies which 4-hour sessions exhibit mean reversion (curve) behavior versus trend continuation when Q2 (second hour) breaks Q1 (first hour) extremes.
⚠️ IMPORTANT: This indicator is specifically designed for NQ FUTURES ONLY. All curve probabilities and statistics were derived from a decade-long dataset of NQ 1-minute bars. Using this on other instruments will produce inaccurate results.
CORE CONCEPT: THE CURVE
What is a "Curve"?
A curve occurs when price breaks out of the first hour's range in Q2 (hour 2), but then reverses direction in the second half (Q3+Q4) to make a new extreme on the opposite side.
Curve Example (Upside Break → Downside Reversal):
Q1 (Hour 1): Price establishes range 25,000 - 25,050
Q2 (Hour 2): Price breaks ABOVE Q1 high, reaches 25,100
Q3+Q4 (Hours 3-4): Price curves back down, makes new LOW below 25,000
Result: Q2 broke high, but second half curved back to make new low below Q1 = CURVE
What is "Continuation"?
Continuation occurs when Q2 breaks Q1 range and the second half extends further in the same direction.
Continuation Example (Upside Break → Further Upside):
Q1 (Hour 1): Price establishes range 25,000 - 25,050
Q2 (Hour 2): Price breaks ABOVE Q1 high, reaches 25,100
Q3+Q4 (Hours 3-4): Price continues higher, makes new HIGH above 25,100
Result: Q2 broke high, second half made new high above Q2 = CONTINUATION
THE CRITICAL DISCOVERY: 6AM IS THE CURVE SESSION
Curve Probabilities by Session:
When Q2 Breaks Q1 HIGH:
6AM: 60.6% curve (new low below Q1) | 38.5% continuation
2AM: 38.4% curve | 46.7% continuation (balanced)
10AM: 17.2% curve | 60.4% continuation ← STRONG continuation bias
6PM: 29.6% curve | 59.0% continuation
10PM: 27.5% curve | 55.1% continuation
When Q2 Breaks Q1 LOW:
6AM: 64.4% curve (new high above Q1) | 35.0% continuation ← HIGHEST curve
2AM: 42.8% curve | 43.3% continuation (balanced)
10AM: 16.7% curve | 51.6% continuation ← STRONG continuation bias
6PM: 33.7% curve | 51.1% continuation
10PM: 33.1% curve | 48.6% continuation
Key Insight:
6AM is THE ONLY SESSION with >60% curve probability in both directions. This makes it a uniquely exploitable mean reversion session. When Q2 breaks Q1 range during 6AM, expect the second half to curve back 60-64% of the time.
10AM shows the opposite: Strong continuation bias (60% when Q2 breaks high, 52% when Q2 breaks low). 10AM breakouts tend to follow through.
HOW IT WORKS: THE QUARTER SYSTEM
The Six 4-Hour Candles (EST):
Each trading day (6pm-5pm) is divided into six 4-hour periods:
6PM (18:00-22:00) - Evening/Globex open | Blue box
10PM (22:00-02:00) - Asia session | Purple box
2AM (02:00-06:00) - Early London | Orange box
6AM (06:00-10:00) - Late London + NY Open | Green box ← THE CURVE SESSION
10AM (10:00-14:00) - NY Morning | Red box ← THE CONTINUATION SESSION
2PM (14:00-17:00) - NY Afternoon | Yellow box (3 hours only)
The Four Quarters:
Each 4-hour candle (except 2PM) is divided into four 1-hour quarters:
Q1 (Hour 1, minutes 0-60): Establishes initial range
Q2 (Hour 2, minutes 60-120): Tests Q1 range - breaks or holds?
Q3 (Hour 3, minutes 120-180): Second half begins
Q4 (Hour 4, minutes 180-240): Second half completes
2PM candle only has 3 hours (14:00-17:00), so quarters are adjusted accordingly.
The Three-Step Analysis:
STEP 1: Q1 Establishes Range
The first hour sets the high and low for the session. This becomes the reference range.
STEP 2: Q2 Break Detection
The indicator monitors whether Q2 (hour 2) breaks above Q1 high or below Q1 low.
STEP 3: Second Half Response
Once Q2 breaks Q1 range, the indicator tracks what happens in Q3+Q4:
Does price CURVE back to make new extreme on opposite side?
Does price CONTINUE to make new extreme in same direction?
Or does price stay within the established range?
VISUAL ELEMENTS EXPLAINED
1. 4-Hour Candle Boxes
Colored boxes display the high-to-low range of each 4H candle:
Blue = 6PM (evening session start)
Purple = 10PM (Asia session)
Orange = 2AM (early London)
Green = 6AM ← THE CURVE SESSION (watch for mean reversion)
Red = 10AM ← THE CONTINUATION SESSION (trend follow-through)
Yellow = 2PM (afternoon close, 3 hours only)
2. Quarter Separator Lines
Vertical dotted lines mark the boundaries between quarters (1H, 2H, 3H marks). This helps you see:
When Q1 ends (after 1 hour)
When Q2 ends / second half begins (after 2 hours)
When Q3 ends (after 3 hours)
3. Candle Name Labels
At the 2-hour mark (Q2/Q3 boundary), a label shows:
Candle name (e.g., "6am")
Directional indicator:
🔼 = Q2 broke Q1 HIGH
🔽 = Q2 broke Q1 LOW
⚠️ = Q2 broke BOTH Q1 high and low (extended range)
No symbol = Q2 stayed within Q1 range
THE LIVE STATUS TABLE
Located in your chosen corner (default: bottom-right), this table shows real-time analysis of the current 4H candle.
Header Row:
"LIVE: CANDLE" - Shows which 4H session you're currently in
Quarter Row:
"Quarter: Q1/Q2/Q3/Q4 (Hour X)" - Shows which quarter you're currently forming
STATUS Section:
The status updates dynamically based on what has happened:
During Q1-Q2 (First Half):
"⏳ Q1 Building..." - First hour forming, range being established
"⏳ Q2 Building..." - Second hour in progress, Q2 within Q1 range so far
"🔼 Q2 Broke Q1 HIGH" - Q2 has broken above Q1 high
"🔽 Q2 Broke Q1 LOW" - Q2 has broken below Q1 low
"⚠️ Q2 Broke BOTH Q1 Extremes" - Q2 extended range in both directions
During Q3-Q4 (Second Half):
"✓ CURVE CONFIRMED" - Q2 broke one direction, second half reversed to opposite side
"✓ CONTINUATION CONFIRMED" - Q2 broke one direction, second half extended further same direction
"⏳ 2nd Half In Progress" - Q2 broke Q1, waiting to see if curve or continuation
"📊 No Q2 Break Occurred" - Q2 stayed within Q1 range (no curve/continuation setup)
EXPECTATION Section:
Shows the probabilities based on the current state:
When Q2 breaks Q1 high in 6AM:
EXPECT 2nd half:
CURVE (low < Q1): 60.6%
CONT (high > Q2): 38.5%
This tells you there's a 60.6% chance the second half will curve back to make a new low below Q1, versus 38.5% chance it continues higher above Q2.
When curve/continuation is confirmed:
Q2 broke high → 2nd half made new LOW below Q1
Curve: 60.6%
Shows what actually happened and the historical probability.
Color Coding:
Purple background = Curve confirmed (mean reversion occurred)
Green background = Continuation confirmed (upside extension)
Red background = Continuation confirmed (downside extension)
Blue background = Second half in progress, watching
Yellow background = No Q2 break (no setup)
Gray background = Still in first half, building
THE CURVE REFERENCE TABLE
Located in your chosen corner (default: bottom-left), this table provides a quick reference for all sessions.
Table Structure:
TOP SECTION: "When Q2 BREAKS Q1 HIGH"
BOTTOM SECTION: "When Q2 BREAKS Q1 LOW"
How to Read:
"Curve" column = % of time second half makes new extreme on OPPOSITE side
"Cont" column = % of time second half makes new extreme in SAME direction
"Winner" column = Which behavior is more likely
Purple highlight = Curve is the winner (higher %)
Blue highlight = Continuation is the winner
🔥 symbol = Strong edge (>60%)
Quick Reference Usage:
You're in 10AM session, Q2 just broke Q1 high. Look at top section, 10AM row:
Curve: 17.2%
Cont: 60.4%
Winner: CONT
Interpretation: 10AM breakouts tend to follow through. Only 17% chance of curving back. Trade with the break, not against it.
PRACTICAL TRADING EXAMPLES
Example 1: Perfect 6AM Curve Setup
Scenario:
6AM candle in progress
7:00 AM: Q1 ends, range is 18,000 - 18,050
7:30 AM: Price breaks above 18,050, reaches 18,075 (Q2 broke Q1 high)
Live table shows: "🔼 Q2 Broke Q1 HIGH"
Expectation: "CURVE (low < Q1): 60.6%"
Trading Decision:
Even though price broke to new highs, the 60.6% curve probability suggests looking for short opportunities expecting price to curve back below 18,000 in Q3-Q4.
Typical Outcome:
8:15 AM (Q3): Price starts declining
9:15 AM (Q4): Price makes new low at 17,990
Result: ✓ CURVE CONFIRMED
Example 2: 10AM Continuation Signal
Scenario:
10AM candle in progress
11:00 AM: Q1 ends, range is 18,100 - 18,150
11:45 AM: Price breaks above 18,150, reaches 18,180 (Q2 broke Q1 high)
Live table shows: "🔼 Q2 Broke Q1 HIGH"
Expectation: "CONT (high > Q2): 60.4%"
Trading Decision:
With 60.4% continuation probability, breakout likely to follow through. Look for long opportunities expecting extension above 18,180 in Q3-Q4.
Typical Outcome:
12:30 PM (Q3): Price continues higher to 18,200
1:15 PM (Q4): Price makes new high at 18,225
Result: ✓ CONTINUATION CONFIRMED
Example 3: Using Reference Table During Live Trading
You see Q2 breaking Q1 low during 2AM session:
Quick reference check:
2AM row, "When Q2 BREAKS Q1 LOW" section
Curve: 42.8% | Cont: 43.3% | Winner: Balanced
Interpretation: This is a coin flip - 2AM session is balanced when Q2 breaks low. Don't force a directional bias. Wait for second half price action confirmation or skip the setup.
Example 4: No Setup Scenario
Scenario:
6AM candle, Q2 ends at 8:00 AM
Q2 stayed within Q1 range (no break above or below)
Live table shows: "📊 No Q2 Break Occurred"
Trading Decision:
No curve/continuation setup exists. This analysis only applies when Q2 breaks Q1 range. Monitor for different strategies or wait for next 4H candle.
UNDERSTANDING THE UNDERLYING METHODOLOGY
Data Foundation:
Instrument: NQ Futures (E-mini NASDAQ-100)
Timeframe: 1-minute bars for precise quarter tracking
Period: January 2013 - December 2025
Sample: 3,136+ complete trading days
Total 4H Candles Analyzed: ~18,800+ individual sessions
Analysis Process:
For each 4H candle in the dataset:
Calculate Q1 high and low (first hour range)
Track whether Q2 breaks Q1 high, Q1 low, both, or neither
When Q2 breaks Q1 range, measure second half response:
Did Q3+Q4 make new low below Q1? (curve when Q2 broke high)
Did Q3+Q4 make new high above Q1? (curve when Q2 broke low)
Did Q3+Q4 make new high above Q2? (continuation when Q2 broke high)
Did Q3+Q4 make new low below Q2? (continuation when Q2 broke low)
Calculate percentages for each session
Why NQ-Specific?
Different futures contracts exhibit different intraday personality:
NQ (NASDAQ):
Tech-heavy, volatility-prone
6AM shows extreme curve behavior (60-64%) due to NY Open reversal tendency
10AM shows strong continuation (60%) as trends establish
ES (S&P 500) would show different probabilities because:
Lower volatility than NQ
Different institutional participation patterns
Different response to macro events
The indicator's probabilities are calibrated specifically to NQ behavior patterns. Using it on ES, RTY, or other instruments will produce misleading signals.
ORIGINALITY & INNOVATION
What Makes This Indicator Unique:
Quarter-Based Curve Analysis: Unlike traditional indicators that only identify breakouts, this tracks what happens after the breakout. The curve vs continuation framework is novel and provides directional edge.
Session-Specific Behavior: Recognizes that 6AM behaves fundamentally differently than 10AM. Most indicators apply the same logic across all sessions. This indicator provides session-specific probabilities.
Statistical Validation: Every probability shown is backed by 10+ years of data (2,900+ candles per session). Not based on theory or discretionary observation.
Real-Time Quarter Tracking: Precisely identifies which quarter you're in and what stage of the pattern is forming. Provides forward-looking probabilities based on current state.
The 6AM Discovery: The 60-64% curve probability in 6AM is a quantified, repeatable edge that contradicts traditional "breakout = continuation" assumptions. This session exhibits mean reversion characteristics that most traders miss.
Dual-Direction Analysis: Tracks both upside breaks (Q2 > Q1 high) and downside breaks (Q2 < Q1 low) separately, as they can have different probabilities.
Visual Quarter System: The combination of colored boxes, quarter separators, and real-time labels provides instant visual understanding of pattern stage and expected behavior.
HOW TO USE THIS INDICATOR
Step 1: Identify Current 4H Candle
Check which colored box you're in and what session it represents.
Step 2: Wait for Q2 to Complete
The setup doesn't exist until Q2 (hour 2) breaks Q1 range. Monitor the live table.
Step 3: Check Q2 Break Status
Did Q2 break Q1 high? Q1 low? Both? Or neither?
Step 4: Consult Reference Table
Look up current session in curve reference table. What's the probability?
Step 5: Apply Session-Specific Strategy
For 6AM (60-64% curve):
Q2 breaks high → Expect curve back for new low
Q2 breaks low → Expect curve back for new high
Strategy: FADE the Q2 break, look for reversal entries in Q3-Q4
For 10AM (52-60% continuation):
Q2 breaks high → Expect continuation higher
Q2 breaks low → Expect continuation lower
Strategy: TRADE WITH the Q2 break, look for continuation entries in Q3-Q4
For 2AM (38-43% curve, 43-47% continuation):
Balanced probabilities
Strategy: Wait for Q3 price action to confirm direction, or skip
For 6PM/10PM (50-59% continuation):
Moderate continuation bias
Strategy: Lean with the break but use tight stops
Step 6: Monitor Live Status
Watch the live table for confirmation:
"✓ CURVE CONFIRMED" = Mean reversion occurred
"✓ CONTINUATION CONFIRMED" = Follow-through occurred
"⏳ 2nd Half In Progress" = Still developing
BEST PRACTICES
Focus on 6AM for curve trades - This is THE high-probability mean reversion session
Focus on 10AM for continuation trades - This is THE high-probability breakout session
Be cautious with 2AM - Balanced probabilities mean lower edge
Use quarter separators - Enter trades early in Q3 after Q2 break, don't wait for Q4
Combine with price action - Don't blindly fade 6AM or follow 10AM; wait for confirming price structure
Respect the 60% rule - 6AM curve happens 60% of time, which means 40% it doesn't. Manage risk accordingly
Watch for "No Q2 Break" - If Q2 doesn't break Q1, this analysis doesn't apply
Consider overnight context - If 6AM opens with huge gap, curve probability may be affected
SETTINGS & CUSTOMIZATION
Display Settings:
Show 4H Candle Boxes - Toggle colored range boxes
Box Colors - Customize color for each session
Show Quarter Separators - Show/hide 1H, 2H, 3H lines
Show Candle Name Labels - Show/hide session labels at 2H mark
Separator Line Style - Solid/Dashed/Dotted
Max Historical Candles - How many past 4H candles to display (1-50)
Table Settings:
Show Live Status Table - Toggle real-time analysis table
Show Curve Reference Table - Toggle probability reference table
Table Positions - Place tables in any corner
Table Text Size - Tiny/Small/Normal
LIMITATIONS & DISCLAIMERS
NQ FUTURES ONLY - All probabilities are NQ-specific, do not use on other instruments
Requires Q2 break - No curve/continuation setup exists if Q2 stays within Q1 range
Probabilities, not certainties - 60% means it happens 6 out of 10 times, not every time
Lower timeframe noise - 1-minute tracking can be choppy, consider using 5min+ for entries
Gap days - Large overnight gaps may affect curve/continuation probabilities
Not standalone - Use as confluence with your strategy, not as sole decision factor
Historical performance - Past statistics don't guarantee future results
WHY THE CURVE CONCEPT MATTERS
Traditional trading wisdom says: "Breakout = Continuation"
This indicator proves that's not always true. Specifically, during the 6AM session (late London + NY Open), when Q2 breaks the Q1 range, price curves back to the opposite extreme 60-64% of the time.
This creates a unique exploitable edge:
Most breakout traders go LONG when Q2 breaks Q1 high
But in 6AM, 60.6% of the time, price curves back down for new low
Shorting the breakout (counter-intuitive) is the higher-probability trade
The 10AM session shows the opposite:
Breakouts in 10AM tend to follow through (52-60%)
Traditional "trade the breakout" strategy works better here
By knowing which session you're in, you can adapt your strategy to match the session's personality.
FINAL NOTES
This indicator distills 10+ years of NQ intraday behavior into actionable, session-specific probabilities. The discovery that 6AM exhibits 60-64% curve behavior while 10AM exhibits 52-60% continuation behavior provides a statistical edge for mean reversion and trend-following traders respectively.
The highest-probability setups:
6AM Q2 break → FADE (60-64% edge for curve)
10AM Q2 break → FOLLOW (52-60% edge for continuation)
2AM = SKIP (balanced probabilities, no clear edge)
Master the 6AM curve and 10AM continuation first. These two sessions provide the clearest statistical edges.
Remember: Trade with proper risk management. This tool provides probabilities based on historical behavior, not predictions of future performance.

Black-76 Options on Futures [Loxx]Black-76 Options on Futures is an adaptation of the Black-Scholes-Merton Option Pricing Model including Analytical Greeks and implied volatility calculations. The following information is an excerpt from Espen Gaarder Haug's book "Option Pricing Formulas". This version is to price Options on Futures. The options sensitivities (Greeks) are the partial derivatives of the Black-Scholes-Merton ( BSM ) formula. Analytical Greeks for our purposes here are broken down into various categories:
Delta Greeks: Delta, DDeltaDvol, Elasticity
Gamma Greeks: Gamma, GammaP, DGammaDvol, Speed
Vega Greeks: Vega , DVegaDvol/Vomma, VegaP
Theta Greeks: Theta
Rate/Carry Greeks: Rho futures option
Probability Greeks: StrikeDelta, Risk Neutral Density
(See the code for more details)
Black-Scholes-Merton Option Pricing
The Black-Scholes-Merton model can be "generalized" by incorporating a cost-of-carry rate b. This model can be used to price European options on stocks, stocks paying a continuous dividend yield, options on futures , and currency options:
c = S * e^((b - r) * T) * N(d1) - X * e^(-r * T) * N(d2)
p = X * e^(-r * T) * N(-d2) - S * e^((b - r) * T) * N(-d1)
where
d1 = (log(S / X) + (b + v^2 / 2) * T) / (v * T^0.5)
d2 = d1 - v * T^0.5
b = r ... gives the Black and Scholes (1973) stock option model.
b = r — q ... gives the Merton (1973) stock option model with continuous dividend yield q.
b = 0 ... gives the Black (1976) futures option model. <== this is the one used for this indicator!
b = 0 and r = 0 ... gives the Asay (1982) margined futures option model.
b = r — rf ... gives the Garman and Kohlhagen (1983) currency option model.
Inputs
S = Stock price.
X = Strike price of option.
T = Time to expiration in years.
r = Risk-free rate
d = dividend yield
v = Volatility of the underlying asset price
cnd (x) = The cumulative normal distribution function
nd(x) = The standard normal density function
convertingToCCRate(r, cmp ) = Rate compounder
gImpliedVolatilityNR(string CallPutFlag, float S, float x, float T, float r, float b, float cm , float epsilon) = Implied volatility via Newton Raphson
gBlackScholesImpVolBisection(string CallPutFlag, float S, float x, float T, float r, float b, float cm ) = implied volatility via bisection
Implied Volatility: The Bisection Method
The Newton-Raphson method requires knowledge of the partial derivative of the option pricing formula with respect to volatility ( vega ) when searching for the implied volatility . For some options (exotic and American options in particular), vega is not known analytically. The bisection method is an even simpler method to estimate implied volatility when vega is unknown. The bisection method requires two initial volatility estimates (seed values):
1. A "low" estimate of the implied volatility , al, corresponding to an option value, CL
2. A "high" volatility estimate, aH, corresponding to an option value, CH
The option market price, Cm , lies between CL and cH . The bisection estimate is given as the linear interpolation between the two estimates:
v(i + 1) = v(L) + (c(m) - c(L)) * (v(H) - v(L)) / (c(H) - c(L))
Replace v(L) with v(i + 1) if c(v(i + 1)) < c(m), or else replace v(H) with v(i + 1) if c(v(i + 1)) > c(m) until |c(m) - c(v(i + 1))| <= E, at which point v(i + 1) is the implied volatility and E is the desired degree of accuracy.
Implied Volatility: Newton-Raphson Method
The Newton-Raphson method is an efficient way to find the implied volatility of an option contract. It is nothing more than a simple iteration technique for solving one-dimensional nonlinear equations (any introductory textbook in calculus will offer an intuitive explanation). The method seldom uses more than two to three iterations before it converges to the implied volatility . Let
v(i + 1) = v(i) + (c(v(i)) - c(m)) / (dc / dv (i))
until |c(m) - c(v(i + 1))| <= E at which point v(i + 1) is the implied volatility , E is the desired degree of accuracy, c(m) is the market price of the option, and dc/ dv (i) is the vega of the option evaluaated at v(i) (the sensitivity of the option value for a small change in volatility ).
Things to know
Only works on the daily timeframe and for the current source price.
You can adjust the text size to fit the screen
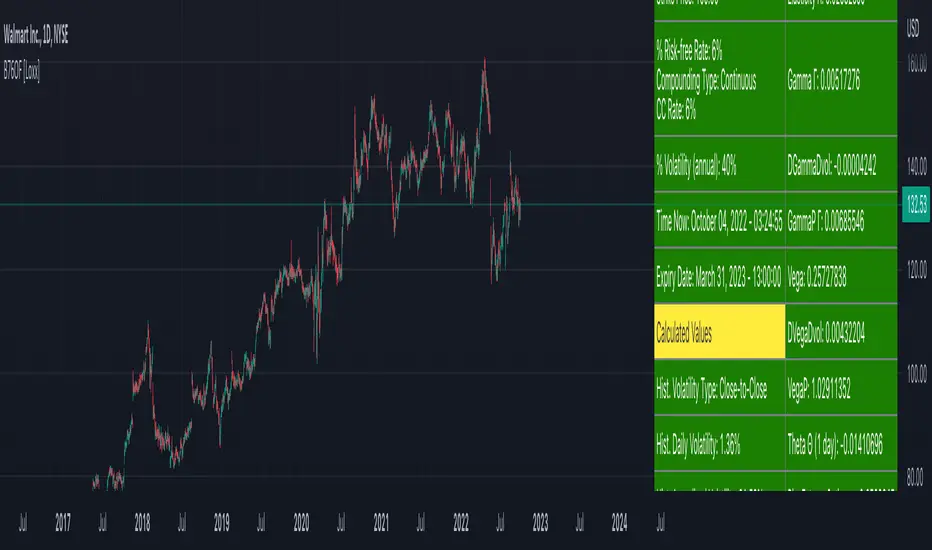
Signal Architect Stop-Hunt !GC HOUR.1.12.2026 AM Signal Architect™ — Developer Note
These daily posts are intentional.
They are designed to help potential users visually observe consistency—not just in outcomes, but in process—across multiple futures products, market conditions, and timeframes, using the Stop Hunt Indicator alongside my proprietary Signal Architect™ framework.
The goal is simple:
To show how structure, behavior, and probability repeat—every day—despite a constantly changing market.
If you follow these posts over time, you will begin to recognize that:
• The same behaviors appear across different futures contracts
• The same reactions occur on multiple timeframes
• The same structural traps and stop events repeat regardless of volatility regime
That consistency is not coincidence.
Consistency is the signal.
Over time, that consistency should become familiar—
and familiarity should become your edge.
________________________________________
🧠 What You’re Seeing (And Why It Matters)
This indicator includes a limited visual preview of a proprietary power signal I have personally developed and refined across:
• Futures
• Algorithmic trading systems
• Options structure
• Equity market behavior
Every tool I release is built around one core principle:
Clarity of direction without over-promising or over-fitting.
That is why all Signal Architect™ tools emphasize:
• Market structure first
• High-probability directional context
• Clear, visual risk framing
• No predictive claims
• No curve-fit illusions
What you see publicly is not the full system—only controlled, educational previews meant to demonstrate how structure and probability align in real markets.
________________________________________
📊 Background & Scope
Over the years, I have personally developed 800+ programs, including:
• Equity systems
• Futures strategies
• Options structure tools
• Dividend & income frameworks
• Portfolio construction and allocation logic
This includes 40+ Nasdaq-100 trading bots, several operating under extremely strict rule-sets and controlled deployment conditions.
Nothing shared publicly represents my complete internal framework.
Public posts exist for education, observation, and pattern recognition—not signals, not advice, and not promises.
________________________________________
🤝 For Those Who Find Value
If these daily posts help you see the market more clearly:
• Follow, boost, and share my scripts, Ideas, and MINDS posts
• Feel free to message me directly with questions or build requests
• Constructive feedback and collaboration are always welcome
For traders who want to go deeper, optional memberships may include:
• Additional signal access
• Early previews
• Occasional free tools and upgrades
🔗 Membership & Signals:
trianchor.gumroad.com
________________________________________
⚠️ Final Note
Everything published publicly is educational and analytical only.
Markets carry risk.
Discipline, patience, and risk management always come first.
Watch the consistency.
Study the structure.
Let the market repeat itself.
— Signal Architect™
________________________________________
🔗 Personally Developed GPT Tools
• AuctionFlow GPT
chatgpt.com
• Signal Architect™ Gamma Desk – Market Intelligence
chatgpt.com
• Gamma Squeeze Watchtower™
chatgpt.com

Signal Architect Stop-Hunt Signal Architect™ — Developer Note
These daily posts are intentional.
They are designed to help potential users visually observe consistency—not just in outcomes, but in process—across multiple futures products, market conditions, and timeframes, using the Stop Hunt Indicator alongside my proprietary Signal Architect™ framework.
The goal is simple:
To show how structure, behavior, and probability repeat—every day—despite a constantly changing market.
If you follow these posts over time, you will begin to recognize that:
• The same behaviors appear across different futures contracts
• The same reactions occur on multiple timeframes
• The same structural traps and stop events repeat regardless of volatility regime
That consistency is not coincidence.
Consistency is the signal.
Over time, that consistency should become familiar—
and familiarity should become your edge.
________________________________________
🧠 What You’re Seeing (And Why It Matters)
This indicator includes a limited visual preview of a proprietary power signal I have personally developed and refined across:
• Futures
• Algorithmic trading systems
• Options structure
• Equity market behavior
Every tool I release is built around one core principle:
Clarity of direction without over-promising or over-fitting.
That is why all Signal Architect™ tools emphasize:
• Market structure first
• High-probability directional context
• Clear, visual risk framing
• No predictive claims
• No curve-fit illusions
What you see publicly is not the full system—only controlled, educational previews meant to demonstrate how structure and probability align in real markets.
________________________________________
📊 Background & Scope
Over the years, I have personally developed 800+ programs, including:
• Equity systems
• Futures strategies
• Options structure tools
• Dividend & income frameworks
• Portfolio construction and allocation logic
This includes 40+ Nasdaq-100 trading bots, several operating under extremely strict rule-sets and controlled deployment conditions.
Nothing shared publicly represents my complete internal framework.
Public posts exist for education, observation, and pattern recognition—not signals, not advice, and not promises.
________________________________________
🤝 For Those Who Find Value
If these daily posts help you see the market more clearly:
• Follow, boost, and share my scripts, Ideas, and MINDS posts
• Feel free to message me directly with questions or build requests
• Constructive feedback and collaboration are always welcome
For traders who want to go deeper, optional memberships may include:
• Additional signal access
• Early previews
• Occasional free tools and upgrades
🔗 Membership & Signals:
trianchor.gumroad.com
________________________________________
⚠️ Final Note
Everything published publicly is educational and analytical only.
Markets carry risk.
Discipline, patience, and risk management always come first.
Watch the consistency.
Study the structure.
Let the market repeat itself.
— Signal Architect™
________________________________________
🔗 Personally Developed GPT Tools
• AuctionFlow GPT
chatgpt.com
• Signal Architect™ Gamma Desk – Market Intelligence
chatgpt.com
• Gamma Squeeze Watchtower™
chatgpt.com

Signal Architect Stop-Hunt Proxy Signal Architect™ — Developer Note
These daily posts are intentional.
They are designed to help potential users visually observe consistency—not just in outcomes, but in process—across multiple futures products, market conditions, and timeframes, using the Stop Hunt Indicator alongside my proprietary Signal Architect™ framework.
The goal is simple:
To show how structure, behavior, and probability repeat—every day—despite a constantly changing market.
If you follow these posts over time, you will begin to recognize that:
• The same behaviors appear across different futures contracts
• The same reactions occur on multiple timeframes
• The same structural traps and stop events repeat regardless of volatility regime
That consistency is not coincidence.
Consistency is the signal.
Over time, that consistency should become familiar—
and familiarity should become your edge.
________________________________________
🧠 What You’re Seeing (And Why It Matters)
This indicator includes a limited visual preview of a proprietary power signal I have personally developed and refined across:
• Futures
• Algorithmic trading systems
• Options structure
• Equity market behavior
Every tool I release is built around one core principle:
Clarity of direction without over-promising or over-fitting.
That is why all Signal Architect™ tools emphasize:
• Market structure first
• High-probability directional context
• Clear, visual risk framing
• No predictive claims
• No curve-fit illusions
What you see publicly is not the full system—only controlled, educational previews meant to demonstrate how structure and probability align in real markets.
________________________________________
📊 Background & Scope
Over the years, I have personally developed 800+ programs, including:
• Equity systems
• Futures strategies
• Options structure tools
• Dividend & income frameworks
• Portfolio construction and allocation logic
This includes 40+ Nasdaq-100 trading bots, several operating under extremely strict rule-sets and controlled deployment conditions.
Nothing shared publicly represents my complete internal framework.
Public posts exist for education, observation, and pattern recognition—not signals, not advice, and not promises.
________________________________________
🤝 For Those Who Find Value
If these daily posts help you see the market more clearly:
• Follow, boost, and share my scripts, Ideas, and MINDS posts
• Feel free to message me directly with questions or build requests
• Constructive feedback and collaboration are always welcome
For traders who want to go deeper, optional memberships may include:
• Additional signal access
• Early previews
• Occasional free tools and upgrades
🔗 Membership & Signals:
trianchor.gumroad.com
________________________________________
⚠️ Final Note
Everything published publicly is educational and analytical only.
Markets carry risk.
Discipline, patience, and risk management always come first.
Watch the consistency.
Study the structure.
Let the market repeat itself.
— Signal Architect™
________________________________________
🔗 Personally Developed GPT Tools
• AuctionFlow GPT
chatgpt.com
• Signal Architect™ Gamma Desk – Market Intelligence
chatgpt.com
• Gamma Squeeze Watchtower™
chatgpt.com

Signal Architect Stop-Hunt ProxySignal Architect™ — Developer Note
These daily posts are intentional.
They are designed to help potential users visually observe consistency—not just in outcomes, but in process—across multiple futures products, market conditions, and timeframes, using the Stop Hunt Indicator alongside my proprietary Signal Architect™ framework.
The goal is simple:
To show how structure, behavior, and probability repeat—every day—despite a constantly changing market.
If you follow these posts over time, you will begin to recognize that:
• The same behaviors appear across different futures contracts
• The same reactions occur on multiple timeframes
• The same structural traps and stop events repeat regardless of volatility regime
That consistency is not coincidence.
Consistency is the signal.
Over time, that consistency should become familiar—
and familiarity should become your edge.
________________________________________
🧠 What You’re Seeing (And Why It Matters)
This indicator includes a limited visual preview of a proprietary power signal I have personally developed and refined across:
• Futures
• Algorithmic trading systems
• Options structure
• Equity market behavior
Every tool I release is built around one core principle:
Clarity of direction without over-promising or over-fitting.
That is why all Signal Architect™ tools emphasize:
• Market structure first
• High-probability directional context
• Clear, visual risk framing
• No predictive claims
• No curve-fit illusions
What you see publicly is not the full system—only controlled, educational previews meant to demonstrate how structure and probability align in real markets.
________________________________________
📊 Background & Scope
Over the years, I have personally developed 800+ programs, including:
• Equity systems
• Futures strategies
• Options structure tools
• Dividend & income frameworks
• Portfolio construction and allocation logic
This includes 40+ Nasdaq-100 trading bots, several operating under extremely strict rule-sets and controlled deployment conditions.
Nothing shared publicly represents my complete internal framework.
Public posts exist for education, observation, and pattern recognition—not signals, not advice, and not promises.
________________________________________
🤝 For Those Who Find Value
If these daily posts help you see the market more clearly:
• Follow, boost, and share my scripts, Ideas, and MINDS posts
• Feel free to message me directly with questions or build requests
• Constructive feedback and collaboration are always welcome
For traders who want to go deeper, optional memberships may include:
• Additional signal access
• Early previews
• Occasional free tools and upgrades
🔗 Membership & Signals:
trianchor.gumroad.com
________________________________________
⚠️ Final Note
Everything published publicly is educational and analytical only.
Markets carry risk.
Discipline, patience, and risk management always come first.
Watch the consistency.
Study the structure.
Let the market repeat itself.
— Signal Architect™
________________________________________
🔗 Personally Developed GPT Tools
• AuctionFlow GPT
chatgpt.com
• Signal Architect™ Gamma Desk – Market Intelligence
chatgpt.com
• Gamma Squeeze Watchtower™
chatgpt.com

Session Relative VolumeSession Relative Volume is an advanced intraday futures volume indicator that analyzes volume separately for Asia, London, and New York sessions - something standard relative volume tools can’t do.
Instead of aggregating the entire day’s volume, the indicator compares current volume to historical averages for the same session and time of day, allowing you to spot true volume strength and meaningful spikes, especially around session opens.
Background
Relative volume helps traders spot unusual activity: high volume often signals institutional participation and trending days, while low volume suggests weak commitment and possible mean reversion. In futures markets, sessions ( Asia, London, New York ) must be analyzed separately, but TradingView’s Relative Volume in Time aggregates the entire day, masking session-specific behavior - especially during the New York open. Since volume can vary by more than 20× between sessions, standard averages struggle to identify meaningful volume spikes when trader conviction matters most.
Indicator Description
The “Session Relative Volume” indicator solves these problems by calculating historical average volume specific to each session and time of day, and comparing current volume against those benchmarks. It offers four display modes and fully customizable session times
Altogether, it provides traders with a powerful tool for analyzing intraday futures volume, helping to better assess market participation, trader conviction, and overall market conditions - ultimately supporting improved trading decisions.
Parameters
Mode – display mode:
R-VOL: Relative cumulative session-specific volume at time
VOL CUM: Cumulative session volume at time compared to historical average cumulative session-specific volume
VOL AVG: Average session intrabar volume at time compared to historical average session-specific intrabar volume
VOL: Individual bars volume, highlighting (solid color) unusual spikes
Lookback period – number of days used for calculating historical average session volume at time
MA Len – length of the moving average, representing average bar volume within a session based on previous periods (different from historical cumulative volume!). Used only in VOL and VOL AVG modes
MA Thresh – deviation from moving average, used to detect bar volume spikes (bar volume > K × moving average)
Start Time – End Time and Time Zone parameters for each session. The time zone must be set using TradingView’s format (e.g., GMT+1).

Robrechtian Long-Medium Breakout Trend SystemRobrechtian Long–Medium-Term Breakout Trend System
A professional, rule-based trend-following strategy designed to capture large, sustained price movements using pure price action and breakouts.
This system follows long-established trend-following philosophy: no prediction, no volatility targeting, and no profit targets. Only disciplined entries, position additions, and exits driven entirely by trend structure.
Core Principles
Breakout-driven entries: Initial positions are taken only when price breaks above/below the 80-day Donchian channel, confirming a long–medium-term trend shift.
Short-term confirmation: Breakouts must also exceed the 20-day channel, reducing false positives.
Trend-direction filter: A 50-day moving average slope filter ensures alignment with the broader trend.
Explosive bar filter: Entries avoid excessively large, single-candle expansions (>2.5× ATR(20)) to prevent chasing exhaustion spikes.
Pyramiding into strength: Additional units are added only when price makes fresh 20-day breakouts in the direction of the trend. No scaling out. No adding on dips.
Exit only on trend violation: Positions are closed exclusively when price breaks the opposite 80-day channel. This preserves unlimited upside while enforcing disciplined exits.
Pure trend philosophy: No volatility targeting, no smoothing, no discretionary overrides, no optimization for short-term performance.
Intended Use
This system is designed primarily for diversified futures portfolios, where diversification across dozens of globally liquid markets creates robustness and stability. However, it may also be used on individual assets for educational and analytical purposes.
The system embraces the core trend-following logic:
Small losses, big winners, and unlimited upside when trends persist.
⚠️ WARNINGS / DISCLAIMERS
⚠️ Warning 1 — This strategy is not optimized for single stocks
The Robrechtian Trend System is designed for multi-asset futures portfolios, not single equities.
Performance on individual tickers may vary greatly due to lack of diversification.
⚠️ Warning 2 — Trend following includes substantial drawdowns
Deep drawdowns are a normal and expected feature of all long-term trend-following systems.
The strategy does not attempt to smooth returns or manage volatility.
If you seek steady, low-volatility equity curves, this system is not suitable.
⚠️ Warning 3 — No volatility targeting or risk smoothing
This system intentionally avoids volatility-based position sizing.
Trades may experience larger fluctuations than systems using risk parity or vol targeting.
⚠️ Warning 4 — Not financial advice
This script is for educational and research purposes only.
Past performance does not guarantee future results.
Use at your own risk.
⚠️ Warning 5 — TradingView backtests have known limitations
TradingView does not simulate:
futures contract roll logic
slippage
real bid/ask spreads
liquidity conditions
limit-up/limit-down behavior
Results may vary from live market execution.

Micro/Mini P&L [LDT]Overview
Micro/Mini P&L is a risk and P&L visualization tool built primarily for futures traders.
It provides accurate dollar-based calculations for either micros or minis, regardless of which contract type you are currently charting.
The indicator automatically detects your instrument (NQ, MNQ, ES, MES, YM, RTY, CL, GC, etc.) and adjusts point-value data accordingly, allowing you to chart one contract while evaluating risk for another.
This removes the need for manual conversions and keeps your position data consistent at all times.
Although optimized for futures, the tool also works on any other asset for general trade-level visualization.
Features
• Automatic instrument detection for major futures markets including NQ/MNQ, ES/MES, YM/MYM, RTY/M2K, CL/MCL, GC/MGC and others.
Point-value logic adjusts instantly based on the detected symbol ensuring accurate calculations without manual configuration.
• Micro/Mini display toggle, allowing you to calculate dollar values for either contract type regardless of which contract is on your chart.
Useful for traders who prefer charting minis whilst trading micros or the opposite.
• Trade-level visualization, including Entry, Take Profit and Stop Loss levels with automatically drawn lines and optional TP/SL zone shading for clear and structured display on the chart.
• Dynamic P/L calculations, showing both point-based and dollar-based metrics in real time.
This includes TP/SL dollar values, points to target/stop, real-time P/L and an optional risk-reward ratio.
• Adaptive risk table, displaying contract counts from 1 up to your selected maximum, total dollar risk for each row and highlighting your chosen contract size.
This provides a straightforward method for evaluating risk, scaling and position sizing.
• Customizable display options, including color settings, label visibility, extension length, bar offsets and table positioning.
This allows the tool to remain clean, unobtrusive and easy to integrate into any chart layout.
Purpose
This tool is designed to give futures traders a clear, consistent and reliable way to view dollar-accurate risk per contract without performing manual conversions.
Whether you trade micros or minis, the displayed values always align with your selected contract type, even when charting the opposite market.

VIX: Backwardation Vs ContangoVIX: Backwardation Vs Contango
Quickly visualize Contango vs Backwardation in the S&P 500 Volatility Index by plotting the prices of the futures contracts over the next 9 months
Note: indicator does not map to time axis in the same way as price; it simply plots the progression of contract months out into the future; left to right; so timeframe DOESN'T MATTER for this plot
TO UPDATE(every few months recommended): in REQUEST CONTRACTS section, delete old contracts (top) and add new ones (bottom). Then in PLOTTING section, Delete old contract labels (bottom); add new contract labels (top); adjust the X in 'bar_index-(X+_historical)' numbers accordingly
This is one of several similar indicators: Meats | Metals | Grains | VIX
Tips:
-Right click and reset chart if you can't see the plot; or if you have trouble with the scaling.
-Right click and pin to Scale A to plot on the same scale as price
--Added historical input: input days back in time; to see the historical shape of the Futures curve via selecting 'days back' snapshot
updated 15th June 2022
© twingall
