Golden Cross Strategy & BacktesterGolden Cross Strategy & Backtester 📈🚀
Overview
This script provides a complete backtesting environment for the classic Golden Cross trend-following strategy. It is designed to be simple, visual, and easy to use. 💪
The strategy operates on the following logic:
🔼 Long Entry: A "Buy" signal is generated when the short-term moving average (Short MA) crosses above the long-term moving average (Long MA).
🔽 Exit: The position is closed when the short-term moving average crosses back below the long-term moving average (a "Death Cross").
The background of the chart will be shaded green 🎨 during periods when the strategy is holding an active position.
How to Use for Backtesting 🔬
This is a strategy script, which means its main purpose is to test the historical performance of this trading idea.
Add this script to your chart.
Open the "Strategy Tester" panel at the bottom of your chart.
In the "Overview" and "Performance" tabs, you can see detailed results 📊, such as the Net Profit and Max Drawdown, to evaluate the strategy's effectiveness.
Customization ⚙️
You can easily customize the strategy's parameters without editing the code.
Click the Settings/Gear icon (⚙️) next to the script's name on your chart.
In the "Inputs" tab, you can change:
📏 Short MA Length: The period for the fast-moving average (default is 50).
📏 Long MA Length: The period for the slow-moving average (default is 200).
In the "Properties" tab, you can change:
💰 Initial Capital: The starting balance for the backtest.
Feel free to test different settings to find what works best for your preferred asset and timeframe! Happy testing! 🎉
Cari dalam skrip untuk "GOLD"

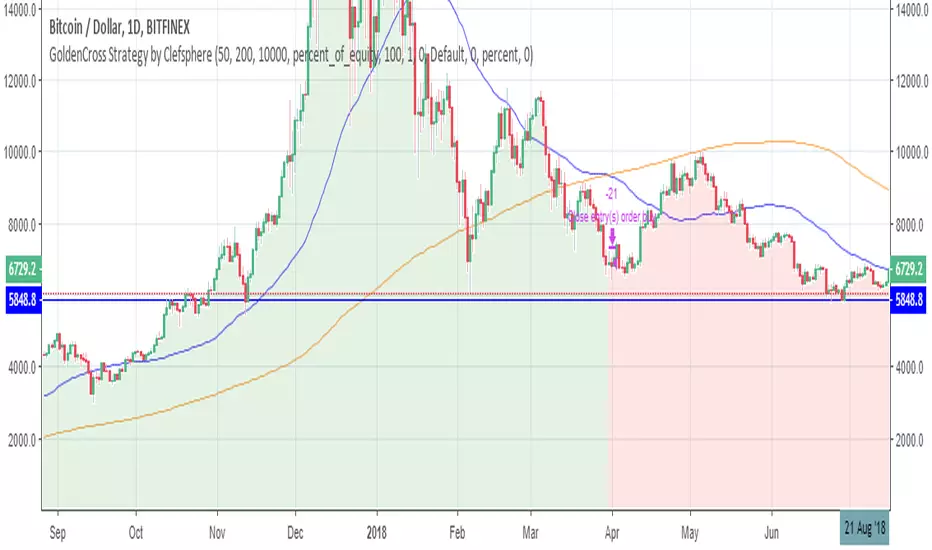
GoldenCross Strategy by ClefsphereGolden cross when 50SMA crosses 200SMA. Can be used for any market. Day time frame is ideal.
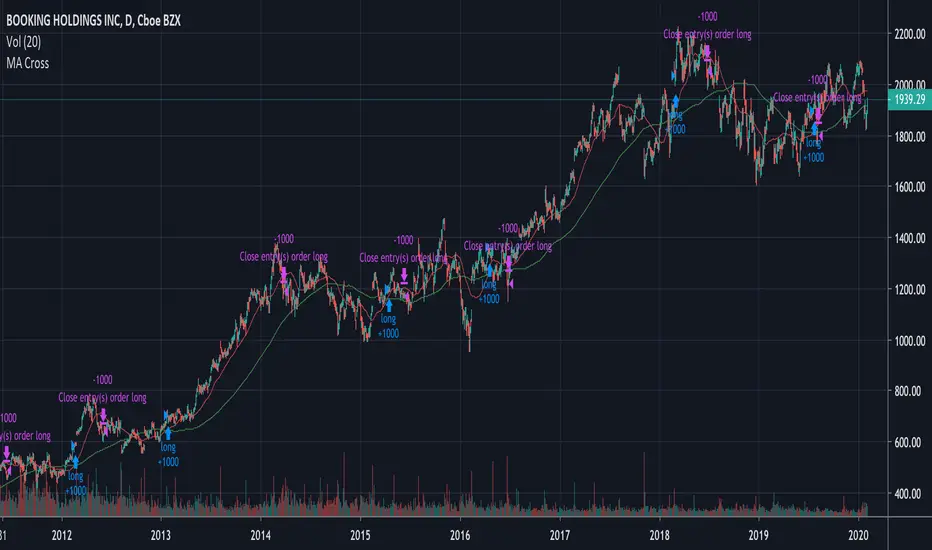
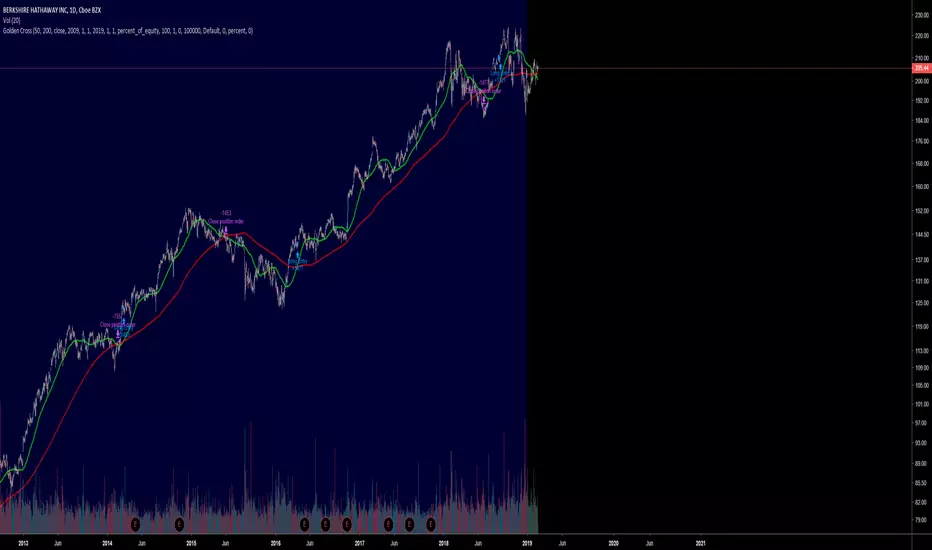
Golden Cross, SMA 200 Moving Average Strategy (by ChartArt)This famous moving average strategy is very easy to follow to decide when to buy (go long) and when to take profit.
The strategy goes long when the faster SMA 50 (the simple moving average of the last 50 bars) crosses above the slower SMA 200. Orders are closed when the SMA 50 crosses below the SMA 200. This simple strategy does not have any other stop loss or take profit money management logic. The strategy does not short and goes long only!
Here is an article explaining the "golden cross" strategy in more detail:
www.stockopedia.com
On the S&P 500 index (symbol "SPX") this strategy worked on the daily chart 81% since price data is available since 1982. And on the DOW Jones Industrial Average (symbol "DOWI") this strategy worked on the daily chart 55% since price data is available since 1916. The low number of trades is in both cases not statistically significant though.
All trading involves high risk; past performance is not necessarily indicative of future results. Hypothetical or simulated performance results have certain inherent limitations. Unlike an actual performance record, simulated results do not represent actual trading. Also, since the trades have not actually been executed, the results may have under- or over-compensated for the impact, if any, of certain market factors, such as lack of liquidity. Simulated trading programs in general are also subject to the fact that they are designed with the benefit of hindsight. No representation is being made that any account will or is likely to achieve profits or losses similar to those shown.

Gold Friday Anomaly StrategyThis script implements the " Gold Friday Anomaly Strategy ," a well-known historical trading strategy that leverages the gold market's behavior from Thursday evening to Friday close. It is a backtesting-focused strategy designed to assess the historical performance of this pattern. Traders use this anomaly as it captures a recurring market tendency observed over the years.
What It Does:
Entry Condition: The strategy enters a long position at the beginning of the Friday trading session (Thursday evening close) within the defined backtesting period.
Exit Condition: Friday evening close.
Backtesting Controls: Allows users to set custom backtesting periods to evaluate strategy performance over specific date ranges.
Key Features:
Custom Backtest Periods: Easily configurable inputs to set the start and end date of the backtesting range.
Fixed Slippage and Commission Settings: Ensures realistic simulation of trading conditions.
Process Orders on Close: Backtesting is optimized by processing orders at the bar's close.
Important Notes:
Backtesting Only: This script is intended purely for backtesting purposes. Past performance is not indicative of future results.
Live Trading Recommendations: For live trading, it is highly recommended to use limit orders instead of market orders, especially during evening sessions, as market order slippage can be significant.
Default Settings:
Entry size: 10% of equity per trade.
Slippage: 1 tick.
Commission: 0.05% per trade.

Gold Scalping Strategy with Precise EntriesThe Gold Scalping Strategy with Precise Entries is designed to take advantage of short-term price movements in the gold market (XAU/USD). This strategy uses a combination of technical indicators and chart patterns to identify precise buy and sell opportunities during times of consolidation and trend continuation.
Key Elements of the Strategy:
Exponential Moving Averages (EMAs):
50 EMA: Used as the shorter-term moving average to detect the recent price trend.
200 EMA: Used as the longer-term moving average to determine the overall market trend.
Trend Identification:
A bullish trend is identified when the 50 EMA is above the 200 EMA.
A bearish trend is identified when the 50 EMA is below the 200 EMA.
Average True Range (ATR):
ATR (14) is used to calculate the market's volatility and to set a dynamic stop loss based on recent price movements. Higher ATR values indicate higher volatility.
ATR helps define a suitable stop-loss distance from the entry point.
Relative Strength Index (RSI):
RSI (14) is used as a momentum oscillator to detect overbought or oversold conditions.
However, in this strategy, the RSI is primarily used as a consolidation filter to look for neutral zones (between 45 and 55), which may indicate a potential breakout or trend continuation after a consolidation phase.
Engulfing Patterns:
Bullish Engulfing: A bullish signal is generated when the current candle fully engulfs the previous bearish candle, indicating potential upward momentum.
Bearish Engulfing: A bearish signal is generated when the current candle fully engulfs the previous bullish candle, signaling potential downward momentum.
Precise Entry Conditions:
Long (Buy):
The 50 EMA is above the 200 EMA (bullish trend).
The RSI is between 45 and 55 (neutral/consolidation zone).
A bullish engulfing pattern occurs.
The price closes above the 50 EMA.
Short (Sell):
The 50 EMA is below the 200 EMA (bearish trend).
The RSI is between 45 and 55 (neutral/consolidation zone).
A bearish engulfing pattern occurs.
The price closes below the 50 EMA.
Take Profit and Stop Loss:
Take Profit: A fixed 20-pip target (where 1 pip = 0.10 movement in gold) is used for each trade.
Stop Loss: The stop-loss is dynamically set based on the ATR, ensuring that it adapts to current market volatility.
Visual Signals:
Buy and sell signals are visually plotted on the chart using green and red labels, indicating precise points of entry.
Advantages of This Strategy:
Trend Alignment: The strategy ensures that trades are taken in the direction of the overall trend, as indicated by the 50 and 200 EMAs.
Volatility Adaptation: The use of ATR allows the stop loss to adapt to the current market conditions, reducing the risk of premature exits in volatile markets.
Precise Entries: The combination of engulfing patterns and the neutral RSI zone provides a high-probability entry signal that captures momentum after consolidation.
Quick Scalping: With a fixed 20-pip profit target, the strategy is designed to capture small price movements quickly, which is ideal for scalping.
This strategy can be applied to lower timeframes (such as 1-minute, 5-minute, or 15-minute charts) for frequent trade opportunities in gold trading, making it suitable for day traders or scalpers. However, proper risk management should always be used due to the inherent volatility of gold.

Golden X BF StrategyThis is a Strategy version of my Golden X/Death X indicator.
The strategy goes long on a golden cross and short on a death cross. You can change the MA types and periods in settings.

Golden Short Testing 1.1New version of Golden Short Strategy based on the golden number theory and is for long positions. It has two parameters:
1. Step to form the body of candle to generate a possible enter
2. Number of steps to form the body of the candle
Profit 1: 1:0.61 Risk/Reward Ratio -> WinRate on EURUSD: 61.41%
Values on EURUSD:
Interval: 1h
Step: 0.00022
Body: 3

Golden Long Testing 1.1New version of Golden Long Strategy based on the golden number theory and is for long positions. It has two parameters:
1. Step to form the body of candle to generate a possible enter
2. Number of steps to form the body of the candle
Profit 1: 1:0.61 Risk/Reward Ratio -> WinRate on EURUSD: 66.70%
Profit 2: 1:1.61 Risk/Reward Ratio -> WinRate on EURUSD: 48.04%
Profit 3: 1:3.23 Risk/Reward Ratio -> WinRate on EURUSD: 28.40%
Values on EURUSD:
Interval: 1h
Step: 0.00022
Body: 7

Golden Short TestingThis scripts is based on the golden number theory and is for short entries. It has three parameters:
1. Step of the body i.e: pip-0.0001, cents-0.01
2. Number of steps of the body of the candle
2. Number of contracts to put on 3 orders executed at the same time

Golden Long TestingThese scripts is based on the golden number theory and is for long entries. It has two parameters:
1. Number of pips of the body of candles to put an entry
2. Number of contracts to put on 3 orders executed at the same time
GoldenCross by PuffyThis is a simple trading strategy that seeks the Golden Cross and Death Cross on the 4HR chart. The fast moving indicator in this strategy is the EMA 50 and the slow moving indicator is the EMA 200. When the EMA 50 crosses over the EMA 200 the strategy indicates a buy. When the EMA 50 crosses below the EMA 200 the strategy indicates a sell. This strategy averages trades in the 40 - 50 day range and as such should not be used with heavy leverage.

Gold/Silver 30m Only Strategy Buy/Sell SignalsIn my free time I felt like coding this strategy, and after backtesting it, it appears that the 30m time frame is the most profitable.
I only have been working on it for gold, but it should work similarly for silver as well.
This includes no pyramiding, and with pyramiding orders of 5, this strategy is upwards of 100% profitable.
Buy order - when price is above the 162 day EMA and RSI is less than 35
Sell order - when price is below the 162 day EMA and RSI is greater than 65
I will probably be adjusting it to increase the profitability and %success rate.

Long only strategy VWAP with BB and Golden Cross EMA50/200
This is strategy, mainly designed for stock markets
It makes uses of the EMA 50/ 200 ( Golden cross) and VWAP and Bollinger bands.
It only takes long positions. It can be adapted to all time frames, but preferably to be used with longer timeframes 1h +
The rules for entry are the next ones :
1. EMA50 > EMA 200
2. if current close > vwap session value
3. check if price dipped BB lower band for any of last 10 candles
EXIT RULE
1. price closes above BB upper
STOP LOSS EXIT
1. As configured --- default is set to 1%

My Golden Cross Strategysimply strategy that flag LONG position when gold cross on MA50 / MA200 will occur

Dumb Strategy 2 - Golden CrossThe Golden Cross is one of the simplest market indicator who helps long term investors to entry a position.
With that in mind, I made a very easy to understand backtest showing how much we could earn if we entered in a Golden Cross and exit when Death Cross happening.
Take this code and try in your favorite market.
Of course, never use only this indicator to trade.
Golden Cross + Support/Resistance + SL/TP + SignalsGolden Cross + Support/Resistance + SL/TP + Signals
Golden Cross + Support/Resistance + SL/TP + Signals

PowerTrend Pro Strategy – Gold OptimizedTired of false signals on Gold?
PowerTrend Pro combines VWAP, Supertrend, RSI, and smart MA filters with trailing stops & break-even logic to deliver high-probability trades on XAUUSD.
PowerTrend Pro Strategy is a professional-grade trading system designed to capture high-probability swing and intraday opportunities on XAUUSD (Gold) and other volatile markets.
🔑 Core Features
VWAP Anchoring – institutional fair value reference to filter trades.
Supertrend (ATR-based) – adaptive trend filter tuned for Gold’s volatility.
Multi-Timeframe RSI – confirms momentum alignment across intraday and higher timeframe.
EMA + SMA Combo – ensures trades follow strong directional bias, reducing false signals.
Dynamic Risk Management
Adjustable Take Profit / Stop Loss (%)
Trailing Stop that locks in profits on extended moves
Break-Even Logic (stop loss moves to entry once price is in profit)
⚡ Gold-Tuned Presets
XAUUSD 1H → tighter TP/SL & faster entries for active intraday trading.
XAUUSD 4H → wider ATR filter & trailing stops to capture bigger swings.
Generic Mode → works on Forex, Indices, and Crypto (fully customizable).
🎯 Why It Works
Gold is notoriously volatile — quick spikes wipe out weak strategies. PowerTrend Pro solves this by combining:
✅ Institutional bias (VWAP)
✅ Adaptive trend filter (Supertrend)
✅ Momentum confirmation (RSI MTF)
✅ Robust trend structure (EMA + SMA)
✅ Smart exits (TP, SL, trailing & breakeven)
This multi-layer confirmation makes entries stronger and keeps risk under control.
🛠️ Usage
Add the strategy to your chart.
Choose a preset (XAUUSD 1H, 4H, or Generic).
Run Strategy Tester for performance metrics.
Optimize TP/SL and ATR values for your broker & market conditions.
🔥 Pro Tip: Combine this strategy with a session filter (London/NY overlap) or volume confirmation to boost accuracy in Gold.

Precision Trading Strategy: Golden EdgeThe PTS: Golden Edge strategy is designed for scalping Gold (XAU/USD) on lower timeframes, such as the 1-minute chart. It captures high-probability trade setups by aligning with strong trends and momentum, while filtering out low-quality trades during consolidation or low-volatility periods.
The strategy uses a combination of technical indicators to identify optimal entry points:
1. Exponential Moving Averages (EMAs): A fast EMA (3-period) and a slow EMA (33-period) are used to detect short-term trend reversals via crossover signals.
2. Hull Moving Average (HMA): A 66-period HMA acts as a higher-timeframe trend filter to ensure trades align with the overall market direction.
3. Relative Strength Index (RSI): A 12-period RSI identifies momentum. The strategy requires RSI > 55 for long trades and RSI < 45 for short trades, ensuring entries are backed by strong buying or selling pressure.
4. Average True Range (ATR): A 14-period ATR ensures trades occur only during volatile conditions, avoiding choppy or low-movement markets.
By combining these tools, the PTS: Golden Edge strategy creates a precise framework for scalping and offers a systematic approach to capitalize on Gold’s price movements efficiently.

Advanced Gold Scalping Strategy with RSI Divergence# Advanced Gold Scalping Strategy with RSI Divergence
## Overview
This Pine Script implements an advanced scalping strategy for gold (XAUUSD) trading, primarily designed for the 1-minute timeframe. The strategy utilizes the Relative Strength Index (RSI) indicator along with its moving average to identify potential trade setups based on divergences between price action and RSI movements.
## Key Components
### 1. RSI Calculation
- Uses a customizable RSI length (default: 60)
- Allows selection of the source for RSI calculation (default: close price)
### 2. Moving Average of RSI
- Supports multiple MA types: SMA, EMA, SMMA (RMA), WMA, VWMA, and Bollinger Bands
- Customizable MA length (default: 3)
- Option to display Bollinger Bands with adjustable standard deviation multiplier
### 3. Divergence Detection
- Implements both bullish and bearish divergence identification
- Uses pivot high and pivot low points to detect divergences
- Allows for customization of lookback periods and range for divergence detection
### 4. Entry Conditions
- Long Entry: Bullish divergence when RSI is below 40
- Short Entry: Bearish divergence when RSI is above 60
### 5. Trade Management
- Stop Loss: Customizable, default set to 11 pips
- Take Profit: Customizable, default set to 33 pips
### 6. Visualization
- Plots RSI line and its moving average
- Displays horizontal lines at 30, 50, and 70 RSI levels
- Shows Bollinger Bands when selected
- Highlights divergences with "Bull" and "Bear" labels on the chart
## Input Parameters
- RSI Length: Adjusts the period for RSI calculation
- RSI Source: Selects the price source for RSI (close, open, high, low, hl2, hlc3, ohlc4)
- MA Type: Chooses the type of moving average applied to RSI
- MA Length: Sets the period for the moving average
- BB StdDev: Adjusts the standard deviation multiplier for Bollinger Bands
- Show Divergence: Toggles the display of divergence labels
- Stop Loss: Sets the stop loss distance in pips
- Take Profit: Sets the take profit distance in pips
## Strategy Logic
1. **RSI Calculation**:
- Computes RSI using the specified length and source
- Calculates the chosen type of moving average on the RSI
2. **Divergence Detection**:
- Identifies pivot points in both price and RSI
- Checks for higher lows in RSI with lower lows in price (bullish divergence)
- Checks for lower highs in RSI with higher highs in price (bearish divergence)
3. **Trade Entry**:
- Enters a long position when a bullish divergence is detected and RSI is below 40
- Enters a short position when a bearish divergence is detected and RSI is above 60
4. **Position Management**:
- Places a stop loss order at the entry price ± stop loss pips (depending on the direction)
- Sets a take profit order at the entry price ± take profit pips (depending on the direction)
5. **Visualization**:
- Plots the RSI and its moving average
- Draws horizontal lines for overbought/oversold levels
- Displays Bollinger Bands if selected
- Shows divergence labels on the chart for identified setups
## Usage Instructions
1. Apply the script to a 1-minute XAUUSD (Gold) chart in TradingView
2. Adjust the input parameters as needed:
- Increase RSI Length for less frequent but potentially more reliable signals
- Modify MA Type and Length to change the sensitivity of the RSI moving average
- Adjust Stop Loss and Take Profit levels based on current market volatility
3. Monitor the chart for Bull (long) and Bear (short) labels indicating potential trade setups
4. Use in conjunction with other analysis and risk management techniques
## Considerations
- This strategy is designed for short-term scalping and may not be suitable for all market conditions
- Always backtest and forward test the strategy before using it with real capital
- The effectiveness of divergence-based strategies can vary depending on market trends and volatility
- Consider using additional confirmation signals or filters to improve the strategy's performance
Remember to adapt the strategy parameters to your risk tolerance and trading style, and always practice proper risk management.

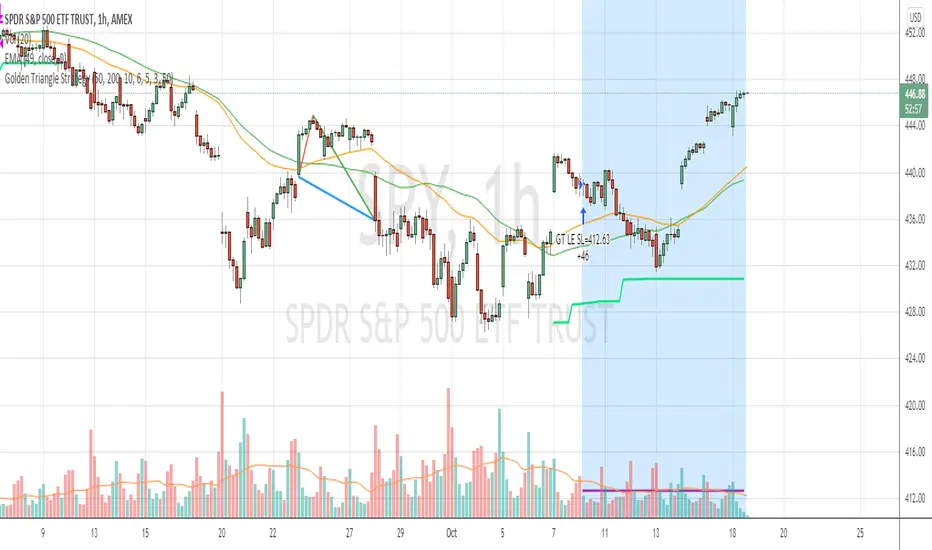
Golden Triangle StrategyGolden Triangle strategy setup is a variation of the buy-the-dip strategy, by Charlotte Hudgin.
You can find the detailed explanation here by Thomas N. Bulkowski thepatternsite.com
BUY
===
1. price should be trading above sma50
2. when it touches sma50 first time , check the starting rallypoint of where it initiated
3. from the above point to current close , see if you have white space , then draw the triangle
4. then check for volume confirmation ( current volume should be greater than last 4 ) --- I have slightly changed this to fit into hourly strategy by adding condition close>vwap
EXIT
====
1. Exit when close crossing down sma50 with at least 2% profit (slightly modified original condition)
StopLoss
========
2. stop loss is set to 6%
Warning
=======
For the use of educational purposes only
Full Swing Gold Vwap Macd SMO StrategyThis is a full strategy designed for gold market using 12h timeframe chart.
Its components are:
VWAP monthly
SMO oscillator
MACD histogram
Rules for entry:
For long: when enter when close of the candle is above vwap monthly, current histogram is higher than the previous one and SMO oscillator is above 0
For long: when enter when close of the candle is below vwap monthly, current histogram is lower than the previous one and SMO oscillator is below 0
Rules for exit:
We exit the trade if we get a reverse condition.
We also exit the trade based on a risk management system, both for SL and TP using % movements.
If you have any questions let me know !

Gold Trade Setup Strategy
Title: Profitable Gold Setup Strategy with Adaptive Moving Average & Supertrend
Introduction:
This trading strategy for Gold (XAU/USD) combines the Adaptive Moving Average (AMA) and Supertrend, tailored for high-probability setups during specific trading hours. The AMA identifies the trend, while the Supertrend confirms entry and exit points. The strategy is optimized for swing and intraday traders looking to capitalize on Gold’s price movements with precise trade timing.
Strategy Components:
1. Adaptive Moving Average (AMA):
• Reacts dynamically to market conditions, filtering noise in choppy markets.
• Serves as the primary trend indicator.
2. Supertrend:
• Confirms entry signals with clear buy and sell levels.
• Acts as a trailing stop-loss to protect profits.
Trading Rules:
Trading Hours:
• Only take trades between 8:30 AM and 10:30 PM IST.
• Avoid trading outside these hours to reduce noise and low-volume setups.
Buy Setup:
1. Trend Confirmation: The Adaptive Moving Average (AMA) must be green.
2. Signal Confirmation: The Supertrend should turn green after the AMA is green.
3. Trigger: Take the trade when the high of the trigger candle (the candle that turned Supertrend green) is broken.
Sell Setup (Optional if included):
• Reverse the rules for a short trade: AMA and Supertrend should both indicate bearish conditions (red), and take the trade when the low of the trigger candle is broken.
Stop-Loss and Targets:
• Place the stop-loss at the low of the trigger candle for long trades.
• Set a 1:2 risk-reward ratio or use the Supertrend line as a trailing stop-loss.
Timeframes:
• Recommended timeframes: 1H, 4H, or Daily for swing trading.
• For intraday trading, use 15-minute or 30-minute charts.
Why This Strategy Works:
• Combines trend-following (AMA) with momentum-based entries (Supertrend).
• Focused trading hours filter out low-probability setups.
• Provides precise entry, stop-loss, and target levels for disciplined trading.
Conclusion:
This Gold Setup Strategy is designed for traders seeking a structured approach to trading Gold. Follow the rules strictly, backtest the strategy extensively, and share your results. Let’s master the Gold market together!
Tags: #Gold #XAUUSD #SwingTrading #Intraday #Supertrend #AMA #TechnicalAnalysis #GoldStrategy
