SA_EMA Combo + UT BotEMA Combo + UT Bot is an indicator designed to make it easier to track trend direction and momentum reversals on the same chart.
The indicator combines multiple EMA lines (50/100/150/200) with a short- and medium-term EMA cloud. This cloud visually shows whether the market is in a bullish or bearish trend through color changes.
In addition, it uses the UT Bot algorithm to generate buy and sell signals adapted to market volatility. These signals are triggered when the price crosses the ATR-based trailing stop level.
Users can choose to use Heikin Ashi candles and adjust signal sensitivity via the Key Value parameter. This allows traders to follow overall trends and potential reversal zones using a single tool.
Disclaimer: This indicator is for technical analysis purposes only and should not be considered financial advice.
Developed for Future Alpha Club.
Cari dalam skrip untuk "Heikin Ashi"
MACD HTF Hardcoded (A/B Presets) + Regimes [CHE] MACD HTF Hardcoded (A/B Presets) + Regimes — Higher-timeframe MACD emulation with acceptance-based regime filter and on-chart diagnostics
Summary
This indicator emulates a higher-timeframe MACD directly on the current chart using two hardcoded preset families and a time-bucket mapping, avoiding cross-timeframe requests. It classifies four MACD regimes and applies an acceptance filter that requires several consecutive bars before a state is considered valid. A small dead-band around zero reduces noise near the axis. An on-chart table reports the active preset, the inferred time bucket, the resolved lengths, and the current regime.
Pine version: v6
Overlay: false
Primary outputs: MACD line, Signal line, Histogram columns, zero line, regime-change alert, info table
Motivation: Why this design?
Cross-timeframe indicators often rely on external timeframe requests, which can introduce repaint paths and added latency. This design provides a deterministic alternative: it maps the current chart’s timeframe to coarse higher-timeframe buckets and uses fixed EMA lengths that approximate those views. The dead-band suppresses flip-flops around zero, and the acceptance counter reduces whipsaw by requiring sustained agreement across bars before acknowledging a regime.
What’s different vs. standard approaches?
Baseline: Classical MACD with user-selected lengths on the same timeframe, or higher-timeframe MACD via cross-timeframe requests.
Architecture differences:
Hardcoded A and B length families with a bucket map derived from the chart timeframe.
No `request.security`; all calculations occur on the current series.
Regime classification from MACD and Histogram sign, gated by an acceptance count and a small zero dead-band.
Diagnostics table for transparency.
Practical effect: The MACD behaves like a slower, higher-timeframe variant without external requests. Regimes switch less often due to the dead-band and acceptance logic, which can improve stability in choppy sessions.
How it works (technical)
The script derives a coarse bucket from the chart timeframe using `timeframe.in_seconds` and maps it to preset-specific EMA lengths. EMAs of the source build MACD and Signal; their difference is the Histogram. Signs of MACD and Histogram define four regimes: strong bull, weak bull, strong bear, and weak bear. A small, user-defined band around zero treats values near the axis as neutral. An acceptance counter checks whether the same regime persisted for a given number of consecutive bars before it is emitted as the filtered regime. A single alert condition fires when the filtered regime changes. The histogram columns change shade based on position relative to zero and whether they are rising or falling. A persistent table object shows preset, bucket tag, resolved lengths, and the filtered regime. No cross-timeframe requests are used, so repaint risk is limited to normal live-bar movement; values stabilize on close.
Parameter Guide
Source — Input series for MACD — Default: Close — Using a smoother source increases stability but adds lag.
Preset — A or B length family — Default: “3,10,16” — Switch to “12,26,9” for the classic family mapped to buckets.
Table Position — Anchor for the info table — Default: Top right — Choose a corner that avoids covering price action.
Table Size — Table text size — Default: Normal — Use small on dense charts, large for presentations.
Dark Mode — Table theme — Default: Enabled — Match your chart background for readability.
Show Table — Toggle diagnostics table — Default: Enabled — Disable for a cleaner pane.
Zero dead-band (epsilon) — Noise gate around zero — Default: Zero — Increase slightly when you see frequent flips near zero.
Acceptance bars (n) — Bars required to confirm a regime — Default: Three — Raise to reduce whipsaw; lower to react faster.
Reading & Interpretation
Histogram columns: Above zero indicates bullish pressure; below zero indicates bearish pressure. Darker shade implies the histogram increased compared with the prior bar; lighter shade implies it decreased.
MACD vs. Signal lines: The spread corresponds to histogram height.
Regimes:
Strong bull: MACD above zero and Histogram above zero.
Weak bull: MACD above zero and Histogram below zero.
Strong bear: MACD below zero and Histogram below zero.
Weak bear: MACD below zero and Histogram above zero.
Table: Inspect active preset, bucket tag, resolved lengths, and the filtered regime number with its description.
Practical Workflows & Combinations
Trend following: Use strong bull to favor long exposure and strong bear to favor short exposure. Use weak states as pullback or transition context. Combine with structure tools such as swing highs and lows or a baseline moving average for confirmation.
Exits and risk: In strong trends, consider exiting partial size on a regime downgrade to a weak state. In choppy sessions, increase the acceptance bars to reduce churn.
Multi-asset / Multi-timeframe: Works on time-based charts across liquid futures, indices, currencies, and large-cap equities. Bucket mapping helps retain a consistent feel when moving from lower to higher timeframes.
Behavior, Constraints & Performance
Repaint/confirmation: No cross-timeframe requests; values can evolve intrabar and settle on close. Alerts follow your TradingView alert timing settings.
Resources: `max_bars_back` is set to five thousand. Very large resolved lengths require sufficient history to seed EMAs; expect a warm-up period on first load or after switching symbols.
Known limits: Dead-band and acceptance can delay recognition at sharp turns. Extremely thin markets or large gaps may still cause brief regime reversals.
Sensible Defaults & Quick Tuning
Start with preset “3,10,16”, dead-band near zero, and acceptance of three bars.
Too many flips near zero: increase the dead-band slightly or raise the acceptance bars.
Too sluggish in clean trends: reduce the acceptance bars by one.
Too sensitive on fast lower timeframes: switch to the “12,26,9” preset family or raise the acceptance bars.
Want less clutter: hide the table and keep the alert.
What this indicator is—and isn’t
This is a visualization and regime layer for MACD using higher-timeframe emulation and stability gates. It is not a complete trading system and does not generate position sizing or risk management. Use it with market structure, execution rules, and protective stops.
Disclaimer
The content provided, including all code and materials, is strictly for educational and informational purposes only. It is not intended as, and should not be interpreted as, financial advice, a recommendation to buy or sell any financial instrument, or an offer of any financial product or service. All strategies, tools, and examples discussed are provided for illustrative purposes to demonstrate coding techniques and the functionality of Pine Script within a trading context.
Any results from strategies or tools provided are hypothetical, and past performance is not indicative of future results. Trading and investing involve high risk, including the potential loss of principal, and may not be suitable for all individuals. Before making any trading decisions, please consult with a qualified financial professional to understand the risks involved.
By using this script, you acknowledge and agree that any trading decisions are made solely at your discretion and risk.
Do not use this indicator on Heikin-Ashi, Renko, Kagi, Point-and-Figure, or Range charts, as these chart types can produce unrealistic results for signal markers and alerts.
Best regards and happy trading
Chervolino

Quantum Fluxtrend [CHE] Quantum Fluxtrend — A dynamic Supertrend variant with integrated breakout event tracking and VWAP-guided risk management for clearer trend decisions.
Summary
The Quantum Fluxtrend builds on traditional Supertrend logic by incorporating a midline derived from smoothed high and low values, creating adaptive bands that respond to market range expansion or contraction. This results in fewer erratic signals during volatile periods and smoother tracking in steady trends, while an overlaid event system highlights breakout confirmations, potential traps, or continuations with visual lines, labels, and percentage deltas from the close. Users benefit from real-time VWAP calculations anchored to events, providing dynamic stop-loss suggestions to help manage exits without manual adjustments. Overall, it layers signal robustness with actionable annotations, reducing noise in fast-moving charts.
Motivation: Why this design?
Standard Supertrend indicators often generate excessive flips in choppy conditions or lag behind in low-volatility drifts, leading to whipsaws that erode confidence in trend direction. This design addresses that by centering bands around a midline that reflects recent price spreads, ensuring adjustments are proportional to observed variability. The added event layer captures regime shifts explicitly, turning abstract crossovers into labeled milestones with trailing VWAP for context, which helps traders distinguish genuine momentum from fleeting noise without over-relying on raw price action.
What’s different vs. standard approaches?
- Baseline reference: Diverges from the classic Supertrend, which uses average true range for fixed offsets from a median price.
- Architecture differences:
- Bands form around a central line averaged from smoothed highs and lows, with offsets scaled by half the range between those smooths.
- Regime direction persists until a clear breach of the prior opposite band, preventing premature reversals.
- Event visualization draws persistent lines from flip points, updating labels based on price sustainment relative to the trigger level.
- VWAP resets at each event, accumulating volume-weighted prices forward for a trailing reference.
- Practical effect: Charts show fewer direction changes overall, with color-coded annotations that evolve from initial breakout to continuation or trap status, making it easier to spot sustained moves early. VWAP lines provide a volume-informed anchor that curves with price, offering visual cues for adverse drifts.
How it works (technical)
The process starts by smoothing high and low prices over a user-defined period to form upper and lower references. A midline sits midway between them, and half the spread acts as a base for band offsets, adjusted by a multiplier to widen or narrow sensitivity. On each bar, the close is checked against the previous bar's opposite band: crossing above expands the lower band downward in uptrends, or below contracts the upper band upward in downtrends, creating a ratcheting effect that locks in direction until breached.
Persistent state tracks the current regime, seeding initial bands from the smoothed values if no prior data exists. Flips trigger new horizontal lines at the breach level, styled by direction, alongside labels that monitor sustainment—price holding above for up-flips or below for down-flips keeps the regime, while reversal flags a trap.
Separately, at each flip, a dashed VWAP line initializes at the breach price and extends forward, accumulating the product of typical prices and volumes divided by total volume. This yields a curving reference that updates bar-by-bar. Warnings activate if price strays adversely from this VWAP, tinting the background for quick alerts.
No higher timeframe data is pulled, so all computations run on the chart's native resolution, avoiding lookahead biases unless repainting is enabled via input.
Parameter Guide
SMA Length — Controls smoothing of highs and lows for midline and range base; longer values dampen noise but increase lag. Default: 20. Trade-offs: Shortens responsiveness in trends (e.g., 10–14) but risks more flips; extend to 30+ for stability in ranging markets.
Multiplier — Scales band offsets from the half-range; higher amplifies to capture bigger swings. Default: 1.0. Trade-offs: Above 1.5 widens for volatile assets, reducing false signals; below 0.8 tightens for precision but may miss subtle shifts.
Show Bands — Toggles visibility of basic and adjusted band lines for reference. Default: false. Tip: Enable briefly to verify alignment with price action.
Show Background Color — Displays red tint on VWAP adverse crosses for visual warnings. Default: false. Trade-offs: Helps in live monitoring but can clutter clean charts.
Line Width — Sets thickness for event and VWAP lines. Default: 2. Tip: Thicker (3–5) for emphasis on key levels.
+Bars after next event — Extends old lines briefly before cleanup on new flips. Default: 20. Trade-offs: Longer preserves history (40+) at resource cost; shorter keeps charts tidy.
Allow Repainting — Permits live-bar updates for smoother real-time view. Default: false. Tip: Disable for backtest accuracy.
Extension 1 Settings (Show, Width, Size, Decimals, Colors, Alpha) — Manages dotted connector from event label to current close, showing percentage change. Defaults: Shown, width 2, normal size, 2 decimals, lime/red for gains/losses, gray line, 90% transparent background. Trade-offs: Fewer decimals for clean display; adjust alpha for readability.
Extension 2 Settings (Show, Method, Stop %, Ticks, Decimals, Size, Color, Inherit, Alpha) — Positions stop label at VWAP end, offset by percent or ticks. Defaults: Shown, percent method, 1.0%, 20 ticks, 4 decimals, normal size, white text, inherit tint, 0% alpha. Trade-offs: Percent for proportional risk; ticks for fixed distance in tick-based assets.
Alert Toggles — Enables notifications for breakouts, continuations, traps, or VWAP warnings. All default: true. Tip: Layer with chart alerts for multi-condition setups.
Reading & Interpretation
The main Supertrend line colors green for up-regimes (price above lower band) and red for down (below upper band), serving as a dynamic support/resistance trail. Flip shapes (up/down triangles) mark regime changes at band breaches.
Event lines extend horizontally from flips: green for bull, red for bear. Labels start blank and update to "Bull/Bear Cont." if price sustains the direction, or "Trap" if it reverses, with colors shifting lime/red/gray accordingly. A dotted vertical links the trailing label to the current close, mid-labeled with the percentage delta (positive green, negative red).
VWAP dashes yellow (bull) or orange (bear) from the event, curving to reflect volume-weighted average. At its end, a left-aligned label shows suggested stop price, annotated with offset details. Background red hints at weakening if price crosses VWAP opposite the regime.
Deltas near zero suggest consolidation; widening extremes signal momentum buildup or exhaustion.
Practical Workflows & Combinations
- Trend following: Enter long on green flip shapes confirmed by higher highs, using the event line as initial stop below. Trail stops to VWAP for bull runs, exiting on trap labels or red background warnings. Filter with volume spikes to avoid low-conviction breaks.
- Exits/Stops: Conservative: Set hard stops at suggested SL labels. Aggressive: Hold through minor traps if delta stays positive, but cut on regime flip. Pair with momentum oscillators for overbought pullbacks.
- Multi-asset/Multi-TF: Defaults suit forex/stocks on 15m–4H; for crypto, bump multiplier to 1.5 for volatility. Scale SMA length proportionally across timeframes (e.g., double for daily). Combine with structure tools like Fibonacci for confluence on event lines.
Behavior, Constraints & Performance
Live bars update lines and labels dynamically if repainting is allowed, but signals confirm on close for stability—flips only trigger post-bar. No higher timeframe calls, so no inherent lookahead, though volume weighting assumes continuous data.
Resources cap at 1000 bars back, 50 lines/labels max; events prune old ones on new flips to stay under budget, with brief extensions for visibility. Arrays or loops absent, keeping it lightweight.
Known limits include lag in extreme gaps (e.g., overnight opens) where bands may not adjust instantly, and VWAP sensitivity to sparse volume in illiquid sessions.
Sensible Defaults & Quick Tuning
Start with SMA 20, multiplier 1.0 for balanced response across majors. For choppy pairs: Lengthen SMA to 30, multiplier 0.8 to tighten bands and cut flips. For trending equities: Shorten to 14, multiplier 1.2 for quicker entries. If traps dominate, enable bands to inspect range compression; for sluggish signals, reduce extension bars to focus on recent events.
What this indicator is—and isn’t
This serves as a visualization and signal layer for trend regimes and breakouts, highlighting sustainment via annotations and risk cues through VWAP—ideal atop price action for confirmation. It is not a standalone system, predictive oracle, or risk calculator; always integrate with broader analysis, position sizing, and stops. Use responsibly as an educational tool.
Disclaimer
The content provided, including all code and materials, is strictly for educational and informational purposes only. It is not intended as, and should not be interpreted as, financial advice, a recommendation to buy or sell any financial instrument, or an offer of any financial product or service. All strategies, tools, and examples discussed are provided for illustrative purposes to demonstrate coding techniques and the functionality of Pine Script within a trading context.
Any results from strategies or tools provided are hypothetical, and past performance is not indicative of future results. Trading and investing involve high risk, including the potential loss of principal, and may not be suitable for all individuals. Before making any trading decisions, please consult with a qualified financial professional to understand the risks involved.
By using this script, you acknowledge and agree that any trading decisions are made solely at your discretion and risk.
Do not use this indicator on Heikin-Ashi, Renko, Kagi, Point-and-Figure, or Range charts, as these chart types can produce unrealistic results for signal markers and alerts.
Best regards and happy trading
Chervolino

ProScalper📊 ProScalper - Professional 1-Minute Scalping System
🎯 Overview
ProScalper is a sophisticated, multi-confluence scalping indicator designed specifically for 1-minute chart trading. Combining advanced technical analysis with intelligent signal filtering, it provides high-probability trade setups with clear entry, stop loss, and take profit levels.
✨ Key Features
🔺 Smart Signal Detection
Range Filter Technology: Fast-responding trend detection (25-period) optimized for 1-minute timeframe
Medium-sized triangles appear above/below candles for clear buy/sell signals
Only most recent signal shown - no chart clutter
Automatically deletes old signals when new ones appear
📋 Real-Time Signal Table
Top-center display shows complete trade breakdown
Grade system: A+, A, B+, B, C+ ratings for every setup
All confluence reasons listed with checkmarks
Score and R:R displayed for instant trade quality assessment
Color-coded: Green for LONG, Red for SHORT
📐 Multi-Confluence Analysis
ProScalper combines 10+ technical factors:
✅ EMA Trend: 4 EMAs (200, 48, 13, 8) for multi-timeframe alignment
✅ VWAP: Dynamic support/resistance
✅ Fibonacci Retracement: Golden ratio (61.8%), 50%, 38.2%, 78.6%
✅ Range Filter: Adaptive trend confirmation
✅ Pivot Points: Smart reversal detection
✅ Volume Analysis: Spike detection and volume profile
✅ Higher Timeframe: 5-minute trend confirmation
✅ HTF Support/Resistance: Key levels from higher timeframes
✅ Liquidity Sweeps: Smart money detection
✅ Opening Range Breakout: First 15-minute range
💰 Complete Trade Management
Entry Lines: Dashed green (LONG) or red (SHORT) showing exact entry
Stop Loss: Red dashed line with price label
Take Profit: Blue dashed line with price label and R:R
Partial Exits: 1R level marked with orange dashed line
All lines extend 10 bars for clean alignment with Fibonacci levels
📊 Dynamic Risk/Reward
Adaptive R:R calculation based on market volatility
Targets adjusted for pivot distances
Minimum 1.2:1 to maximum 3.5:1 for scalping
Position sizing based on account risk percentage
🎨 Professional Visualization
Clean chart layout - no clutter, only essential information
Custom EMA colors: Red (200), Aqua (48), Green (13), White (8)
Gold VWAP line for key support/resistance
Color-coded Fibonacci: Bright yellow (61.8%), white (50%), orange (38.2%), fuchsia (78.6%)
No shaded zones - pure price action focus
📈 Performance Tracking
Real-time statistics table (optional)
Win rate, total trades, P&L tracking
Average R:R and win/loss ratios
Setup-specific performance metrics
⚙️ Settings & Customization
Risk Management
Adjustable account risk per trade (default: 0.5%)
ATR-based stop loss multiplier (default: 0.8 for tight scalping)
Dynamic position sizing
Signal Sensitivity
Confluence Score Threshold: 40-100 (default: 55 for balanced signals)
Range Filter Period: 25 bars (fast signals for 1-min)
Range Filter Multiplier: 2.2 (tighter bands for more signals)
Visual Controls
Toggle signal table on/off
Show/hide Fibonacci levels
Control EMA visibility
Adjust table text size
Partial Exits
1R: 50% (default)
2R: 30% (default)
3R: 20% (default)
Fully customizable percentages
Trailing Stops
ATR-Based (best for scalping)
Pivot-Based
EMA-Based
Breakeven trigger at 0.8R
🎯 Best Use Cases
Ideal For:
✅ 1-minute scalping on liquid instruments
✅ Day traders looking for quick 2-8 minute trades
✅ High-frequency trading with 8-15 signals per session
✅ Trending markets where Range Filter excels
✅ Crypto, Forex, Futures - works on all liquid assets
Trading Style:
Timeframe: 1-minute (can work on 3-5 min with adjusted settings)
Hold Time: 3-8 minutes average
Target: 1.2-3R per trade
Frequency: 8-15 signals per day
Win Rate: 45-55% (with proper risk management)
📋 How to Use
Step 1: Wait for Signal
Watch for green triangle (BUY) or red triangle (SELL)
Signal table appears at top center automatically
Step 2: Review Confluence
Check grade (prefer A+, A, B+ for best quality)
Review all reasons listed in table
Confirm score is above your threshold (55+ recommended)
Note the R:R ratio
Step 3: Enter Trade
Enter at current market price
Set stop loss at red dashed line
Set take profit at blue dashed line
Mark 1R level (orange line) for partial exit
Step 4: Manage Trade
Exit 50% at 1R (orange line)
Move to breakeven after 0.8R
Trail remaining position using your chosen method
Exit fully at TP or opposite signal
🎨 Chart Setup Recommendations
Optimal Display:
Timeframe: 1-minute
Chart Type: Candles or Heikin Ashi
Background: Dark theme for best color visibility
Volume: Enable volume bars below chart
Complementary Indicators (optional):
Order flow/Delta for institutional confirmation
Market profile for key levels
Economic calendar for news avoidance
⚠️ Important Notes
Risk Disclaimer:
Not financial advice - for educational purposes only
Always use proper risk management (0.5-1% per trade max)
Past performance doesn't guarantee future results
Test on demo account before live trading
Best Practices:
✅ Trade during high liquidity hours (9:30-11 AM, 2-4 PM EST)
✅ Avoid news events and market open/close (first/last 2 minutes)
✅ Use tight stops (0.8-1.0 ATR) for 1-minute scalping
✅ Take partial profits quickly (1R = 50% off)
✅ Respect max daily loss limits (3% recommended)
✅ Focus on A and B grade setups for consistency
What Makes This Different:
🎯 Complete system - not just signals, but full trade management
📊 Multi-confluence - 10+ factors analyzed per trade
🎨 Professional visualization - clean, focused chart design
⚡ Optimized for 1-min - settings specifically tuned for fast scalping
📋 Transparent reasoning - see exactly why each trade was taken
🏆 Grade system - instantly know trade quality
🔧 Technical Details
Pine Script Version: 5
Overlay: Yes (plots on price chart)
Max Lines: 500
Max Labels: 100
Non-repainting: All signals confirmed on bar close
Alerts: Compatible with TradingView alerts
📞 Support & Updates
This indicator is actively maintained and optimized for 1-minute scalping. Settings can be adjusted for different timeframes and trading styles, but default configuration is specifically tuned for high-frequency 1-minute scalping.
🚀 Get Started
Add ProScalper to your 1-minute chart
Adjust settings to your risk tolerance
Wait for signals (green/red triangles)
Follow the signal table guidance
Manage trades using provided levels
Track performance with stats table
Happy Scalping! 📊⚡💰

Power RSI Segment Runner [CHE] Power RSI Segment Runner — Tracks RSI momentum across higher timeframe segments to detect directional switches for trend confirmation.
Summary
This indicator calculates a running Relative Strength Index adapted to segments defined by changes in a higher timeframe, such as daily closes, providing a smoothed view of momentum within each period. It distinguishes between completed segments, which fix the final RSI value, and ongoing ones, which update in real time with an exponential moving average filter. Directional switches between bullish and bearish momentum trigger visual alerts, including overlay lines and emojis, while a compact table displays current trend strength as a progress bar. This segmented approach reduces noise from intra-period fluctuations, offering clearer signals for trend persistence compared to standard RSI on lower timeframes.
Motivation: Why this design?
Standard RSI often generates erratic signals in choppy markets due to constant recalculation over fixed lookback periods, leading to false reversals that mislead traders during range-bound or volatile phases. By resetting the RSI accumulation at higher timeframe boundaries, this indicator aligns momentum assessment with broader market cycles, capturing sustained directional bias more reliably. It addresses the gap between short-term noise and long-term trends, helping users filter entries without over-relying on absolute overbought or oversold thresholds.
What’s different vs. standard approaches?
- Baseline Reference: Diverges from the classic Wilder RSI, which uses a fixed-length exponential moving average of gains and losses across all bars.
- Architecture Differences:
- Segments momentum resets at higher timeframe changes, isolating calculations per period instead of continuous history.
- Employs persistent sums for ups and downs within segments, with on-the-fly RSI derivation and EMA smoothing.
- Integrates switch detection logic that clears prior visuals on reversal, preventing clutter from outdated alerts.
- Adds overlay projections like horizontal price lines and dynamic percent change trackers for immediate trade context.
- Practical Effect: Charts show discrete RSI endpoints for past segments alongside a curved running trace, making momentum evolution visually intuitive. Switches appear as clean, extendable overlays, reducing alert fatigue and highlighting only confirmed directional shifts, which aids in avoiding whipsaws during minor pullbacks.
How it works (technical)
The indicator begins by detecting changes in the specified higher timeframe, such as a new daily bar, to define segment boundaries. At each boundary, it finalizes the prior segment's RSI by summing positive and negative price changes over that period and derives the value from the ratio of those sums, then applies an exponential moving average for smoothing. Within the active segment, it accumulates ongoing ups and downs from price changes relative to the source, recalculating the running RSI similarly and smoothing it with the same EMA length.
Points for the running RSI are collected into an array starting from the segment's onset, forming a curved polyline once sufficient bars accumulate. Comparisons between the running RSI and the last completed segment's value determine the current direction as long, short, or neutral, with switches triggering deletions of old visuals and creation of new ones: a label at the RSI pane, a vertical dashed line across the RSI range, an emoji positioned via ATR offset on the price chart, a solid horizontal line at the switch price, a dashed line tracking current close, and a midpoint label for percent change from the switch.
Initialization occurs on the first bar by resetting accumulators, and visualization gates behind a minimum bar count since the segment start to avoid early instability. The trend strength table builds vertically with filled cells proportional to the rounded RSI value, colored by direction. All drawing objects update or extend on subsequent bars to reflect live progress.
Parameter Guide
EMA Length — Controls the smoothing applied to the running RSI; higher values increase lag but reduce noise. Default: 10. Trade-offs: Shorter settings heighten sensitivity for fast markets but risk more false switches; longer ones suit trending conditions for stability.
Source — Selects the price data for change calculations, typically close for standard momentum. Default: close. Trade-offs: Open or high/low may emphasize gaps, altering segment intensity.
Segment Timeframe — Defines the higher timeframe for segment resets, like daily for intraday charts. Default: D. Trade-offs: Shorter frames create more frequent but shorter segments; longer ones align with major cycles but delay resets.
Overbought Level — Sets the upper threshold for potential overbought conditions (currently unused in visuals). Default: 70. Trade-offs: Adjust for asset volatility; higher values delay bearish warnings.
Oversold Level — Sets the lower threshold for potential oversold conditions (currently unused in visuals). Default: 30. Trade-offs: Lower values permit deeper dips before signaling bullish potential.
Show Completed Label — Toggles labels at segment ends displaying final RSI. Default: true. Trade-offs: Enables historical review but can crowd charts on dense timeframes.
Plot Running Segment — Enables the curved polyline for live RSI trace. Default: true. Trade-offs: Visualizes intra-segment flow; disable for cleaner panes.
Running RSI as Label — Displays current running RSI as a forward-projected label on the last bar. Default: false. Trade-offs: Useful for quick reads; may overlap in tight scales.
Show Switch Label — Activates RSI pane labels on directional switches. Default: true. Trade-offs: Provides context; omit to minimize pane clutter.
Show Switch Line (RSI) — Draws vertical dashed lines across the RSI range at switches. Default: true. Trade-offs: Marks reversal bars clearly; extends both ways for reference.
Show Solid Overlay Line — Projects a horizontal line from switch price forward. Default: true. Trade-offs: Acts as dynamic support/resistance; wider lines enhance visibility.
Show Dashed Overlay Line — Tracks a dashed line from switch to current close. Default: true. Trade-offs: Shows price deviation; thinner for subtlety.
Show Percent Change Label — Midpoint label tracking percent move from switch. Default: true. Trade-offs: Quantifies progress; centers dynamically.
Show Trend Strength Table — Displays right-side table with direction header and RSI bar. Default: true. Trade-offs: Instant strength gauge; fixed position avoids overlap.
Activate Visualization After N Bars — Delays signals until this many bars into a segment. Default: 3. Trade-offs: Filters immature readings; higher values miss early momentum.
Segment End Label — Color for completed RSI labels. Default: 7E57C2. Trade-offs: Purple tones for finality.
Running RSI — Color for polyline and running elements. Default: yellow. Trade-offs: Bright for live tracking.
Long — Color for bullish switch visuals. Default: green. Trade-offs: Standard for uptrends.
Short — Color for bearish switch visuals. Default: red. Trade-offs: Standard for downtrends.
Solid Line Width — Thickness of horizontal overlay line. Default: 2. Trade-offs: Bolder for emphasis on key levels.
Dashed Line Width — Thickness of tracking and vertical lines. Default: 1. Trade-offs: Finer to avoid dominance.
Reading & Interpretation
Completed segment RSIs appear as static points or labels in purple, indicating the fixed momentum at period close—values drifting toward the upper half suggest building strength, while lower half implies weakness. The yellow curved polyline traces the live smoothed RSI within the current segment, rising for accumulating gains and falling for losses. Directional labels and lines in green or red flag switches: green for running momentum exceeding the prior segment's, signaling potential uptrend continuation; red for the opposite.
The right table's header colors green for long, red for short, or gray for neutral/wait, with filled purple bars scaling from bottom (low RSI) to top (high), topped by the numeric value. Overlay elements project from switch bars: the solid green/red line as a price anchor, dashed tracker showing pullback extent, and percent label quantifying deviation—positive for alignment with direction, negative for counter-moves. Emojis (up arrow for long, down for short) float above/below price via ATR spacing for quick chart scans.
Practical Workflows & Combinations
- Trend Following: Enter long on green switch confirmation after a higher high in structure; filter with table strength above midpoint for conviction. Pair with volume surge for added weight.
- Exits/Stops: Trail stops to the solid overlay line on pullbacks; exit if percent change reverses beyond 2 percent against direction. Use wait bars to confirm without chasing.
- Multi-Asset/Multi-TF: Defaults suit forex/stocks on 1H-4H with daily segments; for crypto, shorten EMA to 5 for volatility. Scale segment TF to weekly for daily charts across indices.
- Combinations: Overlay on EMA clouds for confluence—switch aligning with cloud break strengthens signal. Add volatility filters like ATR bands to debounce in low-volume regimes.
Behavior, Constraints & Performance
Signals confirm on bar close within segments, with running polyline updating live but gated by minimum bars to prevent flicker. Higher timeframe changes may introduce minor repaints on timeframe switches, mitigated by relying on confirmed HTF closes rather than intrabar peeks. Resource limits cap at 500 labels/lines and 50 polylines, pruning old objects on switches to stay efficient; no explicit loops, but array growth ties to segment length—suitable for up to 500-bar histories without lag.
Known limits include delayed visualization in short segments and insensitivity to overbought/oversold levels, as thresholds are inputted but not actively visualized. Gaps in source data reset accumulators prematurely, potentially skewing early RSI.
Sensible Defaults & Quick Tuning
Start with EMA length 10, daily segments, and 3-bar wait for balanced responsiveness on hourly charts. For excessive switches in ranging markets, increase wait bars to 5 or EMA to 14 to dampen noise. If signals lag in trends, drop EMA to 5 and use 1H segments. For stable assets like indices, widen to weekly segments; tune colors for dark/light themes without altering logic.
What this indicator is—and isn’t
This tool serves as a momentum visualization and switch detector layered over price action, aiding trend identification and confirmation in segmented contexts. It is not a standalone trading system, predictive model, or risk calculator—always integrate with broader analysis, position sizing, and stop-loss discipline. View it as an enhancement for discretionary setups, not automated alerts without validation.
Disclaimer
The content provided, including all code and materials, is strictly for educational and informational purposes only. It is not intended as, and should not be interpreted as, financial advice, a recommendation to buy or sell any financial instrument, or an offer of any financial product or service. All strategies, tools, and examples discussed are provided for illustrative purposes to demonstrate coding techniques and the functionality of Pine Script within a trading context.
Any results from strategies or tools provided are hypothetical, and past performance is not indicative of future results. Trading and investing involve high risk, including the potential loss of principal, and may not be suitable for all individuals. Before making any trading decisions, please consult with a qualified financial professional to understand the risks involved.
By using this script, you acknowledge and agree that any trading decisions are made solely at your discretion and risk.
Do not use this indicator on Heikin-Ashi, Renko, Kagi, Point-and-Figure, or Range charts, as these chart types can produce unrealistic results for signal markers and alerts.
Best regards and happy trading
Chervolino

Relative Volume (Multi-TF, D, W, M)Relative Volume (Multi-TF, Candle-Matched Colors)
This indicator measures Relative Volume (RVOL) — the ratio of current volume to average historical volume — across any higher timeframe (Daily, Weekly, or Monthly) and displays it as color-coded columns that match the candle colors of the chart you’re viewing.
RVOL reveals how active today’s market participation is compared to its typical rhythm.
RVOL = 1.0 → normal volume
>1.5 → rising interest
>2.0–3.0 → strong institutional participation
>5.0 → climax or exhaustion levels
Features
Works on any chart timeframe while computing RVOL from your chosen higher timeframe (e.g., show Daily RVOL while trading on a 5-minute chart).
Column colors automatically match your chart’s candle colors (green/red/neutral).
Adjustable lookback period (len) and selectable source timeframe (D, W, or M).
Pre-drawn horizontal guide levels at 1.0, 1.2, 1.5, 2, 3, and 5 for quick interpretation.
Compatible with all chart types, including Heikin Ashi or custom color schemes.
Typical Use
Swing trading:
Look for quiet bases where RVOL stays 0.4–0.9, then expansion ≥2 on breakout days.
Confirm follow-through when green days keep RVOL ≥1.2–1.5 and red pullbacks stay below 1.0.
Day trading:
Watch intraday RVOL (on 1–5m charts) for bursts ≥2 that sustain for several bars — this signals crowd engagement and valid momentum.
Interpretation Summary
RVOL Value Meaning Typical Action
0.4–0.9 Quiet base / low interest Watch for setup
1.0 Normal activity Neutral
1.2–1.5 Valid participation Early confirmation
2–3 Strong expansion Momentum / breakout
≥5 Climax / exhaustion Take profits or avoid new entries
Author’s note:
RVOL isn’t directional; it tells how many players are active, not who’s winning. Combine it with structure (levels, VWAP, or trend) to see when the market crowd truly commits.

Zero Lag Trend Signals (MTF) [Quant Trading] V7Overview
The Zero Lag Trend Signals (MTF) V7 is a comprehensive trend-following strategy that combines Zero Lag Exponential Moving Average (ZLEMA) with volatility-based bands to identify high-probability trade entries and exits. This strategy is designed to reduce lag inherent in traditional moving averages while incorporating dynamic risk management through ATR-based stops and multiple exit mechanisms.
This is a longer term horizon strategy that takes limited trades. It is not a high frequency trading and therefore will also have limited data and not > 100 trades.
How It Works
Core Signal Generation:
The strategy uses a Zero Lag EMA (ZLEMA) calculated by applying an EMA to price data that has been adjusted for lag:
Calculate lag period: floor((length - 1) / 2)
Apply lag correction: src + (src - src )
Calculate ZLEMA: EMA of lag-corrected price
Volatility bands are created using the highest ATR over a lookback period multiplied by a band multiplier. These bands are added to and subtracted from the ZLEMA line to create upper and lower boundaries.
Trend Detection:
The strategy maintains a trend variable that switches between bullish (1) and bearish (-1):
Long Signal: Triggers when price crosses above ZLEMA + volatility band
Short Signal: Triggers when price crosses below ZLEMA - volatility band
Optional ZLEMA Trend Confirmation:
When enabled, this filter requires ZLEMA to show directional momentum before entry:
Bullish Confirmation: ZLEMA must increase for 4 consecutive bars
Bearish Confirmation: ZLEMA must decrease for 4 consecutive bars
This additional filter helps avoid false signals in choppy or ranging markets.
Risk Management Features:
The strategy includes multiple stop-loss and take-profit mechanisms:
Volatility-Based Stops: Default stop-loss is placed at ZLEMA ± volatility band
ATR-Based Stops: Dynamic stop-loss calculated as entry price ± (ATR × multiplier)
ATR Trailing Stop: Ratcheting stop-loss that follows price but never moves against position
Risk-Reward Profit Target: Take-profit level set as a multiple of stop distance
Break-Even Stop: Moves stop to entry price after reaching specified R:R ratio
Trend-Based Exit: Closes position when price crosses EMA in opposite direction
Performance Tracking:
The strategy includes optional features for monitoring and analyzing trades:
Floating Statistics Table: Displays key metrics including win rate, GOA (Gain on Account), net P&L, and max drawdown
Trade Log Labels: Shows entry/exit prices, P&L, bars held, and exit reason for each closed trade
CSV Export Fields: Outputs trade data for external analysis
Default Strategy Settings
Commission & Slippage:
Commission: 0.1% per trade
Slippage: 3 ticks
Initial Capital: $1,000
Position Size: 100% of equity per trade
Main Calculation Parameters:
Length: 70 (range: 70-7000) - Controls ZLEMA calculation period
Band Multiplier: 1.2 - Adjusts width of volatility bands
Entry Conditions (All Disabled by Default):
Use ZLEMA Trend Confirmation: OFF - Requires ZLEMA directional momentum
Re-Enter on Long Trend: OFF - Allows multiple entries during sustained trends
Short Trades:
Allow Short Trades: OFF - Strategy is long-only by default
Performance Settings (All Disabled by Default):
Use Profit Target: OFF
Profit Target Risk-Reward Ratio: 2.0 (when enabled)
Dynamic TP/SL (All Disabled by Default):
Use ATR-Based Stop-Loss & Take-Profit: OFF
ATR Length: 14
Stop-Loss ATR Multiplier: 1.5
Profit Target ATR Multiplier: 2.5
Use ATR Trailing Stop: OFF
Trailing Stop ATR Multiplier: 1.5
Use Break-Even Stop-Loss: OFF
Move SL to Break-Even After RR: 1.5
Use Trend-Based Take Profit: OFF
EMA Exit Length: 9
Trade Data Display (All Disabled by Default):
Show Floating Stats Table: OFF
Show Trade Log Labels: OFF
Enable CSV Export: OFF
Trade Label Vertical Offset: 0.5
Backtesting Date Range:
Start Date: January 1, 2018
End Date: December 31, 2069
Important Usage Notes
Default Configuration: The strategy operates in its most basic form with default settings - using only ZLEMA crossovers with volatility bands and volatility-based stop-losses. All advanced features must be manually enabled.
Stop-Loss Priority: If multiple stop-loss methods are enabled simultaneously, the strategy will use whichever condition is hit first. ATR-based stops override volatility-based stops when enabled.
Long-Only by Default: Short trading is disabled by default. Enable "Allow Short Trades" to trade both directions.
Performance Monitoring: Enable the floating stats table and trade log labels to visualize strategy performance during backtesting.
Exit Mechanisms: The strategy can exit trades through multiple methods: stop-loss hit, take-profit reached, trend reversal, or trailing stop activation. The trade log identifies which exit method was used.
Re-Entry Logic: When "Re-Enter on Long Trend" is enabled with ZLEMA trend confirmation, the strategy can take multiple long positions during extended uptrends as long as all entry conditions remain valid.
Capital Efficiency: Default setting uses 100% of equity per trade. Adjust "default_qty_value" to manage position sizing based on risk tolerance.
Realistic Backtesting: Strategy includes commission (0.1%) and slippage (3 ticks) to provide realistic performance expectations. These values should be adjusted based on your broker and market conditions.
Recommended Use Cases
Trending Markets: Best suited for markets with clear directional moves where trend-following strategies excel
Medium to Long-Term Trading: The default length of 70 makes this strategy more appropriate for swing trading rather than scalping
Risk-Conscious Traders: Multiple stop-loss options allow traders to customize risk management to their comfort level
Backtesting & Optimization: Comprehensive performance tracking features make this strategy ideal for testing different parameter combinations
Limitations & Considerations
Like all trend-following strategies, performance may suffer in choppy or ranging markets
Default 100% position sizing means full capital exposure per trade - consider reducing for conservative risk management
Higher length values (70+) reduce signal frequency but may improve signal quality
Multiple simultaneous risk management features may create conflicting exit signals
Past performance shown in backtests does not guarantee future results
Customization Tips
For more aggressive trading:
Reduce length parameter (minimum 70)
Decrease band multiplier for tighter bands
Enable short trades
Use lower profit target R:R ratios
For more conservative trading:
Increase length parameter
Enable ZLEMA trend confirmation
Use wider ATR stop-loss multipliers
Enable break-even stop-loss
Reduce position size from 100% default
For optimal choppy market performance:
Enable ZLEMA trend confirmation
Increase band multiplier
Use tighter profit targets
Avoid re-entry on trend continuation
Visual Elements
The strategy plots several elements on the chart:
ZLEMA line (color-coded by trend direction)
Upper and lower volatility bands
Long entry markers (green triangles)
Short entry markers (red triangles, when enabled)
Stop-loss levels (when positions are open)
Take-profit levels (when enabled and positions are open)
Trailing stop lines (when enabled and positions are open)
Optional ZLEMA trend markers (triangles at highs/lows)
Optional trade log labels showing complete trade information
Exit Reason Codes (for CSV Export)
When CSV export is enabled, exit reasons are coded as:
0 = Manual/Other
1 = Trailing Stop-Loss
2 = Profit Target
3 = ATR Stop-Loss
4 = Trend Change
Conclusion
Zero Lag Trend Signals V7 provides a robust framework for trend-following with extensive customization options. The strategy balances simplicity in its core logic with sophisticated risk management features, making it suitable for both beginner and advanced traders. By reducing moving average lag while incorporating volatility-based signals, it aims to capture trends earlier while managing risk through multiple configurable exit mechanisms.
The modular design allows traders to start with basic trend-following and progressively add complexity through ZLEMA confirmation, multiple stop-loss methods, and advanced exit strategies. Comprehensive performance tracking and export capabilities make this strategy an excellent tool for systematic testing and optimization.
Note: This strategy is provided for educational and backtesting purposes. All trading involves risk. Past performance does not guarantee future results. Always test thoroughly with paper trading before risking real capital, and adjust position sizing and risk parameters according to your risk tolerance and account size.
================================================================================
TAGS:
================================================================================
trend following, ZLEMA, zero lag, volatility bands, ATR stops, risk management, swing trading, momentum, trend confirmation, backtesting
================================================================================
CATEGORY:
================================================================================
Strategies
================================================================================
CHART SETUP RECOMMENDATIONS:
================================================================================
For optimal visualization when publishing:
Use a clean chart with no other indicators overlaid
Select a timeframe that shows multiple trade signals (4H or Daily recommended)
Choose a trending asset (crypto, forex major pairs, or trending stocks work well)
Show at least 6-12 months of data to demonstrate strategy across different market conditions
Enable the floating stats table to display key performance metrics
Ensure all indicator lines (ZLEMA, bands, stops) are clearly visible
Use the default chart type (candlesticks) - avoid Heikin Ashi, Renko, etc.
Make sure symbol information and timeframe are clearly visible
================================================================================
COMPLIANCE NOTES:
================================================================================
✅ Open-source publication with complete code visibility
✅ English-only title and description
✅ Detailed explanation of methodology and calculations
✅ Realistic commission (0.1%) and slippage (3 ticks) included
✅ All default parameters clearly documented
✅ Performance limitations and risks disclosed
✅ No unrealistic claims about performance
✅ No guaranteed results promised
✅ Appropriate for public library (original trend-following implementation with ZLEMA)
✅ Educational disclaimers included
✅ All features explained in detail
================================================================================

Holt Damped Forecast [CHE]A Friendly Note on These Pine Script Scripts
Hey there! Just wanted to share a quick, heartfelt heads-up: All these Pine Script examples come straight from my own self-study adventures as a total autodidact—think late nights tinkering and learning on my own. They're purely for educational vibes, helping me (and hopefully you!) get the hang of Pine Script basics, cool indicators, and building simple strategies.
That said, please know this isn't any kind of financial advice, investment nudge, or pro-level trading blueprint. I'd love for you to dive in with your own research, run those backtests like a champ, and maybe bounce ideas off a qualified expert before trying anything in a real trading setup. No guarantees here on performance or spot-on accuracy—trading's got its risks, and those are totally on each of us.
Let's keep it fun and educational—happy coding! 😊
Holt Damped Forecast — Damped trend forecasts with fan bands for uncertainty visualization and momentum integration
Summary
This indicator applies damped exponential smoothing to generate forward price forecasts, displaying them as probabilistic fan bands to highlight potential ranges rather than point estimates. It incorporates residual-based uncertainty to make projections more reliable in varying market conditions, reducing overconfidence in strong trends. Momentum from the trend component is shown in an optional label alongside signals, aiding quick assessment of direction and strength without relying on lagging oscillators.
Motivation: Why this design?
Standard exponential smoothing often extrapolates trends indefinitely, leading to unrealistic forecasts during mean reversion or weakening momentum. This design uses damping to gradually flatten long-term projections, better suiting real markets where trends fade. It addresses the need for visual uncertainty in forecasts, helping traders avoid entries based on overly optimistic point predictions.
What’s different vs. standard approaches?
- Reference baseline: Diverges from basic Holt's linear exponential smoothing, which assumes persistent trends without decay.
- Architecture differences:
- Adds damping to the trend extrapolation for finite-horizon realism.
- Builds fan bands from historical residuals for probabilistic ranges at multiple confidence levels.
- Integrates a dynamic label combining forecast details, scaled momentum, and directional signals.
- Applies tail background coloring to recent bars based on forecast direction for immediate visual cues.
- Practical effect: Charts show converging forecast bands over time, emphasizing shorter horizons where accuracy is higher. This visibly tempers aggressive projections in trends, making it easier to spot when uncertainty widens, which signals potential reversals or consolidation.
How it works (technical)
The indicator maintains two persistent components: a level tracking the current price baseline and a trend capturing directional slope. On each bar, the level updates by blending the current source price with a one-step-ahead expectation from the prior level and damped trend. The trend then adjusts by weighting the change in level against the prior damped trend. Forecasts extend this forward over a user-defined number of steps, with damping ensuring the trend influence diminishes over distance.
Uncertainty derives from the standard deviation of historical residuals—the differences between actual prices and one-step expectations—scaled by the damping structure for the forecast horizon. Bands form around the median forecast at specified confidence intervals using these scaled errors. Initialization seeds the level to the first bar's price and trend to zero, with persistence handling subsequent updates. A security call fetches the last bar index for tail logic, using lookahead to align with realtime but introducing minor repaint on unconfirmed bars.
Parameter Guide
The Source parameter selects the price input for level and residual calculations, defaulting to close; consider using high or low for assets sensitive to volatility, as close works well for most trend-following setups. Forecast Steps (h) defines the number of bars ahead for projections, defaulting to 4—shorter values like 1 to 5 suit intraday trading, while longer ones may widen bands excessively in choppy conditions. The Color Scheme (2025 Trends) option sets the base, up, and down colors for bands, labels, and backgrounds, starting with Ruby Dawn; opt for serene schemes on clean charts or vibrant ones to stand out in dark themes.
Level Smoothing α controls the responsiveness of the price baseline, defaulting to 0.3—values above 0.5 enhance tracking in fast markets but may amplify noise, whereas lower settings filter disturbances better. Trend Smoothing β adjusts sensitivity to slope changes, at 0.1 by default; increasing to 0.2 helps detect emerging shifts quicker, but keeping it low prevents whipsaws in sideways action. Damping φ (0..1) governs trend persistence, defaulting to 0.8—near 0.9 preserves carryover in sustained moves, while closer to 0.5 curbs overextensions more aggressively.
Show Fan Bands (50/75/95) toggles the probabilistic range display, enabled by default; disable it in oscillator panes to reduce clutter, but it's key for overlay forecasts. Residual Window (Bars) sets the length for deviation estimates, at 400 bars initially—100 to 200 works for short timeframes, and 500 or more adds stability over extended histories. Line Width determines the thickness of band and median lines, defaulting to 2; go thicker at 3 to 5 for emphasis on higher timeframes or thinner for layered indicators.
Show Median/Forecast Line reveals the central projection, on by default—hide if bands provide enough detail, or keep for pinpoint entry references. Show Integrated Label activates the combined view of forecast, momentum, and signal, defaulting to true; it's right-aligned for convenience, so turn it off on smaller screens to save space. Show Tail Background colors the last few bars by forecast direction, enabled initially; pair low transparency for subtle hints or higher for bolder emphasis.
Tail Length (Bars) specifies bars to color backward from the current one, at 3 by default—1 to 2 fits scalping, while 5 or more underscores building momentum. Tail Transparency (%) fades the background intensity, starting at 80; 50 to 70 delivers strong signals, and 90 or above allows seamless blending. Include Momentum in Label adds the scaled trend value, defaulting to true—ATR% scaling here offers relative strength context across assets.
Include Long/Short/Neutral Signal in Label displays direction from the trend sign, on by default; neutral helps in ranging markets, though it can be overlooked during strong trends. Scaling normalizes momentum output (raw, ATR-relative, or level-relative), set to ATR% initially—ATR% ensures cross-asset comparability, while %Level provides percentage perspectives. ATR Length defines the period for true range averaging in scaling, at 14; align it with your chart timeframe or shorten for quicker volatility responses.
Decimals sets precision in the momentum label, defaulting to 2—0 to 1 yields clean integers, and 3 or more suits detailed forex views. Show Zero-Cross Markers places arrows at direction changes, enabled by default; keep size small to minimize clutter, with text labels for fast scanning.
Reading & Interpretation
Fan bands expand outward from the current bar, with the median line as the central forecast—narrower bands indicate lower uncertainty, wider suggest caution. Colors tint up (positive forecast vs. prior level) in the scheme's up hue and down otherwise. The optional label lists the horizon, median, and range brackets at 50%, 75%, and 95% levels, followed by momentum (scaled per mode) and signal (Long if positive trend, Short if negative, Neutral if zero). Zero-cross arrows mark trend flips: upward triangle below bar for bullish cross, downward above for bearish. Tail background reinforces the forecast direction on recent bars.
Practical Workflows & Combinations
- Trend following: Enter long on upward zero-cross if median forecast rises above price and bands contain it; confirm with higher highs/lows. Short on downward cross with falling median.
- Exits/Stops: Trail stops below 50% lower band in longs; exit if momentum drifts negative or signal turns neutral. Use wider bands (75/95%) for conservative holds in volatile regimes.
- Multi-asset/Multi-TF: Defaults work across stocks, forex, crypto on 5m-1D; scale steps by TF (e.g., 10+ on daily). Layer with volume or structure tools—avoid over-reliance on isolated crosses.
Behavior, Constraints & Performance
Closed-bar logic ensures stable historical plots, but realtime updates via security lookahead may shift forecasts until bar confirmation, introducing minor repaint on the last bar. No explicit HTF calls beyond bar index fetch, minimizing gaps but watch for low-liquidity assets. Resources include a 2000-bar lookback for residuals and up to 500 labels, with no loops—efficient for most charts. Known limits: Early bars show wide bands due to sparse residuals; assumes stationary errors, so gaps or regime shifts widen inaccuracies.
Sensible Defaults & Quick Tuning
Start with defaults for balanced smoothing on 15m-4H charts. For choppy conditions (too many crosses), lower β to 0.05 and raise residual window to 600 for stability. In trending markets (sluggish signals), increase α/β to 0.4/0.2 and shorten steps to 2. If bands overexpand, boost φ toward 0.95 to preserve trend carry. Tune colors for theme fit without altering logic.
What this indicator is—and isn’t
This is a visualization and signal layer for damped forecasts and momentum, complementing price action analysis. It isn’t a standalone system—pair with risk rules and broader context. Not predictive beyond the horizon; use for confirmation, not blind entries.
Disclaimer
The content provided, including all code and materials, is strictly for educational and informational purposes only. It is not intended as, and should not be interpreted as, financial advice, a recommendation to buy or sell any financial instrument, or an offer of any financial product or service. All strategies, tools, and examples discussed are provided for illustrative purposes to demonstrate coding techniques and the functionality of Pine Script within a trading context.
Any results from strategies or tools provided are hypothetical, and past performance is not indicative of future results. Trading and investing involve high risk, including the potential loss of principal, and may not be suitable for all individuals. Before making any trading decisions, please consult with a qualified financial professional to understand the risks involved.
By using this script, you acknowledge and agree that any trading decisions are made solely at your discretion and risk.
Do not use this indicator on Heikin-Ashi, Renko, Kagi, Point-and-Figure, or Range charts, as these chart types can produce unrealistic results for signal markers and alerts.
Best regards and happy trading
Chervolino

PM Range Breaker [CHE] PM Range Breaker — Premarket bias with first-five range breaks, optional SWDEMA regime latch, and simple two-times-range targets
Summary
This indicator sets a once-per-day directional bias during New York premarket and then tracks a strict first-five-minutes range from the session open. After the first five complete, it marks clean breakouts and can project targets at two times the measured range. A second mode latches an EMA-based regime to inform the bias and optional background tinting. A compact panel reports live state, first-five levels, and rolling hit rates of both bias modes using a user-defined midday close for statistics.
Motivation: Why this design?
Intraday traders often get whipsawed by early noise or by fast flips in trend filters. This script commits to a bias at a single premarket minute and then waits for the market to present an objective structure: the first-five range. Breaks after that window are clearer and easier to manage. The alternative SWDEMA regime gives a slower, latched context for users who prefer a trend scaffold rather than a midpoint reference.
What’s different vs. standard approaches?
Baseline: Typical open-range-breakout lines or a single moving-average filter without daily commitment.
Architecture differences:
Bias decision at a fixed New York time using either a midpoint lookback (“Classic”) or a two-EMA regime latch (“SWDEMA”).
Strict five-minute window from session open; breakout shapes print only after that window.
Single-shot breakout direction per session (debounce) and optional two-times-range targets.
On-chart panel with hit rates using a configurable midday close for statistics.
Practical effect: Cleaner visuals, fewer repeated signals, and a traceable daily decision that can be evaluated over time.
How it works (technical)
Time handling uses New York session times for premarket decision, open, first-five end, and a midday statistics checkpoint.
Classic bias: A midpoint is computed from the highest and lowest over a user period; at the premarket minute, the bias is set long when the close is above the midpoint, short otherwise.
SWDEMA bias: Two EMAs define a regime score that requires price and trend agreement; when both agree on a confirmed bar, the regime latches. At the premarket minute, the daily bias is set from the current regime.
The first-five range captures high and low from open until the end minute, then freezes. Breakouts are detected after that window using close-based cross logic.
The script draws range lines and optional targets at two times the frozen range. A session break direction latch prevents duplicate break markers.
Statistics compare daily open and a configurable midday close to record if the chosen bias aligned with the move.
Optional elements include EMA lines, midpoint line, latched-regime background, and regime switch markers.
Data aggregation for day logic and the first-five window is sampled on one-minute data with explicit lookahead off. On charts above one minute, values update intra-bar until the underlying minute closes.
Parameter Guide
Premarket Start (NY) — Minute when the bias is decided — Default: 08:30 — Move earlier for more stability; later for recency.
Market Open (NY) — Session start used for the first-five window — Default: 09:30 — Align to instrument’s RTH if different.
First-5 End (NY) — End of the first-five window — Default: 09:35 — Extend slightly to capture wider opening ranges.
Day End (NY) for Stats — Midday checkpoint for hit rate — Default: 12:00 — Use a later time for a longer evaluation window.
Show First-5 Lines — Draw the frozen range lines — Default: On — Turn off if your chart is crowded.
Show Bias Background (Session) — Tint by daily bias during session — Default: On — Useful for directional context.
Show Break Shapes — Print breakout triangles — Default: On — Disable if you only want lines and alerts.
Show 2R Targets (Optional) — Plot targets at two times the range — Default: On — Switch off if you manage exits differently.
Line Length Right — Extension length of drawn lines — Default: 20 (bars) — Increase for slower timeframes.
High/Low Line Colors — Visual colors for range levels — Defaults: Green/Red — Adjust to your theme.
Long/Short Bias Colors — Background tints — Defaults: Green/Red with high transparency — Lower transparency for stronger emphasis.
Show Corner Panel — Enable the info panel — Default: On — Centralizes status and numbers.
Show Hit Rates in Panel — Include success rates — Default: On — Turn off to reduce panel rows.
Panel Position — Anchor on chart — Default: Top right — Move to avoid overlap.
Panel Size — Text size in panel — Default: Small — Increase on high-resolution displays.
Dark Panel — Dark theme for the panel — Default: On — Match your chart background.
Show EMA Lines — Plot blue and red EMAs — Default: Off — Enable for SWDEMA context.
Show Midpoint Line — Plot the midpoint — Default: Off — Useful for Classic mode visualization.
Midpoint Lookback Period — Bars for high-low midpoint — Default: 300 — Larger values stabilize; smaller values respond faster.
Midpoint Line Color — Color for midpoint — Default: Gray — A neutral line works best.
SWDEMA Lengths (Blue/Red) — Periods for the two EMAs — Defaults: 144 and 312 — Longer values reduce flips.
Sources (Blue/Red) — Price sources — Defaults: Close and HLC3 — Adjust if you prefer consistency.
Offsets (Blue/Red) — Pixel offsets for EMA plots — Defaults: zero — Use only for visual shift.
Show Latched Regime Background — Background by SWDEMA regime — Default: Off — Separate from session bias.
Latched Background Transparency — Opacity of regime background — Default: eighty-eight — Lower value for stronger tint.
Show Latch Switch Markers — Plot regime change markers — Default: Off — For auditing regime changes.
Bias Mode — Classic midpoint or SWDEMA latch — Default: Classic — Choose per your style.
Background Mode — Session bias or SWDEMA regime — Default: Session — Decide which background narrative you want.
Reading & Interpretation
Panel: Shows the active bias, first-five high and low, and a state that reads Building during the window, Ready once frozen, and Break arrows when a breakout occurs. Hit rates show the percentage of days where each bias mode aligned with the midday move.
Colors and shapes: Green background implies long bias; red implies short bias. Triangle markers denote the first valid breakout after the first-five window. Optional regime markers flag regime changes.
Lines: First-five high and low form the core structure. Optional targets mark a level at two times the frozen range from the breakout side.
Practical Workflows & Combinations
Trend following: Choose a bias mode. Wait for the first clean breakout after the first-five window in the direction of the bias. Confirm with structure such as higher highs and higher lows or lower highs and lower lows.
Exits and risk: Conservative users can trail behind the opposite side of the first-five range. Aggressive users can scale near the two-times-range target.
Multi-asset and multi-TF: Works well on intraday timeframes from one minute upward. For non-US sessions, adjust the time inputs to the instrument’s regular trading hours.
Behavior, Constraints & Performance
Repaint and confirmation: Bias and regime decisions use confirmed bars. Breakout signals evaluate on bar close at the chart timeframe. On higher timeframes, minute-based sources update within the live bar until the minute closes.
security and HTF: The script samples one-minute data. Lookahead is off. Values stabilize once the source minute closes.
Resources: `max_bars_back` is five thousand. Drawing objects and the panel update efficiently, with position extensions handled on the last bar.
Known limits: Midday statistics use the configured time, not the official daily close. Session logic assumes New York session timing. Targets are simple multiples of the first-five range and do not adapt to volatility beyond that structure.
Sensible Defaults & Quick Tuning
Start with Classic bias, midpoint lookback at three hundred, and all visuals on.
Too many flips in context → switch to SWDEMA mode or increase EMA lengths.
Breakouts feel noisy → extend the first-five end by a minute or two, or wait for a retest by your own rules.
Too sluggish → reduce midpoint lookback or shorten EMA lengths.
Chart cluttered → hide EMA or midpoint lines and keep only range levels and breakout shapes.
What this indicator is—and isn’t
This is a visualization and signal layer for session bias and first-five structure. It does not manage orders, position sizing, or risk. It is not predictive. Use it alongside market structure, execution rules, and independent risk controls.
Disclaimer
The content provided, including all code and materials, is strictly for educational and informational purposes only. It is not intended as, and should not be interpreted as, financial advice, a recommendation to buy or sell any financial instrument, or an offer of any financial product or service. All strategies, tools, and examples discussed are provided for illustrative purposes to demonstrate coding techniques and the functionality of Pine Script within a trading context.
Any results from strategies or tools provided are hypothetical, and past performance is not indicative of future results. Trading and investing involve high risk, including the potential loss of principal, and may not be suitable for all individuals. Before making any trading decisions, please consult with a qualified financial professional to understand the risks involved.
By using this script, you acknowledge and agree that any trading decisions are made solely at your discretion and risk.
Do not use this indicator on Heikin-Ashi, Renko, Kagi, Point-and-Figure, or Range charts, as these chart types can produce unrealistic results for signal markers and alerts.
Best regards and happy trading
Chervolino
Many thanks to LonesomeTheBlue
for the original work. I adapted the midpoint calculation for this script. www.tradingview.com

Pivot Regime Anchored VWAP [CHE] Pivot Regime Anchored VWAP — Detects body-based pivot regimes to classify swing highs and lows, anchoring volume-weighted average price lines directly at higher highs and lower lows for adaptive reference levels.
Summary
This indicator identifies shifts between top and bottom regimes through breakouts in candle body highs and lows, labeling swing points as higher highs, lower highs, lower lows, or higher lows. It then draws anchored volume-weighted average price lines starting from the most recent higher high and lower low, providing dynamic support and resistance that evolve with volume flow. These anchored lines differ from standard volume-weighted averages by resetting only at confirmed swing extremes, reducing noise in ranging markets while highlighting momentum shifts in trends.
Motivation: Why this design?
Traders often struggle with static reference lines that fail to adapt to changing market structures, leading to false breaks in volatile conditions or missed continuations in trends. By anchoring volume-weighted average price calculations to body pivot regimes—specifically at higher highs for resistance and lower lows for support—this design creates reference levels tied directly to price structure extremes. This approach addresses the problem of generic moving averages lagging behind swing confirmations, offering a more context-aware tool for intraday or swing trading.
What’s different vs. standard approaches?
- Baseline reference: Traditional volume-weighted average price indicators compute a running total from session start or fixed periods, often ignoring price structure.
- Architecture differences:
- Regime detection via body breakout logic switches between high and low focus dynamically.
- Anchoring limited to confirmed higher highs and lower lows, with historical recalculation for accurate line drawing.
- Polyline rendering rebuilds only on the last bar to manage performance.
- Practical effect: Charts show fewer, more meaningful lines that start at swing points, making it easier to spot confluences with structure breaks rather than cluttered overlays from continuous calculations.
How it works (technical)
The indicator first calculates the maximum and minimum of each candle's open and close to define body highs and lows. It then scans a lookback window for the highest body high and lowest body low. A top regime triggers when the body high from the lookback period exceeds the window's highest, and a bottom regime when the body low falls below the window's lowest. These regime shifts confirm pivots only when crossing from one state to the other.
For top pivots, it compares the new body high against the previous swing high: if greater, it marks a higher high and anchors a new line; otherwise, a lower high. The same logic applies inversely for bottom pivots. Anchored lines use cumulative price-volume products and volumes from the anchor bar onward, subtracting prior cumulatives to isolate the segment. On pivot confirmation, it loops backward from the current bar to the anchor, computing and storing points for the line. New points append as bars advance, ensuring the line reflects ongoing volume weighting.
Initialization uses persistent variables to track the last swing values and anchor bars, starting with neutral states. Data flows from regime detection to pivot classification, then to anchoring and point accumulation, with lines rendered globally on the final bar.
Parameter Guide
Pivot Length — Controls the lookback window for detecting body breakouts, influencing pivot frequency and sensitivity to recent action. Shorter values catch more pivots in choppy conditions; longer smooths for major swings. Default: 30 (bars). Trade-offs/Tips: Min 1; for intraday, try 10–20 to reduce lag but watch for noise; on daily, 50+ for stability.
Show Pivot Labels — Toggles display of text markers at swing points, aiding quick identification of higher highs, lower highs, lower lows, or higher lows. Default: true. Trade-offs/Tips: Disable in multi-indicator setups to declutter; useful for backtesting structure.
HH Color — Sets the line and label color for higher high anchored lines, distinguishing resistance levels. Default: Red (solid). Trade-offs/Tips: Choose contrasting hues for dark/light themes; pair with opacity for fills if added later.
LL Color — Sets the line and label color for lower low anchored lines, distinguishing support levels. Default: Lime (solid). Trade-offs/Tips: As above; green shades work well for bullish contexts without overpowering candles.
Reading & Interpretation
Higher high labels and red lines indicate potential resistance zones where volume weighting begins at a new swing top, suggesting sellers may defend prior highs. Lower low labels and lime lines mark support from a fresh swing bottom, with the line's slope reflecting buyer commitment via volume. Lower highs or higher lows appear as labels without new anchors, signaling possible range-bound action. Line proximity to price shows overextension; crosses may hint at regime shifts, but confirm with volume spikes.
Practical Workflows & Combinations
- Trend following: Enter longs above a rising lower low anchored line after higher low confirmation; filter with rising higher highs for uptrends. Use line breaks as trailing stops.
- Exits/Stops: In downtrends, exit shorts below a higher high line; set aggressive stops above it for scalps, conservative below for swings. Pair with momentum oscillators for divergence.
- Multi-asset/Multi-TF: Defaults suit forex/stocks on 1H–4H; on crypto 15M, shorten length to 15. Scale colors for dark themes; combine with higher timeframe anchors for confluence.
Behavior, Constraints & Performance
Closed-bar logic ensures pivots confirm after the lookback period, with no repainting on historical bars—live bars may adjust until regime shift. No higher timeframe calls, so minimal repaint risk beyond standard delays. Resources include a 2000-bar history limit, label/polyline caps at 200/50, and loops for historical point filling (up to current bar count from anchor, typically under 500 iterations). Known limits: In extreme gaps or low-volume periods, anchors may skew; lines absent until first pivots.
Sensible Defaults & Quick Tuning
Start with the 30-bar length for balanced pivot detection across most assets. For too-frequent pivots in ranges, increase to 50 for fewer signals. If lines lag in trends, reduce to 20 and enable labels for visual cues. In low-volatility assets, widen color contrasts; test on 100-bar history to verify stability.
What this indicator is—and isn’t
This is a structure-aware visualization layer for anchoring volume-weighted references at swing extremes, enhancing manual analysis of regimes and levels. It is not a standalone signal generator or predictive model—always integrate with broader context like order flow or news. Use alongside risk management and position sizing, not as isolated buy/sell triggers.
Many thanks to LuxAlgo for the original script "McDonald's Pattern ". The implementation for body pivots instead of wicks uses a = max(open, close), b = min(open, close) and then highest(a, length) / lowest(b, length). This filters noise from the wicks and detects breakouts over/under bodies. Unusual and targeted, super innovative.
Disclaimer
The content provided, including all code and materials, is strictly for educational and informational purposes only. It is not intended as, and should not be interpreted as, financial advice, a recommendation to buy or sell any financial instrument, or an offer of any financial product or service. All strategies, tools, and examples discussed are provided for illustrative purposes to demonstrate coding techniques and the functionality of Pine Script within a trading context.
Any results from strategies or tools provided are hypothetical, and past performance is not indicative of future results. Trading and investing involve high risk, including the potential loss of principal, and may not be suitable for all individuals. Before making any trading decisions, please consult with a qualified financial professional to understand the risks involved.
By using this script, you acknowledge and agree that any trading decisions are made solely at your discretion and risk.
Do not use this indicator on Heikin-Ashi, Renko, Kagi, Point-and-Figure, or Range charts, as these chart types can produce unrealistic results for signal markers and alerts.
Best regards and happy trading
Chervolino

NY 4H Wyckoff State Machine [CHE] NY 4H Wyckoff State Machine — Full (Re-Entry, Breakout, Wick, Re-Accum/Distrib, Dynamic Table) — One-Candle Wyckoff Re-Entry (OCWR)
Summary
OCWR operationalizes a one-candle session workflow: mark the first four-hour New York candle, fix its high and low as the session range when the window closes, and drive entries through a Wyckoff-style state machine on intraday bars. The script adds an ATR-scaled buffer around the range and requires multi-bar acceptance before treating breaks or re-entries as valid. Optional wick-cluster evidence, a proximity retest, and simple volume or RSI gates increase selectivity. Background tints expose regimes, shapes mark events, a dynamic table explains the current state, and hidden plots supply alert payloads. The design reduces random flips and makes state transitions auditable without higher-timeframe calls.
Origin and name
Method name: One-Candle Wyckoff Re-Entry (OCWR)
Transcript origin: The source idea is a “stupid simple one-candle scalping” routine: mark the first New York four-hour candle (commonly between one and five in the morning New York time), drop to five minutes, observe accumulation inside, wait for a manipulation move outside, then trade the re-entry back inside. Stops go beyond the excursion extreme; targets are either a fixed reward multiple or the opposite side of the range. Preference is given to several manipulation candles. This indicator codifies that workflow with explicit states, acceptance counters, buffers, and optional quality filters. Any external performance claims are not part of the code.
Motivation: Why this design?
Session levels are widely respected, yet single-bar breaches around them are noisy. OCWR separates range discovery from trade logic. It locks the range at the end of the window, applies an ATR-scaled buffer to ignore marginal oversteps, and requires acceptance over several bars for breaks and re-entries. Wick evidence and optional retest proximity help confirm that an excursion likely cleared liquidity rather than launched a trend. This yields cleaner transitions from test to commitment.
What’s different vs. standard approaches?
Baseline: Static session lines or one-shot Wyckoff tags without process control.
Architecture: Dual long and short state machines; ATR-buffered edges; multi-bar acceptance for breaks and re-entries; optional wick dominance and cluster checks; optional retest tolerance; direct and opposite breakout paths; cooldown after fires; distribution timeout; dynamic table with highlighted row.
Practical effect: Fewer single-bar head-fakes, clearer hand-offs, and on-chart explanations of the machine’s view.
Wyckoff structure by example — OCWR on five minutes
One-candle setup:
On the four-hour chart, mark the first New York candle’s high and low, then switch to five minutes. Solid lines show the fixed range; dashed lines show ATR-buffered edges.
Long path (verbal mapping):
Phase A, Stopping Action: Price stabilizes inside the range.
Phase B, Consolidation: Sustained balance while the window is closed and after the range is fixed.
Phase C, Test (Spring): Excursion below the buffered low with preference for several outside bars and dominant lower wicks, then a return inside.
Re-entry acceptance: A required run of inside bars validates the test.
Phase D, Breakout to Markup: Long signal fires; stop beyond the excursion extreme; objective is the opposite range or a fixed reward multiple.
Phase E, Trend (Markup) and Re-Accumulation: Advance continues until target, stop, confirmation back against the box, or timeout. A pause inside trend may register as re-accumulation.
Short path mirrors the above: A UTAD-style move forms above the buffered high, then re-entry leads to Markdown and possible re-distribution.
Variant map (verbal):
Accumulation after a downtrend: with Spring and Test, or without Spring; both proceed to Markup and may pause in Re-Accumulation.
Distribution after an uptrend: with UTAD and Test, or without UTAD; both proceed to Markdown and may pause in Re-Distribution.
Note: Phases A through E occur within each variant and are not separate variants.
How it works (technical)
Session window: A configurable four-hour New York window records its high and low. At window end, the bounds are fixed for the session.
ATR buffer: A margin above and below the fixed range discourages triggers from tiny oversteps.
Inside and outside: Users choose close-based or wick-based detection. Overshoot requirements are expressed verbally as a fraction of the range with an optional absolute minimum.
Manipulation tracking: The machine counts bars spent outside and records the side extreme.
Re-entry acceptance: After a return inside, a specified number of inside bars must print before acceptance.
Direct and opposite breakouts: Direct breakouts from accumulation and opposite breakouts after manipulation are supported, subject to acceptance and optional filters.
Targets and exits: Choose the opposite boundary or a fixed reward multiple. Distribution ends on target, stop, confirmation back against the range, or timeout.
Context filters (optional): Volume above a scaled SMA, RSI thresholds, and a trend SMA for simple regime context.
Diagnostics: Background tints for regimes; arrows for re-entries; triangles for breakouts; table with row highlights; hidden plots for alert values.
Central table (Wyckoff console)
The table sits top-right and explains the machine’s stance. Columns: Structure label, plain-English description, active state pair for long and short, and human phase tags. Rows: Start and range building; accumulation branch with Spring and Test as well as direct breakout; Markup and re-accumulation; distribution branch with UTAD and Test as well as direct short breakout; Markdown and re-distribution. Only the active state cell is rewritten each last bar, for example “L_ACCUM slash S_ACCUM”. Row highlighting is context-aware: accumulation, Spring or UTAD, breakout, Markup or Markdown, and re-accumulation or re-distribution checks can highlight independently so users see simultaneous conditions. The table is created once, updated only on the last bar for efficiency, and functions as a read-only console to audit why a signal fired and where the path currently sits.
Parameter Guide
Session window and time zone: First four hours of New York by default; time zone “America/New_York”.
ATR length and buffer factor: Control buffer size; larger reduces sensitivity, smaller reacts faster.
Minimum overshoot (fraction and absolute): Demand meaningful extension beyond the buffer.
Break mode: Close-based is stricter; wick-based is more reactive.
Acceptance counts: Separate counts for break, re-entry, and opposite breakout; higher values reduce noise.
Minimum bars outside: Ensures manipulation is not a single spike.
Wick detection and clusters (optional): Dominance thresholds and cluster size within a short window.
Retest required and tolerance (optional): Gate re-entry by proximity to the buffered edge.
Volume and RSI filters (optional): Simple gates on activity and momentum.
TP mode and reward multiple: Opposite range or fixed multiple.
Cooldown and distribution timeout: Rate-limit signals and prevent endless distribution.
Visualization toggles: Background phases, labels, table, and helper lines.
Reading & Interpretation
Solid lines are the fixed session bounds; dashed lines are buffers. Backgrounds tint accumulation, manipulation, and distribution. Arrows show accepted re-entries; triangles show direct or opposite breakouts. Labels can summarize entry, stop, target, and risk. The table highlights the active row and the current state pair.
Practical Workflows & Combinations
OCWR baseline: Each morning, mark the New York four-hour candle, move to five minutes, prefer multi-bar manipulation outside, then wait for a qualified re-entry inside. Stop beyond the excursion extreme. Target the opposite range for conservative management or a fixed multiple for uniform sizing.
Trend following: Favor direct breakouts with trend alignment and no contradictory wick evidence.
Quality control: When noise rises, increase acceptance, raise the buffer factor, enable retest, and require wick clusters.
Discretionary confluences: Fair-value gaps and trend lines can be added by the user; they are not computed by this script.
Behavior, Constraints & Performance
Closed-bar confirmation is recommended when you require finality; live-bar conditions can change until close. The script does not call higher-timeframe data. It uses arrays, lines, labels, boxes, and a table; maximum bars back is five thousand; table updates are last-bar only. Known limits include compressed buffers in quiet sessions, unreliable wick evidence in thin markets, and session misalignment if the platform time zone is not New York.
Sensible Defaults & Quick Tuning
Start with ATR length fourteen, buffer factor near zero point fifteen, overshoot fraction near zero point ten, acceptance counts of two, minimum outside duration three, retest required on.
Too many flips: increase acceptance, raise buffer, enable retest, and tighten wick thresholds.
Too slow: reduce acceptance, lower buffer, switch to wick-based breaks, disable retest.
Noisy wicks: increase minimum wick ratio and cluster size, or disable wick detection.
What this indicator is—and isn’t
A session-anchored visualization and signal layer that formalizes a Wyckoff-style re-entry and breakout workflow derived from a single four-hour New York candle. It is not predictive and not a complete trading system. Use with structure analysis, risk controls, and position management.
Disclaimer
The content provided, including all code and materials, is strictly for educational and informational purposes only. It is not intended as, and should not be interpreted as, financial advice, a recommendation to buy or sell any financial instrument, or an offer of any financial product or service. All strategies, tools, and examples discussed are provided for illustrative purposes to demonstrate coding techniques and the functionality of Pine Script within a trading context.
Any results from strategies or tools provided are hypothetical, and past performance is not indicative of future results. Trading and investing involve high risk, including the potential loss of principal, and may not be suitable for all individuals. Before making any trading decisions, please consult with a qualified financial professional to understand the risks involved.
By using this script, you acknowledge and agree that any trading decisions are made solely at your discretion and risk.
Do not use this indicator on Heikin-Ashi, Renko, Kagi, Point-and-Figure, or Range charts, as these chart types can produce unrealistic results for signal markers and alerts.
Best regards and happy trading
Chervolino

Experimental Supertrend [CHE]Experimental Supertrend — Combines EMA crossovers for trend regime detection with an adaptive ATR-based hull that selects the narrowest band to contain recent highs and lows, minimizing false breaks in varying volatility.
Summary
This indicator overlays a dynamic supertrend boundary around a midline derived from dual EMAs, using EMA crossovers to switch between bullish and bearish regimes. The hull adapts by evaluating multiple ATR periods and selecting the tightest one that fully encloses price action over a specified window, which helps in creating more stable trend lines that hug price without excessive gaps or breaches. Fills between the midline and hull provide visual cues for trend strength, darkening temporarily after regime changes to highlight transitions. Alerts trigger on crossovers, and markers label entry points, making it suitable for trend-following setups where standard supertrends might whipsaw. Overall, it offers robustness through auto-adjustment, reducing sensitivity to noise while maintaining responsiveness to genuine shifts.
Motivation: Why this design?
Standard supertrend indicators often flip prematurely in choppy markets due to fixed multipliers that do not account for localized volatility patterns, leading to frequent false signals and eroded confidence in trends. This design addresses that by incorporating an EMA-based regime filter for directional bias and an auto-adaptive hull that dynamically tunes the band width based on recent price containment needs. By prioritizing the narrowest effective enclosure, it avoids over-wide bands in calm periods that cause lag or under-wide ones in volatility spikes that invite breaks, providing a more consistent trailing reference without manual tweaking.
What’s different vs. standard approaches?
- Reference baseline: Diverges from the classic ATR-multiplier supertrend, which uses a single fixed period and constant factor applied to close or high/low deviations.
- Architecture differences:
- Auto-selection from candidate ATR lengths to find the optimal period for current conditions.
- Dynamic multiplier clamped between floor and cap values, adjusted by padding to ensure reliable containment.
- Regime-gated rendering, where hull position flips based on EMA relative positioning.
- Post-transition visual fading to emphasize change points without altering core logic.
- Practical effect: Charts show tighter, more reactive bands that rarely breach during trends, reducing visual clutter from flips; the adaptive nature means less intervention across assets, as the hull self-adjusts to volatility clusters rather than applying a one-size-fits-all scale.
How it works (technical)
The indicator first computes two EMAs from close prices using lengths derived from a preset pair or manual inputs, establishing a midline as their average. This midline serves as the central reference for the hull. True range values are then smoothed into multiple ATR candidates using exponential weighting over the specified lengths. For each candidate, deviations of recent highs and lows from the midline are ratioed against the ATR to determine a required multiplier that would enclose all extremes in the containment window—the highest ratio plus padding sets the base, clamped to user-defined bounds. Among valid candidates (those with sufficient history), the one yielding the narrowest overall band width is selected. The hull boundaries are then offset from the midline by this multiplier times the chosen ATR, and further smoothed with a fixed EMA to reduce jitter. Regime direction from EMA comparison gates which boundary acts as support or resistance, with initialization seeding arrays on the first bar to handle state persistence. No higher timeframe data is used, so all logic runs on the chart's native bars without lookahead.
Parameter Guide
EMA Pair — Selects preset lengths for fast and slow EMAs, influencing regime sensitivity and midline stability. Default: "21/55". Trade-offs/Tips: Faster pairs like "9/21" increase cross frequency for scalping but raise false signals; slower like "50/200" smooths for swings, potentially missing early turns. Use Manual for fine control.
Manual Fast — Sets fast EMA length when Manual mode is active; shorter values make regime switches quicker. Default: 21. Trade-offs/Tips: Lower than 10 risks over-reactivity; pair with slow at least double for clear separation.
Manual Slow — Sets slow EMA length when Manual mode is active; longer values anchor the midline more firmly. Default: 55. Trade-offs/Tips: Above 100 adds lag in trends; balance with fast to avoid perpetual neutrality.
ATR Lengths (comma-separated) — Defines candidate periods for ATR smoothing; more options allow finer auto-selection. Default: "7,10,14,21,28,35". Trade-offs/Tips: Fewer candidates speed computation but may miss optimal fits; keep under 10 for efficiency.
Containment Window — Number of recent bars the hull must fully enclose highs/lows of; larger windows favor stability. Default: 50. Trade-offs/Tips: Shorter (under 20) adapts faster to breaks but increases breach risk; longer smooths but delays response.
Min Multiplier Floor — Lowest allowed multiplier for hull width; prevents overly tight bands in low volatility. Default: 0.5. Trade-offs/Tips: Raise to 0.75 for conservative enclosures; too low allows pinches that flip easily.
Max Multiplier Cap — Highest allowed multiplier; caps expansion in spikes to avoid wide, lagging bands. Default: 1.0. Trade-offs/Tips: Lower to 0.75 tightens overall; higher permits more room but risks detachment from price.
Padding (+) — Adds buffer to the auto-multiplier for safer containment without exact touches. Default: 0.05. Trade-offs/Tips: Increase to 0.10 in gappy markets; minimal values hug closer but may still breach on outliers.
Fill Between (Mid ↔ Supertrend) — Toggles shaded area between midline and active hull for trend visualization. Default: true. Trade-offs/Tips: Disable for cleaner charts; pairs well with transparency tweaks.
Base Fill Transparency (0..100) — Sets default opacity of fills; higher values make them subtler. Default: 80. Trade-offs/Tips: Under 50 overwhelms price action; adjust with darken boost for emphasis.
Darken on Trend Change — Enables temporary opacity increase after regime shifts to spotlight transitions. Default: true. Trade-offs/Tips: Off for steady visuals; on aids spotting reversals in real-time.
Darken Fade Bars — Duration in bars for the darken effect to ramp back to base; longer prolongs highlight. Default: 8. Trade-offs/Tips: Shorter (4-6) for fast-paced charts; longer holds attention on changes.
Darken Boost at Change (Δ transp) — Intensity of opacity reduction at crossover; higher values make shifts more prominent. Default: 50. Trade-offs/Tips: Cap at 70 to avoid blackout; tune down if fades obscure details.
Show Supertrend Line — Displays the active hull boundary as a line. Default: true. Trade-offs/Tips: Hide for fill-only views; linewidth fixed at 3 for visibility.
Show EMA Cross Markers — Places circles and labels at crossover points for entry cues. Default: true. Trade-offs/Tips: Disable in clutter; labels show "Buy"/"Sell" at absolute positions.
Alert: EMA Cross Up (Long) — Triggers notification on bullish crossover. Default: true. Trade-offs/Tips: Pair with filters; once-per-bar frequency.
Alert: EMA Cross Down (Short) — Triggers notification on bearish crossover. Default: true. Trade-offs/Tips: Use for exits; ensure broker integration.
Show Debug — Reveals internal diagnostics like selected ATR details (if implemented). Default: false. Trade-offs/Tips: Enable for troubleshooting selections; minimal overhead.
Reading & Interpretation
Bullish regime shows a green line below price as support, with upward fill from midline; bearish uses red line above as resistance, downward fill. Crossovers flip the active boundary, marked by tiny green/red circles and "Buy"/"Sell" labels at the hull level. Fills start at base transparency but darken sharply at changes, fading over the specified bars to signal fresh momentum. If the hull rarely breaches during trends, containment is effective; frequent touches without flips indicate tight adaptation. Debug mode (when enabled) overlays text or plots for selected length and multiplier, helping verify auto-choices.
Practical Workflows & Combinations
- Trend following: Enter long on green "Buy" label above prior low structure; confirm with higher high. Trail stops along the green hull line, tightening as fills stabilize post-fade.
- Exits/Stops: Conservative exit on opposite crossover or hull breach; aggressive hold until fade completes if volume supports. Use darken boost as a volatility cue—high delta suggests waiting for confirmation.
- Multi-asset/Multi-TF: Defaults suit forex/stocks on 15m-4h; for crypto, widen containment to 75 for gaps. Layer on volume oscillator for cross filters; avoid on low-liquidity assets where ATR candidates skew.
Behavior, Constraints & Performance
Closed-bar logic ensures signals confirm at bar end, with live bars updating hull adaptively but no repaints since no future data or security calls are used. Arrays persist ATR states across bars, initialized once with candidates parsed from string. Small fixed loops (over 6 lengths max, inner up to 50) run per bar, capped by max_bars_back=500 for history needs. Resources stay low with 500 labels/lines limits, but dense charts may hit on markers. Known limits include initial lag until containment history builds (50+ bars), potential wide bands on gaps, and suboptimal selections if candidates omit ideal lengths.
Sensible Defaults & Quick Tuning
Start with "21/55" pair, 50-window, 0.5-1.0 multipliers, and 80% transparency for balanced responsiveness on daily charts. For too many flips, raise min floor to 0.75 or add lengths like "42"; for sluggishness, shorten window to 30 or pick faster pair. In high-vol environments, boost padding to 0.10; for smoother visuals, extend fade bars to 12.
What this indicator is—and isn’t
This is a visualization and signal layer for trend regime and adaptive boundaries, aiding entry/exit timing in directional markets. It is not a standalone system—pair with price structure, risk sizing, and broader context. Not predictive of turns, just reactive to containment and crosses.
Disclaimer
The content provided, including all code and materials, is strictly for educational and informational purposes only. It is not intended as, and should not be interpreted as, financial advice, a recommendation to buy or sell any financial instrument, or an offer of any financial product or service. All strategies, tools, and examples discussed are provided for illustrative purposes to demonstrate coding techniques and the functionality of Pine Script within a trading context.
Any results from strategies or tools provided are hypothetical, and past performance is not indicative of future results. Trading and investing involve high risk, including the potential loss of principal, and may not be suitable for all individuals. Before making any trading decisions, please consult with a qualified financial professional to understand the risks involved.
By using this script, you acknowledge and agree that any trading decisions are made solely at your discretion and risk.
Do not use this indicator on Heikin-Ashi, Renko, Kagi, Point-and-Figure, or Range charts, as these chart types can produce unrealistic results for signal markers and alerts.
Happy trading
Chervolino

Outside Candle Session Breakout [CHE]Outside Candle Session Breakout
Session - anchored HTF levels for clear market-structure and precise breakout context
Summary
This indicator is a relevant market-structure tool. It anchors the session to the first higher-timeframe bar, then activates only when the second bar forms an outside condition. Price frequently reacts around these anchors, which provides precise breakout context and a clear overview on both lower and higher timeframes. Robustness comes from close-based validation, an adaptive volatility and tick buffer, first-touch enforcement, optional retest, one-signal-per-session, cooldown, and an optional trend filter.
Pine version: v6. Overlay: true.
Motivation: Why this design?
Short-term breakout tools often trigger during noise, duplicate within the same session, or drift when volatility shifts. The core idea is to gate signals behind a meaningful structure event: a first-bar anchor and a subsequent outside bar on the session timeframe. This narrows attention to structurally important breaks while adaptive buffering and debouncing reduce false or mid-run triggers.
What’s different vs. standard approaches?
Baseline: Simple high-low breaks or fixed buffers without session context.
Architecture: Session-anchored first-bar high/low; outside-bar gate; close-based confirmation with an adaptive ATR and tick buffer; first-touch enforcement; optional retest window; one-signal-per-session and cooldown; optional EMA trend and slope filter; higher-timeframe aggregation with lookahead disabled; themeable visuals and a range fill between levels.
Practical effect: Cleaner timing at structurally relevant levels, fewer redundant or late triggers, and better multi-timeframe situational awareness.
How it works (technical)
The chart timeframe is mapped to an analysis timeframe and a session timeframe.
The first session bar defines the anchor high and low. The setup becomes active only after the next bar forms an outside range relative to that first bar.
While active, the script tracks these anchors and checks for a breakout beyond a buffered threshold, using closing prices or wicks by preference.
The buffer scales with volatility and is limited by a minimum tick floor. First-touch enforcement avoids mid-run confirmations.
Optional retest requires a pullback to the raw anchor followed by a new close beyond the buffered level within a user window.
Optional trend gating uses an EMA on the analysis timeframe, including an optional slope requirement and price-location check.
Higher-timeframe data is requested with lookahead disabled. Values can update during a forming higher-timeframe bar; waiting and confirmation mitigate timing shifts.
Parameter Guide
Enable Long / Enable Short — Direction toggles. Default: true / true. Reduces unwanted side.
Wait Candles — Minimum bars after outside confirmation before entries. Default: five. More waiting increases stability.
Close-based Breakout — Confirm on candle close beyond buffer. Default: true. For wick sensitivity, disable.
ATR Buffer — Enables adaptive volatility buffer. Default: true.
ATR Multiplier — Buffer scaling. Default: zero point two. Increase to reduce noise.
Ticks Buffer — Minimum buffer in ticks. Default: two. Protects in quiet markets.
Cooldown Bars — Blocks new signals after a trigger. Default: three.
One Signal per Session — Prevents duplicates within a session. Default: true.
Require Retest — Pullback to raw anchor before confirming. Default: false.
Retest Window — Bars allowed for retest completion. Default: five.
HTF Trend Filter — EMA-based gating. Default: false.
EMA Length — EMA period. Default: two hundred.
Slope — Require EMA slope direction. Default: true.
Price Above/Below EMA — Require price location relative to EMA. Default: true.
Show Levels / Highlight Session / Show Signals — Visual controls. Default: true.
Color Theme — “Blue-Green” (default), “Monochrome”, “Earth Tones”, “Classic”, “Dark”.
Time Period Box — Visibility, size, position, and colors for the info box. (Optional)
Reading & Interpretation
The two level lines represent the session’s first-bar high and low. The filled band illustrates the active session range.
“OUT” marks that the outside condition is confirmed and the setup is live.
“LONG” or “SHORT” appears only when the breakout clears buffer, debounce, and optional gates.
Background tint indicates sessions where the setup is valid.
Alerts fire on confirmed long or short breakout events.
Practical Workflows & Combinations
Trend-following: Keep close-based validation, ATR buffer near the default, one-signal-per-session enabled; add EMA trend and slope for directional bias.
Retest confirmation: Enable retest with a short window to prioritize cleaner continuation after a pullback.
Lower-timeframe scalping: Reduce waiting and cooldown slightly; keep a small tick buffer to filter micro-whips.
Swing and position context: Increase ATR multiplier and waiting; maintain once-per-session to limit duplicates.
Timeframe Tiers and Trader Profiles
The script adapts its internal mapping based on the chart timeframe:
Under fifteen minutes → Analysis: one minute; Session: sixty minutes. Useful for scalpers and high-frequency intraday reads.
Between fifteen and under sixty minutes → Analysis: fifteen minutes; Session: one day. Suits day traders who need intraday alignment to the daily session.
Between sixty minutes and under one day → Analysis: sixty minutes; Session: one week. Serves intraday-to-swing transitions and end-of-day planning.
Between one day and under one week → Analysis: two hundred forty minutes; Session: two weeks. Fits swing traders who monitor multi-day structure.
Between one week and under thirty days → Analysis: one day; Session: three months. Supports position traders seeking quarterly context.
Thirty days and above → Analysis: one day; Session: twelve months. Provides a broad annual anchor for macro context.
These tiers are designed to keep anchors meaningful across regimes while preserving responsiveness appropriate to the trader profile.
Behavior, Constraints & Performance
Signals can be validated on closed bars through close-based logic; enabling this reduces intrabar flicker.
Higher-timeframe values may evolve during a forming bar; waiting parameters and the outside-bar gate reduce, but do not remove, this effect.
Resource footprint is light; the script uses standard indicators and a single higher-timeframe request per stream.
Known limits: rare setups during very quiet periods, sensitivity to gaps, and reduced reliability on illiquid symbols.
Sensible Defaults & Quick Tuning
Start with close-based validation on, ATR buffer on with a multiplier near zero point two, tick buffer two, cooldown three, once-per-session on.
Too many flips: increase the ATR multiplier and cooldown; consider enabling the EMA filter and slope.
Too sluggish: reduce the ATR multiplier and waiting; disable retest.
Choppy conditions: keep close-based validation, increase tick buffer, shorten the retest window.
What this indicator is—and isn’t
This is a visualization and signal layer for session-anchored breakouts with stability gates. It is not a complete trading system, risk framework, or predictive engine. Combine it with structured analysis, position sizing, and disciplined risk controls.
Disclaimer
The content provided, including all code and materials, is strictly for educational and informational purposes only. It is not intended as, and should not be interpreted as, financial advice, a recommendation to buy or sell any financial instrument, or an offer of any financial product or service. All strategies, tools, and examples discussed are provided for illustrative purposes to demonstrate coding techniques and the functionality of Pine Script within a trading context.
Any results from strategies or tools provided are hypothetical, and past performance is not indicative of future results. Trading and investing involve high risk, including the potential loss of principal, and may not be suitable for all individuals. Before making any trading decisions, please consult with a qualified financial professional to understand the risks involved.
By using this script, you acknowledge and agree that any trading decisions are made solely at your discretion and risk.
Do not use this indicator on Heikin-Ashi, Renko, Kagi, Point-and-Figure, or Range charts, as these chart types can produce unrealistic results for signal markers and alerts.
Best regards and happy trading
Chervolino

Institutional Orderflow Pro — VWAP, Delta, and Liquidity
Institutional Orderflow Pro is a next-generation order flow analysis indicator designed to help traders identify institutional participation, directional bias, and exhaustion zones in real time.
Unlike traditional volume-based indicators, it merges VWAP dynamics, cumulative delta, relative volume, and liquidity proximity into a single unified dashboard that updates tick-by-tick — without repainting.
The indicator is open-source, transparent, and educational. It aims to provide traders with a clearer read on who controls the market — buyers or sellers — and where liquidity lies.
The indicator combines multiple institutional-grade analytics into one framework:
RVOL (Relative Volume) = Compares current volume against the average of recent bars to identify strong institutional participation.
zΔ (Delta Z-Score) = Normalizes the buying/selling delta to reveal unusually aggressive market behavior.
CVDΔ (Cumulative Volume Delta Change) = Shows which side (buyers/sellers) is dominating this bar’s order flow.
VWAP Direction & Slope = Determines whether price is trading above/below VWAP and whether VWAP is trending or flat.
PD Distance (Prev Day Confluence) = Measures the current price’s distance from previous day’s high, low, close, and VWAP in ATR units — highlighting liquidity zones.
ABS/EXH Detection = Identifies institutional absorption and exhaustion patterns where momentum may reverse.
Bias Computation = Combines VWAP direction + slope to give a simplified regime signal: UP, DOWN, or FLAT.
All metrics are displayed through a color-coded, non-repainting HUD:
🟢 = bullish / favorable conditions
🔴 = bearish / weak conditions
⚫ = neutral / flat
🟡 = absorption (potential trap zone)
🟠 = exhaustion (momentum fading)
| Metric | Signal | Meaning |
| ---------------------- | ------- | ---------------------------------------------- |
| **RVOL ≥ 1.3** | 🟢 | High institutional activity — valid setup zone |
| **zΔ ≥ 1.2 / ≤ -1.2** | 🟢 / 🔴 | Unusual buy/sell aggression |
| **CVDΔ > 0** | 🟢 | Buyers dominate this bar |
| **VWAP dir ↑ / ↓** | 🟢 / 🔴 | Institutional bias long/short |
| **Slope ok = YES** | 🟢 | Trending market |
| **PD dist ≤ 0.35 ATR** | 🟢 | Near key liquidity zones |
| **Bias = UP/DOWN** | 🟢 / 🔴 | Trend-aligned environment |
| **ABS/EXH active** | 🟡 / 🟠 | Caution — possible reversal zone |
How to Use
Confirm Volume Context → RVOL > 1.2
Align with Bias → Take longs only when Bias = UP, shorts only when Bias = DOWN.
Check Slope and VWAP Dir → Ensure trending context (Slope = YES).
Confirm CVD and zΔ → Flow should agree with price direction.
Avoid ABS/EXH Triggers → These signal exhaustion or absorption by large players.
Enter Near PD Zones → Ideal trade zones are within 0.35 ATR of prior-day levels.
This multi-factor confirmation reduces noise and focuses only on high-probability institutional setups.
Originality
This script was written from scratch in Pine v6.
It does not reuse existing public indicators except for standard built-ins (ta.vwap, ta.atr, etc.).
The unique combination of delta z-scoring, VWAP slope filtering, and real-time confluence zones distinguishes it from typical orderflow tools or cumulative delta overlays.
The core innovation is its merged real-time HUD that integrates institutional metrics and natural-language feedback directly on the chart, allowing traders to read market context intuitively rather than decode multiple subplots.
Notes & Disclaimers
This indicator does not repaint.
It’s intended for educational and analytical purposes only — not as financial advice or a guaranteed signal system.
Works best on liquid instruments (Futures, Indices, FX majors).
Avoid non-standard chart types (Heikin Ashi, Renko, etc.) for accurate readings.
Open-source, modifiable, and compatible with Pine v6.
Recommended Use
Apply it with clean charts and standard candles for the best clarity.
Use alongside a basic structure or volume profile to contextualize institutional bias zones.
Author: Dhawal Ranka
Category - Orderflow / VWAP / Institutional Analysis
Version: Pine Script™ v6
License: Open Source (Educational Use)

Forecast PriceTime Oracle [CHE] Forecast PriceTime Oracle — Prioritizes quality over quantity by using Power Pivots via RSI %B metric to forecast future pivot highs/lows in price and time
Summary
This indicator identifies potential pivot highs and lows based on out-of-bounds conditions in a modified RSI %B metric, then projects future occurrences by estimating time intervals and price changes from historical medians. It provides visual forecasts via diagonal and horizontal lines, tracks achievement with color changes and symbols, and displays a dashboard for statistical overview including hit rates. Signals are robust due to median-based aggregation, which reduces outlier influence, and optional tolerance settings for near-misses, making it suitable for anticipating reversals in ranging or trending markets.
Motivation: Why this design?
Standard pivot detection often lags or generates false signals in volatile conditions, missing the timing of true extrema. This design leverages out-of-bounds excursions in RSI %B to capture "Power Pivots" early—focusing on quality over quantity by prioritizing significant extrema rather than every minor swing—then uses historical deltas in time and price to forecast the next ones, addressing the need for proactive rather than reactive analysis. It assumes that pivot spacing follows statistical patterns, allowing users to prepare entries or exits ahead of confirmation.
What’s different vs. standard approaches?
- Reference baseline: Diverges from traditional ta.pivothigh/low, which require fixed left/right lengths and confirm only after bars close, often too late for dynamic markets.
- Architecture differences:
- Detects extrema during OOB runs rather than post-bar symmetry.
- Aggregates deltas via medians (or alternatives) over a user-defined history, capping arrays to manage resources.
- Applies tolerance thresholds for hit detection, with options for percentage, absolute, or volatility-adjusted (ATR) flexibility.
- Freezes achieved forecasts with visual states to avoid clutter.
- Practical effect: Charts show proactive dashed projections instead of retrospective dots; the dashboard reveals evolving hit rates, helping users gauge reliability over time without manual calculation.
How it works (technical)
The indicator first computes a smoothed RSI over a specified length, then applies Bollinger Bands to derive %B, flagging out-of-bounds below zero or above one hundred as potential run starts. During these runs, it tracks the extreme high or low price and bar index. Upon exit from the OOB state, it confirms the Power Pivot at that extreme and records the time delta (bars since prior) and price change percentage to rolling arrays.
For forecasts, it calculates the median (or selected statistic) of recent deltas, subtracts the confirmation delay (bars from apex to exit), and projects ahead by that adjusted amount. Price targets use the median change applied to the origin pivot value. Lines are drawn from the apex to the target bar and price, with a short horizontal at the endpoint. Arrays store up to five active forecasts, pruning oldest on overflow.
Tolerance adjusts hit checks: for highs, if the high reaches or exceeds the target (adjusted by tolerance); for lows, if the low drops to or below. Once hit, the forecast freezes, changing colors and symbols, and extends the horizontal to the hit bar. Persistent variables maintain last pivot states across bars; arrays initialize empty and grow until capped at history length.
Parameter Guide
Source: Specifies the data input for the RSI computation, influencing how price action is captured. Default is close. For conservative signals in noisy environments, switch to high; using low boosts responsiveness but may increase false positives.
RSI Length: Sets the smoothing period for the RSI calculation, with longer values helping to filter out whipsaws. Default is 32. Opt for shorter lengths like 14 to 21 on faster timeframes for quicker reactions, or extend to 50 or more in strong trends to enhance stability at the cost of some lag.
BB Length: Defines the period for the Bollinger Bands applied to %B, directly affecting how often out-of-bounds conditions are triggered. Default is 20. Align it with the RSI length: shorter periods detect more potential runs but risk added noise, while longer ones provide better filtering yet might overlook emerging extrema.
BB StdDev: Controls the multiplier for the standard deviation in the bands, where wider settings reduce false out-of-bounds alerts. Default is 2.0. Narrow it to 1.5 for highly volatile assets to catch more signals, or broaden to 2.5 or higher to emphasize only major movements.
Show Price Forecast: Enables or disables the display of diagonal and target lines along with their updates. Default is true. Turn it off for simpler chart views, or keep it on to aid in trade planning.
History Length: Determines the number of recent pivot samples used for median-based statistics, where more history leads to smoother but potentially less current estimates. Default is 50. Start with a minimum of 5 to build data; limit to 100 to 200 to prevent outdated regimes from skewing results.
Max Lookahead: Limits the number of bars projected forward to avoid overly extended lines. Default is 500. Reduce to 100 to 200 for intraday focus, or increase for longer swing horizons.
Stat Method: Selects the aggregation technique for time and price deltas: Median for robustness against outliers, Trimmed Mean (20%) for a balanced trim of extremes, or 75th Percentile for a conservative upward tilt. Default is Median. Use Median for even distributions; switch to Percentile when emphasizing potential upside in trending conditions.
Tolerance Type: Chooses the approach for flexible hit detection: None for exact matches, Percentage for relative adjustments, Absolute for fixed point offsets, or ATR for scaling with volatility. Default is None. Begin with Percentage at 0.5 percent for currency pairs, or ATR for adapting to cryptocurrency swings.
Tolerance %: Provides the relative buffer when using Percentage mode, forgiving small deviations. Default is 0.5. Set between 0.2 and 1.0 percent; higher values accommodate gaps but can overstate hit counts.
Tolerance Points: Establishes a fixed offset in price units for Absolute mode. Default is 0.0010. Tailor to the asset, such as 0.0001 for forex pairs, and validate against past wick behavior.
ATR Length: Specifies the period for the Average True Range in dynamic tolerance calculations. Default is 14. This is the standard setting; shorten to 10 to reflect more recent volatility.
ATR Multiplier: Adjusts the ATR scale for tolerance width in ATR mode. Default is 0.5. Range from 0.3 for tighter precision to 0.8 for greater leniency.
Dashboard Location: Positions the summary table on the chart. Default is Bottom Right. Consider Top Left for better visibility on mobile devices.
Dashboard Size: Controls the text scaling for dashboard readability. Default is Normal. Choose Tiny for dense overlays or Large for detailed review sessions.
Text/Frame Color: Sets the color scheme for dashboard text and borders. Default is gray. Align with your chart theme, opting for lighter shades on dark backgrounds.
Reading & Interpretation
Forecast lines appear as dashed diagonals from confirmed pivots to projected targets, with solid horizontals at endpoints marking price levels. Open targets show a target symbol (🎯); achieved ones switch to a trophy symbol (🏆) in gray, with lines fading to gray. The dashboard summarizes median time/price deltas, sample counts, and hit rates—rising rates indicate improving forecast alignment. Colors differentiate highs (red) from lows (lime); frozen states signal validated projections.
Practical Workflows & Combinations
- Trend following: Enter long on low forecast hits during uptrends (higher highs/lower lows structure); filter with EMA crossovers to ignore counter-trend signals.
- Reversal setups: Short above high projections in overextended rallies; use volume spikes as confirmation to reduce false breaks.
- Exits/Stops: Trail stops to prior pivot lows; conservative on low hit rates (below 50%), aggressive above 70% with tight tolerance.
- Multi-TF: Apply on 1H for entries, 4H for time projections; combine with Ichimoku clouds for confluence on targets.
- Risk management: Position size inversely to delta uncertainty (wider history = smaller bets); avoid low-liquidity sessions.
Behavior, Constraints & Performance
Confirmation occurs on OOB exit, so live-bar pivots may adjust until close, but projections update only on events to minimize repaint. No security or HTF calls, so no external lookahead issues. Arrays cap at history length with shifts; forecasts limited to five active, pruning FIFO. Loops iterate over small fixed sizes (e.g., up to 50 for stats), efficient on most hardware. Max lines/labels at 500 prevent overflow.
Known limits: Sensitive to OOB parameter tuning—too tight misses runs; assumes stationary pivot stats, which may shift in regime changes like low vol. Gaps or holidays distort time deltas.
Sensible Defaults & Quick Tuning
Defaults suit forex/crypto on 1H–4H: RSI 32/BB 20 for balanced detection, Median stats over 50 samples, None tolerance for exactness.
- Too many false runs: Increase BB StdDev to 2.5 or RSI Length to 50 for filtering.
- Lagging forecasts: Shorten History Length to 20; switch to 75th Percentile for forward bias.
- Missed near-hits: Enable Percentage tolerance at 0.3% to capture wicks without overcounting.
- Cluttered charts: Reduce Max Lookahead to 200; disable dashboard on lower TFs.
What this indicator is—and isn’t
This is a forecasting visualization layer for pivot-based analysis, highlighting statistical projections from historical patterns. It is not a standalone system—pair with price action, volume, and risk rules. Not predictive of all turns; focuses on OOB-derived extrema, ignoring volume or news impacts.
Disclaimer
The content provided, including all code and materials, is strictly for educational and informational purposes only. It is not intended as, and should not be interpreted as, financial advice, a recommendation to buy or sell any financial instrument, or an offer of any financial product or service. All strategies, tools, and examples discussed are provided for illustrative purposes to demonstrate coding techniques and the functionality of Pine Script within a trading context.
Any results from strategies or tools provided are hypothetical, and past performance is not indicative of future results. Trading and investing involve high risk, including the potential loss of principal, and may not be suitable for all individuals. Before making any trading decisions, please consult with a qualified financial professional to understand the risks involved.
By using this script, you acknowledge and agree that any trading decisions are made solely at your discretion and risk.
Do not use this indicator on Heikin-Ashi, Renko, Kagi, Point-and-Figure, or Range charts, as these chart types can produce unrealistic results for signal markers and alerts.
Best regards and happy trading
Chervolino

Anchored VWAP Polyline [CHE] Anchored VWAP Polyline — Anchored VWAP drawn as a polyline from a user-defined bar count with last-bar updates and optional labels
Summary
This indicator renders an anchored Volume-Weighted Average Price as a continuous polyline starting from a user-selected anchor point a specified number of bars back. It accumulates price multiplied by volume only from the anchor forward and resets cleanly when the anchor moves. Drawing is object-based (polyline and labels) and updated on the most recent bar only, which reduces flicker and avoids excessive redraws. Optional labels mark the anchor and, conditionally, a delta label when the current close is below the historical close at the anchor offset.
Motivation: Why this design?
Anchored VWAP is often used to track fair value after a specific event such as a swing, breakout, or session start. Traditional plot-based lines can repaint during live updates or incur overhead when frequently redrawn. This implementation focuses on explicit state management, last-bar rendering, and object recycling so the line stays stable while remaining responsive when the anchor changes. The design emphasizes deterministic updates and simple session gating from the anchor.
What’s different vs. standard approaches?
Baseline: Classic VWAP lines plotted from session open or full history.
Architecture differences:
Anchor defined by a fixed bar offset rather than session or day boundaries.
Object-centric drawing via `polyline` with an array of `chart.point` objects.
Last-bar update pattern with deletion and replacement of the polyline to apply all points cleanly.
Conditional labels: an anchor marker and an optional delta label only when the current close is below the historical close at the offset.
Practical effect: You get a visually continuous anchored VWAP that resets when the anchor shifts and remains clean on chart refreshes. The labels act as lightweight diagnostics without clutter.
How it works (technical)
The anchor index is computed as the latest bar index minus the user-defined bar count.
A session flag turns true from the anchor forward; prior bars are excluded.
Two persistent accumulators track the running sum of price multiplied by volume and the running sum of volume; they reset when the session flag turns from false to true.
The anchored VWAP is the running sum divided by the running volume whenever both are valid and the volume is not zero.
Points are appended to an array only when the anchored VWAP is valid. On the most recent bar, any existing polyline is deleted and replaced with a new one built from the point array.
Labels are refreshed on the most recent bar:
A yellow warning label appears when there are not enough bars to compute the reference values.
The anchor label marks the anchor bar.
The delta label appears only when the current close is below the close at the anchor offset; otherwise it is suppressed.
No higher-timeframe requests are used; repaint is limited to normal live-bar behavior.
Parameter Guide
Bars back — Sets the anchor offset in bars; default two hundred thirty-three; minimum one. Larger values extend the anchored period and increase stability but respond more slowly to regime changes.
Labels — Toggles all labels; default enabled. Disable to keep the chart clean when using multiple instances.
Reading & Interpretation
The polyline represents the anchored VWAP from the chosen anchor to the current bar. Price above the line suggests strength relative to the anchored baseline; price below suggests weakness.
The anchor label shows where the accumulation starts.
The delta label appears only when today’s close is below the historical close at the offset; it provides a quick context for negative drift relative to that reference.
A yellow message at the current bar indicates the chart does not have enough history to compute the reference comparison yet.
Practical Workflows & Combinations
Trend following: Anchor after a breakout bar or a swing confirmation. Use the anchored VWAP as dynamic support or resistance; look for clean retests and holds for continuation.
Mean reversion: Anchor at a local extreme and watch for approaches back toward the line; require structure confirmation to avoid early entries.
Session or event studies: Re-set the anchor around earnings, macro releases, or session opens by adjusting the bar offset.
Combinations: Pair with structure tools such as swing highs and lows, or with volatility measures to filter chop. The labels can be disabled when combining multiple instances to maintain chart clarity.
Behavior, Constraints & Performance
Repaint and confirmation: The line is updated on the most recent bar only; historical values do not rely on future bars. Normal live-bar movement applies until the bar closes.
No higher timeframe: There is no `security` call; repaint paths related to higher-timeframe lookahead do not apply here.
Resources: Uses one polyline object that is rebuilt on the most recent bar, plus two labels when conditions are met. `max_bars_back` is two thousand. Arrays store points from the anchor forward; extremely long anchors or very long charts increase memory usage.
Known limits: With very thin volume, the VWAP can be unavailable for some bars. Very large anchors reduce responsiveness. Labels use ATR for vertical placement; extreme gaps can place them close to extremes.
Sensible Defaults & Quick Tuning
Starting point: Bars back two hundred thirty-three with Labels enabled works well on many assets and timeframes.
Too noisy around the line: Increase Bars back to extend the accumulation window.
Too sluggish after regime changes: Decrease Bars back to focus on a shorter anchored period.
Chart clutter with multiple instances: Disable Labels while keeping the polyline visible.
What this indicator is—and isn’t
This is a visualization of an anchored VWAP with optional diagnostics. It is not a full trading system and does not include entries, exits, or position management. Use it alongside clear market structure, risk controls, and a plan for trade management. It does not predict future prices.
Inputs with defaults
Bars back: two hundred thirty-three bars, minimum one.
Labels: enabled or disabled toggle, default enabled.
Pine version: v6
Overlay: true
Primary outputs: one polyline, optional labels (anchor, conditional delta, and a warning when insufficient bars).
Metrics and functions: volume, ATR for label offset, object drawing via polyline and chart points, last-bar update pattern.
Special techniques: session gating from the anchor, persistent state, object recycling, explicit guards against unavailable values and zero volume.
Compatibility and assets: Designed for standard candlestick or bar charts across liquid assets and common timeframes.
Diagnostics: Yellow warning label when history is insufficient.
Disclaimer
The content provided, including all code and materials, is strictly for educational and informational purposes only. It is not intended as, and should not be interpreted as, financial advice, a recommendation to buy or sell any financial instrument, or an offer of any financial product or service. All strategies, tools, and examples discussed are provided for illustrative purposes to demonstrate coding techniques and the functionality of Pine Script within a trading context.
Any results from strategies or tools provided are hypothetical, and past performance is not indicative of future results. Trading and investing involve high risk, including the potential loss of principal, and may not be suitable for all individuals. Before making any trading decisions, please consult with a qualified financial professional to understand the risks involved.
By using this script, you acknowledge and agree that any trading decisions are made solely at your discretion and risk.
Do not use this indicator on Heikin-Ashi, Renko, Kagi, Point-and-Figure, or Range charts, as these chart types can produce unrealistic results for signal markers and alerts.
Best regards and happy trading
Chervolino
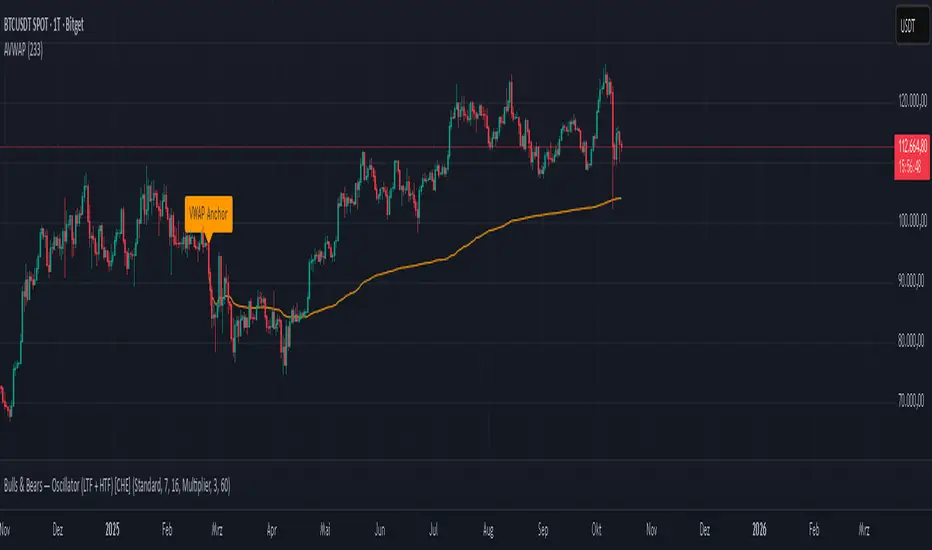
HTF Cross Breakout [CHE] HTF Cross Breakout — Detects higher timeframe close crossovers for breakout signals, anchors VWAP for trend validation, and flags continuations or traps with visual extensions for delta percent and stop levels.
Summary
This indicator spots moments when the current chart's close price crosses a higher timeframe close, marking potential breakouts only when the current bar shows directional strength. It anchors a volume-weighted average price line from the breakout point to track trend health, updating labels to show if the move continues or reverses into a trap. Extensions add a dotted line linking the breakout level to the current close with percent change display, plus a stop-loss marker at the VWAP end. Signals gain robustness from higher timeframe confirmation and anti-repainting options, reducing noise in live bars compared to simple crossover tools.
Motivation: Why this design?
Traders often face false breakouts from intrabar wiggles on lower timeframes, especially without higher timeframe alignment, leading to whipsaws in volatile sessions. This design uses higher timeframe close as a stable reference for crossover detection, combined with anchored volume weighting to gauge sustained momentum. It addresses these by enforcing bar confirmation and directional filters, providing clearer entry validation and risk points without overcomplicating the chart.
What’s different vs. standard approaches?
Reference baseline
Standard crossover indicators like moving average crosses operate solely on the chart timeframe, ignoring higher timeframe context and lacking volume anchoring.
Architecture differences
- Higher timeframe data pulls via security calls with optional repainting control for stability.
- Anchored VWAP resets at each signal, accumulating from the breakout bar only.
- Label dynamics update in real-time for continuation checks, with extensions for visual delta and stop computation.
- Event-driven line finalization prunes old elements after a set bar extension.
Practical effect
Charts show persistent lines and labels that extend live but finalize cleanly on new events, avoiding clutter. This matters for spotting trap reversals early via label color shifts, and extensions provide quick risk visuals without manual calculations, improving decision speed in trend trades.
How it works (technical)
The indicator first determines a higher timeframe based on user selection, pulling its close price securely. It checks for crossovers or crossunders of the current close against this higher close, but only triggers on confirmed bars with matching directional opens and closes. On a valid event, a horizontal line and label mark the higher close level, while a dashed VWAP line starts accumulating typical price times volume from that bar onward. During the active phase, the breakout line extends to the current bar, the label repositions and updates text based on whether the current close holds above or below the level for bulls or bears. A background tint warns if the close deviates adversely from the current VWAP. Extensions draw a vertical dotted line at the last bar between the breakout level and close, placing a midpoint label with percent difference; separately, a label at the VWAP end shows a computed stop price. Persistent variables track the active state and accumulators, resetting on new events after briefly extending old elements. Repaint risk from security calls is mitigated by confirmed bar gating or user opt-in.
Parameter Guide
Plateau Length (reserved for future, currently unused): Sets a length for potential plateau detection in extensions; default 3, minimum 1. Higher values would increase stability but are not active yet—leave at default to avoid tuning.
Line Width: Controls thickness of breakout, VWAP, and extension lines; default 2, range 1 to 5. Thicker lines improve visibility on busy charts but may obscure price action—use 1 for clean views, 3 or more for emphasis.
+Bars after next HTF event (finalize old, then delete): Extends old lines and labels by this many bars before deletion on new signals; default 20, minimum 0. Shorter extensions keep charts tidy but risk cutting visuals prematurely; longer aids review but builds clutter over time.
Evaluate label only on HTF close (prevents gray traps intrabar): When true, label updates wait for higher timeframe confirmation; default true. Enabling reduces intrabar flips for stabler signals, though it may delay feedback—disable for faster live trading at repaint cost.
Allow Repainting: Permits real-time security data without confirmation offset; default false. False ensures historical accuracy but lags live bars; true speeds updates but can repaint on HTF closes.
Timeframe Type: Chooses HTF method—Auto Timeframe (dynamic steps up), Multiplier (chart multiple), or Manual (fixed string); default Auto Timeframe. Auto adapts to chart scale for convenience; Multiplier suits custom scaling like 5 times current; Manual for precise like 1D on any chart.
Multiplier for Alternate Resolution: Scales chart timeframe when Multiplier type selected; default 5, minimum 1. Values near 1 mimic current resolution for subtle shifts; higher like 10 jumps to broader context, increasing signal rarity.
Manual Resolution: Direct timeframe string like 60 for 1H when Manual type; default 60. Match to trading horizon—shorter for swing, longer for positional—to balance frequency and reliability.
Show Extension 1: Toggles dotted line and delta percent label between breakout level and current close; default true. Disable to simplify for basic use, enable for precise momentum tracking.
Dotted Line Width: Thickness for Extension 1 line; default 2, range 1 to 5. Align with main Line Width for consistency.
Text Size: Size for delta percent label; options tiny, small, normal, large; default normal. Smaller reduces overlap on dense charts; larger aids glance reads.
Decimals for Δ%: Precision in percent change display; default 2, range 0 to 6. Fewer decimals speed reading; more suit low-volatility assets.
Positive Δ Color: Hue for upward percent changes; default lime. Choose contrasting for visibility.
Negative Δ Color: Hue for downward percent changes; default red. Pair with positive for quick polarity scan.
Dotted Line Color: Color for Extension 1 line; default gray. Neutral tones blend well; brighter for emphasis.
Background Transparency (0..100): Opacity for delta label background; default 90. Higher values fade for subtlety; lower solidifies for readability.
Show Extension 2: Toggles stop-loss label at VWAP end; default true. Turn off for entry focus only.
Stop Method: Percent from VWAP end or fixed ticks; options Percent, Ticks; default Percent. Percent scales with price levels; Ticks suits tick-based instruments.
Stop %: Distance as fraction of VWAP for Percent method; default 1.0, step 0.05, minimum 0.0. Tighter like 0.5 reduces risk but increases stops; wider like 2.0 allows breathing room.
Stop Ticks: Tick count offset for Ticks method; default 20, minimum 0. Adjust per asset volatility—fewer for tight control.
Price Decimals: Rounding for stop price text; default 4, range 0 to 10. Match syminfo.precision for clean display.
Text Size: Size for stop label; options tiny, small, normal, large; default normal. Scale to chart zoom.
Text Color: Foreground for stop text; default white. Ensure contrast with background.
Inherit VWAP Color (BG tint): Bases stop label background on VWAP hue; default true. True maintains theme; false allows custom black base.
BG Transparency (0..100): Opacity for stop label background; default 0. Zero for no tint; up to 100 for full fade.
Reading & Interpretation
Breakout lines appear green for bullish crosses or red for bearish, extending live until a new event finalizes them briefly then deletes. Labels start blank, updating to Bull Cont. or Bear Cont. in matching colors if holding the level, or gray Bull Trap/Bear Trap on reversal. VWAP dashes yellow for bulls, orange for bears, sloping with accumulated volume weight—deviations trigger faint red background warnings. Extension 1's dotted vertical shows at the last bar, with midpoint label green/red for positive/negative percent from breakout to close. Extension 2 places a left-aligned label at VWAP end with stop price and method note, tinted to VWAP for context.
Practical Workflows & Combinations
For trend following, enter long on green Bull Cont. labels above VWAP with higher highs confirmation, filtering via rising structure; short on red Bear Cont. below. Pair with volume surges or RSI above 50 for bulls to avoid traps. For exits, trail stops using the Extension 2 level, tightening on warnings or gray labels—aggressive on continuations, conservative post-trap. In multi-timeframe setups, use default Auto on 15m charts for 1H signals, scaling multiplier to 4 for daily context on hourly; test on forex/stocks where volume is reliable, avoiding low-liquidity assets.
Behavior, Constraints & Performance
Signals confirm on bar close with HTF gating when strict mode active, but live bars may update if repainting enabled—opt false for backtest fidelity, true for intraday speed. Security calls risk minor repaints on HTF closes, mitigated by confirmation offsets. Resources cap at 1000 bars back, 50 lines/labels total, with event prunes to stay under budgets—no loops, minimal arrays. Limits include VWAP lag in low-volume periods and dependency on accurate HTF data; gaps or holidays may skew anchors.
Sensible Defaults & Quick Tuning
Defaults suit 5m-1H charts on liquid assets: Auto HTF, no repaint, 1% stops. For choppy markets with excess signals, enable strict eval and bump multiplier to 10 for rarer triggers. If sluggish in trends, shorten extend bars to 10 and allow repainting for quicker visuals. On high-vol like crypto, widen stop % to 2.0 and use Ticks method; for stables like indices, tighten to 0.5% and keep Percent.
What this indicator is—and isn’t
This is a signal visualization layer for breakout confirmation and basic risk marking, best as a filter in discretionary setups. It isn’t a standalone system or predictive oracle—combine with price structure, news awareness, and sizing rules for real edges.
Disclaimer
The content provided, including all code and materials, is strictly for educational and informational purposes only. It is not intended as, and should not be interpreted as, financial advice, a recommendation to buy or sell any financial instrument, or an offer of any financial product or service. All strategies, tools, and examples discussed are provided for illustrative purposes to demonstrate coding techniques and the functionality of Pine Script within a trading context.
Any results from strategies or tools provided are hypothetical, and past performance is not indicative of future results. Trading and investing involve high risk, including the potential loss of principal, and may not be suitable for all individuals. Before making any trading decisions, please consult with a qualified financial professional to understand the risks involved.
By using this script, you acknowledge and agree that any trading decisions are made solely at your discretion and risk.
Do not use this indicator on Heikin-Ashi, Renko, Kagi, Point-and-Figure, or Range charts, as these chart types can produce unrealistic results for signal markers and alerts.
Best regards and happy trading
Chervolino

Relative Strength Index Remastered [CHE]Relative Strength Index Remastered — Enhanced RSI with robust divergence detection using price-based pivots and line-of-sight validation to reduce false signals compared to the standard RSI indicator.
Summary
RSI Remastered builds on the classic Relative Strength Index by adding a more reliable divergence detection system that relies on price pivots rather than RSI pivots alone, incorporating a line-of-sight check to ensure the RSI path between points remains clear. This approach filters out many false divergences that occur in the original RSI indicator due to its volatile pivot detection on the RSI line itself. Users benefit from clearer reversal and continuation signals, especially in noisy markets, with optional hidden divergence support for trend confirmation. The core RSI calculation and smoothing options remain familiar, but the divergence logic provides materially fewer alerts while maintaining sensitivity.
Motivation: Why this design?
The standard RSI indicator often generates misleading divergence signals because it detects pivots directly on the RSI values, which can fluctuate erratically in volatile conditions, leading to frequent false positives that confuse traders during ranging or choppy price action. RSI Remastered addresses this by shifting pivot detection to the underlying price highs and lows, which are more stable, and adding a validation step that confirms the RSI line does not cross the direct path between pivot points. This design targets the real problem of over-signaling in the original, promoting more actionable insights without altering the RSI's core momentum measurement.
What’s different vs. standard approaches?
- Reference baseline: The classical TradingView RSI indicator, which uses simple RSI-based pivot detection for divergences.
- Architecture differences:
- Pivot identification on price extremes (highs and lows) instead of RSI values, extracting RSI levels at those points for comparison.
- Addition of a line-of-sight validation that checks the RSI path bar by bar between pivots to prevent signals where the line is interrupted.
- Inclusion of hidden divergence types alongside regular ones, using the same robust framework.
- Configurable drawing of connecting lines between validated pivot RSI points for visual clarity.
- Practical effect: Charts show fewer but higher-quality divergence markers and lines, reducing clutter from the original's frequent RSI pivot triggers; this matters for avoiding whipsaws in intraday trading, where the standard version might flag dozens of invalid setups per session.
Key Comparison Aspects
Aspect: Title/Shorttitle
Original RSI: "Relative Strength Index" / "RSI"
Robust Variant: "Relative Strength Index Remastered " / "RSI RM"
Aspect: Max. Lines/Labels
Original RSI: No specification (Standard: 50/50)
Robust Variant: max_lines_count=200, max_labels_count=200 (for more lines/markers in divergences)
Aspect: RSI Calculation & Plots
Original RSI: Identical: RSI with RMA, Plots (line, bands, gradient fills)
Robust Variant: Identical: RSI with RMA, Plots (line, bands, gradient fills)
Aspect: Smoothing (MA)
Original RSI: Identical: Inputs for MA types (SMA, EMA etc.), Bollinger Bands optional
Robust Variant: Identical: Inputs for MA types (SMA, EMA etc.), Bollinger Bands optional
Aspect: Divergence Activation
Original RSI: input.bool(false, "Calculate Divergence") (disabled by default)
Robust Variant: input.bool(true, "Calculate Divergence") (enabled by default, with tooltip)
Aspect: Pivot Calculation
Original RSI: Pivots on RSI (ta.pivotlow/high on RSI values)
Robust Variant: Pivots on price (ta.pivotlow/high on low/high), RSI values then extracted
Aspect: Lookback Values
Original RSI: Fixed: lookbackLeft=5, lookbackRight=5
Robust Variant: Input: L=5 (Pivot Left), R=5 (Pivot Right), adjustable (min=1, max=50)
Aspect: Range Between Pivots
Original RSI: Fixed: rangeUpper=60, rangeLower=5 (via _inRange function)
Robust Variant: Input: rangeUpper=60 (Max Bars), rangeLower=5 (Min Bars), adjustable (min=1–6, max=100–300)
Aspect: Divergence Types
Original RSI: Only Regular Bullish/Bearish: - Bull: Price LL + RSI HL - Bear: Price HH + RSI LH
Robust Variant: Regular + Hidden (optional via showHidden=true): - Regular Bull: Price LL + RSI HL - Regular Bear: Price HH + RSI LH - Hidden Bull: Price HL + RSI LL - Hidden Bear: Price LH + RSI HH
Aspect: Validation
Original RSI: No additional check (only pivot + range check)
Robust Variant: Line-of-Sight Check: RSI line must not cross the connecting line between pivots (line_clear function with slope calculation and loop for each bar in between)
Aspect: Signals (Plots/Shapes)
Original RSI: - Plot of pivot points (if divergence) - Shapes: "Bull"/"Bear" at RSI value, offset=-5
Robust Variant: - No pivot plots, instead shapes at RSI , offset=-R (adjustable) - Shapes: "Bull"/"Bear" (Regular), "HBull"/"HBear" (Hidden) - Colors: Lime/Red (Regular), Teal/Orange (Hidden)
Aspect: Line Drawing
Original RSI: No lines
Robust Variant: Optional (showLines=true): Lines between RSI pivots (thick for regular, dashed/thin for hidden), extend=none
Aspect: Alerts
Original RSI: Only Regular Bullish/Bearish (with pivot lookback reference)
Robust Variant: Regular Bullish/Bearish + Hidden Bullish/Bearish (specific "at latest pivot low/high")
Aspect: Robustness
Original RSI: Simple, prone to false signals (RSI pivots can be volatile)
Robust Variant: Higher: Price pivots are more stable, line-of-sight filters "broken" divergences, hidden support for trend continuations
Aspect: Code Length/Structure
Original RSI: ~100 lines, simple if-blocks for bull/bear
Robust Variant: ~150 lines, extended helper functions (e.g., inRange, line_clear), var group for inputs
How it works (technical)
The indicator first computes the core RSI value based on recent price changes, separating upward and downward movements over the specified length and smoothing them to derive a momentum reading scaled between zero and one hundred. This value is then plotted in a separate pane with fixed upper and lower reference lines at seventy and thirty, along with optional gradient fills to highlight overbought and oversold zones.
For smoothing, a moving average type is applied to the RSI if enabled, with an option to add bands around it based on the variability of recent RSI values scaled by a multiplier. Divergence detection activates on confirmed price pivots: lows for bullish checks and highs for bearish. At each new pivot, the system retrieves the bar index and values (price and RSI) for the current and prior pivot, ensuring they fall within a configurable bar range to avoid unrelated points.
Comparisons then assess whether the price has made a lower low (or higher high) while the RSI at those points moves in the opposite direction—higher for bullish regular, lower for bearish regular. For hidden types, the directions reverse to capture trend strength. The line-of-sight check calculates the straight path between the two RSI points and verifies that the actual RSI values in between stay entirely above (for bullish) or below (for bearish) that path, breaking the signal if any bar violates it. Valid signals trigger shapes at the RSI level of the new pivot and optional lines connecting the points. Initialization uses built-in functions to track prior occurrences, with states persisting across bars for accurate historical comparisons. No higher timeframe data is used, so confirmation occurs after the right pivot bars close, minimizing live-bar repaints.
Parameter Guide
Length — Controls the period for measuring price momentum changes — Default: 14 — Trade-offs/Tips: Shorter values increase responsiveness but add noise and more false signals; longer smooths trends but delays entries in fast markets.
Source — Selects the price input for RSI calculation — Default: Close — Trade-offs/Tips: Use high or low for volatility focus, but close works best for most assets; mismatches can skew overbought/oversold reads.
Calculate Divergence — Enables the enhanced divergence logic — Default: True — Trade-offs/Tips: Disable for pure RSI view to save computation; essential for signal reliability over the standard method.
Type (Smoothing) — Chooses the moving average applied to RSI — Default: SMA — Trade-offs/Tips: None for raw RSI; EMA for quicker adaptation, but SMA reduces whipsaws; Bollinger Bands option adds volatility context at cost of added lines.
Length (Smoothing) — Period for the smoothing average — Default: 14 — Trade-offs/Tips: Match RSI length for consistency; shorter boosts signal speed but amplifies noise in the smoothed line.
BB StdDev — Multiplier for band width around smoothed RSI — Default: 2.0 — Trade-offs/Tips: Lower narrows bands for tighter signals, risking more touches; higher widens for fewer but stronger breakouts.
Pivot Left — Bars to the left for confirming price pivots — Default: 5 — Trade-offs/Tips: Increase for stricter pivots in noisy data, reducing signals; too high delays confirmation excessively.
Pivot Right — Bars to the right for confirming price pivots — Default: 5 — Trade-offs/Tips: Balances with left for symmetry; longer right ensures maturity but shifts signals backward.
Max Bars Between Pivots — Upper limit on distance for valid pivot pairs — Default: 60 — Trade-offs/Tips: Tighten for short-term trades to focus recent action; widen for swing setups but risks unrelated comparisons.
Min Bars Between Pivots — Lower limit to avoid clustered pivots — Default: 5 — Trade-offs/Tips: Raise to filter micro-moves; too low invites overlapping signals like the original RSI.
Detect Hidden — Includes trend-continuation hidden types — Default: True — Trade-offs/Tips: Enable for full trend analysis; disable simplifies to reversals only, akin to basic RSI.
Draw Lines — Shows connecting lines between valid pivots — Default: True — Trade-offs/Tips: Turn off for cleaner charts; helps visually confirm line-of-sight in backtests.
Reading & Interpretation
The main RSI line oscillates between zero and one hundred, crossing above fifty suggesting building momentum and below indicating weakness; touches near seventy or thirty flag potential extremes. The optional smoothed line and bands provide a filtered view—price above the upper band on the RSI pane hints at overextension. Divergence shapes appear as upward labels for bullish (lime for regular, teal for hidden) and downward for bearish (red regular, orange hidden) at the pivot's RSI level, signaling a mismatch only after validation. Connecting lines, if drawn, slope between points without RSI interference, their color matching the shape type; a dashed style denotes hidden. Fewer shapes overall compared to the standard RSI mean higher conviction, but always confirm with price structure.
Practical Workflows & Combinations
- Trend following: Enter longs on regular bullish shapes near support with higher highs in price; filter hidden bullish for pullback buys in uptrends, pairing with a rising smoothed RSI above fifty.
- Exits/Stops: Use bearish regular as reversal warnings to tighten stops; hidden bearish in downtrends confirms continuation—exit if lines show RSI crossing the path.
- Multi-asset/Multi-TF: Defaults suit forex and stocks on one-hour charts; for crypto volatility, widen pivot ranges to ten; scale min/max bars proportionally on daily for swings, avoiding the original's intraday spam.
Behavior, Constraints & Performance
Signals confirm only after the right pivot bars close, so live bars may show tentative pivots that vanish on close, unlike the standard RSI's immediate RSI-pivot triggers—plan for this delay in automation. No higher timeframe calls, so no security-related repaints. Resources include up to two hundred lines and labels for dense charts, with a loop in validation scanning up to three hundred bars between pivots, which is efficient but could slow on very long histories. Known limits: Slight lag at pivot confirmation in trending markets; volatile RSI might rarely miss fine path violations; not ideal for gap-heavy assets where pivots skip.
Sensible Defaults & Quick Tuning
Start with defaults for balanced momentum and divergence on most timeframes. For too many signals (like the original), raise pivot left/right to eight and min bars to ten to filter noise. If sluggish in trends, shorten RSI length to nine and enable EMA smoothing for faster adaptation. In high-volatility assets, widen max bars to one hundred but disable hidden to focus essentials. For clean reversal hunts, set smoothing to none and lines on.
What this indicator is—and isn’t
RSI Remastered serves as a refined momentum and divergence visualization tool, enhancing the standard RSI for better signal quality in technical analysis setups. It is not a standalone trading system, nor does it predict price moves—pair it with volume, structure breaks, and risk rules for decisions. Use alongside position sizing and broader context, not in isolation.
Disclaimer
The content provided, including all code and materials, is strictly for educational and informational purposes only. It is not intended as, and should not be interpreted as, financial advice, a recommendation to buy or sell any financial instrument, or an offer of any financial product or service. All strategies, tools, and examples discussed are provided for illustrative purposes to demonstrate coding techniques and the functionality of Pine Script within a trading context.
Any results from strategies or tools provided are hypothetical, and past performance is not indicative of future results. Trading and investing involve high risk, including the potential loss of principal, and may not be suitable for all individuals. Before making any trading decisions, please consult with a qualified financial professional to understand the risks involved.
By using this script, you acknowledge and agree that any trading decisions are made solely at your discretion and risk.
Do not use this indicator on Heikin-Ashi, Renko, Kagi, Point-and-Figure, or Range charts, as these chart types can produce unrealistic results for signal markers and alerts.
Best regards and happy trading
Chervolino

Squeeze Weekday Frequency [CHE] Squeeze Weekday Frequency — Tracks historical frequency of low-volatility squeezes by weekday to inform timing of low-risk setups.
Summary
This indicator monitors periods of unusually low volatility, defined as when the average true range falls below a percentile threshold, and tallies their occurrences across each weekday. By aggregating these counts over the chart's history, it reveals patterns in squeeze frequency, helping traders avoid or target specific days for reduced noise. The approach uses persistent counters to ensure accurate daily tallies without duplicates, providing a robust view of weekday biases in volatility regimes.
Motivation: Why this design?
Traders often face inconsistent signal quality due to varying volatility patterns tied to the trading calendar, such as quieter mid-week sessions or busier Mondays. This indicator addresses that by binning low-volatility events into weekday buckets, allowing users to spot recurring low-activity days where trends may develop with less whipsaw. It focuses on historical aggregation rather than real-time alerts, emphasizing pattern recognition over prediction.
What’s different vs. standard approaches?
- Reference baseline: Traditional volatility trackers like simple moving averages of range or standalone Bollinger Band squeezes, which ignore temporal distribution.
- Architecture differences:
- Employs array-based persistent counters for each weekday to accumulate events without recounting.
- Includes duplicate prevention via day-key tracking to handle sparse data.
- Features on-demand sorting and conditional display modes for focused insights.
- Practical effect: Charts show a persistent table of ranked weekdays instead of transient plots, making it easier to glance at biases like higher squeezes on Fridays, which reduces the need for manual logging and highlights calendar-driven edges.
How it works (technical)
The indicator first computes the average true range over a specified lookback period to gauge recent volatility. It then ranks this value against its own history within a sliding window to identify squeezes when the rank drops below the threshold. Each bar's timestamp is resolved to a weekday using the selected timezone, and a unique day identifier is generated from the date components.
On detecting a squeeze and valid price data, it checks against a stored last-marked day for that weekday to avoid multiple counts per day. If it's a new occurrence, the corresponding weekday counter in an array increments. Total days and data-valid days are tracked separately for context.
At the chart's last bar, it sums all counters to compute shares, sorts weekdays by their squeeze proportions, and populates a table with the selected subset. The table alternates row colors and highlights the peak weekday. An info label above the final bar summarizes totals and the top day. Background shading applies a faint red to squeeze bars for visual confirmation. State persists via variable arrays initialized once, ensuring counts build incrementally without resets.
Parameter Guide
ATR Length — Sets the lookback for measuring average true range, influencing squeeze sensitivity to short-term swings. Default: 14. Trade-offs/Tips: Shorter values increase responsiveness but raise false positives in chop; longer smooths for stability, potentially missing early squeezes.
Percentile Window (bars) — Defines the history length for ranking the current ATR, balancing recent relevance with sample size. Default: 252. Trade-offs/Tips: Narrower windows adapt faster to regime shifts but amplify noise; wider ones stabilize ranks yet lag in fast markets—aim for 100-500 bars on daily charts.
Squeeze threshold (PR < x) — Determines the cutoff for low-volatility classification; lower values flag rarer, tighter squeezes. Default: 10.0. Trade-offs/Tips: Tighter thresholds (under 5) yield fewer but higher-quality signals, reducing clutter; looser (over 20) captures more events at the cost of relevance.
Timezone — Selects the reference for weekday assignment; exchange default aligns with asset's session. Default: Exchange. Trade-offs/Tips: Use custom for cross-market analysis, but verify alignment to avoid offset errors in global pairs.
Show — Toggles the results table visibility for quick on/off of the display. Default: true. Trade-offs/Tips: Disable in multi-indicator setups to save screen space; re-enable for periodic reviews.
Pos — Positions the table on the chart pane for optimal viewing. Default: Top Right. Trade-offs/Tips: Bottom options suit long-term charts; test placements to avoid overlapping price action.
Font — Adjusts text size in the table for readability at different zooms. Default: normal. Trade-offs/Tips: Smaller fonts fit more data but strain eyes on small screens; larger for presentations.
Dark — Applies a dark color scheme to the table for contrast against chart backgrounds. Default: true. Trade-offs/Tips: Toggle false for light themes; ensures legibility without manual recoloring.
Display — Filters table rows to show all, top three, or bottom three weekdays by squeeze share. Default: All. Trade-offs/Tips: Use "Top 3" for focus on high-frequency days in active trading; "All" for full audits.
Reading & Interpretation
Red-tinted backgrounds mark individual squeeze bars, indicating current low-volatility conditions. The table's summary row shows the highest squeeze count, its percentage of total events, and the associated weekday in teal. Detail rows list selected weekdays with their absolute counts, proportional shares, and a left arrow for the peak day—higher percentages signal days where squeezes cluster, suggesting potential for calmer trend development. The info label reports overall days observed, valid data days, and reiterates the top weekday with its count. Drifting counts toward zero on a weekday imply rarity, while elevated ones point to habitual low-activity sessions.
Practical Workflows & Combinations
- Trend following: Scan for squeezes on high-frequency weekdays as entry filters, confirming with higher highs or lower lows in the structure; pair with momentum oscillators to time breaks.
- Exits/Stops: On low-squeeze days, widen stops for breathing room, tightening them during peak squeeze periods to guard against false breaks—use the table's percentages as a regime proxy.
- Multi-asset/Multi-TF: Defaults work across forex and indices on hourly or daily frames; for stocks, adjust percentile window to 100 for shorter histories. Scale thresholds up by 5-10 points for high-vol assets like crypto to maintain signal sparsity.
Behavior, Constraints & Performance
- Repaint/confirmation: Counts update only on confirmed bars via day-key changes, with no future references—live bars may shade red tentatively but tallies finalize at session close.
- security()/HTF: Not used, so no higher-timeframe repaint risks; all computations stay in the chart's resolution.
- Resources: Relies on a fixed-size array of seven elements and small loops for sorting and table fills, capped at 5000 bars back—efficient for most charts but may slow on very long intraday histories.
- Known limits: Ignores weekends and holidays implicitly via data presence; early chart bars lack full percentile context, leading to initial undercounting; assumes continuous sessions, so gaps in data (e.g., news halts) skew totals.
Sensible Defaults & Quick Tuning
Start with the built-in values for broad-market daily charts: ATR at 14, window at 252, threshold at 10. For noisier environments, lower the threshold to 5 and shorten the window to 100 to prioritize rare squeezes. If too few events appear, raise the threshold to 15 and extend ATR to 20 for broader capture. To combat overcounting in sparse data, widen the window to 500 while keeping others stock—monitor the info label's data-days count before trusting patterns.
What this indicator is—and isn’t
This serves as a statistical overlay for spotting calendar-based volatility biases, aiding in session selection and filter design. It is not a standalone signal generator, predictive model, or risk manager—integrate it with price action, volume, and broader strategy rules for decisions.
Disclaimer
The content provided, including all code and materials, is strictly for educational and informational purposes only. It is not intended as, and should not be interpreted as, financial advice, a recommendation to buy or sell any financial instrument, or an offer of any financial product or service. All strategies, tools, and examples discussed are provided for illustrative purposes to demonstrate coding techniques and the functionality of Pine Script within a trading context.
Any results from strategies or tools provided are hypothetical, and past performance is not indicative of future results. Trading and investing involve high risk, including the potential loss of principal, and may not be suitable for all individuals. Before making any trading decisions, please consult with a qualified financial professional to understand the risks involved.
By using this script, you acknowledge and agree that any trading decisions are made solely at your discretion and risk.
Do not use this indicator on Heikin-Ashi, Renko, Kagi, Point-and-Figure, or Range charts, as these chart types can produce unrealistic results for signal markers and alerts.
Best regards and happy trading
Chervolino

First-Move-Wrong Toolkit [CHE] First-Move-Wrong Toolkit — Session-bound sweep rejection with structure confirmation
Summary
This indicator marks potential “first move wrong” reversals during a defined trading session. It looks for a quick sweep beyond the prior day high or low, or the opening range high or low, followed by rejection and a basic structure confirmation. Optional rules require a retest and a VWAP reclaim in the direction of the trade idea. The script renders session levels as right-extended lines, signals as labels, optional SL/TP guide lines for visualization, and background tints during sweep events. Pivots are confirmed using swing width, which reduces repaint risk compared to live swings.
Motivation: Why this design?
Intraday reversals often start with a liquidity sweep around obvious highs or lows. Acting on the sweep alone can be noisy, while waiting for structure break and a retest can be slow. This tool balances both by checking a sweep and rejection at session-relevant levels, then requiring a simple structure cue and, optionally, a retest and a VWAP filter. The goal is a clear, rule-based signal layer that is easy to audit on chart without hidden state.
What’s different vs. standard approaches?
Baseline reference: Simple sweep detectors or basic CHOCH markers that ignore session context and liquidity anchors.
Architecture differences:
Session-aware opening range tracking that finalizes after the chosen minutes from session start.
Daily previous high and low pulled without lookahead, then extended forward as visual anchors.
Confirmed pivot highs and lows to avoid repaint from live, unconfirmed swings.
Optional retest rule using crossover or crossunder at the trigger level.
Optional VWAP filter to demand reclaim in the intended direction.
Global label cooldown to prevent clusters of signals.
Practical effect: Fewer one-off flips around noisy levels, clearer alignment with session structure, and compact visual feedback through lines, labels, and tints.
How it works (technical)
Levels: During the defined session, the script builds an opening range high and low until the configured minute mark after session start, then freezes those levels for the day. It also fetches the previous day high and low from the daily timeframe without lookahead and extends them forward.
Sweep and rejection: A sweep is defined as price moving beyond a target level and then rejecting back inside on the same bar. The script checks this condition separately for highs and lows against opening range and previous-day levels.
Structure validation: Confirmed pivot highs and lows are computed using a symmetric swing width. A bearish idea requires a prior sweep of a high plus a break through the last confirmed swing low. A bullish idea requires a prior sweep of a low plus a break through the last confirmed swing high.
Optional retest: If enabled, a bearish signal needs a cross under the bearish trigger level; a bullish signal needs a cross over the bullish trigger level.
VWAP filter (optional): The script requires a reclaim of VWAP in the intended direction when enabled.
State handling: Opening range values, previous-day lines, and the label cooldown timestamp are stored in persistent variables. Lines are created once and updated each bar to extend forward.
Repaint considerations: Pivots confirm only after the specified swing width, reducing repaint. The daily level request is performed without lookahead. Signals use closed-bar checks implied by crossover and crossunder logic.
Parameter Guide
Session (local) — Defines the active trading window. Default nine to seventeen. Narrower windows focus on the main session drive.
Opening Range (min) — Minutes from session start to finalize OR levels. Default fifteen. Shorter values react faster; longer values stabilize levels.
Use PrevDay H/L levels — Toggle previous-day anchors. On by default.
Use OR H/L levels — Toggle opening range anchors. On by default.
Equal H/L tolerance (ticks) — Intended tolerance for equal highs or lows. Default one. (Unknown/Optional) in current signals.
Swing width — Bars on both sides for confirmed pivots. Default two. Larger values reduce noise but confirm later.
Require CHOCH after sweep — Enforces structure break after a sweep. On by default.
Prefer retest entries — Requires crossover or crossunder of the trigger level. On by default.
VWAP filter — Demands a reclaim of VWAP in signal direction. Off by default.
TP in R (guide) — Multiplier for visual TP guides. Default one. Visualization only.
Show levels / Show signals / Show R-guides — Rendering toggles. R-guides are visual aids, not orders.
Label cooldown (bars) — Minimum bars between labels. Default five. Higher values reduce clusters.
Palette inputs — Colors and transparencies for levels, labels, VWAP, and tints.
Reading & Interpretation
Lines: Dotted lines represent opening range high and low after the OR window completes. Dashed lines represent previous-day high and low.
Signals: “Long” labels appear after a low-side sweep with rejection and structure confirmation, subject to optional retest and VWAP rules. “Short” labels mirror this on the high side.
Background tints: Red-tinted bars indicate a high-side sweep and rejection. Green-tinted bars indicate a low-side sweep and rejection.
R-guides: Circles display a visual stop level at the bar extreme and a target guide based on the selected multiple. They are informational only.
Practical Workflows & Combinations
Session reversal scans: During the first hour, watch for sweeps around previous-day or opening range levels, then wait for structure confirmation and optional retest.
Trend following with filters: Combine signals with higher-timeframe structure or a moving average regime check. Ignore signals against the dominant regime.
Exits and stops: Use the visual stop as a reference near the sweep extreme; adapt the target guide to volatility and market conditions.
Multi-asset / Multi-TF: Works on intraday timeframes for liquid futures, indices, forex, and large-cap equities. Start with default settings and adjust swing width and OR minutes to instrument volatility.
Behavior, Constraints & Performance
Repaint/confirmation: Pivots confirm after the swing window completes. Signals occur only when conditions are met on closed bars.
security()/HTF: Daily previous-day levels are requested without lookahead to reduce repaint.
Resources: Uses persistent variables and line updates per bar; no heavy loops or arrays.
Known limits: Signals can arrive later when swing width is large. Gaps around session boundaries may distort OR levels. VWAP behavior may vary with partial sessions or illiquid assets.
Sensible Defaults & Quick Tuning
Starting point: Session nine to seventeen, opening range fifteen minutes, swing width two, CHOCH required, retest on, VWAP off, cooldown five bars.
Too many flips: Increase swing width, enable VWAP filter, or raise label cooldown.
Too sluggish: Reduce swing width or shorten the opening range window.
Too many session-level hits: Disable either previous-day levels or opening range levels to simplify context.
What this indicator is—and isn’t
This is a session-aware visualization and signal layer focused on sweep-plus-structure behavior. It is not a complete trading system and does not manage orders, risk, or portfolio exposure. Use it with market structure, risk limits, and execution rules that fit your process.
Disclaimer
The content provided, including all code and materials, is strictly for educational and informational purposes only. It is not intended as, and should not be interpreted as, financial advice, a recommendation to buy or sell any financial instrument, or an offer of any financial product or service. All strategies, tools, and examples discussed are provided for illustrative purposes to demonstrate coding techniques and the functionality of Pine Script within a trading context.
Any results from strategies or tools provided are hypothetical, and past performance is not indicative of future results. Trading and investing involve high risk, including the potential loss of principal, and may not be suitable for all individuals. Before making any trading decisions, please consult with a qualified financial professional to understand the risks involved.
By using this script, you acknowledge and agree that any trading decisions are made solely at your discretion and risk.
Do not use this indicator on Heikin-Ashi, Renko, Kagi, Point-and-Figure, or Range charts, as these chart types can produce unrealistic results for signal markers and alerts.
Best regards and happy trading
Chervolino

Squeeze Hour Frequency [CHE]Squeeze Hour Frequency (ATR-PR) — Standalone — Tracks daily squeeze occurrences by hour to reveal time-based volatility patterns
Summary
This indicator identifies periods of unusually low volatility, defined as squeezes, and tallies their frequency across each hour of the day over historical trading sessions. By aggregating counts into a sortable table, it helps users spot hours prone to these conditions, enabling better scheduling of trading activity to avoid or target specific intraday regimes. Signals gain robustness through percentile-based detection that adapts to recent volatility history, differing from fixed-threshold methods by focusing on relative lowness rather than absolute levels, which reduces false positives in varying market environments.
Motivation: Why this design?
Traders often face uneven intraday volatility, with certain hours showing clustered low-activity phases that precede or follow breakouts, leading to mistimed entries or overlooked calm periods. The core idea of hourly squeeze frequency addresses this by binning low-volatility events into 24 hourly slots and counting distinct daily occurrences, providing a historical profile of when squeezes cluster. This reveals time-of-day biases without relying on real-time alerts, allowing proactive adjustments to session focus.
What’s different vs. standard approaches?
- Reference baseline: Classical volatility tools like simple moving average crossovers or fixed ATR thresholds, which flag squeezes uniformly across the day.
- Architecture differences:
- Uses persistent arrays to track one squeeze per hour per day, preventing overcounting within sessions.
- Employs custom sorting on ratio arrays for dynamic table display, prioritizing top or bottom performers.
- Handles timezones explicitly to ensure consistent binning across global assets.
- Practical effect: Charts show a persistent table ranking hours by squeeze share, making intraday patterns immediately visible—such as a top hour capturing over 20 percent of total events—unlike static overlays that ignore temporal distribution, which matters for avoiding low-liquidity traps in crypto or forex.
How it works (technical)
The indicator first computes a rolling volatility measure over a specified lookback period. It then derives a relative ranking of the current value against recent history within a window of bars. A squeeze is flagged when this ranking falls below a user-defined cutoff, indicating the value is among the lowest in the recent sample.
On each bar, the local hour is extracted using the selected timezone. If a squeeze occurs and the bar has price data, the count for that hour increments only if no prior mark exists for the current day, using a persistent array to store the last marked day per hour. This ensures one tally per unique trading day per slot.
At the final bar, arrays compile counts and ratios for all 24 hours, where the ratio represents each hour's share of total squeezes observed. These are sorted ascending or descending based on display mode, and the top or bottom subset populates the table. Background shading highlights live squeezes in red for visual confirmation. Initialization uses zero-filled arrays for counts and negative seeds for day tracking, with state persisting across bars via variable declarations.
No higher timeframe data is pulled, so there is no repaint risk from external fetches; all logic runs on confirmed bars.
Parameter Guide
ATR Length — Controls the lookback for the volatility measure, influencing sensitivity to short-term fluctuations; shorter values increase responsiveness but add noise, longer ones smooth for stability — Default: 14 — Trade-offs/Tips: Use 10-20 for intraday charts to balance quick detection with fewer false squeezes; test on historical data to avoid over-smoothing in trending markets.
Percentile Window (bars) — Sets the history depth for ranking the current volatility value, affecting how "low" is defined relative to past; wider windows emphasize long-term norms — Default: 252 — Trade-offs/Tips: 100-300 bars suit daily cycles; narrower for fast assets like crypto to catch recent regimes, but risks instability in sparse data.
Squeeze threshold (PR < x) — Defines the cutoff for flagging low relative volatility, where values below this mark a squeeze; lower thresholds tighten detection for rarer events — Default: 10.0 — Trade-offs/Tips: 5-15 percent for conservative signals reducing false positives; raise to 20 for more frequent highlights in high-vol environments, monitoring for increased noise.
Timezone — Specifies the reference for hourly binning, ensuring alignment with market sessions — Default: Exchange — Trade-offs/Tips: Set to "America/New_York" for US assets; mismatches can skew counts, so verify against chart timezone.
Show Table — Toggles the results display, essential for reviewing frequencies — Default: true — Trade-offs/Tips: Disable on mobile for performance; pair with position tweaks for clean overlays.
Pos — Places the table on the chart pane — Default: Top Right — Trade-offs/Tips: Bottom Left avoids candle occlusion on volatile charts.
Font — Adjusts text readability in the table — Default: normal — Trade-offs/Tips: Tiny for dense views, large for emphasis on key hours.
Dark — Applies high-contrast colors for visibility — Default: true — Trade-offs/Tips: Toggle false in light themes to prevent washout.
Display — Filters table rows to focus on extremes or full list — Default: All — Trade-offs/Tips: Top 3 for quick scans of risky hours; Bottom 3 highlights safe low-squeeze periods.
Reading & Interpretation
Red background shading appears on bars meeting the squeeze condition, signaling current low relative volatility. The table lists hours as "H0" to "H23", with columns for daily squeeze counts, percentage share of total squeezes (summing to 100 percent across hours), and an arrow marker on the top hour. A summary row above details the peak count, its share, and the leading hour. A label at the last bar recaps total days observed, data-valid days, and top hour stats. Rising shares indicate clustering, suggesting regime persistence in that slot.
Practical Workflows & Combinations
- Trend following: Scan for hours with low squeeze shares to enter during stable regimes; confirm with higher highs or lower lows on the 15-minute chart, avoiding top-share hours post-news like tariff announcements.
- Exits/Stops: Tighten stops in high-share hours to guard against sudden vol spikes; use the table to shift to conservative sizing outside peak squeeze times.
- Multi-asset/Multi-TF: Defaults work across crypto pairs on 5-60 minute timeframes; for stocks, widen percentile window to 500 bars. Combine with volume oscillators—enter only if squeeze count is below average for the asset.
Behavior, Constraints & Performance
Logic executes on closed bars, with live bars updating counts provisionally but finalizing on confirmation; table refreshes only at the last bar, avoiding intrabar flicker. No security calls or higher timeframes, so no repaint from external data. Resources include a 5000-bar history limit, loops up to 24 iterations for sorting and totals, and arrays sized to 24 elements; labels and table are capped at 500 each for efficiency. Known limits: Skips hours without bars (e.g., weekends), assumes uniform data availability, and may undercount in sparse sessions; timezone shifts can alter profiles without warning.
Sensible Defaults & Quick Tuning
Start with ATR Length at 14, Percentile Window at 252, and threshold at 10.0 for broad crypto use. If too many squeezes flag (noisy table), raise threshold to 15.0 and narrow window to 100 for stricter relative lowness. For sluggish detection in calm markets, drop ATR Length to 10 and threshold to 5.0 to capture subtler dips. In high-vol assets, widen window to 500 and threshold to 20.0 for stability.
What this indicator is—and isn’t
This is a historical frequency tracker and visualization layer for intraday volatility patterns, best as a filter in multi-tool setups. It is not a standalone signal generator, predictive model, or risk manager—pair it with price action, news filters, and position sizing rules.
Disclaimer
The content provided, including all code and materials, is strictly for educational and informational purposes only. It is not intended as, and should not be interpreted as, financial advice, a recommendation to buy or sell any financial instrument, or an offer of any financial product or service. All strategies, tools, and examples discussed are provided for illustrative purposes to demonstrate coding techniques and the functionality of Pine Script within a trading context.
Any results from strategies or tools provided are hypothetical, and past performance is not indicative of future results. Trading and investing involve high risk, including the potential loss of principal, and may not be suitable for all individuals. Before making any trading decisions, please consult with a qualified financial professional to understand the risks involved.
By using this script, you acknowledge and agree that any trading decisions are made solely at your discretion and risk.
Do not use this indicator on Heikin-Ashi, Renko, Kagi, Point-and-Figure, or Range charts, as these chart types can produce unrealistic results for signal markers and alerts.
Best regards and happy trading
Chervolino
Thanks to Duyck
for the ma sorter

Arisa RSI Rebound Alert (v6.2)Short description:
Simple RSI-based rebound detection with ATR confirmation — designed for traders who prefer a clean and intuitive signal.
Full description:
This indicator detects oversold and rebound phases using RSI and confirms the strength of each rebound with ATR slope analysis.
It is optimized for deep correction phases (e.g. RSI 25→35 cross), helping traders catch early reversal signals while avoiding unnecessary noise.
💡 Recommended use:
• Timeframes: 30min–4h
• Ideal for short- to mid-term rebound trades
• Combine with Heikin-Ashi or volume expansion for higher accuracy
✨ Key Features:
• Clear oversold/rebound thresholds (default RSI <25 / cross-up >35)
• Background highlight for deep oversold conditions
• Visual markers for strong vs. weak rebounds (ATR slope filter)
• Alert-ready (three conditions included)
🪶 Concept:
This script is designed for traders who value simplicity and intuition — focusing on meaningful signals rather than automation overload.
It’s for those who still want to see and feel the market before taking action.
⸻
Author:
Arisa Sanjo (Japan)
Created with the support of GPT-5, based on live trading insights from October 2025.
License:
Free to use and modify with proper attribution.
If you redistribute or enhance this script, please mention “Based on Arisa RSI Rebound Alert (v6.2)” in your description.
Stochastic Enhanced [DCAUT]█ Stochastic Enhanced
📊 ORIGINALITY & INNOVATION
The Stochastic Enhanced indicator builds upon George Lane's classic momentum oscillator (developed in the late 1950s) by providing comprehensive smoothing algorithm flexibility. While traditional implementations limit users to Simple Moving Average (SMA) smoothing, this enhanced version offers 21 advanced smoothing algorithms, allowing traders to optimize the indicator's characteristics for different market conditions and trading styles.
Key Improvements:
Extended from single SMA smoothing to 21 professional-grade algorithms including adaptive filters (KAMA, FRAMA), zero-lag methods (ZLEMA, T3), and advanced digital filters (Kalman, Laguerre)
Maintains backward compatibility with traditional Stochastic calculations through SMA default setting
Unified smoothing algorithm applies to both %K and %D lines for consistent signal processing characteristics
Enhanced visual feedback with clear color distinction and background fill highlighting for intuitive signal recognition
Comprehensive alert system covering crossovers and zone entries for systematic trade management
Differentiation from Traditional Stochastic:
Traditional Stochastic indicators use fixed SMA smoothing, which introduces consistent lag regardless of market volatility. This enhanced version addresses the limitation by offering adaptive algorithms that adjust to market conditions (KAMA, FRAMA), reduce lag without sacrificing smoothness (ZLEMA, T3, HMA), or provide superior noise filtering (Kalman Filter, Laguerre filters). The flexibility helps traders balance responsiveness and stability according to their specific needs.
📐 MATHEMATICAL FOUNDATION
Core Stochastic Calculation:
The Stochastic Oscillator measures the position of the current close relative to the high-low range over a specified period:
Step 1: Raw %K Calculation
%K_raw = 100 × (Close - Lowest Low) / (Highest High - Lowest Low)
Where:
Close = Current closing price
Lowest Low = Lowest low over the %K Length period
Highest High = Highest high over the %K Length period
Result ranges from 0 (close at period low) to 100 (close at period high)
Step 2: Smoothed %K Calculation
%K = MA(%K_raw, K Smoothing Period, MA Type)
Where:
MA = Selected moving average algorithm (SMA, EMA, etc.)
K Smoothing = 1 for Fast Stochastic, 3+ for Slow Stochastic
Traditional Fast Stochastic uses %K_raw directly without smoothing
Step 3: Signal Line %D Calculation
%D = MA(%K, D Smoothing Period, MA Type)
Where:
%D acts as a signal line and moving average of %K
D Smoothing typically set to 3 periods in traditional implementations
Both %K and %D use the same MA algorithm for consistent behavior
Available Smoothing Algorithms (21 Options):
Standard Moving Averages:
SMA (Simple): Equal-weighted average, traditional default, consistent lag characteristics
EMA (Exponential): Recent price emphasis, faster response to changes, exponential decay weighting
RMA (Rolling/Wilder's): Smoothed average used in RSI, less reactive than EMA
WMA (Weighted): Linear weighting favoring recent data, moderate responsiveness
VWMA (Volume-Weighted): Incorporates volume data, reflects market participation intensity
Advanced Moving Averages:
HMA (Hull): Reduced lag with smoothness, uses weighted moving averages and square root period
ALMA (Arnaud Legoux): Gaussian distribution weighting, minimal lag with good noise reduction
LSMA (Least Squares): Linear regression based, fits trend line to data points
DEMA (Double Exponential): Reduced lag compared to EMA, uses double smoothing technique
TEMA (Triple Exponential): Further lag reduction, triple smoothing with lag compensation
ZLEMA (Zero-Lag Exponential): Lag elimination attempt using error correction, very responsive
TMA (Triangular): Double-smoothed SMA, very smooth but slower response
Adaptive & Intelligent Filters:
T3 (Tilson T3): Six-pass exponential smoothing with volume factor adjustment, excellent smoothness
FRAMA (Fractal Adaptive): Adapts to market fractal dimension, faster in trends, slower in ranges
KAMA (Kaufman Adaptive): Efficiency ratio based adaptation, responds to volatility changes
McGinley Dynamic: Self-adjusting mechanism following price more accurately, reduced whipsaws
Kalman Filter: Optimal estimation algorithm from aerospace engineering, dynamic noise filtering
Advanced Digital Filters:
Ultimate Smoother: Advanced digital filter design, superior noise rejection with minimal lag
Laguerre Filter: Time-domain filter with N-order implementation, adjustable lag characteristics
Laguerre Binomial Filter: 6-pole Laguerre filter, extremely smooth output for long-term analysis
Super Smoother: Butterworth filter implementation, removes high-frequency noise effectively
📊 COMPREHENSIVE SIGNAL ANALYSIS
Absolute Level Interpretation (%K Line):
%K Above 80: Overbought condition, price near period high, potential reversal or pullback zone, caution for new long entries
%K in 70-80 Range: Strong upward momentum, bullish trend confirmation, uptrend likely continuing
%K in 50-70 Range: Moderate bullish momentum, neutral to positive outlook, consolidation or mild uptrend
%K in 30-50 Range: Moderate bearish momentum, neutral to negative outlook, consolidation or mild downtrend
%K in 20-30 Range: Strong downward momentum, bearish trend confirmation, downtrend likely continuing
%K Below 20: Oversold condition, price near period low, potential bounce or reversal zone, caution for new short entries
Crossover Signal Analysis:
%K Crosses Above %D (Bullish Cross): Momentum shifting bullish, faster line overtakes slower signal, consider long entry especially in oversold zone, strongest when occurring below 20 level
%K Crosses Below %D (Bearish Cross): Momentum shifting bearish, faster line falls below slower signal, consider short entry especially in overbought zone, strongest when occurring above 80 level
Crossover in Midrange (40-60): Less reliable signals, often in choppy sideways markets, require additional confirmation from trend or volume analysis
Multiple Failed Crosses: Indicates ranging market or choppy conditions, reduce position sizes or avoid trading until clear directional move
Advanced Divergence Patterns (%K Line vs Price):
Bullish Divergence: Price makes lower low while %K makes higher low, indicates weakening bearish momentum, potential trend reversal upward, more reliable when %K in oversold zone
Bearish Divergence: Price makes higher high while %K makes lower high, indicates weakening bullish momentum, potential trend reversal downward, more reliable when %K in overbought zone
Hidden Bullish Divergence: Price makes higher low while %K makes lower low, indicates trend continuation in uptrend, bullish trend strength confirmation
Hidden Bearish Divergence: Price makes lower high while %K makes higher high, indicates trend continuation in downtrend, bearish trend strength confirmation
Momentum Strength Analysis (%K Line Slope):
Steep %K Slope: Rapid momentum change, strong directional conviction, potential for extended moves but also increased reversal risk
Gradual %K Slope: Steady momentum development, sustainable trends more likely, lower probability of sharp reversals
Flat or Horizontal %K: Momentum stalling, potential reversal or consolidation ahead, wait for directional break before committing
%K Oscillation Within Range: Indicates ranging market, sideways price action, better suited for range-trading strategies than trend following
🎯 STRATEGIC APPLICATIONS
Mean Reversion Strategy (Range-Bound Markets):
Identify ranging market conditions using price action or Bollinger Bands
Wait for Stochastic to reach extreme zones (above 80 for overbought, below 20 for oversold)
Enter counter-trend position when %K crosses %D in extreme zone (sell on bearish cross above 80, buy on bullish cross below 20)
Set profit targets near opposite extreme or midline (50 level)
Use tight stop-loss above recent swing high/low to protect against breakout scenarios
Exit when Stochastic reaches opposite extreme or %K crosses %D in opposite direction
Trend Following with Momentum Confirmation:
Identify primary trend direction using higher timeframe analysis or moving averages
Wait for Stochastic pullback to oversold zone (<20) in uptrend or overbought zone (>80) in downtrend
Enter in trend direction when %K crosses %D confirming momentum shift (bullish cross in uptrend, bearish cross in downtrend)
Use wider stops to accommodate normal trend volatility
Add to position on subsequent pullbacks showing similar Stochastic pattern
Exit when Stochastic shows opposite extreme with failed cross or bearish/bullish divergence
Divergence-Based Reversal Strategy:
Scan for divergence between price and Stochastic at swing highs/lows
Confirm divergence with at least two price pivots showing divergent Stochastic readings
Wait for %K to cross %D in direction of anticipated reversal as entry trigger
Enter position in divergence direction with stop beyond recent swing extreme
Target profit at key support/resistance levels or Fibonacci retracements
Scale out as Stochastic reaches opposite extreme zone
Multi-Timeframe Momentum Alignment:
Analyze Stochastic on higher timeframe (4H or Daily) for primary trend bias
Switch to lower timeframe (1H or 15M) for precise entry timing
Only take trades where lower timeframe Stochastic signal aligns with higher timeframe momentum direction
Higher timeframe Stochastic in bullish zone (>50) = only take long entries on lower timeframe
Higher timeframe Stochastic in bearish zone (<50) = only take short entries on lower timeframe
Exit when lower timeframe shows counter-signal or higher timeframe momentum reverses
Zone Transition Strategy:
Monitor Stochastic for transitions between zones (oversold to neutral, neutral to overbought, etc.)
Enter long when Stochastic crosses above 20 (exiting oversold), signaling momentum shift from bearish to neutral/bullish
Enter short when Stochastic crosses below 80 (exiting overbought), signaling momentum shift from bullish to neutral/bearish
Use zone midpoint (50) as dynamic support/resistance for position management
Trail stops as Stochastic advances through favorable zones
Exit when Stochastic fails to maintain momentum and reverses back into prior zone
📋 DETAILED PARAMETER CONFIGURATION
%K Length (Default: 14):
Lower Values (5-9): Highly sensitive to price changes, generates more frequent signals, increased false signals in choppy markets, suitable for very short-term trading and scalping
Standard Values (10-14): Balanced sensitivity and reliability, traditional default (14) widely used,适合 swing trading and intraday strategies
Higher Values (15-21): Reduced sensitivity, smoother oscillations, fewer but potentially more reliable signals, better for position trading and lower timeframe noise reduction
Very High Values (21+): Slow response, long-term momentum measurement, fewer trading signals, suitable for weekly or monthly analysis
%K Smoothing (Default: 3):
Value 1: Fast Stochastic, uses raw %K calculation without additional smoothing, most responsive to price changes, generates earliest signals with higher noise
Value 3: Slow Stochastic (default), traditional smoothing level, reduces false signals while maintaining good responsiveness, widely accepted standard
Values 5-7: Very slow response, extremely smooth oscillations, significantly reduced whipsaws but delayed entry/exit timing
Recommendation: Default value 3 suits most trading scenarios, active short-term traders may use 1, conservative long-term positions use 5+
%D Smoothing (Default: 3):
Lower Values (1-2): Signal line closely follows %K, frequent crossover signals, useful for active trading but requires strict filtering
Standard Value (3): Traditional setting providing balanced signal line behavior, optimal for most trading applications
Higher Values (4-7): Smoother signal line, fewer crossover signals, reduced whipsaws but slower confirmation, better for trend trading
Very High Values (8+): Signal line becomes slow-moving reference, crossovers rare and highly significant, suitable for long-term position changes only
Smoothing Type Algorithm Selection:
For Trending Markets:
ZLEMA, DEMA, TEMA: Reduced lag for faster trend entry, quick response to momentum shifts, suitable for strong directional moves
HMA, ALMA: Good balance of smoothness and responsiveness, effective for clean trend following without excessive noise
EMA: Classic choice for trending markets, faster than SMA while maintaining reasonable stability
For Ranging/Choppy Markets:
Kalman Filter, Super Smoother: Superior noise filtering, reduces false signals in sideways action, helps identify genuine reversal points
Laguerre Filters: Smooth oscillations with adjustable lag, excellent for mean reversion strategies in ranges
T3, TMA: Very smooth output, filters out market noise effectively, clearer extreme zone identification
For Adaptive Market Conditions:
KAMA: Automatically adjusts to market efficiency, fast in trends and slow in congestion, reduces whipsaws during transitions
FRAMA: Adapts to fractal market structure, responsive during directional moves, conservative during uncertainty
McGinley Dynamic: Self-adjusting smoothing, follows price naturally, minimizes lag in trending markets while filtering noise in ranges
For Conservative Long-Term Analysis:
SMA: Traditional choice, predictable behavior, widely understood characteristics
RMA (Wilder's): Smooth oscillations, reduced sensitivity to outliers, consistent behavior across market conditions
Laguerre Binomial Filter: Extremely smooth output, ideal for weekly/monthly timeframe analysis, eliminates short-term noise completely
Source Selection:
Close (Default): Standard choice using closing prices, most common and widely tested
HLC3 or OHLC4: Incorporates more price information, reduces impact of sudden spikes or gaps, smoother oscillator behavior
HL2: Midpoint of high-low range, emphasizes intrabar volatility, useful for markets with wide intraday ranges
Custom Source: Can use other indicators as input (e.g., Heikin Ashi close, smoothed price), creates derivative momentum indicators
📈 PERFORMANCE ANALYSIS & COMPETITIVE ADVANTAGES
Responsiveness Characteristics:
Traditional SMA-Based Stochastic:
Fixed lag regardless of market conditions, consistent delay of approximately (K Smoothing + D Smoothing) / 2 periods
Equal treatment of trending and ranging markets, no adaptation to volatility changes
Predictable behavior but suboptimal in varying market regimes
Enhanced Version with Adaptive Algorithms:
KAMA and FRAMA reduce lag by up to 40-60% in strong trends compared to SMA while maintaining similar smoothness in ranges
ZLEMA and T3 provide near-zero lag characteristics for early entry signals with acceptable noise levels
Kalman Filter and Super Smoother offer superior noise rejection, reducing false signals in choppy conditions by estimations of 30-50% compared to SMA
Performance improvements vary by algorithm selection and market conditions
Signal Quality Improvements:
Adaptive algorithms help reduce whipsaw trades in ranging markets by adjusting sensitivity dynamically
Advanced filters (Kalman, Laguerre, Super Smoother) provide clearer extreme zone readings for mean reversion strategies
Zero-lag methods (ZLEMA, DEMA, TEMA) generate earlier crossover signals in trending markets for improved entry timing
Smoother algorithms (T3, Laguerre Binomial) reduce false extreme zone touches for more reliable overbought/oversold signals
Comparison with Standard Implementations:
Versus Basic Stochastic: Enhanced version offers 21 smoothing options versus single SMA, allowing optimization for specific market characteristics and trading styles
Versus RSI: Stochastic provides range-bound measurement (0-100) with clear extreme zones, RSI measures momentum speed, Stochastic offers clearer visual overbought/oversold identification
Versus MACD: Stochastic bounded oscillator suitable for mean reversion, MACD unbounded indicator better for trend strength, Stochastic excels in range-bound and oscillating markets
Versus CCI: Stochastic has fixed bounds (0-100) for consistent interpretation, CCI unbounded with variable extremes, Stochastic provides more standardized extreme readings across different instruments
Flexibility Advantages:
Single indicator adaptable to multiple strategies through algorithm selection rather than requiring different indicator variants
Ability to optimize smoothing characteristics for specific instruments (e.g., smoother for crypto volatility, faster for forex trends)
Multi-timeframe analysis with consistent algorithm across timeframes for coherent momentum picture
Backtesting capability with algorithm as optimization parameter for strategy development
Limitations and Considerations:
Increased complexity from multiple algorithm choices may lead to over-optimization if parameters are curve-fitted to historical data
Adaptive algorithms (KAMA, FRAMA) have adjustment periods during market regime changes where signals may be less reliable
Zero-lag algorithms sacrifice some smoothness for responsiveness, potentially increasing noise sensitivity in very choppy conditions
Performance characteristics vary significantly across algorithms, requiring understanding and testing before live implementation
Like all oscillators, Stochastic can remain in extreme zones for extended periods during strong trends, generating premature reversal signals
USAGE NOTES
This indicator is designed for technical analysis and educational purposes to provide traders with enhanced flexibility in momentum analysis. The Stochastic Oscillator has limitations and should not be used as the sole basis for trading decisions.
Important Considerations:
Algorithm performance varies with market conditions - no single smoothing method is optimal for all scenarios
Extreme zone signals (overbought/oversold) indicate potential reversal areas but not guaranteed turning points, especially in strong trends
Crossover signals may generate false entries during sideways choppy markets regardless of smoothing algorithm
Divergence patterns require confirmation from price action or additional indicators before trading
Past indicator characteristics and backtested results do not guarantee future performance
Always combine Stochastic analysis with proper risk management, position sizing, and multi-indicator confirmation
Test selected algorithm on historical data of specific instrument and timeframe before live trading
Market regime changes may require algorithm adjustment for optimal performance
The enhanced smoothing options are intended to provide tools for optimizing the indicator's behavior to match individual trading styles and market characteristics, not to create a perfect predictive tool. Responsible usage includes understanding the mathematical properties of selected algorithms and their appropriate application contexts.
