Heikin Ashi of Candle RSIThis is indicator plot Heikin Ashi of chart with RSI data
You can use this indicator like normal RSI with divergence or cross overbought oversold level
It can help you find pivot better and have better visual of market conditions when market overbought or oversold
Cari dalam skrip untuk "Heikin Ashi"

heikin ashi calculation call with higher timeframe
Hello, guys
This indicater displays the previous value of higher timeframe without request.security() function.
You can change the candle style ( heikinashi or normal) on the set box.
you can choose the higher timeframe also.
I made this to avoid the repainting.
Without Box() function, i only used plotcandle and fill.
It was good fun.
Good luck !!

True BarcolorHeikin Ashi can be useful for understanding trend based on price action but it doesn't take volume in context. Here I have tried to use volume for understanding true bar color and ultimately true trend analysis. It can also help you in not getting trapped in sudden shakeouts. Also, you can use it for averaging of your existing position.
Conditions used:
Relative closing price
Relative volume against previous bar and overall moving average of volume
Volume analysis
Trend analysis

Heikin Ashi + Price Action Crypto LONG StrategyThis is a simple and efficient crypto strategy, designed for big timeframes like 12/24h.
On history it beats buy and hold strategy in many ocasions, and because of a low DD, pyramid can be used to elevate our winnings while still keeping a low DD < 40% avg.
For the purpose of this example, I used 100% of the capital on each trades, together with a comission of 0.1%
Warning : THERE IS NO STOP LOSS ON THIS STRATEGY ,USE IT AT YOUR OWN RISK
This strategy is made with inside Heikin Ashi candles , together with some price actions logics like for long Close > High and green candle and High > High .
We exit when we have a red candle and the current close is lower than the previous Low
If you have any questions, message me in private !

Heikin Ashi Candle Colour Change AlertsThis script allows you to set alerts for Heikin Ashi up and down candles. For example, you may wish to exit a trade when the first down candle is printed after a sequence of up candles.

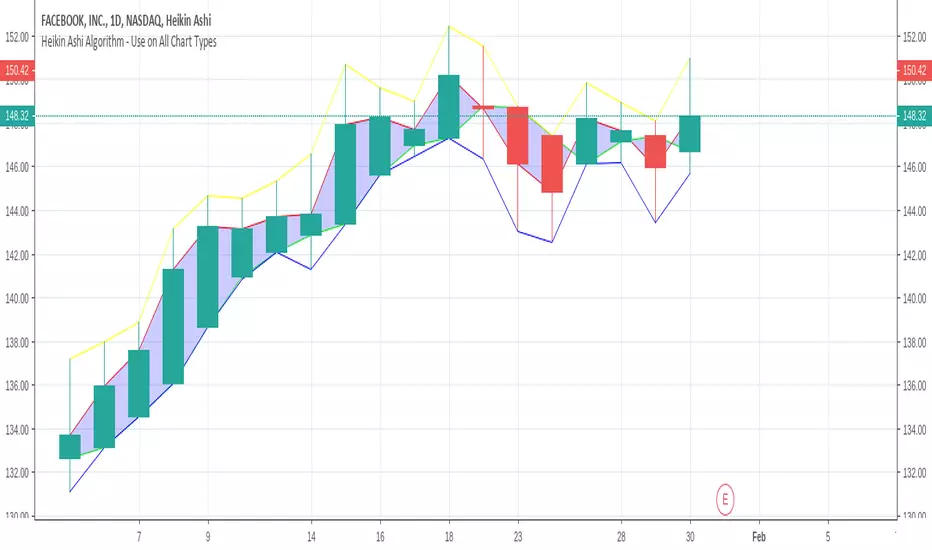
Heikin Ashi AlgorithmThis indicator can be added on any type of chart (including Heikin Ashi chart). There is a little trick with the tickerid, read details in comments.
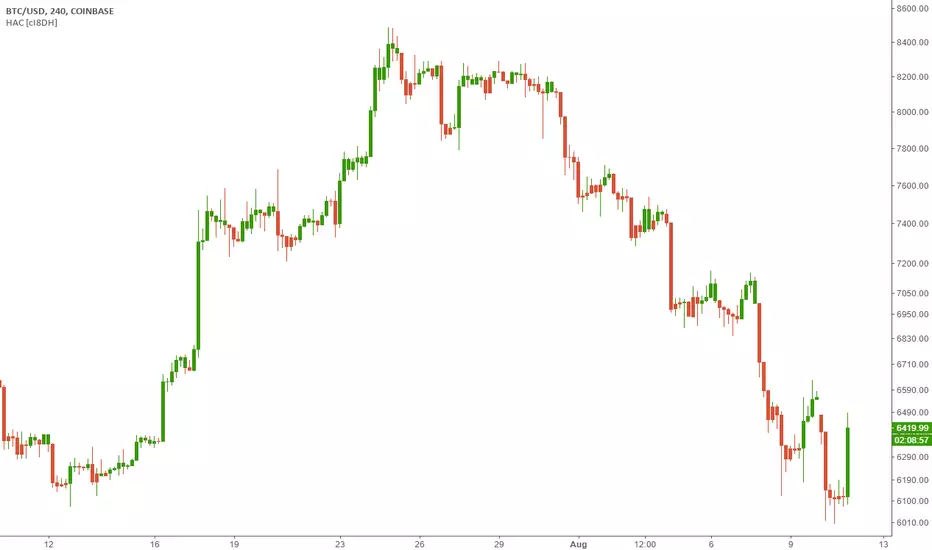
Heikin Ashi Colors (HAC) [cI8DH]This indicator changes normal candle chart colors based on Heikin Ashi (HA) candle colors. It can be useful for having your indicators to calculate based on normal candle chart while benefiting from HA candle magic.
There is a 4 color option. Chart below shows how it works:
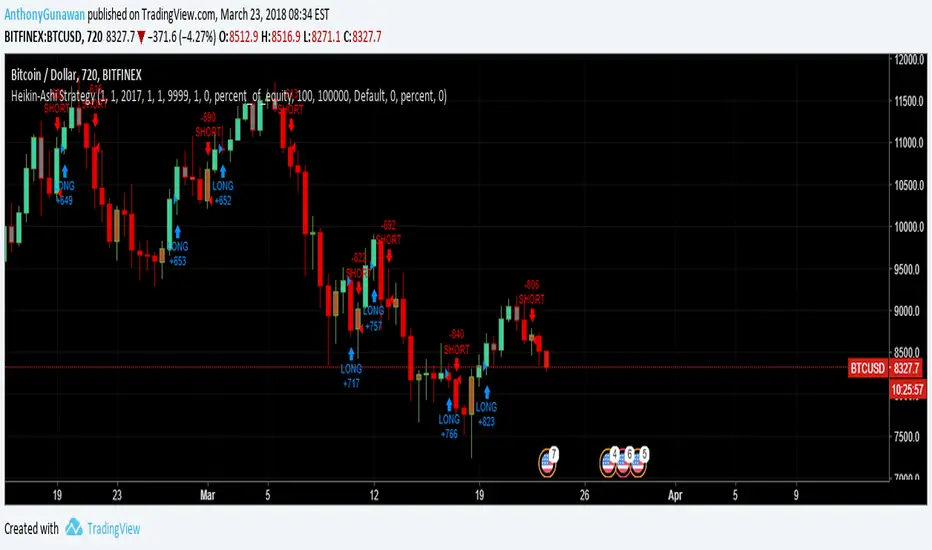
Heikin-Ashi Strategy + backtest rangeThis is Heikin-Ashi Strategy + Backtest range that I think useful for BTCUSD pair.
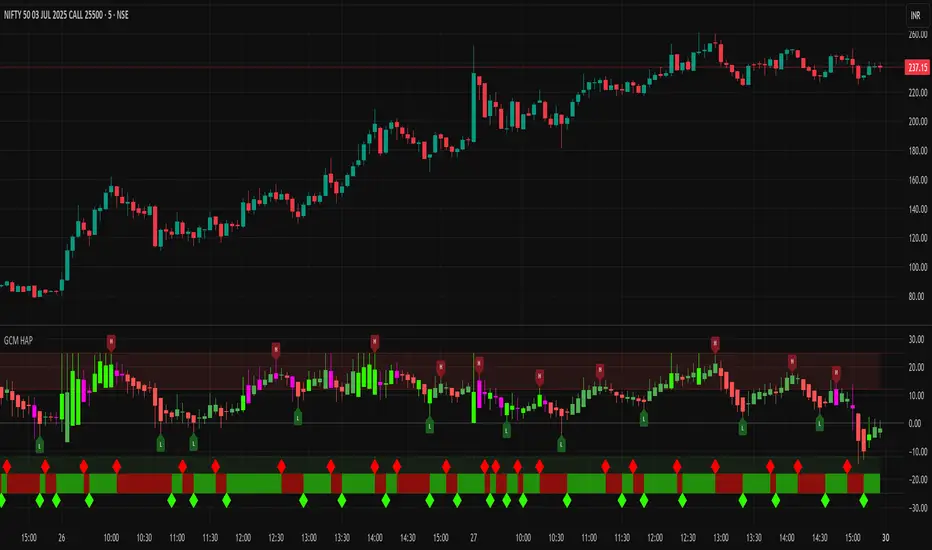
GCM Heikin Ashi with PivotsTitle: GCM Heikin Ashi with Pivots
Description:
Overview
This indicator provides a powerful combination of trend visualization, precise reversal signals, and volume confirmation in a clean, customizable sub-chart. It is designed to help traders identify trend momentum using Heikin Ashi candles, pinpoint confirmed swing highs and lows (pivots), and spot surges in buying pressure with our unique Volume Rate-of-Change (VROC) highlighter.
The key feature of this script is its non-repainting pivot signals. A pivot high or low is only confirmed and plotted after a specific number of subsequent bars have closed, ensuring the signals are reliable and do not change after they appear.
Key Features
Heikin Ashi Sub-Chart: Displays smoothed Heikin Ashi candles in a separate pane to clearly visualize trend strength and direction without cluttering the main price chart.
Non-Repainting Pivot Signals: Uses ta.pivothigh and ta.pivotlow to identify confirmed swing points. The signals will not repaint or move once they are printed on the chart.
Smart Volume Spike Analysis (VROC): A Heikin Ashi candle will be highlighted in a distinct bright green (#2dff00) when the volume increases significantly on a bullish price candle. This "volume-confirmed" candle can signal strong conviction behind a move.
Complete Label Customization: Take full control over the look and feel of your signals:
Label Mode: Choose between "High & Low" (H/L) or "Buy & Sell" (B/S) to match your trading terminology.
Custom Colors: Set unique colors for both the high and low pivot labels.
Label Style: Select from various shapes like boxes, circles, diamonds, or squares.
Label Size: Adjust the size of the labels from Tiny to Huge for perfect visibility.
Adjustable Pivot Sensitivity: Fine-tune the pivot detection algorithm by setting the number of bars required to the left (strength) and right (confirmation) of a pivot point.
How to Use & Interpret the Signals
Assess the Trend with Heikin Ashi:
A series of green HA candles with little to no lower wicks indicates strong bullish momentum.
A series of red HA candles with little to no upper wicks indicates strong bearish momentum.
Look for Volume Confirmation:
A bright green highlighted candle signals a surge in buying pressure (VROC spike). This adds significant weight to bullish moves and can act as a leading indicator for a new leg up.
Identify Entry/Exit Points with Pivot Labels:
An "L" or "B" label marks a confirmed swing low. This is a potential buying opportunity, especially if it is followed by green Heikin Ashi candles and, ideally, a bright green VROC spike candle.
An "H" or "S" label marks a confirmed swing high. This is a potential selling/shorting opportunity, especially as HA candles turn red.
Example Strategy (High-Confluence)
A powerful way to use this indicator is to look for a sequence of events:
Wait for a "Buy" (B) or "Low" (L) signal to appear, confirming a bottom has likely formed.
Wait for the first bright green VROC spike candle to appear after the signal. This confirms that buyers are stepping in with conviction.
Consider an entry based on this high-confluence setup, using the swing low as a potential stop-loss area.
Settings Explained
Pivot Detection:
Left Bars (Strength): Number of bars to the left of a pivot. A higher number finds more significant pivots.
Right Bars (Confirmation): Number of bars to the right required to confirm a pivot. This creates a lag for reliability.
Volume Spike Detection (VROC):
Enable Volume Spike Highlighting: Turn the bright green candle highlight on or off.
VROC Length: The lookback period for calculating the volume's rate of change.
VROC Threshold %: The percentage volume must increase to trigger a highlight.
Label Customization:
Label Text Mode: Choose between "High & Low" or "Buy & Sell".
Label Color, Style, and Size: Full cosmetic control for the pivot labels.
Final Note
This indicator is a tool to aid in technical analysis and should not be used as a standalone trading system. Always use it in conjunction with other analysis methods, proper risk management, and a sound trading plan.
Enjoy!
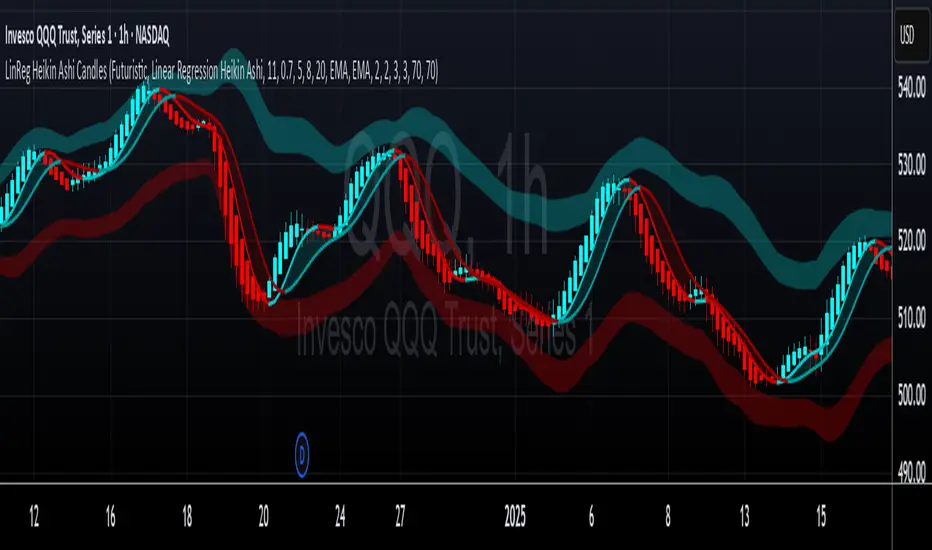
LinReg Heikin Ashi CandlesLinear Regression Heikin Ashi Candles will dramatically change how the candlesticks on your chart will appear. This script creates Heikin Ashi candles from the existing candlesticks and then applies wickless Linear Regression candles as an overlay. The result is an ultra smoothed 'Renko-like' chart that remains time-based and responsive.
Key Features:
Heikin Ashi Base: Provides a smoother representation of price trends by filtering out noise.
Linear Regression Candles on Heikin Ashi: Plots Linear Regression lines as candles on the Heikin Ashi chart, potentially highlighting the immediate trend direction and momentum within the smoothed data. Wicks are intentionally removed for a clearer focus on the linear progression.
Tillson T3 Moving Averages: Includes fast and slow T3 Moving Averages with customizable length and alpha. These smoothed moving averages can help identify trend direction and potential crossover signals. Users can toggle their visibility.
Volatility Bands: Integrates Volatility Bands based on Average True Range (ATR) with customizable length, ATR type (RMA, SMA, EMA, WMA), and inner/outer multipliers. These bands help gauge price volatility and potential reversal zones. Users can toggle the visibility of the basis line.
Customizable Colors: Allows users to customize the colors of the Linear Regression Heikin Ashi bullish and bearish candles.
How to Use:
This is an overlay on your chart so you'll need to 'hide' the existing candlesticks on your chart.
This indicator can be used on any timeframe from seconds to days to quickly identify market trend, gauge volatility, and potentially find entry/exit points. Consider looking for confluence between the candle color/direction, T3 MA crossovers, and price interaction with the Volatility Bands.
Note: This indicator plots Linear Regression directly on Heikin Ashi candles, removing wicks for a focus on the linear trend within the smoothed data. Adjust the input parameters to suit your trading style and the specific market conditions.
HUGE CREDIT to ugurvu who originally created the Linear Regression Candles indicator that my indicator pulls code from.
Innocent Heikin Ashi Ethereum StrategyHello there, im back!
If you are familiar with my previous scripts, this one will seem like the future's nostalgia!
Functionality:
As you can see, all candles are randomly colored. This has no deeper meaning, it should remind you to switch to Heikin Ashi. The Strategy works on standard candle stick charts, but should be used with Heikin Ashi to see the actual results. (Regular OHLC calculations are included.)
Same as in my previous scripts we import our PVSRA Data from @TradersReality open source Indicator.
With this data and the help of moving averages, we have got an edge in the market.
Signal Logic:
When a "violently green" candle appears (high buy volume + tick speed) above the 50 EMA indicates a change in trend and sudden higher prices. Depending on OHLC of the candle itself and volume, Take Profit and Stop Loss is calculated. (The price margin is the only adjustable setting). Additionally, to make this script as simple and easily useable as possible, all other adjustable variables have been already set to the best suitable value and the chart was kept plain, except for the actual entries and exits.
Basic Settings and Adjustables:
Main Input 1: TP and SL combined price range. (Double, Triple R:R equally.)
Trade Inputs: All standard trade size and contract settings for testing available.
Special Settings:
Checkbox 1: Calculate Signal in Heikin Ashi chart, including regular candle OHLC („Open, High, Low, Close“)
Checkbox 2/3: Calculate by order fill or every tick.
Checkbox 4: Possible to fill orders on bar close.
Timeframe and practical usage:
Made for the 5 Minute to 1 hour timeframe.
Literally ONLY works on Ethereum and more or less on Bitcoin.
EVERY other asset has absolute 0% profitability.
Have fun and share with your friends!
Thanks for using!
Example Chart:

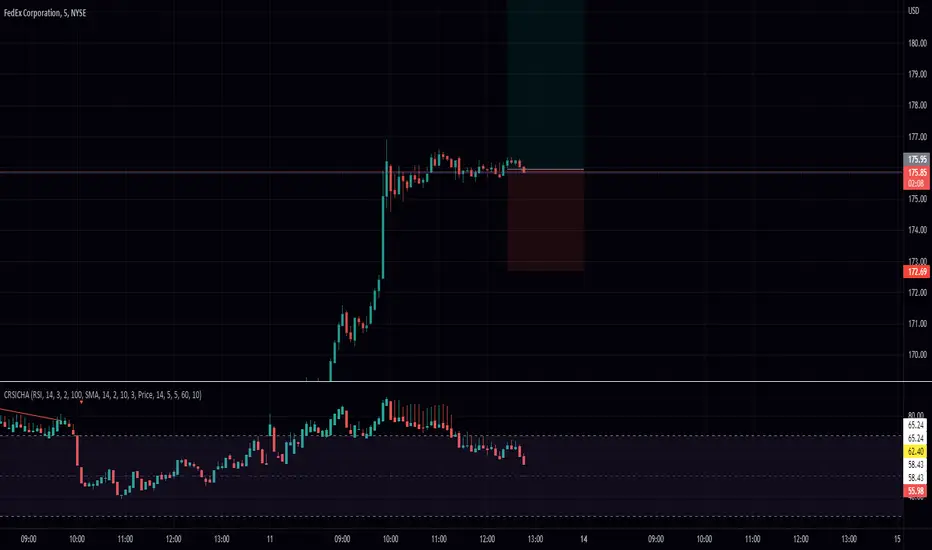
RSI Candle with Connors RSI and Heikin Ashi (CRSICHA)This script was designed to work and feel like the built in RSI script but with a lot of added feature that traders might enjoy. You get to see the RSI represented as candle sticks OR Heikin Ashi. I have added in Connors RSI as a bonus so you can see what this lesser used study looks like in candle form. Just like in the original script I have moving averages and Bollinger Bands. I must say, Heikin Ashi really excells in this situation because you don't need to know an exact price! As always I hope every one finds this useful! Enjoy!
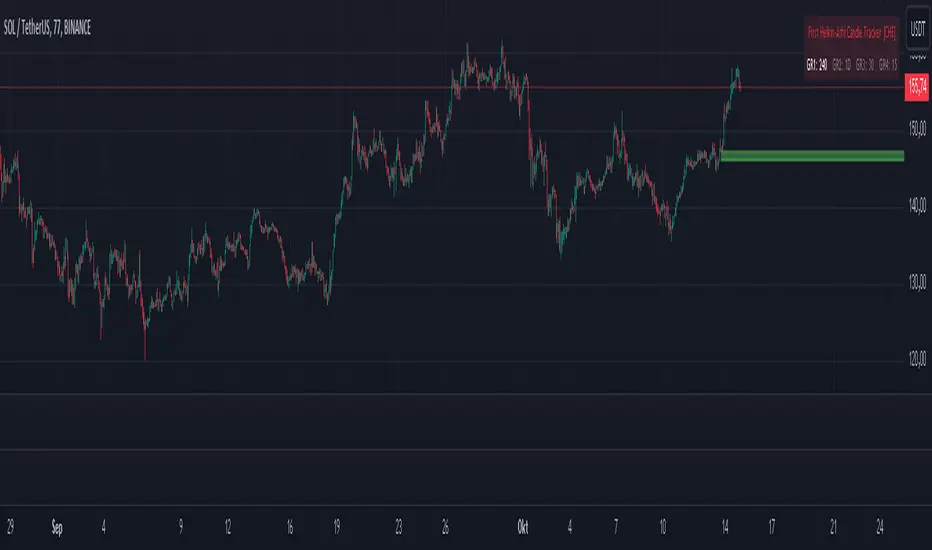
First Heikin-Ashi Candle Tracker [CHE] First Heikin-Ashi Candle Tracker
"A Heikin-Ashi Candle Rarely Comes Alone"
1. Introduction
Fundamental Observation
- "A Heikin-Ashi Candle Rarely Comes Alone"
- This principle highlights the tendency of Heikin-Ashi candles to appear in sequences, indicating sustained trends rather than isolated movements.
- Recognizing these patterns can significantly enhance trading strategies by identifying stronger and more reliable entry points.
2. Understanding Heikin-Ashi Candles
What Are Heikin-Ashi Candles?
- Heikin-Ashi is a type of candlestick chart used to identify market trends more clearly.
- Calculation Method:
- Ha_Close: (Open + High + Low + Close) / 4
- Ha_Open: (Previous Ha_Open + Previous Ha_Close) / 2
- Ha_High: Maximum of High, Ha_Open, Ha_Close
- Ha_Low: Minimum of Low, Ha_Open, Ha_Close
- Visual Differences:
- Smoother appearance compared to traditional candlesticks.
- Helps in filtering out market noise and highlighting the prevailing trend.
Benefits of Heikin-Ashi Candles
- Trend Clarity: Easier identification of uptrends and downtrends.
- Reduced Noise: Minimizes the impact of insignificant price movements.
- Visual Appeal: Cleaner charts enhance decision-making processes.
3. Introducing the First Heikin-Ashi Candle Tracker [CHE ]
Purpose of the Indicator
- Track First Heikin-Ashi Candles: Identifies the initial appearance of Heikin-Ashi candles across multiple timeframes.
- Enhance Trading Decisions: Provides visual cues for potential long and short entries based on trend confirmations.
Key Features
- Multi-Timeframe Support: Monitor Heikin-Ashi candles across different timeframes (e.g., 240, 60, 30, 15 minutes).
- Customizable Visuals: Adjustable colors and line widths for better chart integration.
- User-Friendly Interface: Easy-to-configure settings tailored to individual trading preferences.
- Max Line Management: Controls the number of displayed lines to maintain chart clarity.
4. How to Use the First Heikin-Ashi Candle Tracker
Step-by-Step Guide
1. Enable Desired Groups:
- Activate up to four groups, each representing a different timeframe.
- Customize each group's settings according to your trading strategy.
2. Configure Timeframes:
- Select timeframes that align with your trading style (e.g., short-term vs. long-term).
3. Set Candle Types to Track:
- Choose to monitor Both, Green (Bullish), or Red (Bearish) Heikin-Ashi candles.
- Focus on specific candle types to streamline entry signals.
4. Customize Visual Indicators:
- Adjust Green Line Color and Red Line Color for clear distinction.
- Modify Line Width to ensure visibility without cluttering the chart.
5. Manage Line Limits:
- Set the Max Number of Lines to prevent overcrowding.
- The indicator will automatically remove the oldest lines when the limit is exceeded.
6. Interpret Signals:
- Green Lines: Indicate potential Long entry points.
- Red Lines: Indicate potential Short entry points.
- Observe the sequence and frequency of candles to assess trend strength.
Practical Example
- Uptrend Identification:
- Consecutive green Heikin-Ashi candles with corresponding green lines signal a strong upward trend.
- Consider entering a Long position when the first green candle appears.
- Downtrend Identification:
- Consecutive red Heikin-Ashi candles with corresponding red lines signal a strong downward trend.
- Consider entering a Short position when the first red candle appears.
5. Benefits and Utility
Enhanced Trend Detection
- Early Signals: Identify the beginning of new trends promptly.
- Confirmation: Multiple timeframes provide robust confirmation of trend direction.
Improved Entry Points
- Precision: Pinpoint optimal moments to enter trades, reducing the risk of false signals.
- Flexibility: Suitable for both Long and Short strategies across various markets.
User-Friendly Operation
- Intuitive Settings: Easily configurable to match individual trading preferences.
- Visual Clarity: Clear lines and color-coding facilitate quick decision-making.
Time Efficiency
- Automated Tracking: Saves time by automatically identifying and marking relevant candles.
- Multi-Timeframe Analysis: Consolidates information from different timeframes into a single view.
6. Why Use the First Heikin-Ashi Candle Tracker ?
Strategic Advantages
- Market Insight: Gain deeper understanding of market dynamics through Heikin-Ashi analysis.
- Risk Management: Improved entry points contribute to better risk-reward ratios.
- Versatility: Applicable to various trading instruments, including stocks, forex, and cryptocurrencies.
Why Heikin-Ashi for Entries?
- Trend Reliability: Heikin-Ashi candles smooth out price data, providing more reliable trend indicators.
- Reduced Whipsaws: Fewer false signals compared to traditional candlestick charts.
- Clarity in Decision-Making: Simplifies the process of identifying and acting on market trends.
Conclusion
- The First Heikin-Ashi Candle Tracker is an essential tool for traders seeking to enhance their trend analysis and improve entry strategies.
- By leveraging the power of Heikin-Ashi candles, this indicator offers a clear, user-friendly approach to identifying profitable trading opportunities.
7. Getting Started
Installation
1. Add the Indicator:
- Open TradingView and navigate to the Pine Script editor.
- Paste the translated Pine Script code for the First Heikin-Ashi Candle Tracker .
- Save and add the indicator to your chart.
2. Configure Settings:
- Enable desired groups and set appropriate timeframes.
- Customize colors and line widths as per your preference.
- Adjust the maximum number of lines to maintain chart clarity.
3. Start Trading:
- Monitor the chart for green and red lines indicating potential Long and Short entries.
- Combine with other analysis tools for enhanced trading decisions.
Support and Resources
- Documentation: Refer to the included comments within the Pine Script for detailed explanations.
- Community Forums: Join TradingView communities for tips and shared experiences.
- Customer Support: Reach out for assistance with installation or configuration issues.
8. Disclaimer
The content provided, including all code and materials, is strictly for educational and informational purposes only. It is not intended as, and should not be interpreted as, financial advice, a recommendation to buy or sell any financial instrument, or an offer of any financial product or service. All strategies, tools, and examples discussed are provided for illustrative purposes to demonstrate coding techniques and the functionality of Pine Script within a trading context.
Any results from strategies or tools provided are hypothetical, and past performance is not indicative of future results. Trading and investing involve high risk, including the potential loss of principal, and may not be suitable for all individuals. Before making any trading decisions, please consult with a qualified financial professional to understand the risks involved.
By using this script, you acknowledge and agree that any trading decisions are made solely at your discretion and risk.
Happy Trading!
Best regards
Chervolino (Volker)
Standardized MACD Heikin-Ashi TransformedThe Standardized MACD Heikin-Ashi Transformed (St. MACD) is an advanced indicator designed to overcome the limitations of the traditional MACD. It offers a more robust and standardized measure of momentum, making it comparable across different timeframes and securities. By incorporating the Heikin-Ashi transformation, the St. MACD provides a smoother visualization of trends and potential reversals, enhancing its utility for traders seeking a clearer view of the underlying market direction.
Methodology:
The calculation of St. MACD begins with the traditional MACD, which computes the difference between two exponential moving averages (EMAs) of the price. To address the issue of non-comparability across assets, the St. MACD normalizes its values using the exponential average of the price's height. This normalization process ensures that the indicator's readings are not influenced by the absolute price levels, allowing for objective and quantitatively defined comparisons of momentum strength.
Furthermore, St. MACD utilizes the Heikin-Ashi transformation, which involves deriving candles from the price data. These Heikin-Ashi candles provide a smoother representation of trends and help filter out noise in the market. A predictive curve of Heikin-Ashi candles within the St. MACD turns blue or red, indicating the prevailing trend direction. This feature enables traders to easily identify trend shifts and make better informed trading decisions.
Advantages:
St. MACD offers several key advantages over the traditional MACD-
Standardization: By normalizing the indicator's values, St. MACD becomes comparable across different assets and timeframes. This makes it a valuable tool for traders analyzing various markets and seeking consistent momentum measurements.
Heikin-Ashi Transformation: The integration of the Heikin-Ashi transformation smoothes out the indicator's fluctuations and enhances trend visibility. Traders can more easily identify trends and potential reversal points, improving their market analysis.
Quantifiable Momentum: St. MACD's key levels represent the strength of momentum, providing traders with a quantifiable framework to gauge the intensity of market movements. This feature helps identify periods of increased or decreased momentum.
Utility:
The St. MACD indicator offers versatile utility for traders-
Trend Identification: Traders can use the color-coded predictive curve of Heikin-Ashi candles to swiftly determine the prevailing trend direction. This aids in identifying potential entry and exit points in the market.
Reversal Signals: Colored extremes within the St. MACD signal potential price reversals, alerting traders to potential turning points in the market. This assists in making timely decisions during market inflection points.
Overbought/Oversold Conditions: The histogram version of St. MACD can be used in conjunction with the bands to detect short-term overbought or oversold market conditions, allowing traders to adjust their strategies accordingly.
In conclusion, this tool addresses the limitations of the traditional MACD by providing a standardized and comparable momentum indicator. Its incorporation of the Heikin-Ashi transformation enhances trend visibility and assists traders in making more informed decisions. With its quantifiable momentum measurements and various utility features, the St. MACD is a valuable tool for traders seeking a clearer and more objective view of market trends and reversals.
Key Features:
Display Modes: MACD, Histogram or Hybrid
Reversion Triangles by adjustable thresholds
Bar Coloring Methods: MidLine, Candles, Signal Cross, Extremities, Reversions
Example Charts:
-Traditional limitations-
-Comparisons across time and securities-
-Showcase-
See Also:
-Other Heikin-Ashi Transforms-

8x Heikin Ashi Streak (1m) by Bitcoin Benito🧭 Indicator Description: “8x Heikin Ashi Streak (1m) by Bitcoin Benito”
**Purpose:**
The *8x Heikin Ashi Streak* indicator helps traders quickly identify strong short-term momentum on the **1-minute timeframe**. It automatically tracks Heikin Ashi candles and alerts you whenever **8 consecutive bullish or bearish candles** appear — a visual cue that a strong intraday trend or exhaustion point might be forming.
---
🔍 **How It Works**
* The indicator continuously counts Heikin Ashi candles in real-time.
* When it detects **8 bullish (green)** or **8 bearish (red)** candles in a row:
* A green ▲ marker appears **below** the 8th candle for bullish streaks.
* A red ▼ marker appears **above** the 8th candle for bearish streaks.
* You can set alerts to automatically notify you when these streaks occur.
This makes it ideal for **momentum traders**, **scalpers**, and **trend-reversal spotters** who want to:
* Catch strong intraday moves early.
* Identify potential overextension zones before pullbacks.
* Automate alert signals for short-term trading setups.
IMPORTANT: Only trade when most of the 8 candles are below/above the EMA 8 Line respectively. Add an EMA 8 indicator to see if this is the case
---
⚙️ **How to Use**
1. **Apply to a 1-minute chart** (this script is optimized for 1m timeframes).
2. When the indicator plots a green or red triangle:
* **Green triangle (8 bullish candles):** Trend momentum is strong upward.
* **Red triangle (8 bearish candles):** Downward momentum is dominant.
3. Optionally, combine with volume or EMA filters to confirm breakouts or exhaustion.
---
🔔 **Setting Up Alerts**
* Click the **Alert (🔔)** icon on TradingView.
* Under *Condition*, select:
* “8x Heikin Ashi Streak (1m)” → “8 Bullish Heikin Ashi (1m)”
* OR “8x Heikin Ashi Streak (1m)” → “8 Bearish Heikin Ashi (1m)”
* Choose **Once per bar close** to trigger the alert when the 8th candle completes.
* Add your custom message, e.g.
> “🚀 8 bullish Heikin Ashi candles in a row on 1-minute chart!”
> “🔻 8 bearish Heikin Ashi candles in a row on 1-minute chart!”
---
📊 **Best Practices**
* Works best on **liquid assets** (major forex pairs, indices, BTC/USD, etc.).
* Pair with **RSI**, **EMA**, or **Volume** indicators for stronger confirmation.
* Not a standalone buy/sell signal — treat it as a **momentum or exhaustion alert**.
* Can be adapted to other timeframes by changing chart resolution.
---
⚠️ **Disclaimer**
This indicator is for **educational and analytical purposes only**.
Trading carries risk — always test on demo accounts and use proper risk management.
No indicator guarantees profit; this is a tool for insight and timing, not financial advice.

Sunil BB Blast Heikin Ashi StrategySunil BB Blast Heikin Ashi Strategy
The Sunil BB Blast Heikin Ashi Strategy is a trend-following trading strategy that combines Bollinger Bands with Heikin-Ashi candles for precise market entries and exits. It aims to capitalize on price volatility while ensuring controlled risk through dynamic stop-loss and take-profit levels based on a user-defined Risk-to-Reward Ratio (RRR).
Key Features:
Trading Window:
The strategy operates within a user-defined time window (e.g., from 09:20 to 15:00) to align with market hours or other preferred trading sessions.
Trade Direction:
Users can select between Long Only, Short Only, or Long/Short trade directions, allowing flexibility depending on market conditions.
Bollinger Bands:
Bollinger Bands are used to identify potential breakout or breakdown zones. The strategy enters trades when price breaks through the upper or lower Bollinger Band, indicating a possible trend continuation.
Heikin-Ashi Candles:
Heikin-Ashi candles help smooth price action and filter out market noise. The strategy uses these candles to confirm trend direction and improve entry accuracy.
Risk Management (Risk-to-Reward Ratio):
The strategy automatically adjusts the take-profit (TP) level and stop-loss (SL) based on the selected Risk-to-Reward Ratio (RRR). This ensures that trades are risk-managed effectively.
Automated Alerts and Webhooks:
The strategy includes automated alerts for trade entries and exits. Users can set up JSON webhooks for external execution or trading automation.
Active Position Tracking:
The strategy tracks whether there is an active position (long or short) and only exits when price hits the pre-defined SL or TP levels.
Exit Conditions:
The strategy exits positions when either the take-profit (TP) or stop-loss (SL) levels are hit, ensuring risk management is adhered to.
Default Settings:
Trading Window:
09:20-15:00
This setting confines the strategy to the specified hours, ensuring trading only occurs during active market hours.
Strategy Direction:
Default: Long/Short
This allows for both long and short trades depending on market conditions. You can select "Long Only" or "Short Only" if you prefer to trade in one direction.
Bollinger Band Length (bbLength):
Default: 19
Length of the moving average used to calculate the Bollinger Bands.
Bollinger Band Multiplier (bbMultiplier):
Default: 2.0
Multiplier used to calculate the upper and lower bands. A higher multiplier increases the width of the bands, leading to fewer but more significant trades.
Take Profit Multiplier (tpMultiplier):
Default: 2.0
Multiplier used to determine the take-profit level based on the calculated stop-loss. This ensures that the profit target aligns with the selected Risk-to-Reward Ratio.
Risk-to-Reward Ratio (RRR):
Default: 1.0
The ratio used to calculate the take-profit relative to the stop-loss. A higher RRR means larger profit targets.
Trade Automation (JSON Webhooks):
Allows for integration with external systems for automated execution:
Long Entry JSON: Customizable entry condition for long positions.
Long Exit JSON: Customizable exit condition for long positions.
Short Entry JSON: Customizable entry condition for short positions.
Short Exit JSON: Customizable exit condition for short positions.
Entry Logic:
Long Entry:
The strategy enters a long position when:
The Heikin-Ashi candle shows a bullish trend (green close > open).
The price is above the upper Bollinger Band, signaling a breakout.
The previous candle also closed higher than it opened.
Short Entry:
The strategy enters a short position when:
The Heikin-Ashi candle shows a bearish trend (red close < open).
The price is below the lower Bollinger Band, signaling a breakdown.
The previous candle also closed lower than it opened.
Exit Logic:
Take-Profit (TP):
The take-profit level is calculated as a multiple of the distance between the entry price and the stop-loss level, determined by the selected Risk-to-Reward Ratio (RRR).
Stop-Loss (SL):
The stop-loss is placed at the opposite Bollinger Band level (lower for long positions, upper for short positions).
Exit Trigger:
The strategy exits a trade when either the take-profit or stop-loss level is hit.
Plotting and Visuals:
The Heikin-Ashi candles are displayed on the chart, with green candles for uptrends and red candles for downtrends.
Bollinger Bands (upper, lower, and basis) are plotted for visual reference.
Entry points for long and short trades are marked with green and red labels below and above bars, respectively.
Strategy Alerts:
Alerts are triggered when:
A long entry condition is met.
A short entry condition is met.
A trade exits (either via take-profit or stop-loss).
These alerts can be used to trigger notifications or webhook events for automated trading systems.
Notes:
The strategy is designed for use on intraday charts but can be applied to any timeframe.
It is highly customizable, allowing for tailored risk management and trading windows.
The Sunil BB Blast Heikin Ashi Strategy combines two powerful technical analysis tools (Bollinger Bands and Heikin-Ashi candles) with strong risk management, making it suitable for both beginners and experienced traders.
Feebacks are welcome from the users.

ORB Heikin Ashi SPY 5min Correlation StrategyOverview:
The ORB (Opening Range Breakout) strategy combined with Heikin Ashi candles and Relative Volume (RVOL) indicator aims to capitalize on significant price movements that occur shortly after the market opens. This strategy identifies breakouts above or below the opening range, using Heikin Ashi candles for smoother price visualization and RVOL to gauge the strength of the breakout.
Components:
Opening Range Breakout (ORB): The strategy starts by defining the opening range, typically the first few minutes of the trading session. It then identifies breakouts above the high or below the low of this range as potential entry points.
Heikin Ashi Candles: Heikin Ashi candles are used to provide a smoother representation of price movements compared to traditional candlesticks. By averaging open, close, high, and low prices of the previous candle, Heikin Ashi candles reduce noise and highlight trends more effectively.
Relative Volume (RVOL): RVOL compares the current volume of a stock to its average volume over a specified period. It helps traders identify abnormal trading activity, which can signal potential price movements.
Candle for correlation : In this case we are using SPY candles. It can also use different asset
Strategy Execution:
Initialization: The strategy initializes by setting up variables and parameters, including the ORB period, session timings, and Heikin Ashi candle settings.
ORB Calculation: It calculates the opening range by identifying the high and low prices during the specified session time. These values serve as the initial reference points for potential breakouts. For this we are looking for the first 30 min of the US opening session.
After that we are going to use the next 2 hours to check for breakout opportunities.
Heikin Ashi Transformation: Optionally, the strategy transforms traditional candlestick data into Heikin Ashi format for smoother visualization and trend identification.
Breakout Identification: It continuously monitors price movements within the session and checks if the current high breaches the ORB high or if the current low breaches the ORB low. These events trigger potential long or short entry signals, respectively.
RVOL Analysis: Simultaneously, the strategy evaluates the relative volume of the asset to gauge the strength of the breakout. A surge in volume accompanying the breakout confirms the validity of the signal. In this case we are looking for at least a 1 value of the division between currentVolume and pastVolume
Entry and Exit Conditions: When a breakout occurs and is confirmed by RVOL and is within our session time, the strategy enters a long or short position accordingly. It does not have a stop loss or a takie profit level, instead it will always exit at the end of the trading session, 5 minutes before
Position Sizing and Commissions: For the purpose of this backtest, the strategy allocated 10% of the capital for each trade and assumes a trading commission of 0.01$ per share ( twice the IBKR broker values)
Session End: At the end of the trading session, the strategy closes all open positions to avoid overnight exposure.
Conclusion:
The combination of ORB breakout strategy, Heikin Ashi candles, and RVOL provides traders with a robust framework for identifying and capitalizing on early trends in the market. By leveraging these technical indicators together, traders can make more informed decisions and improve the overall performance of their trading strategies. However, like any trading strategy, it's essential to backtest thoroughly and adapt the strategy to different market conditions to ensure its effectiveness over time.

Simple Trend Indicator (Heikin-Ashi) | Lyro RSSimple Trend Indicator (Heikin-Ashi)
A momentum oscillator using Heikin-Ashi smoothed data to filter trend direction with zero-line crosses.
This indicator calculates the normalized deviation of Heikin-Ashi OHLC values from their Simple Moving Average (SMA), then averages these deviations into a single oscillator. It simplifies trend detection by:
Reducing noise via Heikin-Ashi smoothing.
Highlighting momentum shifts through a zero-line cross system (bullish/bearish).
Providing clear visual signals with color-coded plots and directional dots.
Originality:
Unlike standard momentum oscillators, this tool uniquely combines:
Heikin-Ashi normalization for cleaner trend analysis.
Multi-component averaging (high, open, low, close) to balance sensitivity.
Minimalist design for clutter-free charting.
How It Works:
Data Input: Fetches Heikin-Ashi OHLC values using request.security().
Momentum Calculation: For each Heikin-Ashi component:
Computes % deviation from its SMA: (value − SMA(value, length)) / SMA(value, length) * 100.
Oscillator: Averages deviations of all four components into one line (sum).
Signals:
Bullish: Oscillator > 0 (green).
Bearish: Oscillator < 0 (red).
Cross Confirmation: Dots (⦿) mark zero-line crosses.
Usage:
Trend Following: Enter long/short on sustained oscillator breaks above/below zero.
Reversal Watch: Zero-line crosses may hint at weakening momentum.
Filter: Combine with volume or support/resistance levels.
⚠️Disclaimer: This indicator is a tool for technical analysis and does not provide guaranteed results. It should be used in conjunction with other analysis methods and proper risk management practices. The creators of this indicator are not responsible for any financial decisions made based on its signals.

BB with Heikin Ashi + Reversal CheckThis indicator combines Bollinger Bands (BB) with Heikin Ashi candles to detect potential reversal points after price breaks the BB boundaries. It works on any symbol and timeframe, retrieving Heikin Ashi data via request.security().
Core Features
Heikin Ashi Candle Plot
Smooths price action by using Heikin Ashi candles instead of regular candles.
Candles are plotted directly on the chart with green (bullish) and red (bearish) colors.
Bollinger Bands (BB)
Calculated from Heikin Ashi close price.
Includes Basis (MA), Upper Band, and Lower Band, with customizable MA type, length, and standard deviation multiplier.
Break & Reversal Detection
The indicator tracks whether the price has broken above the Upper Band (p1) or below the Lower Band (p2).
It remembers the last breakout direction until the opposite breakout occurs (mutually exclusive logic).
Signal Logic
Long Signal (▲):
Price was previously below the Lower Band and then reversed upward (BB Lower rising + Heikin Ashi candle rising).
Short Signal (▼):
Price was previously above the Upper Band and then reversed downward (BB Upper falling + Heikin Ashi candle falling).
Alerts
Custom alert conditions trigger when Long or Short signals occur, allowing automated notifications or bot integration.
Use Cases
✅ Swing Trading / Trend Reversal – Identify potential bottom/top reversals after BB breakouts.
✅ Mean Reversion Strategies – Enter trades when the price reverts to the BB mean after an extreme breakout.
✅ Multi-Timeframe Analysis – Works with any timeframe and symbol via request.security().
Customization
MA Type: SMA, EMA, RMA, WMA, VWMA
BB Length & StdDev Multiplier
Timeframe & Symbol Selection

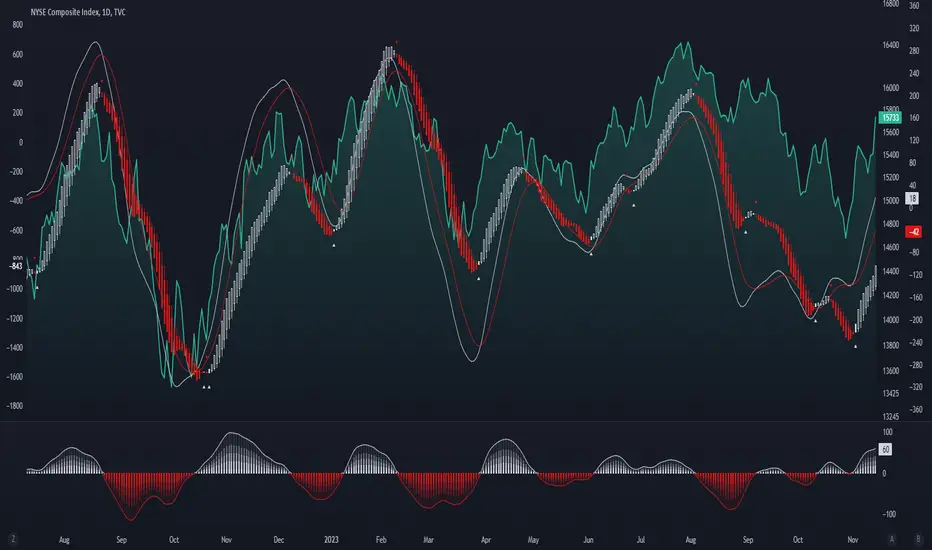
Enhanced McClellan Summation Index
The Enhanced McClellan Summation Index (MSI) is a comprehensive tool that transforms the MSI indicator with Heikin-Ashi visualization, offering improved trend analysis and momentum insights. This indicator includes MACD and it's histogram calculations to refine trend signals, minimize false positives and offer additional momentum analysis.
Methodology:
McClellan Summation Index (MSI) -
The MSI begins by calculating the ratio between advancing and declining issues in the specified index.
float decl = 𝘐𝘯𝘥𝘪𝘤𝘦 𝘥𝘦𝘤𝘭𝘪𝘯𝘪𝘯𝘨 𝘪𝘴𝘴𝘶𝘦𝘴
float adv = 𝘐𝘯𝘥𝘪𝘤𝘦 𝘢𝘥𝘷𝘢𝘯𝘤𝘪𝘯𝘨 𝘪𝘴𝘴𝘶𝘦𝘴
float ratio = (adv - decl) / (adv + decl)
It then computes a cumulative sum of the MACD (the difference between a 19-period EMA and a 39-period EMA) of this ratio. The result is a smoothed indicator reflecting market breadth and momentum.
macd(float r) =>
ta.ema(r, 19) - ta.ema(r, 39)
float msi = ta.cum(macd(ratio))
Heikin-Ashi Transformation -
Heikin-Ashi is a technique that uses a modified candlestick formula to create a smoother representation of price action. It averages the open, close, high, and low prices of the current and previous periods. This transformation reduces noise and provides a clearer view of trends.
type bar
float o = open
float h = high
float l = low
float c = close
bar b = bar.new()
float ha_close = math.avg(b.o, b.h, b.l, b.c)
MACD and Histogram -
The Enhanced MSI incorporates MACD and histogram calculations to provide additional momentum analysis and refine trend signals. The MACD represents the difference between the 12-period EMA and the 26-period EMA of the MSI. The histogram is the visual representation of the difference between the MACD and its signal line.
Options:
Index Selection - Choose from TVC:NYA , NASDAQ:NDX , or TVC:XAX to tailor the MSI-HA to the desired market index.
MACD Settings - Adjust the parameters for the MACD calculation to fine-tune the indicator's responsiveness.
Ratio Multiplier - Apply scaling to the MSI to suit different market conditions and indices.
Benefits of Heikin-Ashi -
Smoothed Trends - Heikin-Ashi reduces market noise, providing a more apparent and smoothed representation of trends.
Clearer Patterns - Candlestick patterns are more distinct, aiding in the identification of trend reversals and continuations.
Utility and Use Cases:
Trend & Momentum Analysis - Utilize the tool's Heikin-Ashi visualization for clearer trend identification in confluence with it's MACD and histogram to gain additional insights into the strength and direction of trends, while filtering out potential false positives.
Breadth Analysis - Explore market breadth through the MSI's cumulative breadth indicator, gauging the overall health and strength of the underlying market.
- Alerts Setup Guide -
The Enhanced MSI is a robust indicator that combines the breadth analysis of the McClellan Summation Index with the clarity of Heikin-Ashi visualization and additional momentum insights from MACD and histogram calculations. Its customization options make it adaptable to various indices and market conditions, offering traders a comprehensive tool for trend and momentum analysis.
Multi TimeFrame (MTF) Trend StrengthCalculate and display simple multi timeframe (3 timeframe) trend strength using heikin ashi.

Faster Heikin AshiFaster Heikin Ashi
The Faster Heikin Ashi improves traditional Heikin Ashi candles by introducing advanced weighting mechanisms and lag reduction techniques. While maintaining the price smoothing benefits of standard Heikin Ashi, this enhanced version delivers faster signals and responsiveness.
Key Features
Unified Responsiveness Control
Single parameter (0.1 - 1.0) controls all responsiveness aspects
Eliminates conflicting settings found in other enhanced HA indicators
Intuitive scaling from conservative (0.1) to highly responsive (1.0)
Advanced Weighted Calculations
Smart Close Weighting: Close prices receive 2-3x more influence for faster trend detection
Dynamic OHLC Processing: All price components are intelligently weighted based on responsiveness setting
Balanced High/Low Emphasis: Maintains price level accuracy while improving speed
Enhanced Open Calculation
Transition Speed: Open prices "catch up" to market movements faster
Lag Reduction Algorithm: Eliminates the typical delay in Heikin Ashi open calculations
Smooth Integration: Maintains visual continuity while improving responsiveness
Four-Color Scheme
- 🟢 **Lime**: Strong bullish momentum
- 🔴 **Red**: Strong bearish momentum
- 🟢 **Green**: Moderate bullish
- 🔴 **Maroon**: Moderate bearish
How It Works
Traditional Heikin Ashi smooths price action but often lags behind real market movements. This enhanced version:
1. Weights price components based on their predictive value
2. Accelerates trend transitions through advanced open calculations
3. Scales all enhancements through a single responsiveness parameter
4. Maintains smoothing benefits while reducing lag
Responsiveness (0.1 - 1.0)
0.1 - 0.3: Conservative, maximum smoothing
0.4 - 0.6: Balanced, good for swing trading and trend following
0.7 - 1.0: Aggressive, fast signals, suitable for scalping and active trading

HARSI PRO v2 - Advanced Adaptive Heikin-Ashi RSI OscillatorThis script is a fully re-engineered and enhanced version of the original Heikin-Ashi RSI Oscillator created by JayRogers. While it preserves the foundational concept and visual structure of the original indicatorusing Heikin-Ashi-style candles to represent RSI movementit introduces a range of institutional-grade engines and real-time analytics modules.
The core idea behind HARSI is to visualize the internal structure of RSI behavior using candle representations. This gives traders a clearer sense of trend continuity, exhaustion, and momentum inflection. In this upgraded version, the system is extended far beyond basic visualization into a comprehensive diagnostic and context-tracking tool.
Core Enhancements and Features
1. Heikin-Ashi RSI Candles
The base HARSI logic transforms RSI values into open, high, low, and close components, which are plotted as Heikin-Ashi-style candles. The open values are smoothed with a user-controlled bias setting, and the high/low are calculated from zero-centered RSI values.
2. Smoothed RSI Histogram and Plot
A secondary RSI plot and histogram are available for traditional RSI interpretation, optionally smoothed using a custom midpoint EMA process.
3. Dynamic Stochastic RSI Ribbon
The indicator optionally includes a smoothed Stochastic RSI ribbon with directional fill to highlight acceleration and reversal zones.
4. Real-Time Meta-State Engine
This engine determines the current market environmentneutral, breakout, or reversalbased on multiple adaptive conditions including volatility compression, momentum thrust, volume behavior, and composite reversal scoring.
5. Adaptive Overbought/Oversold Zone Engine
Instead of using fixed RSI thresholds, this engine dynamically adjusts OB/OS boundaries based on recent RSI range and normalized price volatility. This makes the OB/OS levels context-sensitive and more accurate across different instruments and regimes.
6. Composite Reversal Score Engine
A real-time score between 0 and 5 is generated using four components:
* OB/OS proximity (zone score)
* RSI slope behavior
* Volume state (burst or exhaustion)
* Trend continuation penalty based on position versus trend bias
This score allows for objective filtering of reversal zones and breakout traps.
7. Kalman Velocity Filter
A Kalman-style adaptive smoothing filter is applied to RSI for calculating velocity and acceleration. This allows for real-time detection of stalls and thrusts in RSI behavior.
8. Predictive Breakout Estimator
Uses ATR compression and RSI thrusting conditions to detect likely breakout environments. This logic contributes to the Meta-State Engine and the Breakout Risk dashboard metric.
9. Volume Acceleration Model
Real-time detection of volume bursts and fades based on VWMA baselines. Volume exhaustion warnings are used to qualify or disqualify reversals and breakouts.
10. Trend Bias and Regime Detection
Uses RSI slope, HARSI body impulse, and normalized ATR to classify the current trend state and directional bias. This forms the basis for filtering false reversals during strong trends.
11. Dashboard with Tooltips
A clean, table displays six key metrics in real time:
* Meta State
* Reversal Score
* Trend Bias
* Volume State
* Volatility Regime
* Breakout Risk
Each cell includes a descriptive tooltip explaining why the value is being shown based on internal state calculations.
How It Works Internally
* The system calculates a zero-centered RSI and builds candle structures using high, low, and smoothed open/close values.
* Volatility normalization is used throughout the script, including ATR-based thresholds and dynamic scaling of OB/OS zones.
* Momentum is filtered through smoothed slope calculations and HARSI body size measurements.
* Volume activity is compared against VWMA using configurable multipliers to detect institutional-level activity or exhaustion.
* Each regime detection module contributes to a centralized metaState classifier that determines whether the environment is conducive to reversal, breakout, or neutral action.
* All major signal and context values are continuously updated in a dashboard table with logic-driven color coding and tooltips.
Based On and Credits
This script is based on the original Heikin-Ashi RSI Oscillator by JayRogers . All visual elements from the original version, including candle plotting and color configurations, have been retained and extended. Significant backend enhancements were added by AresIQ for the 2025 release. The script remains open-source under the original attribution license. Credit to JayRogers is preserved and required for any derivative versions.
