Keltner Channels BandsKeltner Channels Bands - パブリッシュ用説明文
日本語版
タイトル
Keltner Channels Bands (Multi-Timeframe)
説明文
概要
シンプルで視認性の高いケルトナーチャネルインジケーターです。マルチタイムフレーム機能を搭載し、どの時間足でも上位足のケルトナーチャネルを表示できます。
特徴
グレーカラーでチャートを見やすく保持
マルチタイムフレーム対応(デフォルト: 1時間足)
4時間足以上で自動非表示機能(チャートの見やすさを維持)
EMAまたはSMAの選択が可能
ATR倍率とバンド幅を自由にカスタマイズ
トレードコンセプト
ケルトナーチャネルは、価格のボラティリティに基づいたトレンド追従型インジケーターです。
基本的な使い方:
トレンド判定: 価格がバンドの上部で推移している場合は上昇トレンド、下部で推移している場合は下降トレンド
エントリー: 価格がバンド外に出た後、バンド内に戻るタイミングでトレンド方向へエントリー
エグジット: 価格が中心線(MA)に到達、または反対側のバンドに接近した時
ブレイクアウト: バンドを勢いよく突破した場合、新たなトレンドの始まりを示唆
推奨設定:
スイングトレード: Length 20, Multiplier 2.2, 1時間足または4時間足
デイトレード: Length 20, Multiplier 2.0, 5分足または15分足で1時間足を表示
注意事項
このインジケーターは単独での使用ではなく、他のテクニカル指標やプライスアクションと組み合わせて使用することを推奨します。
English Version
Title
Keltner Channels Bands (Multi-Timeframe)
Description
Overview
A simple and visually clean Keltner Channels indicator with multi-timeframe capabilities. Display higher timeframe Keltner Channels on any chart timeframe.
Features
Clean gray color scheme for better chart visibility
Multi-timeframe support (Default: 1-hour)
Auto-hide on 4H+ timeframes to maintain chart clarity
Choice between EMA or SMA
Customizable ATR multiplier and band width
Trading Concept
Keltner Channels is a volatility-based trend-following indicator that helps traders identify trend direction and potential entry/exit points.
Basic Usage:
Trend Identification: Price staying near upper band indicates uptrend; near lower band indicates downtrend
Entry Signals: Enter in trend direction when price returns inside the bands after moving outside
Exit Signals: Consider exits when price reaches the center line (MA) or approaches the opposite band
Breakout Trading: Strong momentum breaks through the bands may signal the start of a new trend
Recommended Settings:
Swing Trading: Length 20, Multiplier 2.2, 1H or 4H timeframe
Day Trading: Length 20, Multiplier 2.0, Display 1H channels on 5M or 15M charts
Disclaimer
This indicator should not be used alone. Combine it with other technical indicators and price action analysis for better trading decisions.
Cari dalam skrip untuk "KELTNER"

Keltner Channels x 2"Keltner Channel x 2" is a simple modification of another script found on Tradingview that was posted by Ale91wolf called "Keltner Channels Linda Raschke".
This modified script allows the user to stack one Keltner Channel on top of another using different ATR multipliers which can be helpful by creating more visual
levels of price action as well as areas for potential trailing stop levels.


Keltner Channels BandsKeltner Channel Bands
Great indicator for mean reversion strategies.
Alerts you can set:
Crossover EMA
Crossunder EMA
Crossover upper band
Crossunder upper band
Crossover lower band
Crossunder lower band
Have fun!

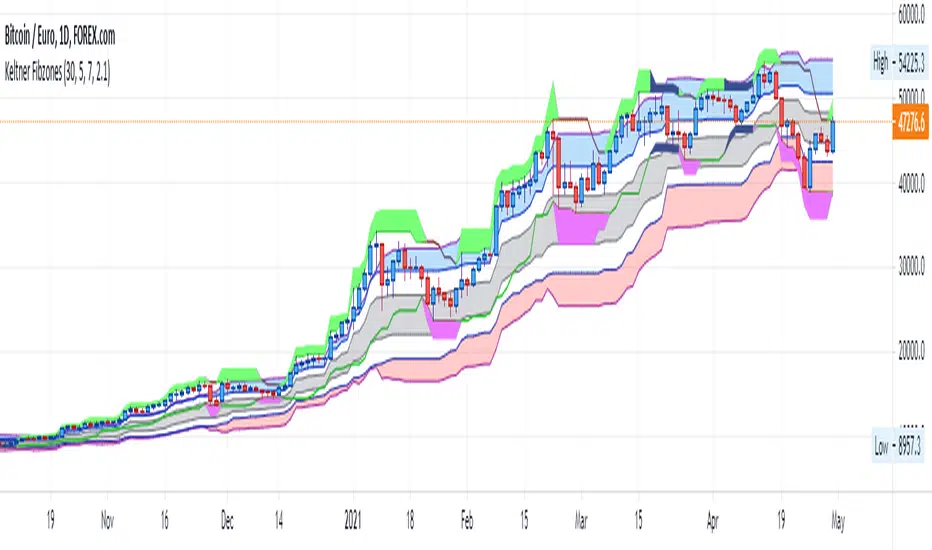
Keltner FibzonesKeltner Channel with Fibonacci Zones which uses properties of a Donchian Channel.
This script is a variation of the Fibonacci Zone script and the Donchian Fibonacci Trading Tool which I published earlier. A Keltner Channel gives more useful information to the trader than a Donchian Channel, because it provides a depiction of “normal range” and shows “outside normalcy” situations. Fibonacci lines provide a way to see if the market is trending up or down, while moving inside the channel, because in cases where the Fibonacci lines function as resistance, the trend is down, whereas when these turn out to be supports the trend is up.
Example of use:
If after a rally up - in which candles moves outside the channel - these return into the channel, this means a “new normal”. If the fibs turn out to give support, one may assume that this is a temporary sideways movement in which a flag is formed, after which following rally up may happen. With rally down the opposite is true. Top and bottom situations show a change in the way the market uses the fiblines.
The middle line of the Donchian Channel is used as the middle line of the Keltner channel, in stead of the sma in the classic channel. Default for calculation is 2 x Average True Range above and below this line. Default for the periods of the channel is 20 periods, because this allows the candles to go outside the channel. If you shorten this, all happens inside the channel.
Keltner Channel signalsUsing pupytherapy script
and the same system that we use for Bollinger and linear channel we can make easy the signal for the Keltner channel
I need to think how to make all those channels to combine I hope in next version I could do it :)

Keltner Channel Enhanced [DCAUT]█ Keltner Channel Enhanced
📊 ORIGINALITY & INNOVATION
The Keltner Channel Enhanced represents an important advancement over standard Keltner Channel implementations by introducing dual flexibility in moving average selection for both the middle band and ATR calculation. While traditional Keltner Channels typically use EMA for the middle band and RMA (Wilder's smoothing) for ATR, this enhanced version provides access to 25+ moving average algorithms for both components, enabling traders to fine-tune the indicator's behavior to match specific market characteristics and trading approaches.
Key Advancements:
Dual MA Algorithm Flexibility: Independent selection of moving average types for middle band (25+ options) and ATR smoothing (25+ options), allowing optimization of both trend identification and volatility measurement separately
Enhanced Trend Sensitivity: Ability to use faster algorithms (HMA, T3) for middle band while maintaining stable volatility measurement with traditional ATR smoothing, or vice versa for different trading strategies
Adaptive Volatility Measurement: Choice of ATR smoothing algorithm affects channel responsiveness to volatility changes, from highly reactive (SMA, EMA) to smoothly adaptive (RMA, TEMA)
Comprehensive Alert System: Five distinct alert conditions covering breakouts, trend changes, and volatility expansion, enabling automated monitoring without constant chart observation
Multi-Timeframe Compatibility: Works effectively across all timeframes from intraday scalping to long-term position trading, with independent optimization of trend and volatility components
This implementation addresses key limitations of standard Keltner Channels: fixed EMA/RMA combination may not suit all market conditions or trading styles. By decoupling the trend component from volatility measurement and allowing independent algorithm selection, traders can create highly customized configurations for specific instruments and market phases.
📐 MATHEMATICAL FOUNDATION
Keltner Channel Enhanced uses a three-component calculation system that combines a flexible moving average middle band with ATR-based (Average True Range) upper and lower channels, creating volatility-adjusted trend-following bands.
Core Calculation Process:
1. Middle Band (Basis) Calculation:
The basis line is calculated using the selected moving average algorithm applied to the price source over the specified period:
basis = ma(source, length, maType)
Supported algorithms include EMA (standard choice, trend-biased), SMA (balanced and symmetric), HMA (reduced lag), WMA, VWMA, TEMA, T3, KAMA, and 17+ others.
2. Average True Range (ATR) Calculation:
ATR measures market volatility by calculating the average of true ranges over the specified period:
trueRange = max(high - low, abs(high - close ), abs(low - close ))
atrValue = ma(trueRange, atrLength, atrMaType)
ATR smoothing algorithm significantly affects channel behavior, with options including RMA (standard, very smooth), SMA (moderate smoothness), EMA (fast adaptation), TEMA (smooth yet responsive), and others.
3. Channel Calculation:
Upper and lower channels are positioned at specified multiples of ATR from the basis:
upperChannel = basis + (multiplier × atrValue)
lowerChannel = basis - (multiplier × atrValue)
Standard multiplier is 2.0, providing channels that dynamically adjust width based on market volatility.
Keltner Channel vs. Bollinger Bands - Key Differences:
While both indicators create volatility-based channels, they use fundamentally different volatility measures:
Keltner Channel (ATR-based):
Uses Average True Range to measure actual price movement volatility
Incorporates gaps and limit moves through true range calculation
More stable in trending markets, less prone to extreme compression
Better reflects intraday volatility and trading range
Typically fewer band touches, making touches more significant
More suitable for trend-following strategies
Bollinger Bands (Standard Deviation-based):
Uses statistical standard deviation to measure price dispersion
Based on closing prices only, doesn't account for intraday range
Can compress significantly during consolidation (squeeze patterns)
More touches in ranging markets
Better suited for mean-reversion strategies
Provides statistical probability framework (95% within 2 standard deviations)
Algorithm Combination Effects:
The interaction between middle band MA type and ATR MA type creates different indicator characteristics:
Trend-Focused Configuration (Fast MA + Slow ATR): Middle band uses HMA/EMA/T3, ATR uses RMA/TEMA, quick trend changes with stable channel width, suitable for trend-following
Volatility-Focused Configuration (Slow MA + Fast ATR): Middle band uses SMA/WMA, ATR uses EMA/SMA, stable trend with dynamic channel width, suitable for volatility trading
Balanced Configuration (Standard EMA/RMA): Classic Keltner Channel behavior, time-tested combination, suitable for general-purpose trend following
Adaptive Configuration (KAMA + KAMA): Self-adjusting indicator responding to efficiency ratio, suitable for markets with varying trend strength and volatility regimes
📊 COMPREHENSIVE SIGNAL ANALYSIS
Keltner Channel Enhanced provides multiple signal categories optimized for trend-following and breakout strategies.
Channel Position Signals:
Upper Channel Interaction:
Price Touching Upper Channel: Strong bullish momentum, price moving more than typical volatility range suggests, potential continuation signal in established uptrends
Price Breaking Above Upper Channel: Exceptional strength, price exceeding normal volatility expectations, consider adding to long positions or tightening trailing stops
Price Riding Upper Channel: Sustained strong uptrend, characteristic of powerful bull moves, stay with trend and avoid premature profit-taking
Price Rejection at Upper Channel: Momentum exhaustion signal, consider profit-taking on longs or waiting for pullback to middle band for reentry
Lower Channel Interaction:
Price Touching Lower Channel: Strong bearish momentum, price moving more than typical volatility range suggests, potential continuation signal in established downtrends
Price Breaking Below Lower Channel: Exceptional weakness, price exceeding normal volatility expectations, consider adding to short positions or protecting against further downside
Price Riding Lower Channel: Sustained strong downtrend, characteristic of powerful bear moves, stay with trend and avoid premature covering
Price Rejection at Lower Channel: Momentum exhaustion signal, consider covering shorts or waiting for bounce to middle band for reentry
Middle Band (Basis) Signals:
Trend Direction Confirmation:
Price Above Basis: Bullish trend bias, middle band acts as dynamic support in uptrends, consider long positions or holding existing longs
Price Below Basis: Bearish trend bias, middle band acts as dynamic resistance in downtrends, consider short positions or avoiding longs
Price Crossing Above Basis: Potential trend change from bearish to bullish, early signal to establish long positions
Price Crossing Below Basis: Potential trend change from bullish to bearish, early signal to establish short positions or exit longs
Pullback Trading Strategy:
Uptrend Pullback: Price pulls back from upper channel to middle band, finds support, and resumes upward, ideal long entry point
Downtrend Bounce: Price bounces from lower channel to middle band, meets resistance, and resumes downward, ideal short entry point
Basis Test: Strong trends often show price respecting the middle band as support/resistance on pullbacks
Failed Test: Price breaking through middle band against trend direction signals potential reversal
Volatility-Based Signals:
Narrow Channels (Low Volatility):
Consolidation Phase: Channels contract during periods of reduced volatility and directionless price action
Breakout Preparation: Narrow channels often precede significant directional moves as volatility cycles
Trading Approach: Reduce position sizes, wait for breakout confirmation, avoid range-bound strategies within channels
Breakout Direction: Monitor for price breaking decisively outside channel range with expanding width
Wide Channels (High Volatility):
Trending Phase: Channels expand during strong directional moves and increased volatility
Momentum Confirmation: Wide channels confirm genuine trend with substantial volatility backing
Trading Approach: Trend-following strategies excel, wider stops necessary, mean-reversion strategies risky
Exhaustion Signs: Extreme channel width (historical highs) may signal approaching consolidation or reversal
Advanced Pattern Recognition:
Channel Walking Pattern:
Upper Channel Walk: Price consistently touches or exceeds upper channel while staying above basis, very strong uptrend signal, hold longs aggressively
Lower Channel Walk: Price consistently touches or exceeds lower channel while staying below basis, very strong downtrend signal, hold shorts aggressively
Basis Support/Resistance: During channel walks, price typically uses middle band as support/resistance on minor pullbacks
Pattern Break: Price crossing basis during channel walk signals potential trend exhaustion
Squeeze and Release Pattern:
Squeeze Phase: Channels narrow significantly, price consolidates near middle band, volatility contracts
Direction Clues: Watch for price positioning relative to basis during squeeze (above = bullish bias, below = bearish bias)
Release Trigger: Price breaking outside narrow channel range with expanding width confirms breakout
Follow-Through: Measure squeeze height and project from breakout point for initial profit targets
Channel Expansion Pattern:
Breakout Confirmation: Rapid channel widening confirms volatility increase and genuine trend establishment
Entry Timing: Enter positions early in expansion phase before trend becomes overextended
Risk Management: Use channel width to size stops appropriately, wider channels require wider stops
Basis Bounce Pattern:
Clean Bounce: Price touches middle band and immediately reverses, confirms trend strength and entry opportunity
Multiple Bounces: Repeated basis bounces indicate strong, sustainable trend
Bounce Failure: Price penetrating basis signals weakening trend and potential reversal
Divergence Analysis:
Price/Channel Divergence: Price makes new high/low while staying within channel (not reaching outer band), suggests momentum weakening
Width/Price Divergence: Price breaks to new extremes but channel width contracts, suggests move lacks conviction
Reversal Signal: Divergences often precede trend reversals or significant consolidation periods
Multi-Timeframe Analysis:
Keltner Channels work particularly well in multi-timeframe trend-following approaches:
Three-Timeframe Alignment:
Higher Timeframe (Weekly/Daily): Identify major trend direction, note price position relative to basis and channels
Intermediate Timeframe (Daily/4H): Identify pullback opportunities within higher timeframe trend
Lower Timeframe (4H/1H): Time precise entries when price touches middle band or lower channel (in uptrends) with rejection
Optimal Entry Conditions:
Best Long Entries: Higher timeframe in uptrend (price above basis), intermediate timeframe pulls back to basis, lower timeframe shows rejection at middle band or lower channel
Best Short Entries: Higher timeframe in downtrend (price below basis), intermediate timeframe bounces to basis, lower timeframe shows rejection at middle band or upper channel
Risk Management: Use higher timeframe channel width to set position sizing, stops below/above higher timeframe channels
🎯 STRATEGIC APPLICATIONS
Keltner Channel Enhanced excels in trend-following and breakout strategies across different market conditions.
Trend Following Strategy:
Setup Requirements:
Identify established trend with price consistently on one side of basis line
Wait for pullback to middle band (basis) or brief penetration through it
Confirm trend resumption with price rejection at basis and move back toward outer channel
Enter in trend direction with stop beyond basis line
Entry Rules:
Uptrend Entry:
Price pulls back from upper channel to middle band, shows support at basis (bullish candlestick, momentum divergence)
Enter long on rejection/bounce from basis with stop 1-2 ATR below basis
Aggressive: Enter on first touch; Conservative: Wait for confirmation candle
Downtrend Entry:
Price bounces from lower channel to middle band, shows resistance at basis (bearish candlestick, momentum divergence)
Enter short on rejection/reversal from basis with stop 1-2 ATR above basis
Aggressive: Enter on first touch; Conservative: Wait for confirmation candle
Trend Management:
Trailing Stop: Use basis line as dynamic trailing stop, exit if price closes beyond basis against position
Profit Taking: Take partial profits at opposite channel, move stops to basis
Position Additions: Add to winners on subsequent basis bounces if trend intact
Breakout Strategy:
Setup Requirements:
Identify consolidation period with contracting channel width
Monitor price action near middle band with reduced volatility
Wait for decisive breakout beyond channel range with expanding width
Enter in breakout direction after confirmation
Breakout Confirmation:
Price breaks clearly outside channel (upper for longs, lower for shorts), channel width begins expanding from contracted state
Volume increases significantly on breakout (if using volume analysis)
Price sustains outside channel for multiple bars without immediate reversal
Entry Approaches:
Aggressive: Enter on initial break with stop at opposite channel or basis, use smaller position size
Conservative: Wait for pullback to broken channel level, enter on rejection and resumption, tighter stop
Volatility-Based Position Sizing:
Adjust position sizing based on channel width (ATR-based volatility):
Wide Channels (High ATR): Reduce position size as stops must be wider, calculate position size using ATR-based risk calculation: Risk / (Stop Distance in ATR × ATR Value)
Narrow Channels (Low ATR): Increase position size as stops can be tighter, be cautious of impending volatility expansion
ATR-Based Risk Management: Use ATR-based risk calculations, position size = 0.01 × Capital / (2 × ATR), use multiples of ATR (1-2 ATR) for adaptive stops
Algorithm Selection Guidelines:
Different market conditions benefit from different algorithm combinations:
Strong Trending Markets: Middle band use EMA or HMA, ATR use RMA, capture trends quickly while maintaining stable channel width
Choppy/Ranging Markets: Middle band use SMA or WMA, ATR use SMA or WMA, avoid false trend signals while identifying genuine reversals
Volatile Markets: Middle band and ATR both use KAMA or FRAMA, self-adjusting to changing market conditions reduces manual optimization
Breakout Trading: Middle band use SMA, ATR use EMA or SMA, stable trend with dynamic channels highlights volatility expansion early
Scalping/Day Trading: Middle band use HMA or T3, ATR use EMA or TEMA, both components respond quickly
Position Trading: Middle band use EMA/TEMA/T3, ATR use RMA or TEMA, filter out noise for long-term trend-following
📋 DETAILED PARAMETER CONFIGURATION
Understanding and optimizing parameters is essential for adapting Keltner Channel Enhanced to specific trading approaches.
Source Parameter:
Close (Most Common): Uses closing price, reflects daily settlement, best for end-of-day analysis and position trading, standard choice
HL2 (Median Price): Smooths out closing bias, better represents full daily range in volatile markets, good for swing trading
HLC3 (Typical Price): Gives more weight to close while including full range, popular for intraday applications, slightly more responsive than HL2
OHLC4 (Average Price): Most comprehensive price representation, smoothest option, good for gap-prone markets or highly volatile instruments
Length Parameter:
Controls the lookback period for middle band (basis) calculation:
Short Periods (10-15): Very responsive to price changes, suitable for day trading and scalping, higher false signal rate
Standard Period (20 - Default): Represents approximately one month of trading, good balance between responsiveness and stability, suitable for swing and position trading
Medium Periods (30-50): Smoother trend identification, fewer false signals, better for position trading and longer holding periods
Long Periods (50+): Very smooth, identifies major trends only, minimal false signals but significant lag, suitable for long-term investment
Optimization by Timeframe: 1-15 minute charts use 10-20 period, 30-60 minute charts use 20-30 period, 4-hour to daily charts use 20-40 period, weekly charts use 20-30 weeks.
ATR Length Parameter:
Controls the lookback period for Average True Range calculation, affecting channel width:
Short ATR Periods (5-10): Very responsive to recent volatility changes, standard is 10 (Keltner's original specification), may be too reactive in whipsaw conditions
Standard ATR Period (10 - Default): Chester Keltner's original specification, good balance between responsiveness and stability, most widely used
Medium ATR Periods (14-20): Smoother channel width, ATR 14 aligns with Wilder's original ATR specification, good for position trading
Long ATR Periods (20+): Very smooth channel width, suitable for long-term trend-following
Length vs. ATR Length Relationship: Equal values (20/20) provide balanced responsiveness, longer ATR (20/14) gives more stable channel width, shorter ATR (20/10) is standard configuration, much shorter ATR (20/5) creates very dynamic channels.
Multiplier Parameter:
Controls channel width by setting ATR multiples:
Lower Values (1.0-1.5): Tighter channels with frequent price touches, more trading signals, higher false signal rate, better for range-bound and mean-reversion strategies
Standard Value (2.0 - Default): Chester Keltner's recommended setting, good balance between signal frequency and reliability, suitable for both trending and ranging strategies
Higher Values (2.5-3.0): Wider channels with less frequent touches, fewer but potentially higher-quality signals, better for strong trending markets
Market-Specific Optimization: High volatility markets (crypto, small-caps) use 2.5-3.0 multiplier, medium volatility markets (major forex, large-caps) use 2.0 multiplier, low volatility markets (bonds, utilities) use 1.5-2.0 multiplier.
MA Type Parameter (Middle Band):
Critical selection that determines trend identification characteristics:
EMA (Exponential Moving Average - Default): Standard Keltner Channel choice, Chester Keltner's original specification, emphasizes recent prices, faster response to trend changes, suitable for all timeframes
SMA (Simple Moving Average): Equal weighting of all data points, no directional bias, slower than EMA, better for ranging markets and mean-reversion
HMA (Hull Moving Average): Minimal lag with smooth output, excellent for fast trend identification, best for day trading and scalping
TEMA (Triple Exponential Moving Average): Advanced smoothing with reduced lag, responsive to trends while filtering noise, suitable for volatile markets
T3 (Tillson T3): Very smooth with minimal lag, excellent for established trend identification, suitable for position trading
KAMA (Kaufman Adaptive Moving Average): Automatically adjusts speed based on market efficiency, slow in ranging markets, fast in trends, suitable for markets with varying conditions
ATR MA Type Parameter:
Determines how Average True Range is smoothed, affecting channel width stability:
RMA (Wilder's Smoothing - Default): J. Welles Wilder's original ATR smoothing method, very smooth, slow to adapt to volatility changes, provides stable channel width
SMA (Simple Moving Average): Equal weighting, moderate smoothness, faster response to volatility changes than RMA, more dynamic channel width
EMA (Exponential Moving Average): Emphasizes recent volatility, quick adaptation to new volatility regimes, very responsive channel width changes
TEMA (Triple Exponential Moving Average): Smooth yet responsive, good balance for varying volatility, suitable for most trading styles
Parameter Combination Strategies:
Conservative Trend-Following: Length 30/ATR Length 20/Multiplier 2.5, MA Type EMA or TEMA/ATR MA Type RMA, smooth trend with stable wide channels, suitable for position trading
Standard Balanced Approach: Length 20/ATR Length 10/Multiplier 2.0, MA Type EMA/ATR MA Type RMA, classic Keltner Channel configuration, suitable for general purpose swing trading
Aggressive Day Trading: Length 10-15/ATR Length 5-7/Multiplier 1.5-2.0, MA Type HMA or EMA/ATR MA Type EMA or SMA, fast trend with dynamic channels, suitable for scalping and day trading
Breakout Specialist: Length 20-30/ATR Length 5-10/Multiplier 2.0, MA Type SMA or WMA/ATR MA Type EMA or SMA, stable trend with responsive channel width
Adaptive All-Conditions: Length 20/ATR Length 10/Multiplier 2.0, MA Type KAMA or FRAMA/ATR MA Type KAMA or TEMA, self-adjusting to market conditions
Offset Parameter:
Controls horizontal positioning of channels on chart. Positive values shift channels to the right (future) for visual projection, negative values shift left (past) for historical analysis, zero (default) aligns with current price bars for real-time signal analysis. Offset affects only visual display, not alert conditions or actual calculations.
📈 PERFORMANCE ANALYSIS & COMPETITIVE ADVANTAGES
Keltner Channel Enhanced provides improvements over standard implementations while maintaining proven effectiveness.
Response Characteristics:
Standard EMA/RMA Configuration: Moderate trend lag (approximately 0.4 × length periods), smooth and stable channel width from RMA smoothing, good balance for most market conditions
Fast HMA/EMA Configuration: Approximately 60% reduction in trend lag compared to EMA, responsive channel width from EMA ATR smoothing, suitable for quick trend changes and breakouts
Adaptive KAMA/KAMA Configuration: Variable lag based on market efficiency, automatic adjustment to trending vs. ranging conditions, self-optimizing behavior reduces manual intervention
Comparison with Traditional Keltner Channels:
Enhanced Version Advantages:
Dual Algorithm Flexibility: Independent MA selection for trend and volatility vs. fixed EMA/RMA, separate tuning of trend responsiveness and channel stability
Market Adaptation: Choose configurations optimized for specific instruments and conditions, customize for scalping, swing, or position trading preferences
Comprehensive Alerts: Enhanced alert system including channel expansion detection
Traditional Version Advantages:
Simplicity: Fewer parameters, easier to understand and implement
Standardization: Fixed EMA/RMA combination ensures consistency across users
Research Base: Decades of backtesting and research on standard configuration
When to Use Enhanced Version: Trading multiple instruments with different characteristics, switching between trending and ranging markets, employing different strategies, algorithm-based trading systems requiring customization, seeking optimization for specific trading style and timeframe.
When to Use Standard Version: Beginning traders learning Keltner Channel concepts, following published research or trading systems, preferring simplicity and standardization, wanting to avoid optimization and curve-fitting risks.
Performance Across Market Conditions:
Strong Trending Markets: EMA or HMA basis with RMA or TEMA ATR smoothing provides quicker trend identification, pullbacks to basis offer excellent entry opportunities
Choppy/Ranging Markets: SMA or WMA basis with RMA ATR smoothing and lower multipliers, channel bounce strategies work well, avoid false breakouts
Volatile Markets: KAMA or FRAMA with EMA or TEMA, adaptive algorithms excel by automatic adjustment, wider multipliers (2.5-3.0) accommodate large price swings
Low Volatility/Consolidation: Channels narrow significantly indicating consolidation, algorithm choice less impactful, focus on detecting channel width contraction for breakout preparation
Keltner Channel vs. Bollinger Bands - Usage Comparison:
Favor Keltner Channels When: Trend-following is primary strategy, trading volatile instruments with gaps, want ATR-based volatility measurement, prefer fewer higher-quality channel touches, seeking stable channel width during trends.
Favor Bollinger Bands When: Mean-reversion is primary strategy, trading instruments with limited gaps, want statistical framework based on standard deviation, need squeeze patterns for breakout identification, prefer more frequent trading opportunities.
Use Both Together: Bollinger Band squeeze + Keltner Channel breakout is powerful combination, price outside Bollinger Bands but inside Keltner Channels indicates moderate signal, price outside both indicates very strong signal, Bollinger Bands for entries and Keltner Channels for trend confirmation.
Limitations and Considerations:
General Limitations:
Lagging Indicator: All moving averages lag price, even with reduced-lag algorithms
Trend-Dependent: Works best in trending markets, less effective in choppy conditions
No Direction Prediction: Indicates volatility and deviation, not future direction, requires confirmation
Enhanced Version Specific Considerations:
Optimization Risk: More parameters increase risk of curve-fitting historical data
Complexity: Additional choices may overwhelm beginning traders
Backtesting Challenges: Different algorithms produce different historical results
Mitigation Strategies:
Use Confirmation: Combine with momentum indicators (RSI, MACD), volume, or price action
Test Parameter Robustness: Ensure parameters work across range of values, not just optimized ones
Multi-Timeframe Analysis: Confirm signals across different timeframes
Proper Risk Management: Use appropriate position sizing and stops
Start Simple: Begin with standard EMA/RMA before exploring alternatives
Optimal Usage Recommendations:
For Maximum Effectiveness:
Start with standard EMA/RMA configuration to understand classic behavior
Experiment with alternatives on demo account or paper trading
Match algorithm combination to market condition and trading style
Use channel width analysis to identify market phases
Combine with complementary indicators for confirmation
Implement strict risk management using ATR-based position sizing
Focus on high-quality setups rather than trading every signal
Respect the trend: trade with basis direction for higher probability
Complementary Indicators:
RSI or Stochastic: Confirm momentum at channel extremes
MACD: Confirm trend direction and momentum shifts
Volume: Validate breakouts and trend strength
ADX: Measure trend strength, avoid Keltner signals in weak trends
Support/Resistance: Combine with traditional levels for high-probability setups
Bollinger Bands: Use together for enhanced breakout and volatility analysis
USAGE NOTES
This indicator is designed for technical analysis and educational purposes. Keltner Channel Enhanced has limitations and should not be used as the sole basis for trading decisions. While the flexible moving average selection for both trend and volatility components provides valuable adaptability across different market conditions, algorithm performance varies with market conditions, and past characteristics do not guarantee future results.
Key considerations:
Always use multiple forms of analysis and confirmation before entering trades
Backtest any parameter combination thoroughly before live trading
Be aware that optimization can lead to curve-fitting if not done carefully
Start with standard EMA/RMA settings and adjust only when specific conditions warrant
Understand that no moving average algorithm can eliminate lag entirely
Consider market regime (trending, ranging, volatile) when selecting parameters
Use ATR-based position sizing and risk management on every trade
Keltner Channels work best in trending markets, less effective in choppy conditions
Respect the trend direction indicated by price position relative to basis line
The enhanced flexibility of dual algorithm selection provides powerful tools for adaptation but requires responsible use, thorough understanding of how different algorithms behave under various market conditions, and disciplined risk management.

Keltner Worm ForecastBeta V0.1.0
This Keltner Channel Worm gives 6 different KCs at max, and allows you to set a multiplier for the offset and worm settings (exponential).
The idea behind this script is that the overall brightness of the Keltner Channel will indicate the strength of the forecast. If the candles are shrouded by darkness, a correction is due.
Enjoy and let me know if you have any suggestions for improvements down below!
<3 Happy Trading
Sir Poggy

Keltner Channel with signals [ChuckBanger]This is Keltner Channel where I added Bull and Bear signals. It has a lot of settings to play around with. Have fun...
For more information on Keltner Channel: www.investopedia.com

Keltner Channel AlertSimple Keltner Indicator with a custom alert.
The alert should ring when any Band has the price crossing.

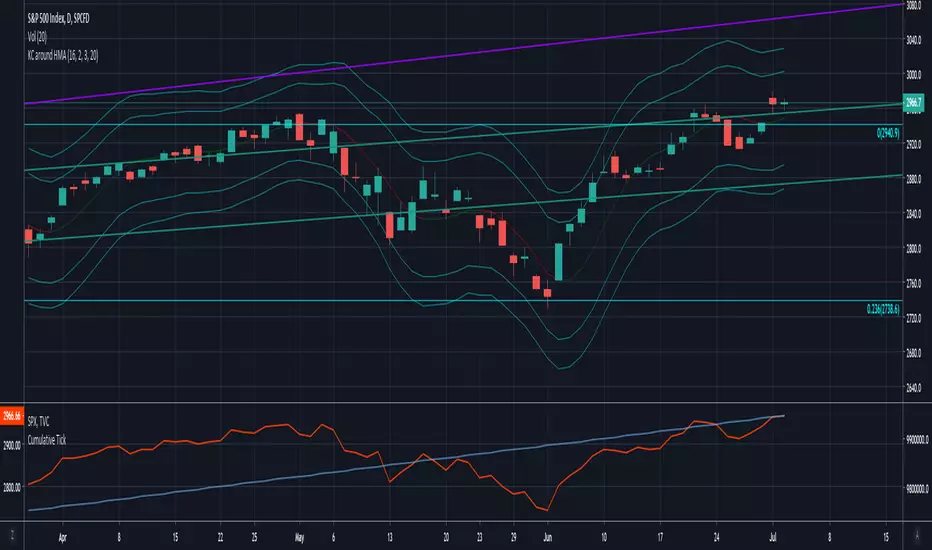
Keltner Channels around Hull MAKeltner Channels around Hull Moving Average
Script shared upon request. No guarantees on accuracy.
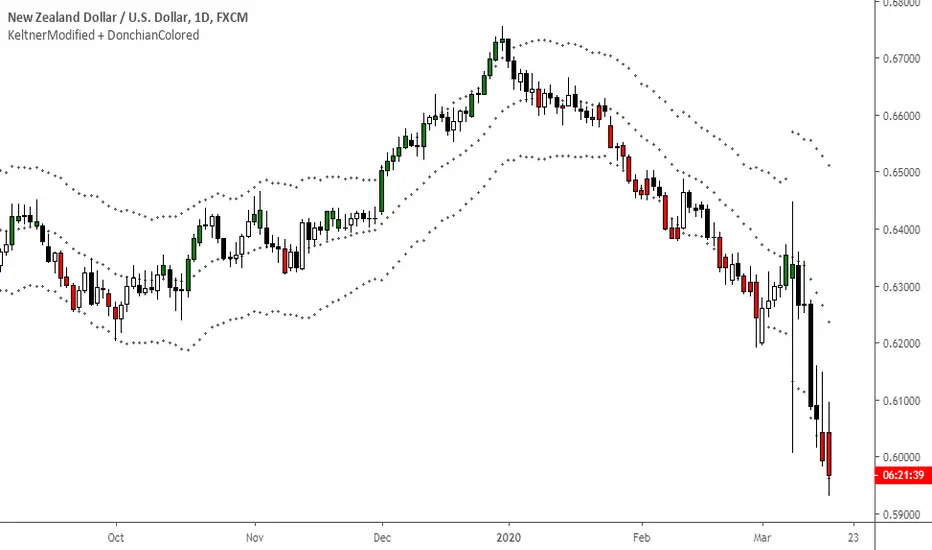
KeltnerModified + DonchianColoredKeltner Channel + color coded candles when making new Donchian highs/lows
Keltner Channel With User Selectable Moving AvgKeltner Channel with user options to calculate the moving average basis and envelopes from a variety of different moving averages.
The user selects their choice of moving average, and the envelopes automatically adjust. The user may select a MA that reacts faster to volatility or slower/smoother.
Added additional options to color the envelopes or basis based on the current trend and alternate candle colors for envelope touches. The script has a rainbow gradient by default based on RSI.
Options (generally from slower/smoother to faster/more responsive to volatility):
SMMA,
SMA,
Donchian, (Note: Selecting Donchian will just convert this indicator to a regular Donchian Channel)
Tillson T3,
EMA,
VWMA,
WMA,
EHMA,
ALMA,
LSMA,
HMA,
TEMA
Value Added:
Allows Keltner Channel to be calculated from a variety of moving averages other than EMA/SMA, including ones that are well liked by traders such as Tillson T3, ALMA, Hull MA, and TEMA.
Glossary:
The Hull Moving Average ( HMA ), developed by Alan Hull, is an extremely fast and smooth moving average . In fact, the HMA almost eliminates lag altogether and manages to improve smoothing at the same time.
The Exponential Hull Moving Average is similar to the standard Hull MA, but with superior smoothing. The standard Hull Moving Average is derived from the weighted moving average ( WMA ). As other moving average built from weighted moving averages it has a tendency to exaggerate price movement.
Weighted Moving Average: A Weighted Moving Average ( WMA ) is similar to the simple moving average ( SMA ), except the WMA adds significance to more recent data points.
Arnaud Legoux Moving Average: ALMA removes small price fluctuations and enhances the trend by applying a moving average twice, once from left to right, and once from right to left. At the end of this process the phase shift (price lag) commonly associated with moving averages is significantly reduced. Zero-phase digital filtering reduces noise in the signal. Conventional filtering reduces noise in the signal, but adds a delay.
Least Squares: Based on sum of least squares method to find a straight line that best fits data for the selected period. The end point of the line is plotted and the process is repeated on each succeeding period.
Triple EMA (TEMA) : The triple exponential moving average (TEMA) was designed to smooth price fluctuations, thereby making it easier to identify trends without the lag associated with traditional moving averages (MA). It does this by taking multiple exponential moving averages (EMA) of the original EMA and subtracting out some of the lag.
Running (SMoothed) Moving Average: A Modified Moving Average (MMA) (otherwise known as the Running Moving Average (RMA), or SMoothed Moving Average (SMMA)) is an indicator that shows the average value of a security's price over a period of time. It works very similar to the Exponential Moving Average, they are equivalent but for different periods (e.g., the MMA value for a 14-day period will be the same as EMA-value for a 27-days period).
Volume-Weighted Moving Average: The Volume-weighted Moving Average (VWMA) emphasizes volume by weighing prices based on the amount of trading activity in a given period of time. Users can set the length, the source and an offset. Prices with heavy trading activity get more weight than prices with light trading activity.
Tillson T3: The Tillson moving average a.k.a. the Tillson T3 indicator is one of the smoothest moving averages and is both composite and adaptive.

CBG Keltner ChannelsKeltner Channel with the following Moving Average types: SMA, EMA, Weighted, Hull, Symmetrical, Volume Weighted, Wilder and Linear Regression. Plus 2 bands with full color shading.
The picture shows the Keltner channels with the Wilder MA, my favorite. See how easy it would have been to stay in the move down? Excellent indicator.


Keltner ZonesThis is an indicator that draws support and resistance zones / levels based on price action in and around Keltner Channels.
There are 3 different modes;
Draw zones based on price breaking the upper band
Draw zones based on price breaking the lower band
Draw zones if price stays within the bands for a prolonged period of time.
You can also decide if you want the indicator to paint zones or levels. The Zones can grow rather large if there is a volatility shock since they are drawn using the true range around the trigger price.
Upper Band Zones
Lower Band Zones
Congestion Zone
Keltner Channel with Custom ATRKeltner Channel EMA based. Use Custom ATR value.
Reversion to the mean band from TTM $400+
List of All my Indicators - www.tradingview.com

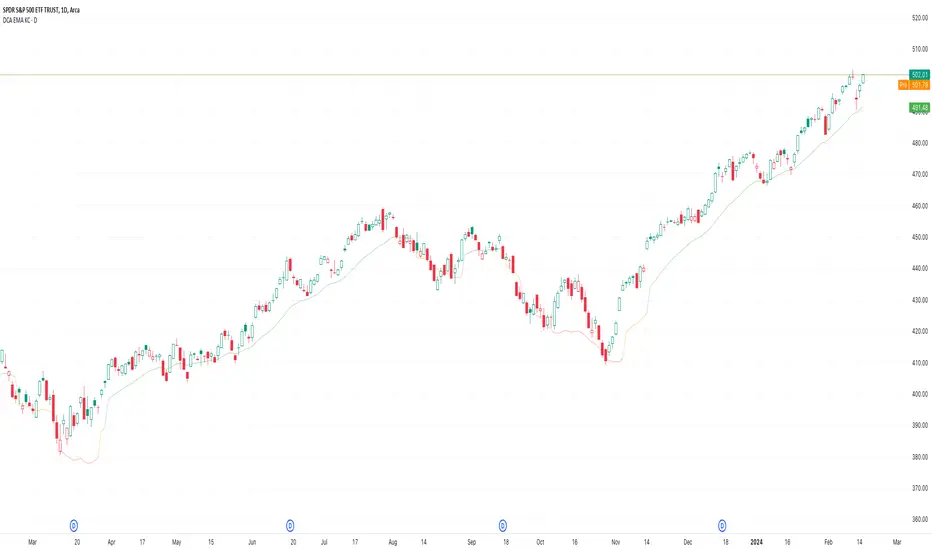
Variable Keltner Channel For DCAHello Everyone,
Sharing the indicator that I'm using for Dollar Cost Averaging into the stocks & ETFs in my portfolio.
Instead of entering regularly each month, entry only happens when the share price is below the indicator.
This indicator is based on Exponential Moving Average & Keltner Channel.
When 21 EMA is above 34 EMA, the line is 1 ATR below the 21 EMA. (green color)
When 21 EMA is below 34 EMA, the line is 2 ATR below the 21 EMA. (red color)
Exploring ways to refine this further, especially during sideways or transition to downtrend, do comment if you have any idea.
This strategy itself was based on SMA 50 strategy for DCA.
Keltner Channel Alerts [QuantNomad]This is a script with alerts for standard Keltner Channer Strategy you can find in TradingView.
Use "Once Per Bar" option when creating alerts.

Adaptive ATR Keltner Channels [Loxx]Adaptive ATR Channels are adaptive Keltner channels. ATR is calculated using a rolling signal-to-noise ratio making this indicator flex more to changes in price volatility than the fixed Keltner Channels.
What is Average True Range (ATR)?
The average true range (ATR) is a technical analysis indicator, introduced by market technician J. Welles Wilder Jr. in his book New Concepts in Technical Trading Systems, that measures market volatility by decomposing the entire range of an asset price for that period.1
The true range is taken as the greatest of the following: current high less the current low; the absolute value of the current high less the previous close; and the absolute value of the current low less the previous close. The ATR is then a moving average, generally using 14 days, of the true ranges.
What are Keltner Channel (ATR)?
Keltner Channels are volatility-based bands that are placed on either side of an asset's price and can aid in determining the direction of a trend.
The Keltner channel uses the average-true range (ATR) or volatility, with breaks above or below the top and bottom barriers signaling a continuation.

Keltner | Bollinger | SqueezePercent B (%B), it's derivation Percent K (%K) and squeeze indicator combined in one.
blue line = bollinger %
orange line = keltner %
red background = squeeze*
squeeze = bollinger bands are inside (encapsulated by) keltner channel
