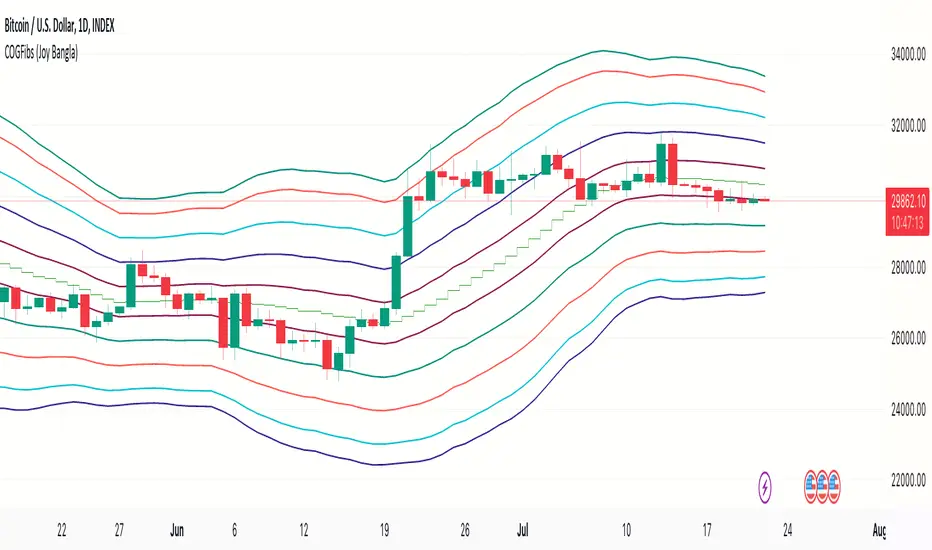
COG Fibs [LazyBear]Made the lines invisible by default. One can see the values by going through settings
Cari dalam skrip untuk "LazyBear"
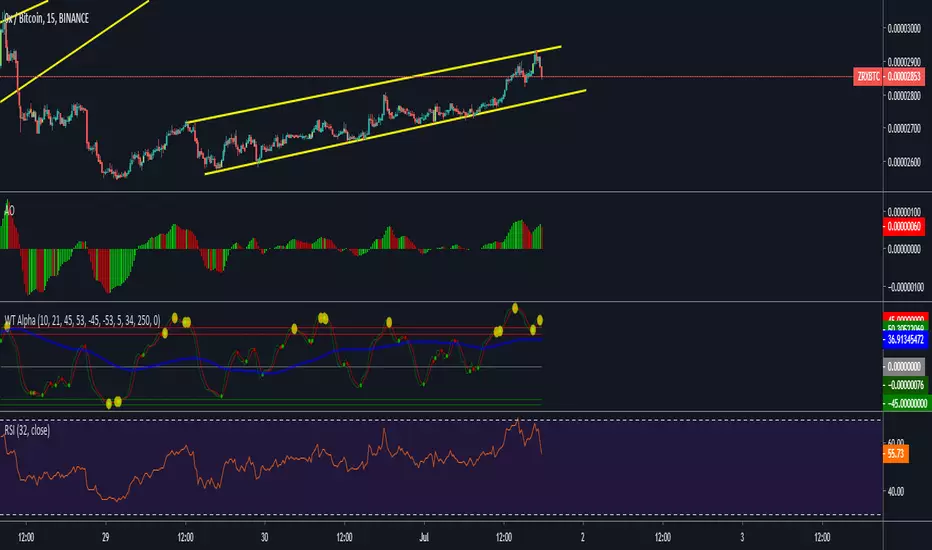
WaveTrend + Alert + LSMA + CrossWaveTrend inspired by LazyBear's WT indicator with addition of crossing dots, crossing alert and LSMA
Modified TTM Squeeze Momentum Indicator original @author LazyBear modified by KMcCollum to follow JustinE's input and color scheme for Petra's room

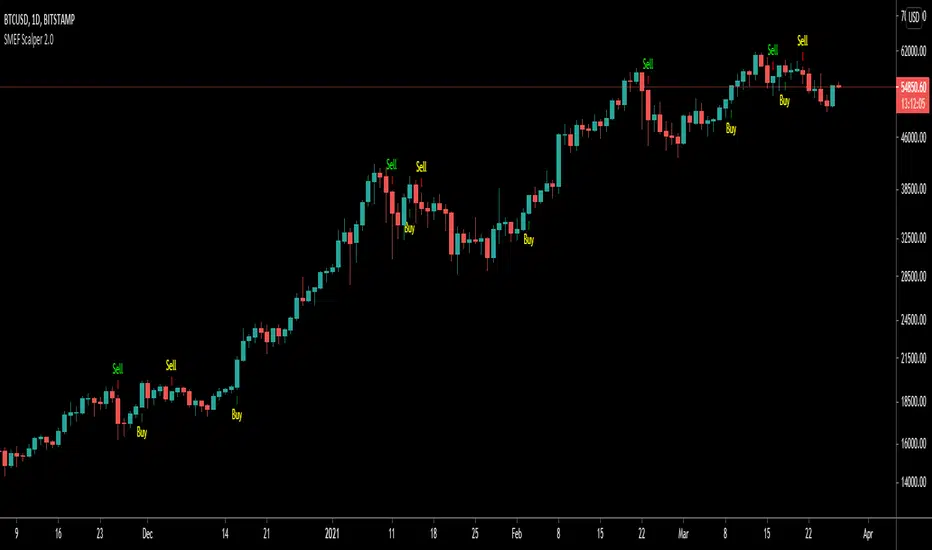
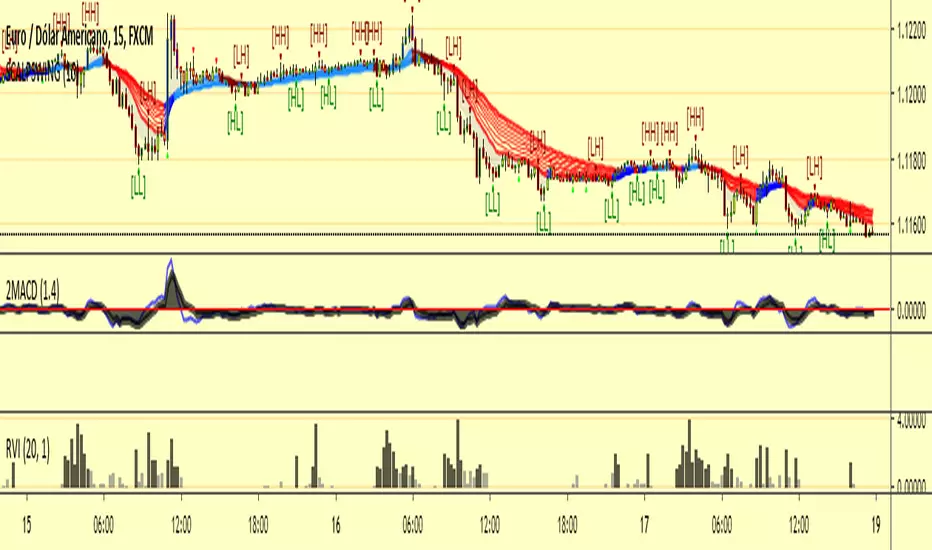
SMEF Scalper 2.0SMEF Scalper 2.0 by shaslund.
Trying to mix some humour into technical trading.
Kudos to Douglas Adams for his great books. Please take some time to read them.
I believe all traders have been SMEF'd now and then...
For the uninitiated: SMEF = 'Spontaneous Massive Existence Failure'.
Methology:
I am combining a TEMA and a volume-weighted average to predict the trend changes (buy/sell).
Features:
Some funny, some useful.
Changes in v2.0:
Removed some garbage and unprotected the code.
Thanks to ChrisMoody, LazyBear and Hpotter for invaluable scripting ideas :-)
Now, go ahead and board the 'Heart of Gold' and enjoy the ride :-)

Relative Volume IndicatorGrato ao LazyBear, pela base do indicador, que modifiquei para facilitar o entendimento dos movimentos.

RSI Bands %BThis is again a lazy bear script that has been lost due to the removal of the "make it mine feature".
please credit
If you see any of his great scripts that are no longer accessible message me and I will see what I can do.

Fib Divergence SystemCombo of many useful indicators which includes fib lines, time and money channels and divergence buy sell signals
Credits for source code:
Scarf, Lazybear, 100kiwi

Minimal Godmode 1.0// Acknowledgements:
// Original Godmode Authors:
// @Legion, @LazyBear, @Ni6HTH4wK, @xSilas
// Drop a line if you use or modify this code.
// Godmode 3.1.4: @SNOW_CITY
// Godmode 3.2: @sco77m4r7in and @oh92
// Godmode3.2+LSMA: @scilentor
// Godmode 4.0.0-4.0.1: @chrysopoetics
// Jurik Moving Average: @everget
// Minimal Godmode v1.0:
// Removed BITSTAMP:BTCUSD, added presets for 9-26-13 and 17-6-4, added more exchanges + USDT and USDC pairs to multi-exchange option
// JMA smoothing - more responsive + less lag than SMA at equivalent length settings
// Minor cosmetic changes to account for pinescript 3 transparency and z-order

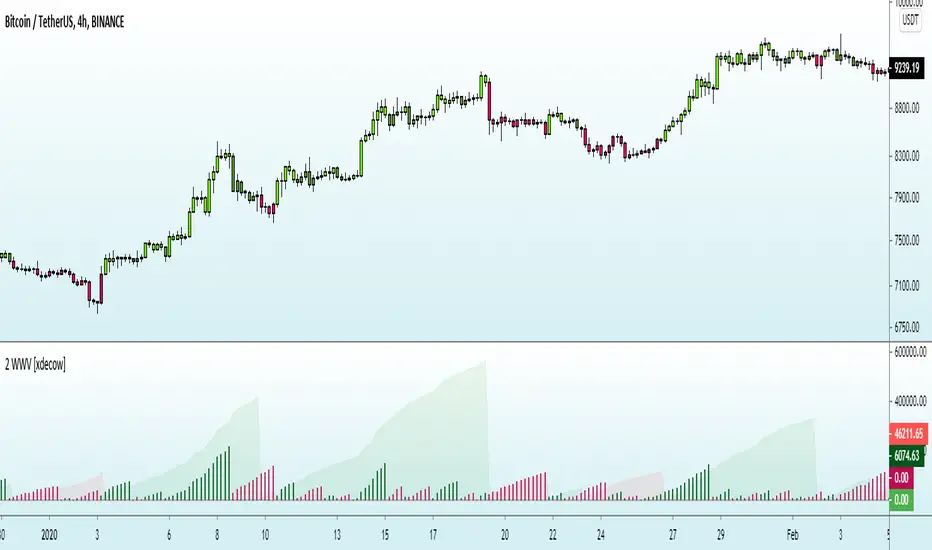
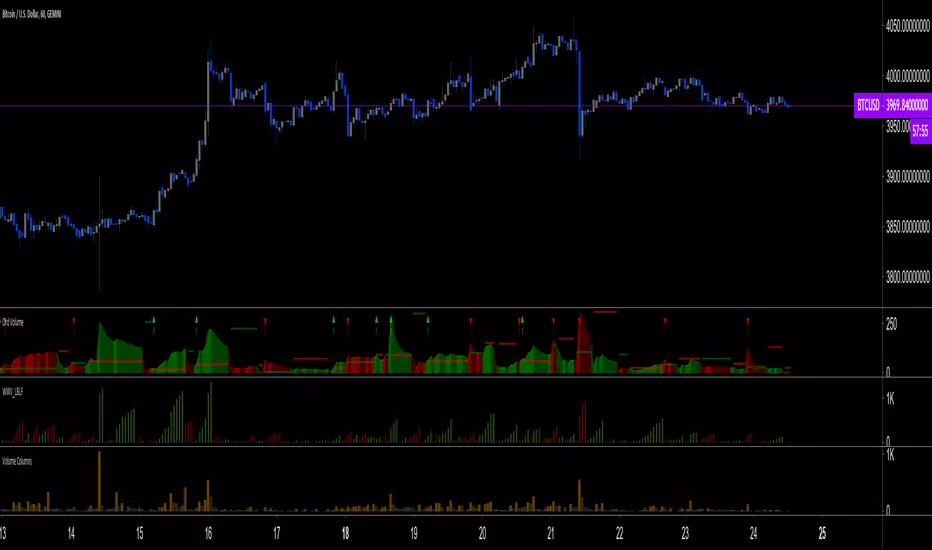
Ord Volume [LucF]Tim Ord came up with the Ord Volume concept. The idea is similar to Weis Wave , except that where Weis Wave keeps a cumulative tab of each wave’s successive volume columns, Ord Volume tracks the wave's average volume .
Features
You can choose to distinguish the area’s colors when the average is rising/falling (default).
You can show an EMA of the wave averages, which is different than an EMA on raw volume.
You can show (default) the last wave’s ending average over the current wave, to help in comparing relative levels.
You can change the length of the trend that needs to be broken for a new wave to start, as well as the price used in trend detection.
Use Cases
As with Weis Wave, what I look at first are three characteristics of the waves: their length, height and slope. I then compare those to the corresponding price movements, looking for discrepancies. For example, consecutive bearish waves of equal strength associated with lesser and lesser price movements are often a good indication of an impeding reversal.
Because Ord Volume uses average rather than cumulative volume, I find it is often easier to distinguish what is going on during waves, especially exhaustion at the end of waves.
Tim Ord has a method for entries and exits where he uses Ord Volume in conjunction with tests of support and resistance levels. Here are two articles published in 2004 where Ord explains his technique:
pr.b5z.net
n.b5z.net
Note
Being dependent on volume information as it is currently available in Pine, which does not include a practical way to retrieve delta volume information, the indicator suffers the same lack of precision as most other Pine-built volume indicators. For those not aware of the issue, the problem is that there is no way to distinguish the buying and selling volume (delta volume) in a bar, other than by looping through inside intervals using the security() function, which for me makes performance unsustainable in day to day use, while only providing an approximation of delta volume.

Trading System(Light)Combo of many useful indicators modified to suit dark theme, contains
1)Regular and Hidden Divergence Buy and Sell signals by scarf
2)Time and Money channels by Lazybear
3)Fibonacci Bollinger Bands by Rashad
4) Linear Regression Curve by ucsgears
Thanks for all the creators for the source codes!

Trading System(Dark)Combo of many useful indicators modified to suit dark theme, contains
1)Regular and Hidden Divergence Buy and Sell signals by scarf
2)Time and Money channels by Lazybear
3)Fibonacci Bollinger Bands by Rashad
4)Linear Regression Curve by ucsgears
Thanks for all the creators for the source codes!

Trading System(Dark)Combo of many useful indicators, contains
1)Regular and Hidden Divergence Buy and Sell signals by scarf
2)Time and Money channels by Lazybear
3)Fibonacci Bollinger Bands by Rashad
4)Linear Regression Curve by ucsgears
Thanks for all the creators for the source codes!
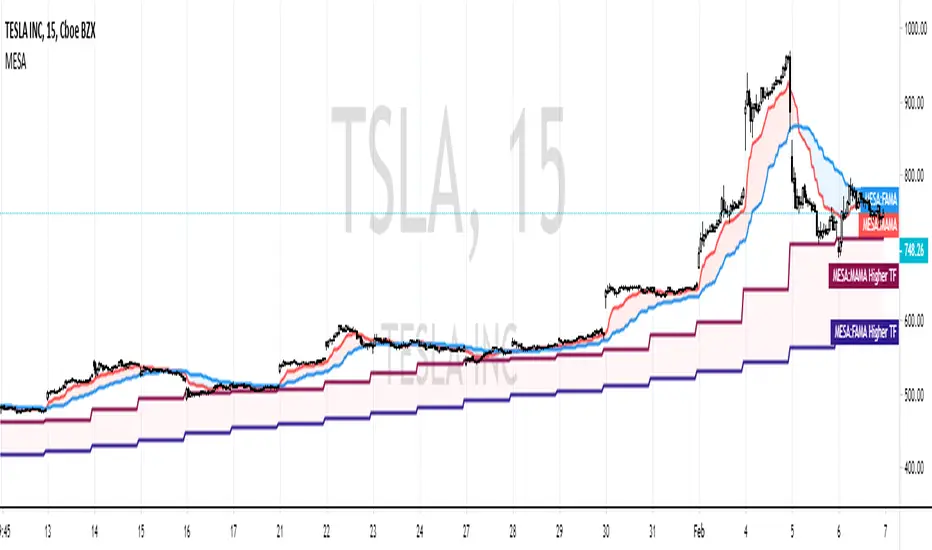
MESA Adaptive Moving AverageIntro
One of Ehlers most well-known indicators! I've seen many variations of this on TradingView, however, none seem to be true to the original released by Ehlers himself.
I've taken it upon myself to simply translate the MAMA into Pinescript, instead of re-writing like some others have done.
You can use it as a very effective & adaptive moving average with other signals or
as a standalone signal.
In the case that you're going to use it for signals and not simple technical trading (non-quantitative),
I've also added a threshold parameter to filter out weak signals.
My MAMA indicator is different from others in very simple ways - I don't use the nz() command, which sets all "Not a Number" values to 0. In others' scripts, you immediately load the indicator with several 0 values,
causing a slight lag in future calculations since this code is recursive (refers to previous values it generated).
In my version, I simply wait until the script has access to all the bar data it needs, instead of instantly performing calculations and
setting erroneous values to 0. In this case, we start with the correct values (or closer to correct).
If you want to compare this indicator the current most popular MAMA by LazyBear, you'll notice it often gives buy and sell crosses one bar earlier than theirs.
Setting Parameters
Source - the data series to perform calculations on. (Initially, Ehlers himself favored hl/2, but conceded that there isn't empirical benefit over close.)
Fast Limit - controls how quickly the MAMA will "ratchet up" fast price action. (Higher values are faster)
Slow Limit - controls how closely the FAMA will follow the MAMA. (Again, higher is faster. You typically want the FAMA to be slower though.)
Crossover Threshold - simple error thresholding to limit the number of weak trade signals. (Lower means lower tolerance)
Show Crosses? - show/hide the arrows at moving average crosses
ATR Pips with Stop LossThis indicator shares ATR pips and a calculated 1.5 x stop loss calculation.
1st number is ATR.
2nd number is ATR x 1.5 (a typical SL when trading daily time frame).
The plot lines are really not that important- it's the actual numbers.
What I do is uncheck the plot line checkboxes (ATR & SL) so it doesn't show up, that way I can reduce the indicator window.
This script is a modified script by ATR Pips . Kept the BB section for now as it might be useful, but doubt it.
Future updates:
- editable the multiple for SL
- static daily numbers (right now this shows the timeframe you are viewing, I'd keep that but add a static daily ATR so you have both)

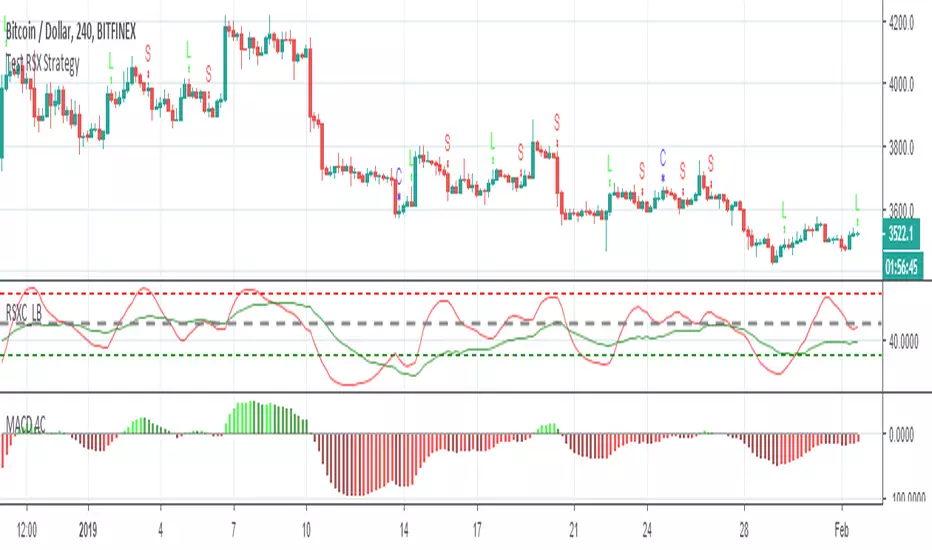
Test RSX StrategyI m test this strategy based on lazybear rsx.
L - Long
S - Short
C - Close positions
Don't recommend to use close bars!
MAMA by EHLERSMESA Adaptive Moving Average aka: Mother of Adaptive Moving Averages:
The MESA Adaptive Moving Average ( MAMA ) adapts to price movement in an
entirely new and unique way. The adapation is based on the rate change of phase as
measured by the Hilbert Transform Discriminator I have previously described.1
The advantage of this method of adaptation is that it features a fast attack average and a
slow decay average so that composite average rapidly ratchets behind price changes
and holds the average value until the next ratchet occurs. The action of MAMA is
shown in Figure 1. Since the average fallback is slow I can build trading systems that
are virtually free of whipsaw trades.
For detailed information of MAMA: (creators' PDF document)
www.mesasoftware.com
Long condition: when MAMA Crosses over FAMA (Following Adaptive Moving Average )
Short condition: when FAMA Crosses over MAMA
(Personally modified LazyBear's version which was originally calculated in degrees instead of radian by applying explanations in the MESA pdf document.http://www.mesasoftware.com/papers/MAMA.pdf)
Creator: John EHLERS

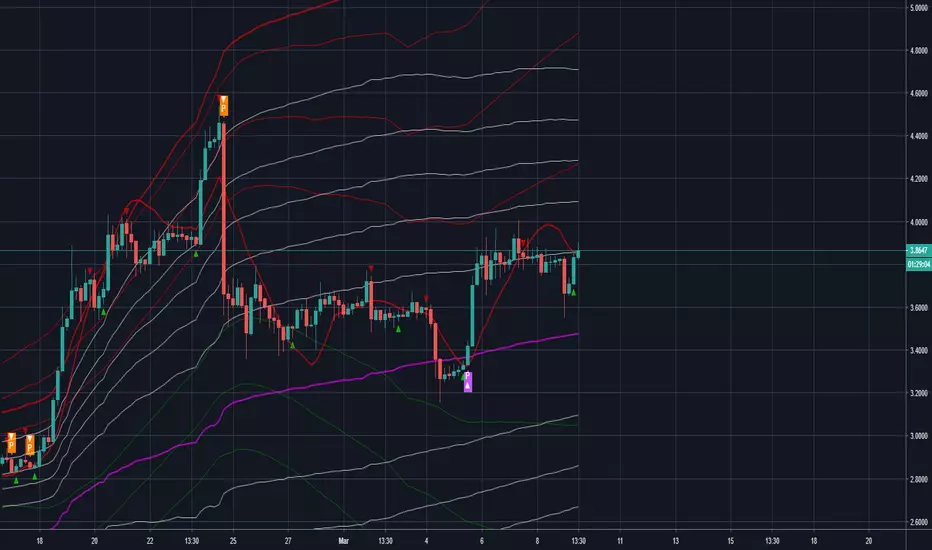
Ehlers Cycle StrategyThis uses Ehlers methods to create a cycle trading strategy.
It finds the dominant cycle in the market, then creates filters out noise to create an oscillator. It then creates a trigger line using momentum to predict a reversal in price. Finally, Ehlers Empirical Mode Discriminator is used to evaluate trends and eliminate trading against the trend.
Shout out to HPotter, Everget, and LazyBear for implementing many of Ehlers indicators, which I sampled to create this indicator and strategy.

Adaptive Bandpass Trigger Oscillator Ver 3This is an improvement of the Adaptive Bandpass Trigger Oscillator. It adds an option for a multiplier to the dominant cycle to filter out smaller swings.
Feel free to message me if you would like development work or would just like to donate ; )
This is based off of Ehlers' Bandpass Filter system (link below slides 15-17). I then used Ehlers' methods for finding the dominant cycle to automatically input the dominant cycle to the length. Essentially Ehlers runs a band pass with a given period to detrend the price data and highlight a cycle with the given frequency(length). This represents the In phase cycle. Ehlers then creates the trigger line by taking the one bar momentum of the In Phase line, multiplying by 2Pi and then using this to create a 60 degree leading signal. The triggers are crossovers of the In Phase and Lead lines. You can also use conservative signals by waiting for the In Phase line to trend in the direction of the trigger crossover as well.
Delta represents how much to influence the oscillator by the price (Delta 0 is a perfect wave)
Alpha represents how quickly to adapt between the dominant cycle changes in the price.
Thanks to LazyBear for implementing Ehlers' original adaptive code, which I used for this system
Thanks to HPotter for the BandPass Filter code, which I used as a base for implementing the rest of the system

Adaptive Bandpass Trigger Oscillator Ver 2.0This is an improvement of the Adaptive Bandpass Trigger Oscillator. It normalizes the values to 0-100 to allow the addition of overbought and oversold levels. An aggressive trigger would be an inflection point of the trigger line while overbought/oversold and the phase line above/below the midline.
Feel free to message me if you would like development work or would just like to donate ; )
This is based off of Ehlers' Bandpass Filter system (link below slides 15-17). I then used Ehlers' methods for finding the dominant cycle to automatically input the dominant cycle to the length. Essentially Ehlers runs a band pass with a given period to detrend the price data and highlight a cycle with the given frequency(length). This represents the In phase cycle. Ehlers then creates the trigger line by taking the one bar momentum of the In Phase line, multiplying by 2Pi and then using this to create a 60 degree leading signal. The triggers are crossovers of the In Phase and Lead lines. You can also use conservative signals by waiting for the In Phase line to trend in the direction of the trigger crossover as well.
Delta represents how much to influence the oscillator by the price (Delta 0 is a perfect wave)
Alpha represents how quickly to adapt between the dominant cycle changes in the price.
Thanks to LazyBear for implementing Ehlers' original adaptive code, which I used for this system
Thanks to HPotter for the BandPass Filter code, which I used as a base for implementing the rest of the system
www.mesasoftware.com
