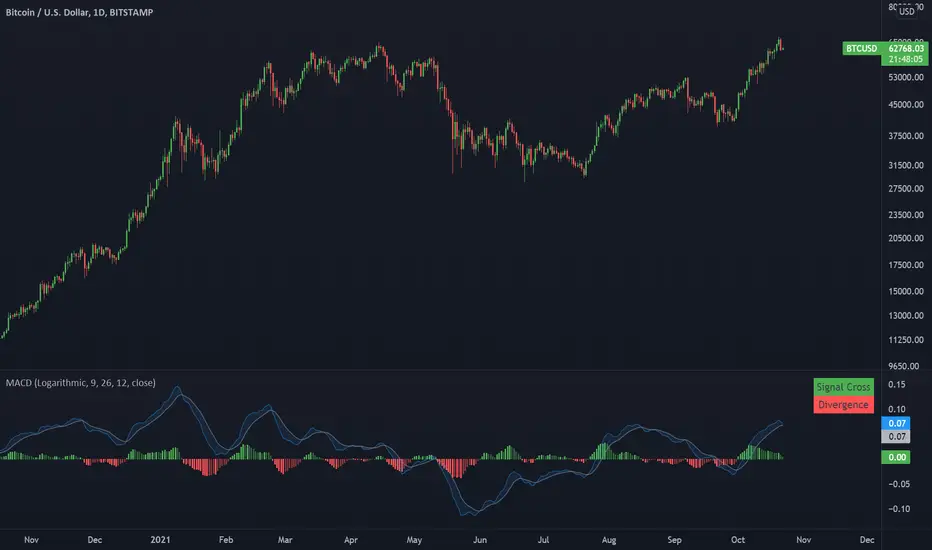
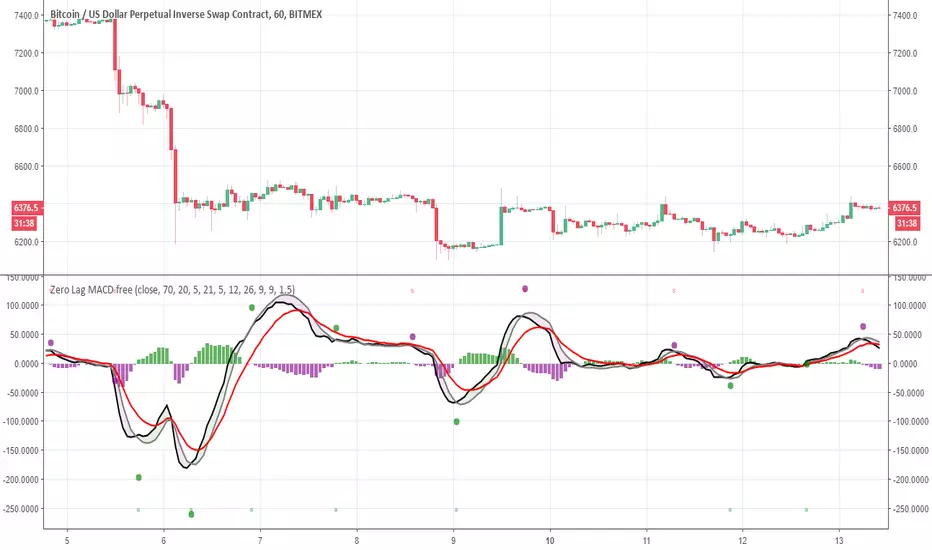
Moving Average Convergence DivergenceA MACD with option for logarithmic or regular scale.
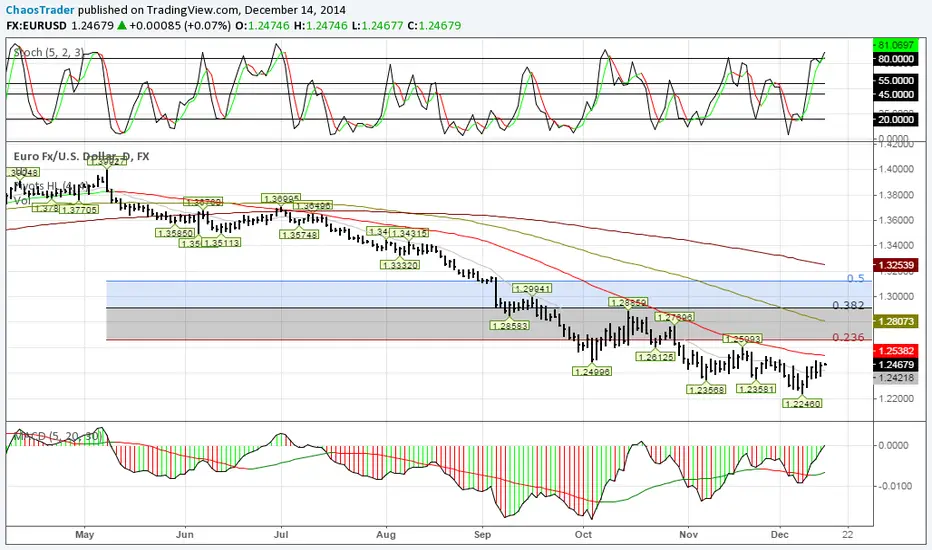
This indicator presents bullish or bearish 'flags' based on the most recent signal cross and asset price divergence. If the price moves up and the macd continues trending down, a bearish divergence is flagged. if the price moves down and the macd continues moving up, a bullish divergence is flagged.
Cari dalam skrip untuk "MACD"
VMACD IndicatorVolume-Weighted MACD Indicator. You can turn volume-weighted off to get "regular" MACD, and you can change the scaling of the histogram to make it stand out more.

NAKED NINJA DOUBLE MACD SUPER STOC HELL 3just eye ball it on charts and you will see how it all works dedicatated to an OG

Project 1 - Complete with CMF and All IndicatorsProject 1 – Multi-Indicator Suite
This script combines several widely-used technical indicators into a single visual framework.
It is designed to help traders track momentum, trend strength, volume behavior, and money flow without switching between multiple tools.
Included components:
• MACD with dynamic color changes
• RSI with percentage change and directional marker
• ADX with trend-strength shading and Δ% calculation
• CMF (Chaikin Money Flow) with positive/negative flow tracking
• Volume Oscillator for short–long volume pressure
• Auto-updated labels for RSI, ADX, and CMF
• Lightweight visual lines to show momentum changes
Use cases:
• Trend confirmation
• Momentum diagnostics
• Volume-based pressure analysis
• Money-flow direction and strength
• Multi-factor confluence without indicator stacking
This tool does not generate buy/sell signals and does not imply trading outcomes.
It is a visual analytics suite built for discretionary technical analysis.

MACD+Features:
Allows for each MA to use EMA, WMA or SMA independently.
Adds a configurable fill between the MACD line and Signal lines.

Volume Weighted MACD with Named PlotsLiterally just copied VWMACD but named the plot lines to make setting alerts more clear.


MACD_TracerSimple Script for a very fast MACD
Best used as an Indicator Overlay for studying detailed movement.
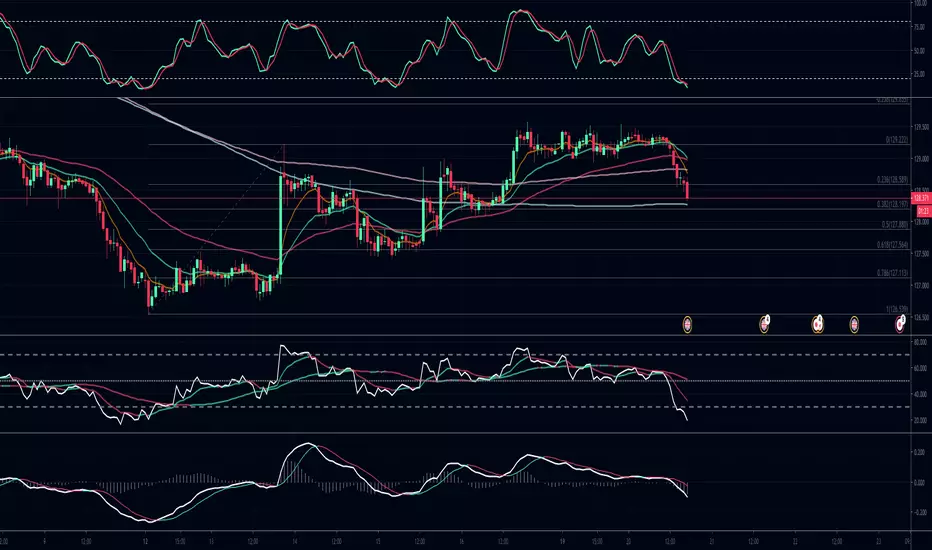
Indicator over Indicator
Using as a Indicator overlay. You must drag and drop an indicator over another indicator. After you have the visual of both indicators in one indicator box, you must go to CHART PROPERTIES and SCALE LEFT . This way both your indicators are scaled to same axis.
Analysis
Having both indicators allows me the ability to better detect what the indicator is specialized to do. In this case I have one indicator that has strength at detecting Momentum shifts and the other detects Divergences.

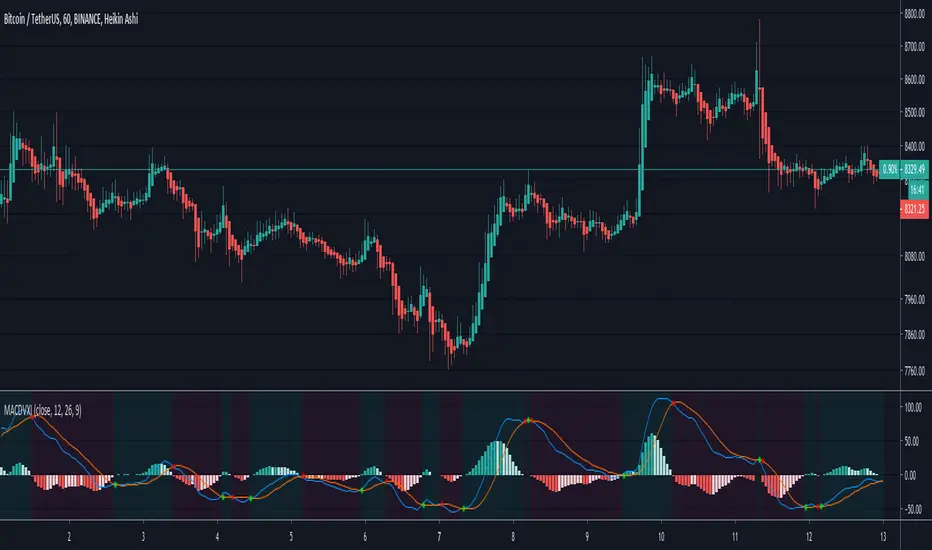
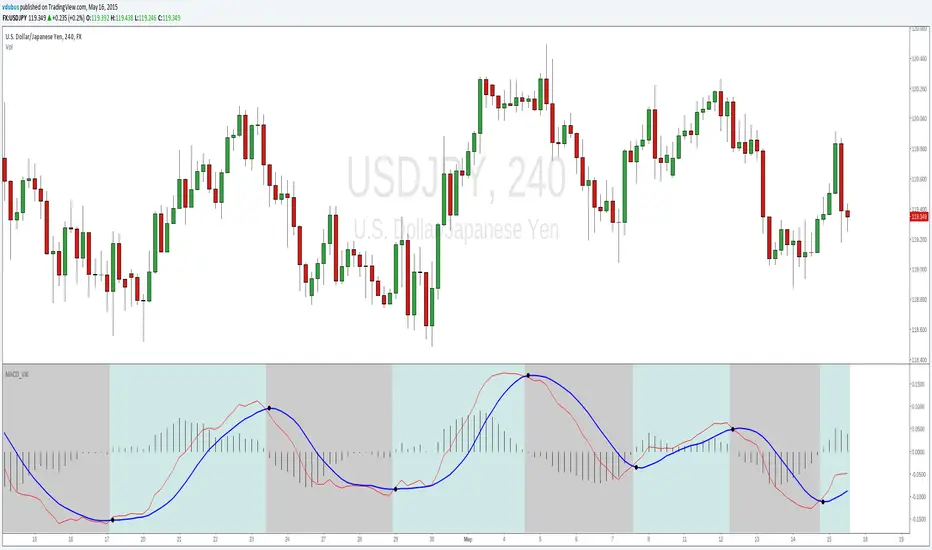
MACD_VXIMACD_VXI..
*Cross over markers
*Directional bgcolor indication
To run in line with the VX family / or stand alone :-
Baseline_VX1
MACD_VX1 (this one)
Stoch_VX3
/Strategy, line up all three, place your bets - Black or Green :)

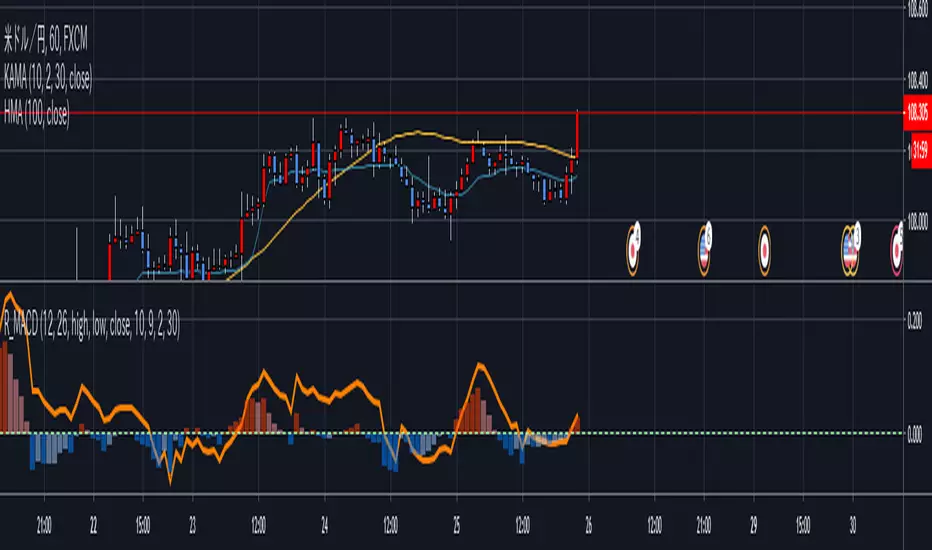
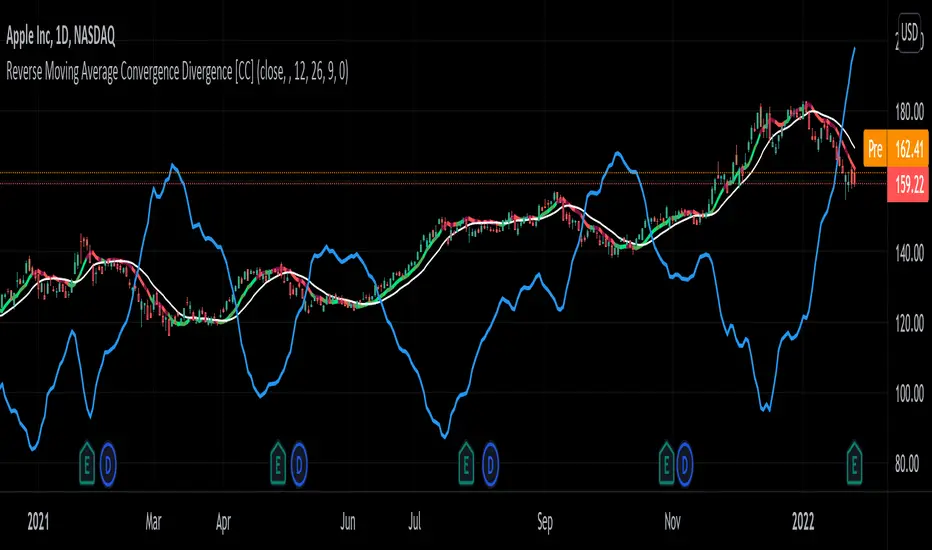
Reverse Moving Average Convergence Divergence [CC]The Reverse Macd was created by Johnny Dough (Stocks and Commodities Jan 2012) and this is another indicator in my ongoing series to find those hidden gems. This indicator works in a few very powerful ways. For example the blue line shows you what the current price would be if the macd was at the macd level that you choose. I set the default to 0 but feel free to change it if you want. This will give you short to medium term info by telling you if it is an uptrend when the price is above the blue line or vice versa. It also creates the reverse macd line and it's signal line by using information from the previous day to decompile the macd and show you the price that it would be at if the macd was at that level. It turns this into a new moving average that closely tracks price movements and with the two competing signals, gives you more than enough info to find the perfect entry and exit points. Like always I have included strong buy and sell signals in addition to normal ones so darker colors are strong signals and lighter colors are normal signals. Buy when the line is green and sell when it is red.
Let me know if there are any other scripts you would like to see me publish!
Moving Average Convergence Divergence On Alter OBVOBV:
The OBV is perfect indicator to understand the strength of the particular stock. As the strength increase, the trend of the stock goes high along with price. But, the OBV is considered only with close of previous close which is to make sure the double confirmation on the price to accumulate the volume.
Altered OBV:
So, here is the altered OBV, which basically consider the close of previous close and also buying interested of the day when close is higher than open.
MACD:
I always admire the magic of MACD with pre-defined timeframe. Now, this MACD applied on top of altered OBV to signal us the moving of the ticker strength.
I hope the another MACDAltOBV would help on your swing trading strategy.
Happy Investing.

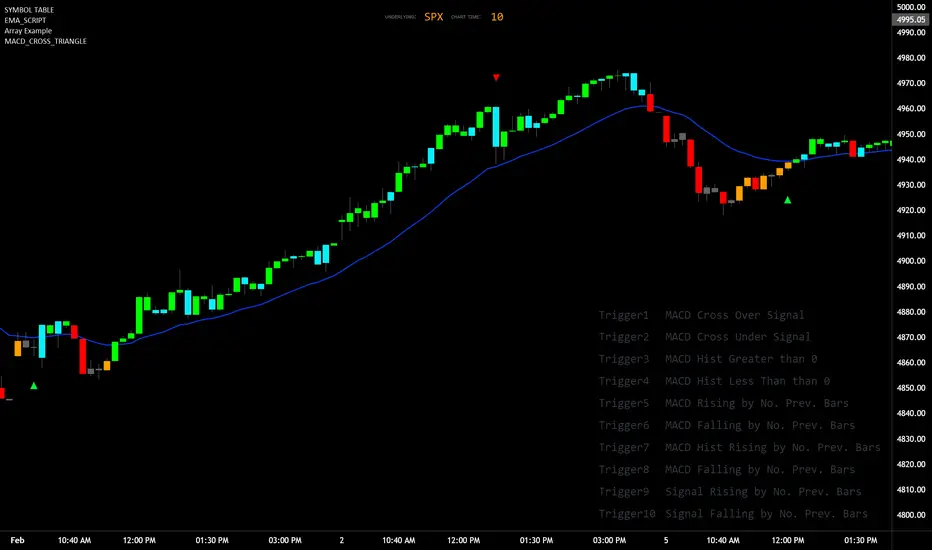
MACD_TRIGGER_CROSS_TRIANGLEMACD Triangle Trigger Indicator by thebearfib
Overview
The MACD Cross Triangle Indicator is a powerful tool for traders who rely on the MACD's signal line crossovers to make informed trading decisions. This indicator enhances the traditional MACD by allowing users to customize triggers for bullish and bearish signals and by displaying these signals directly on the chart with visually distinctive labels.
Features
Customizable Color Scheme: Choose distinct colors for bullish and bearish signals to fit your chart's theme or your personal preference.
Flexible Trigger Conditions: Select from a variety of trigger conditions based on MACD and signal line behaviors over a specified number of bars back.
Visual Signal Indicators: Bullish and bearish signals are marked with upward and downward triangles, making it easy to spot potential entry or exit points.
Detailed Trigger Descriptions: A comprehensive table lists all available triggers and their descriptions, aiding in selection and understanding of each trigger's mechanism.
Configuration Options
Bullish and Bearish Colors: Customize the color of the labels for bullish (upward) and bearish (downward) signals.
Trend Lookback Period: Choose how far back (in bars) the indicator should look to determine the trend, affecting the calculation of certain triggers.
Trigger Selection for Bullish and Bearish Signals: Pick specific triggers for both bullish and bearish conditions from a list of 10 different criteria, ranging from MACD crossovers to historical comparisons of MACD, signal line, and histogram values.
Label Size and Font Settings: Adjust the size of the signal labels on the chart and the font size of the trigger descriptions table to ensure readability and fit with your chart layout.
Trigger Descriptions Table Position and Color: Customize the position and color of the trigger descriptions table to match your chart's aesthetic and layout preferences.
Trigger Mechanisms
Trigger 1 to 10: Each trigger corresponds to a specific condition involving the MACD line, signal line, and histogram. These include crossovers, directional changes compared to previous bars, and comparisons of current values to historical values.
Usage
1. Select Trigger Conditions: Choose the desired triggers for bullish and bearish signals based on your trading strategy.
2. Customize Visuals: Set your preferred colors for the bullish and bearish labels, adjust label and font sizes, and configure the trigger descriptions table.
3. Analyze Signals: Watch for the upward (bullish) and downward (bearish) triangles to identify potential trading opportunities based on MACD crossover signals.
Conclusion
The MACD Cross Triangle Indicator offers a customizable and visually intuitive way to leverage MACD crossover signals for trading. With its flexible settings and clear signal indicators, traders can tailor the indicator to fit their strategy and improve their decision-making process on TradingView.
MACD ReLoaded STRATEGYSTRATEGY version of MACD ReLOADED Indicator:
A different approach to Gerald Appel's classical Moving Average Convergence Divergence.
Appel originaly set MACD with exponential moving averages.
In this version users can apply 11 different types of moving averages which they can benefit from their smoothness and vice versa sharpnesses...
Built in Moving Average type defaultly set as VAR but users can choose from 11 different Moving Average types like:
SMA : Simple Moving Average
EMA : Exponential Moving Average
WMA : Weighted Moving Average
DEMA : Double Exponential Moving Average
TMA : Triangular Moving Average
VAR : Variable Index Dynamic Moving Average a.k.a. VIDYA
WWMA : Welles Wilder's Moving Average
ZLEMA : Zero Lag Exponential Moving Average
TSF : True Strength Force
HULL : Hull Moving Average
TILL : Tillson T3 Moving Average
In shorter time frames backtest results shows us TILL, WWMA, VIDYA (VAR) could be used to overcome whipsaws because they have less numbers of signals.
In longer time frames like daily charts WMA, Volume Weighted MACD V2, and MACDAS and SMA are more accurate according to backtest results.
My interpretation of Buff Dormeier's Volume Weighted MACD V2:
Thomas Aspray's MACD: (MACDAS)

[KVA] KMACDKMACD Indicator: Advanced Market Analysis Through Central Tendency Metrics
The KMACD (KAMVIA Moving Average Convergence Divergence) indicator is an advanced, multi-dimensional tool designed to provide traders and analysts with a deeper understanding of market dynamics. By integrating the classical MACD framework with statistical measures of central tendency, KMACD offers a sophisticated approach to identifying trends, reversals, and potential trading opportunities.
Key Features of the KMACD Indicator:
1. Enhanced MACD Calculation :
- The KMACD employs dual moving averages (fast and slow) of user-defined types (SMA, EMA, WMA) to calculate the MACD line, which represents the difference between these moving averages. This traditional approach is further enhanced by customizable signal smoothing, allowing users to fine-tune the sensitivity of the indicator.
2. Central Tendency Metrics :
- The indicator integrates additional statistical measures, such as Mean, Median, Mode, Standard Deviation, and Variance, calculated over a rolling window. These metrics provide insights into the central tendencies of the MACD values, helping traders understand the overall trend direction and the dispersion of price movements around the trend.
3. RSI-Like Oscillator :
- A unique RSI-like value derived from the MACD line is included to highlight overbought and oversold conditions. This offers a dual-layered perspective, combining the power of MACD and RSI methodologies, to signal potential market extremes with greater precision.
4. Customizable Visual Elements :
- KMACD allows users to toggle the visibility of the MACD line, Signal line, and Histogram, providing flexibility in how the data is presented. The histogram dynamically changes color—green when above zero, indicating bullish momentum, and red when below zero, indicating bearish momentum.
5. Horizontal Line Customization :
- The indicator includes customizable horizontal lines for the zero level, overbought, and oversold thresholds. These lines serve as visual cues to identify key price levels and market conditions.
6. Adaptive to Various Market Conditions :
- KMACD's comprehensive features make it adaptable to various market conditions, from trending markets to sideways consolidations. Whether you're looking to capture momentum shifts or identify potential reversal points, KMACD provides the analytical power needed to make informed trading decisions.
How to Use KMACD:
- Trend Identification : Use the MACD line in conjunction with central tendency measures (Mean, Median, Mode) to gauge the overall market trend and its strength. A rising MACD line, supported by higher mean and median values, typically indicates an uptrend.
- Momentum Analysis : The histogram and RSI-like value help in identifying the momentum behind price movements. Positive histogram bars suggest increasing bullish momentum, while negative bars suggest increasing bearish momentum.
- Overbought/Oversold Conditions : Monitor the RSI-like oscillator and the overbought/oversold levels to detect when the market may be poised for a reversal.
- Divergence Detection : Look for divergences between the MACD line and price action, supported by the central tendency measures, to spot potential reversal points.
Conclusion
The KMACD indicator is more than just a traditional MACD; it’s a comprehensive tool designed to cater to both novice and experienced traders. By incorporating central tendency metrics and customizable features, KMACD stands out as a versatile and powerful indicator that enhances market analysis and trading strategies. Whether you're navigating volatile markets or steady trends, KMACD offers the precision and depth needed to stay ahead.
