Fisher Transform with SignalsFisher Transform with Signals
The Fisher Transform is a technical indicator created by John F. Ehlers that converts prices into a Gaussian normal distribution.1 The indicator highlights when prices have moved to an extreme, based on recent prices. This may help in spotting turning points in the price of an asset. It also helps show the trend and isolate the price waves within a trend.
-The Fisher Transform is a technical indicator that normalizes asset prices, thus making turning points in price clearer.
-Some traders look for extreme readings to signal potential price reversal areas, while others watch for a change in direction of the Fisher Transform.
-The Fisher Transform formula is typically applied to price, but it can also be applied to other indicators.
-Asset prices are not normally distributed, so attempts to normalize prices via an indicator may not always provide reliable signals.
The Fisher Transform enables traders to create a Gaussian normal distribution, which converts data that isn't typically normal distributed, such as market prices. In essence, the transformation makes peak swings relatively rare events to help better identify price reversals on a chart.
This technical indicator is commonly used by traders looking for leading signals, rather than lagging indicators. The Fisher Transform can also be applied to other technical indicators, such as the relative strength index (RSI) or moving average convergence divergence (MACD).
How to Calculate the Fisher Transform
1.Choose a lookback period, such as nine periods. This is how many periods the Fisher Transform is applied to.
2.Convert the prices of these periods to values between -1 and +1 and input for X, completing the calculations within the formula's brackets.
3.Multiply by the natural log.
4.Multiply the result by 0.5.
5.Repeat the calculation as each near period ends, converting the most recent price to a value between -1 and +1 based on the most recent nine-period prices.
6.Calculated values are added/subtracted from the prior calculated value.
How can this script tell us to buy or sell?
- If the fisher is bigger then trigger background will be colored blue and this means you can buy
- If the trigger is bigger then fisher this means you can sell
Cari dalam skrip untuk "Relative Strength Index (RSI) "

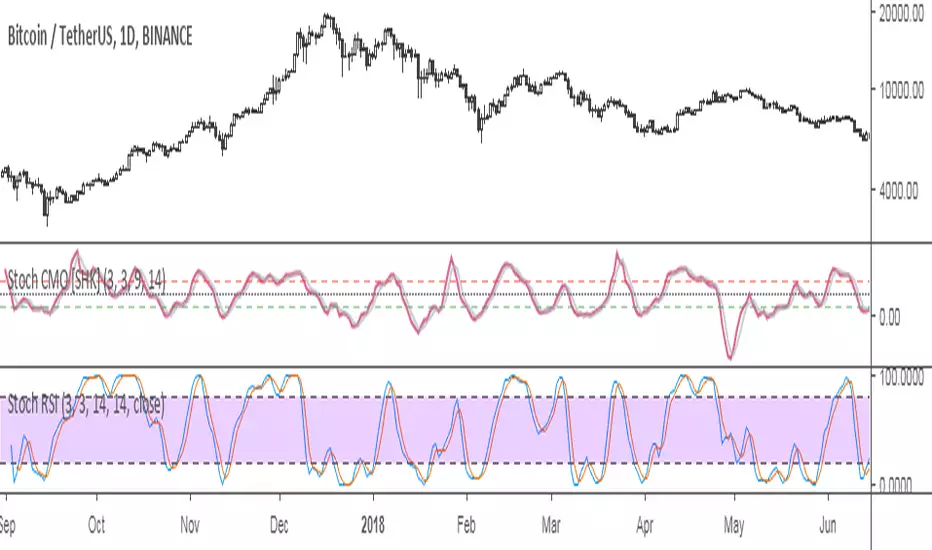
StochCMO - Stochastic CMO [SHK]StochCMO is the combination of Stochastic and CMO (Chande Momentum Oscillator).
The StochCMO is an indicator used in technical analysis that ranges between zero and one and is created by applying the Stochastic Oscillator formula to a set of Chande Momentum Oscillator (CMO) values rather than standard price data. Using CMO values within the Stochastic formula gives traders an idea of whether the current CMO value is overbought or oversold - a measure that becomes specifically useful when the CMO value is confined between its signal levels of 20 and 80.
Usage:
The usage of StochCMO is similar to StochRSI.
StochCMO vs StochRSI:
The difference between these indicators can be realized by comparing CMO & RSI:
CMO is similar to the Relative Strength Index (RSI) except that it measures momentum on both up days and down days. The CMO also does not use internal smoothing and thus does not obscure short-term extremes in momentum. As a result, the CMO often reaches over bought and over sold areas more regularly than momentum indicators, such as the RSI, that have internal smoothing.
Hope it helps you.
Quantitative Qualitative Estimation by ShizaruThe original script was posted on ProRealCode by user Nicolas.
he QQE indicator consists of a smoothed Relative Strength Index (RSI) indicator and two volatility-based trailing levels (fast and slow). The Fast Trailing Level (TL) and Slow TL are constructed by calculating the ATR of the smoothed RSI over n-periods and then further smoothing the ATR using an additional n-periods Wilders smoothing function. This smoothed ATR of RSI is then multiplied by the Fast and Slow ATR Multipliers to calculate the final Fast and Slow Trailing Levels.

Super Trend ReversalsMain Concept
The core idea behind the Super Trend Reversals indicator is to assess the momentum of automated trading bots (often referred to as 'Supertrend bots') that enter the market during critical turning points. Specifically, the indicator is tuned to identify when the market is nearing bottoms or peaks, but just before it shifts direction based on the triggered Supertrend signals. This approach helps traders engage with the market right as the reversal momentum builds up, allowing for entry just as conditions become favorable and exit before momentum wanes.
How It Works
The Super Trend Reversals uses multiple Supertrend calculations, each with different period and multiplier settings, to form a comprehensive view of the trend. The total trend score from these calculations is then analyzed using the Relative Strength Index (RSI) and Exponential Moving Averages (EMA) to gauge the strength and sustainability of the trend.
A key feature of this indicator is the isCurrentRangeSmaller() function, which evaluates if the current price range is lower than the average over the recent period. This function is critical as it helps determine the stability of the market environment, reducing the likelihood of entering or exiting trades based on erratic price movements that could lead to false signals.

Divergence Cheat Sheet'Divergence Cheat Sheet' helps in understanding what to look for when identifying divergences between price and an indicator. The strength of a divergence can be strong, medium, or weak. Divergences are always most effective when references prior peaks and on higher time frames. The most common indicators to identify divergences with are the Relative Strength Index (RSI) and the Moving average convergence divergence (MACD).
Regular Bull Divergence: Indicates underlying strength. Bears are exhausted. Warning of a possible trend direction change from a downtrend to an uptrend.
Hidden Bull Divergence: Indicates underlying strength. Good entry or re-entry. This occurs during retracements in an uptrend. Nice to see during the price retest of previous lows. “Buy the dips."
Regular Bear Divergence: Indicates underlying weakness. The bulls are exhausted. Warning of a possible trend direction change from an uptrend to a downtrend.
Hidden Bear Divergence: Indicates underlying weakness. Found during retracements in a downtrend. Nice to see during price retests of previous highs. “Sell the rallies.”
Divergences can have different strengths.
Strong Bull Divergence
Price: Lower Low
Indicator: Higher Low
Medium Bull Divergence
Price: Equal Low
Indicator: Higher Low
Weak Bull Divergence
Price: Lower Low
Indicator: Equal Low
Hidden Bull Divergence
Price: Higher Low
Indicator: Higher Low
Strong Bear Divergence
Price: Higher High
Indicator: Lower High
Medium Bear Divergence
Price: Equal High
Indicator: Lower High
Weak Bear Divergence
Price: Higher High
Indicator: Equal High
Hidden Bull Divergence
Price: Lower High
Indicator: Higher High

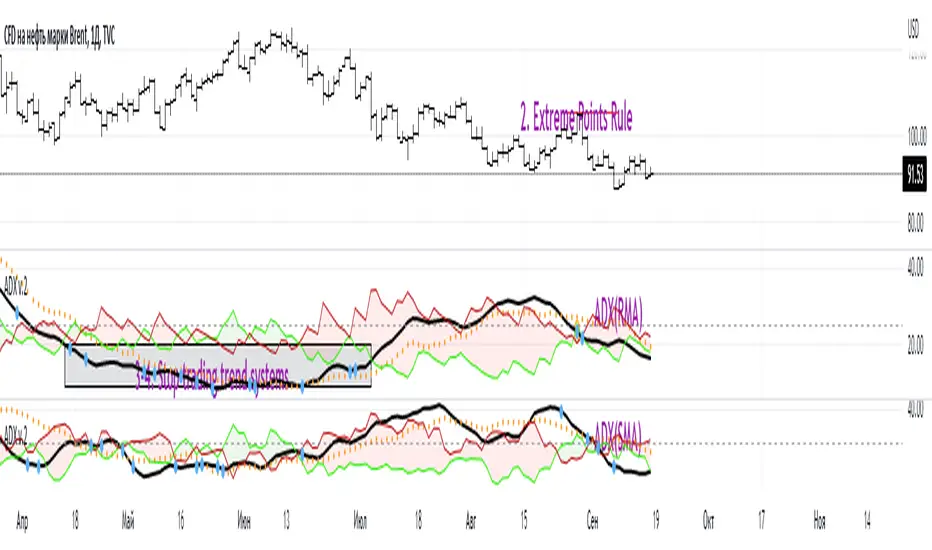
ADX W. Wilders(DI+, DI-, DX, ADXR, Equilibrium Point)The reason for publishing the script was the lack of display of important components in the standard ADX indicator, such as DI+, DI-, DX , ADXR, and the absence of a choice of methods for calculating moving averages in the indicator.
According to the book by the author of the ADX indicator, W. Wilder, the indicator components were calculated using the SMA formula, however, the RMA moving average is used in the code of the built-in indicator in TradingView, which shows excellent results, but this is not a classic calculation method. In addition to SMA and RMA, there are also EMA , HMA , WMA , VWMA moving averages to choose from. Added the ability to display lines ADX , ADXR , DX , DI+, DI- and Equilibrium points (when DI+ and DI- are equal or intersect).
ADX Trading Rules
1. Trade the intersections of DI+ and DI-
2. Extreme Point Rule(EPR). EPR is formed when DI+, DI- (Equilibrium point) crosses, forming a trend reversal point at the extremum of the current bar. In the example on the ADX RMA chart, the DI- line is above DI+. Being in a short position at the reverse intersection of the DI- and DI + lines, it is necessary to take the high price of the crossing bar for the reversal point, upon breakdown of which, turn to long. In this example, the breakdown did not take place and the short position remained active, despite the intersection of the DI+ lines over DI-. This rule is an excellent filter that removes unnecessary transactions in the trading system.
3. DI+ > ADX and DI- > ADX. Stop trading trend-following systems.
4. If ADXR > 25, the trading system will be profitable. With ADXR < 20, trend-following systems need to stop trading. Many mistakenly use ADX values instead of ADXR . The author explicitly pointed to ADXR in his book.
5. Equilibrium Point - balance points. The accumulation of these points on the chart means the presence of a flat in the market. Accumulation often appears on a declining ADX after a top has been established on the ADX indicator. The smaller the distance between the points, the less significant movements occurred in the market.
6. For intraday trading of cryptocurrencies use can the following ADX settings:
DI Length = 100
ADX Smoothing = 14
MA Type = VWMA
Flat Zone = 30
P.S. Fragment from an interview with W. Wilder:
OH: You are probably best known for inventing the Relative Strength Index ( RSI ), Average Directional Index ( ADX ) and Average True Range (ATR). Which of these is the most powerful tool for a trader?
WW: The ADX .
OH: Is it the indicator you are most proud of?
WW: I guess so.
XABCD Harmonic Pattern Custom Range Interactive█ OVERVIEW
This indicator was designed based on Harmonic Pattern Book written by Scott Carney. It was simplified to user who may always used tools such as XABCD Pattern and Long Position / Short Position, which consume a lot of time, recommended for both beginner and expert of Harmonic Pattern Traders. XABCD Pattern require tool usage of Magnet tool either Strong Magnet, Week Magnet or none, which cause error or human mistake especially daily practice.
Simplified Guideline by sequence for Harmonic Pattern if using manual tools :
Step 1 : Trade Identification - XABCD Pattern
Step 2 : Trade Execution - Any manual tools of your choice
Step 3 : Trade Management - Position / Short Position
█ INSPIRATION
Inspired by design, code and usage of CAGR. Basic usage of custom range / interactive, pretty much explained here . Credits to TradingView.
I use a lot of XABCD Pattern and Long Position / Short Position, require 5 to 10 minutes on average, upon determine the validity of harmonic pattern.
Upon creating this indicator, I believed that time can be reduced, gain more confidence, reduce error during drawing XABCD, which helps most of harmonic pattern users.
█ FEATURES
Table can positioned by any postion and font size can be resized.
Table can be display through optimized display or manual control.
Validility of harmonic pattern depends on BC ratio.
Harmonic pattern can be displayed fully or optimized while showing BC ratio validity.
Trade Execution at point D can be displayed on / off.
Stop Loss and Take Profit can be calculated automatically or manually.
Optimized table display based extend line setup and profit and loss setup.
Execution zone can be offset to Point C, by default using Point D.
Currency can be show or hide.
Profit and Loss can be displayed on axis once line is extended.
█ HOW TO USE
Step 1 : Trade Identification - Draw points from Point X to Point C. Dont worry about magnet, point will attached depends on High or Low of the candle.
Step 2 : Trade Execution - Check the validity of BC to determine the validity of harmonic pattern generated. Pattern only generate 1 pattern upon success. Otherwise, redraw to other points.
Step 3 : Trade Management - Determine the current candle either reach Point D or Potential Reversal Zone (PRZ). Check for Profit & Loss once reach PRZ.
█ USAGE LIMITATIONS
Harmonic Patterns only limits to patterns mentioned in Harmonic Trading Volume 3 due to other pattern may have other or different philosophy.
Only can be used for Daily timeframe and below due to bar_time is based on minutes by default.
Not recommended for Weekly and Monthly timeframe.
If Point X, A, B, C and D is next to each other, it is recommend to use lower timeframe.
Automated alert is not supported for this release. However, alert can be done manually. Alert will updated on the version.
█ PINE SCRIPT LIMITATIONS
Known bug for when calculate time in array, causing label may not appeared or offset.
Unable to convert to library due to usage of array.get(). I prefer usage for a combination of array.get(id, 0), array.get(id, 1), array.get(id, 2) into custom function, however I faced this issue during make arrays of label. Index can be simply refered as int, for id, i not sure, already try id refered as simple, nothing happens.
linefill.new() will appeared as diamond box if overused.
Text in box.new() unable to use ternary condition or switch to change color. Bgcolor also affected.
Label display is larger than XABCD tool. Hopefully in future, have function to resize label similar to XABCD tools.
█ IMPORTANTS
Trade Management (Profit & Loss) is calculated from Point A to D.
Take Profit is calculated based on ratio 0.382 and 0.618 of Point A to D.
Always check BC validity before proceed to Trade Management.
Length of XABCD is equal to XAB plus BCD, where XAB and BCD are one to one ratio. Length is measured in time.
Use other oscillator to countercheck. Normally use built-in Relative Strength Index (RSI) and Divergence Indicator to determine starting point of Point X and A.
█ HARMONIC PATTERNS SUPPORTED
// Credits to Scott M Carney, author of Harmonic Trading Volume 3: Reaction vs. Reversal
Alt Bat - Page 101
Bat - Page 98
Crab - Page 104
Gartley - Page 92
Butterfly - Page 113
Deep Crab - Page 107
Shark - Page 119 - 220
█ FAQ
Pattern such as 5-0, perfect XABCD and ABCD that not included, will updated on either next version or new release.
Point D time is for approximation only, not including holidays and extended session.
Basic explaination for Harmonic Trading System (Trade Identification, Trade Execution and Trade Management).
Harmonic Patterns values is pretty much summarized here including Stop Loss.
Basic explanation for Alt Bat, Bat, Crab, Gartley, Deep Crab and Butterfly.
█ USAGE / TIPS EXAMPLES (Description explained in each image)

Circular Barplot - Oscillators Sentiment [LuxAlgo]This indicator is an implementation of a circular barplot aiming to return the market sentiment given by multiple normalized oscillators. These include the relative strength index (RSI), Stochastic %K (%K), Linear Correlation Oscillator (ROSC), William Percent Range (WPR), Percent Rank (%R), and money flow index (MFI).
The length period of each of these oscillators can be adjusted in the indicator settings.
The label in the center of the circular plot returns the average market sentiment constructed from all the previously mentioned oscillators.
Settings
Width: Circle width.
Spacing: Determines how close each circle is to the other.
Thickness: Width of the colored lines.
Offset: Controls how far the circular barplot left extremity is from the most recent candles.
Src: Input source of the indicators.
Usage
Unlike regular bar charts, circular bar plots display the bars as circle arcs and have the advantage of preserving horizontal and vertical space. A higher arc length would indicate a value closer to the maximal value of the oscillator. Other variations of the circular barplots exist but this variation using the circle arc is particularly appropriate for normalized data.
The indicator can be used as a simple widget giving a quick method to obtain the overall market sentiment of a certain ticker. A dashboard is displayed on the top left of the chart in the event the user wants to see the actual value of the oscillators.
Note that low width or high spacing settings might return unwanted results.

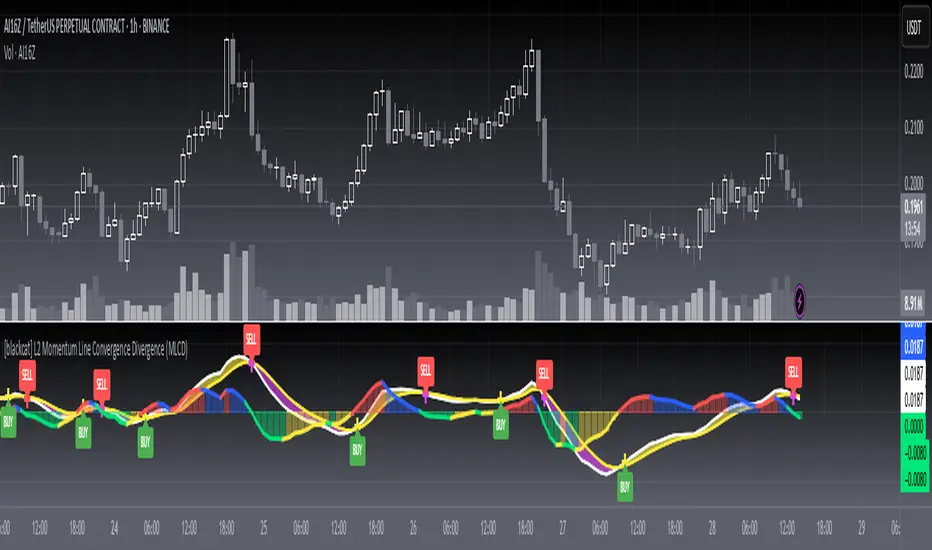
[blackcat] L2 Momentum Line Convergence Divergence (MLCD)Level: 2
Background
Momentum indicators are technical analysis tools that can be used to determine the strength or weakness of the stock price. Momentum measures the speed at which stock prices rise or fall. Common momentum indicators are the relative strength index (RSI) and the moving average of convergence divergence (MACD).
Function
L2 Momentum Line Convergence Divergence (MLCD) is one of my innovative indicator which is to differeniate with average of convergence divergence (MACD). So, I named it as Momentum Line Convergence Divergence (MLCD). In order for everyone to be more familiar with its useage, I inherited the traditional MACD expression method, and added golden cross (yellow cross) and dead cross (fuchsia cross) prompts, as well as bottom divergence (lime cross) and top divergence (red cross) prompts.
Key Signal
mtm --> momentum fast line
mtmaux --> momentum slow line
mtmgx --> momentum gold cross in yellow
mtmdx --> momentum dead cross in fuchsia
mtmbotdiverg --> momentum bottom divergence alert in lime cross
mtmtopdiverg --> momentum top divergence alert in red cross
Pros and Cons
Pros:
1. very stable for market price change and trend following
2. visual bottom and top divergence alerts are provided
Cons:
To be found yet
Remarks
Blackcat1402 brand MLCD indicator
Readme
In real life, I am a prolific inventor. I have successfully applied for more than 60 international and regional patents in the past 12 years. But in the past two years or so, I have tried to transfer my creativity to the development of trading strategies. Tradingview is the ideal platform for me. I am selecting and contributing some of the hundreds of scripts to publish in Tradingview community. Welcome everyone to interact with me to discuss these interesting pine scripts.
The scripts posted are categorized into 5 levels according to my efforts or manhours put into these works.
Level 1 : interesting script snippets or distinctive improvement from classic indicators or strategy. Level 1 scripts can usually appear in more complex indicators as a function module or element.
Level 2 : composite indicator/strategy. By selecting or combining several independent or dependent functions or sub indicators in proper way, the composite script exhibits a resonance phenomenon which can filter out noise or fake trading signal to enhance trading confidence level.
Level 3 : comprehensive indicator/strategy. They are simple trading systems based on my strategies. They are commonly containing several or all of entry signal, close signal, stop loss, take profit, re-entry, risk management, and position sizing techniques. Even some interesting fundamental and mass psychological aspects are incorporated.
Level 4 : script snippets or functions that do not disclose source code. Interesting element that can reveal market laws and work as raw material for indicators and strategies. If you find Level 1~2 scripts are helpful, Level 4 is a private version that took me far more efforts to develop.
Level 5 : indicator/strategy that do not disclose source code. private version of Level 3 script with my accumulated script processing skills or a large number of custom functions. I had a private function library built in past two years. Level 5 scripts use many of them to achieve private trading strategy.
Hybrid Overbought/Oversold Detector + Put/Call SignalsThere are many indicators of overbought/oversold conditions out there. Some of more common ones are:
- Bollinger Bands %B
- Money Flow Index (MFI)
- Relative Strength Index (RSI)
- Stochastic
This script uses a combination of these 4 oscillators to confirm overbought/oversold and filter the signals of market reverse which could be used for trading binary options.
You may select which oscillators you want to apply and of course change the source, the length of the calculations and the overbought/oversold levels.
Also the script will draw a combined graph which is the average of the selected oscillators in the options.
Send me your ideas!

RSI (14) with Auto Zone Colors — Overbought/Oversold HighlighterThis indicator plots the Relative Strength Index (RSI 14) with dynamic color changes for instant visual clarity:
✅ Green line in overbought zone (≥70)
✅ Red line in oversold zone (≤30)
✅ White line in neutral range (30–70)
Includes reference lines at 70, 50, and 30 for quick decision-making. Perfect for spotting momentum extremes, divergences, and potential reversal points without squinting at numbers. Works on any timeframe.

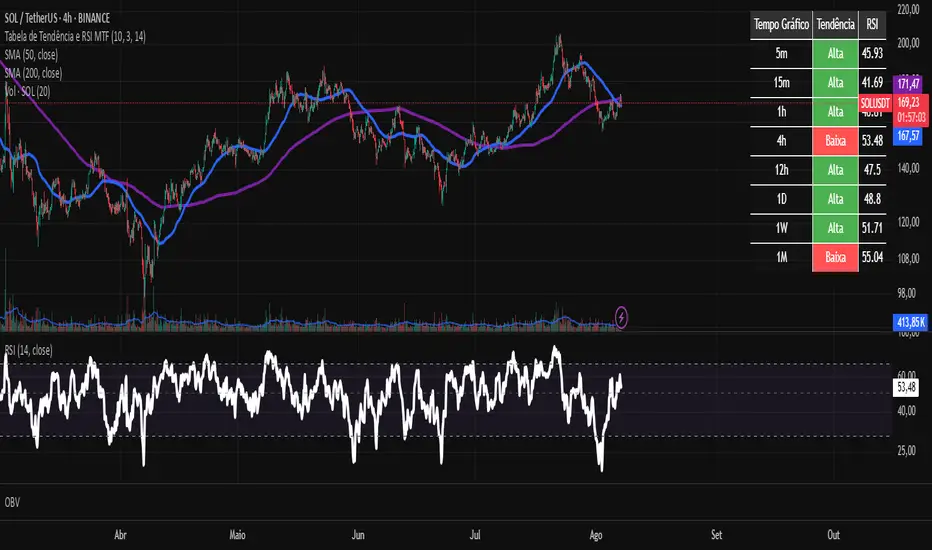
Tabela RSI e Tendência EMA MTF - 2This custom TradingView indicator provides a consolidated view of trend and Relative Strength Index (RSI) across multiple timeframes, all within an intuitive table directly on your chart. Designed for traders seeking quick and efficient analysis of market momentum and direction across different time horizons, this indicator automatically adapts to the asset you are currently viewing.

Tabela de Tendência e RSI MTF - PCThis custom TradingView indicator provides a consolidated view of trend and Relative Strength Index (RSI) across multiple timeframes, all within an intuitive table directly on your chart. Designed for traders seeking quick and efficient analysis of market momentum and direction across different time horizons, this indicator automatically adapts to the asset you are currently viewing.
Data Monitoring TableThis is a visual data dashboard specifically designed for users engaged in quantitative trading and technical analysis. It is equipped with two data tables that can dynamically display key market technical indicators and cryptocurrency price fluctuation data, supporting customizable column configurations and trading mode filtering.
✅ Core Features:
Intuitive display of critical technical indicators, including the Relative Strength Index (RSI), K-line entity gain, upper/lower shadow ratio, trading volume level, and change rate.
Multi-timeframe tracking of price fluctuations for BTC/ETH/SOL/XRP/DOGE (1-day, 6-hour, 3-hour).
Selectable trading modes: "long-only", "short-only", or "both".
Customizable number of columns to adapt to analysis needs across different timeframes.
All data is visualized in tables with color-coded prompts for market conditions (overbought, oversold, high volatility, low volatility, etc.).
📈 Target Audience:
Investors seeking systematic access to technical data.
Quantitative strategy developers aiming to capture market structural changes.
Intermediate and beginner traders looking to enhance market intuition and decision-making.
New Feature:
We have added a trading volume monitoring grade setting feature. Users can set the monitoring grade by themselves. When the market trading volume reaches this grade, the system will trigger an alarm. The default setting is level 5. This setting is designed to filter out trades with small fluctuations, helping users to capture key trading signals more accurately and improve the efficiency of trading decisions.
中文介绍
这是一款专为量化交易和技术分析用户设计的可视化数据仪表盘。它配备两个数据表格,可动态展示关键市场技术指标与加密货币价格波动数据,支持自定义列配置和交易模式筛选。
✅ 核心功能:
直观展示相对强弱指标(RSI)、K 线实体涨幅、上下影线比例、成交量水平及变化率等关键技术指标。
多时间框架追踪 BTC/ETH/SOL/XRP/DOGE 价格波动(1 日、6 小时、3 小时)。
可选交易模式:“仅做多”“仅做空” 或 “多空双向”。
可自定义列数,适配不同时间框架的分析需求。
所有数据以表格可视化呈现,通过颜色标注提示市场状况(超买、超卖、高波动、低波动等)。
📈 目标用户:
寻求系统获取技术数据的投资者。
旨在捕捉市场结构变化的量化策略开发者。
希望提升市场洞察力和决策能力的初、中级交易者。
新增功能:
我们新增了成交量监控等级设置功能。用户可自行设定监控等级,当市场成交量达到该等级时,系统将触发警报。默认设置为 5 级,此设置旨在过滤掉小幅波动的交易,帮助用户更精准地捕捉关键交易信号,提升交易决策效率。

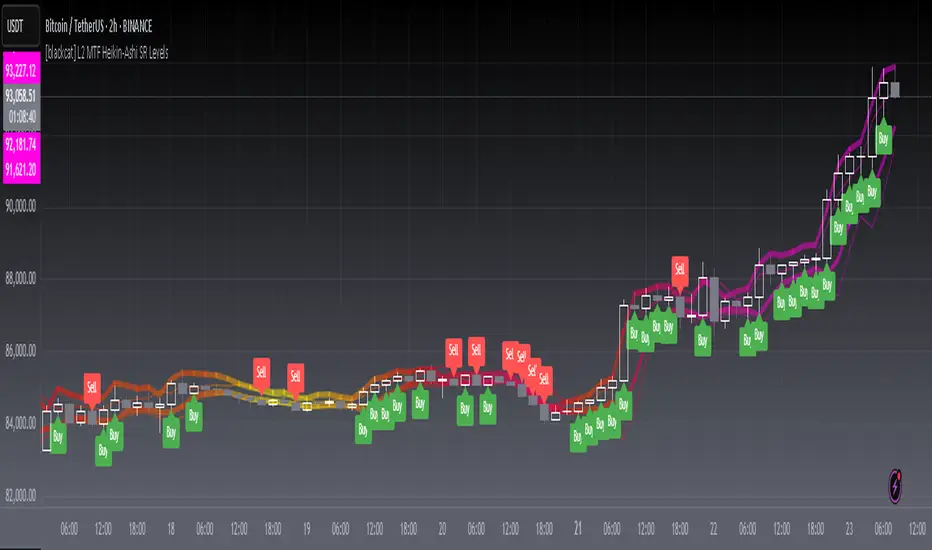
[blackcat] L2 MTF Heikin-Ashi SR LevelsOVERVIEW
The L2 MTF Heikin-Ashi SR Levels indicator is a sophisticated tool designed to help traders identify critical support and resistance levels across multiple timeframes. This script employs Heikin-Ashi candles, which provide a smoothed representation of price action, making it easier to spot trends and reversals. By integrating multi-timeframe analysis, this indicator offers a comprehensive view of market dynamics, enabling traders to make more informed decisions 📊✅.
This indicator not only calculates essential support and resistance levels but also visually represents them on the chart with gradient colors based on Relative Strength Index (RSI) values. Additionally, it features customizable alerts and labels to enhance user experience and ensure timely execution of trades.
FEATURES
Advanced Trend Identification:
Uses Heikin-Ashi candles for smoother price action analysis.
Helps filter out noise and focus on significant trends.
Ideal for both short-term and long-term trading strategies.
Multi-Timeframe Analysis:
Allows users to select different resolutions for deeper insights.
Ensures compatibility with various trading styles and preferences.
Comprehensive Support and Resistance Calculation:
Computes four distinct levels: Support Level 1, Support Level 2, Resistance Level 1, and Resistance Level 2.
Each level serves as a reference point for potential price reversals or continuations.
Gradient Color Visualization:
Employs a spectrum of colors derived from RSI values to represent support and resistance lines.
Enhances readability and helps traders quickly assess market sentiment 🎨.
Dynamic Labels and Alerts:
Automatically generates buy ('Buy') and sell ('Sell') labels when price crosses key levels.
Provides real-time alerts for crossing events, ensuring traders never miss important signals 🔔.
Customizable Parameters:
Offers adjustable Length and Resolution inputs for tailored performance.
Allows traders to fine-tune the indicator according to their unique needs and strategies.
HOW TO USE
Adding the Indicator:
Open your TradingView chart and navigate to the indicators list.
Search for ' L2 MTF Heikin-Ashi SR Levels' and add it to your chart.
Configuring Settings:
Adjust the Length parameter to determine the period over which calculations are made.
A shorter length increases sensitivity, while a longer length smoothens the output.
Choose a specific Resolution to analyze different timeframes simultaneously.
For example, set it to 'D' for daily charts or 'W' for weekly charts.
Interpreting the Chart:
Observe the plotted support and resistance lines on the chart.
Look for price interactions with these levels to identify potential entry and exit points.
Pay attention to the gradient colors, which reflect underlying market momentum.
Setting Up Alerts:
Configure alerts based on the generated signals to receive instant notifications.
Customize alert messages and conditions to suit your trading plan.
Utilizing Labels:
Use the automatically placed buy and sell labels as quick references for decision-making.
Combine these labels with other technical analyses for confirmation.
Backtesting and Optimization:
Thoroughly test the indicator on historical data to evaluate its performance.
Optimize settings and refine your strategy based on backtest results.
Live Trading:
Apply the indicator to live charts and monitor real-time price movements.
Execute trades based on the generated signals and adjust positions accordingly.
Combining with Other Tools:
Integrate this indicator with other technical tools and fundamental analyses for a holistic approach.
Consider using moving averages, oscillators, or volume indicators alongside L2 MTF Heikin-Ashi SR Levels.
LIMITATIONS
Market Volatility:
In highly volatile or ranging markets, the indicator might produce false signals due to erratic price movements 🌪️.
Traders should exercise caution during such periods and consider additional confirmations.
Timeframe Dependency:
The effectiveness of the indicator can vary significantly depending on the chosen timeframe and asset.
Always validate the indicator's performance across different contexts before relying solely on it.
Over-reliance Risk:
While powerful, no single indicator guarantees success in all market conditions.
Combining this tool with other analytical methods enhances reliability and reduces risk.
NOTES
Data Requirements:
Ensure your chart has enough historical data to perform accurate calculations.
Insufficient data may lead to inaccurate or incomplete results.
Demo Testing:
Before deploying the indicator in live trading, conduct extensive testing on demo accounts.
Familiarize yourself with how the indicator behaves under various market scenarios.
Parameter Tuning:
Experiment with different Length and Resolution settings to find what works best for your trading style.
Regularly review and update parameters as market conditions evolve.
Continuous Learning:
Stay updated with the latest developments in technical analysis and trading strategies.
Adapt your use of the indicator based on new insights and experiences.
THANKS
Additionally, gratitude goes to the broader TradingView community for fostering collaboration and knowledge-sharing among traders worldwide. Together, we strive to elevate our understanding and application of financial markets 🌍💡.
XGBoost Approximation Indicator with HTF Filter Ver. 3.2XGBoost Approx Indicator with Higher Timeframe Filter Ver. 3.2
What It Is
The XGBoost Approx Indicator is a technical analysis tool designed to generate trading signals based on a composite of multiple indicators. It combines Simple Moving Average (SMA), Relative Strength Index (RSI), MACD, Rate of Change (ROC), and Volume to create a composite indicator score. Additionally, it incorporates a higher timeframe filter (HTF) to enhance trend confirmation and reduce false signals.
This indicator helps traders identify long (buy) and short (sell) opportunities based on a weighted combination of trend-following and momentum indicators.
How to Use It Properly
Setup and Configuration:
Add the indicator to your TradingView chart.
Customize input settings based on your trading strategy. Key configurable inputs include:
HTF filter (default: 1-hour)
SMA, RSI, MACD, and ROC lengths
Custom weightings for each component
Thresholds for buy and sell signals
Understanding the Signals:
Green "Long" Label: Appears when the composite indicator crosses above the buy threshold, signaling a potential buy opportunity.
Red "Short" Label: Appears when the composite indicator crosses below the sell threshold, signaling a potential sell opportunity.
These signals are filtered by a higher timeframe SMA trend to improve accuracy.
Alerts:
The indicator provides alert conditions for long and short entries.
Traders can enable alerts in TradingView to receive real-time notifications when a new signal is triggered.
Safety and Best Practices
Use in Conjunction with Other Analysis: Do not rely solely on this indicator. Combine it with price action, support/resistance levels, and fundamental analysis for better decision-making.
Adjust Settings for Your Strategy: The default settings may not suit all markets or timeframes. Test different configurations before trading live.
Backtest Before Using in Live Trading: Evaluate the indicator’s past performance on historical data to assess its effectiveness in different market conditions.
Avoid Overtrading: False signals can occur, especially in low volatility or choppy markets. Use additional confirmation (e.g., trendlines or moving averages).
Risk Management: Always set stop-loss levels and position sizes to limit potential losses.

Supertrend TP SL (PRO)2. Main Components:
Supertrend Indicator:
Theoretical basis: The Supertrend indicator is based on two main concepts: Average True Range (ATR) and Factor. ATR measures the extent of price fluctuations in a given period of time, while Factor determines the sensitivity of the indicator to price changes.
Mechanism of operation: The indicator calculates two possible lines: one line representing the potential support level and another line representing the potential resistance level. The selection of the appropriate line depends on the current price direction. When the price is above the line, the indicator is considered to be in an uptrend, and vice versa.
Customizable inputs:
atrPeriod: Allows the trader to specify the time period for calculating the ATR. Shorter periods make the indicator more sensitive to price changes, while longer periods reduce its sensitivity.
factor: Allows the adjustment of the factor. Higher values make the indicator less likely to give false signals, but they may also delay entry signals.
Risk Management:
Take Profit and Stop Loss Orders:
TPPoints: Specifies the distance between the entry price and the take profit level. This distance is expressed in points, and is converted to an actual price value using syminfo.mintick (the smallest possible price movement of the traded asset).
SLPoints: Specifies the distance between the entry price and the stop loss level.
Importance: These orders allow the trader to specify the maximum loss he is willing to take and the profit target he is aiming to achieve, which helps in effective risk management.
Activate/Disable Trades:
isLongEnabled: Allows buy trades to be enabled or disabled, which allows the trader to trade in one direction only (for example, only trade in the uptrend during a bull market).
isShortEnabled: Allows sell trades to be enabled or disabled.
isTakeProfitEnabled: Allows take profit orders to be enabled or disabled. The trader may wish to disable them if he prefers to manage his trades manually.
isStopLossEnabled: Allows you to enable or disable stop loss orders. Although disabling them may seem tempting in some cases, it is a very risky move.
Visual Customization:
Line Style and Width:
lineStyle: Allows the trader to choose the style of lines used to draw TP and SL levels (Solid, Dashed, Dotted).
lineWidth: Sets the thickness of the lines.
Label Size:
labelSize: Allows you to set the size of the labels that display TP and SL levels (Small, Normal, Large).
Colors:
bullColor, bearColor, tpColor, slColor: Allows the trader to customize the colors of the different elements on the chart, making visual analysis easier.
3. Strategy Logic:
Determining Entry Signals: The strategy relies on the Supertrend indicator to determine entry signals. When the Supertrend trend changes from bearish to bullish, a buy trade is triggered (if isLongEnabled is enabled). When the trend changes from bullish to bearish, a sell trade is triggered (if isShortEnabled is enabled).
Order Execution: Once the entry signal is triggered, the strategy automatically places buy or sell orders.
Trade Management: After opening a trade, the strategy monitors the price and automatically triggers Take Profit and Stop Loss orders if the price reaches the specified levels.
Visualization: The strategy displays useful information on the chart, such as TP and SL lines, entry and exit signals, which helps the trader understand the strategy’s behavior and evaluate its performance.
4. Advanced Tips:
Optimizing Settings: The strategy’s performance can be improved by adjusting different input values. For example, the trader can experiment with different values for atrPeriod and factor to improve the accuracy of Supertrend signals.
Combining Indicators: This strategy can be combined with other indicators to improve the accuracy of entry signals. For example, the Relative Strength Index (RSI) can be used to confirm Supertrend signals.
Time Analysis: The strategy’s performance can be analyzed over different time periods to evaluate its effectiveness in various market conditions.
Strategy Testing: Before using the strategy in real trading, it should be tested on historical data (Backtesting) to evaluate its performance and determine the optimal settings.
5. Associated Risks:
False Signals: The Supertrend indicator may sometimes give false signals, especially in volatile markets.
Losses: Even with the use of stop loss orders, the trader may be exposed to significant losses.
Over-optimization: Over-optimization of settings on historical data may lead to misleading results. The trader should be careful about generalizing the results to future data.
Over-reliance on automation: The automated strategy should not be relied upon completely. The trader should monitor the trades and make appropriate decisions when necessary.
6. Disclaimer:
I am not a licensed financial advisor. This strategy is provided for educational and illustrative purposes only and should not be considered as investment advice. Trading in financial markets involves significant risks and you may lose your invested capital. Before making any investment decisions, consult a qualified financial advisor and conduct your own research. You alone are responsible for your trading decisions and their results. By using this strategy, you acknowledge and agree that I am not responsible for any losses or damages you may incur.
2. المكونات الرئيسية:
مؤشر Supertrend:
الأساس النظري: يعتمد مؤشر Supertrend على مفهومين رئيسيين هما: متوسط المدى الحقيقي (Average True Range - ATR) ومعامل الضرب (Factor). ATR يقيس مدى تقلبات الأسعار في فترة زمنية محددة، بينما Factor يحدد مدى حساسية المؤشر لتغيرات الأسعار.
آلية العمل: يقوم المؤشر بحساب خطين محتملين: خط يمثل مستوى الدعم المحتمل وخط آخر يمثل مستوى المقاومة المحتمل. يعتمد اختيار الخط المناسب على اتجاه السعر الحالي. عندما يكون السعر أعلى من الخط، يعتبر المؤشر في اتجاه صاعد، والعكس صحيح.
المدخلات القابلة للتخصيص:
atrPeriod: يتيح للمتداول تحديد الفترة الزمنية لحساب ATR. الفترات الأقصر تجعل المؤشر أكثر حساسية لتغيرات الأسعار، بينما الفترات الأطول تقلل من حساسيته.
factor: يسمح بتعديل معامل الضرب. القيم الأعلى تجعل المؤشر أقل عرضة لإعطاء إشارات خاطئة، ولكنها قد تؤخر أيضًا إشارات الدخول.
إدارة المخاطر:
أوامر جني الأرباح وإيقاف الخسارة:
TPPoints: يحدد المسافة بين سعر الدخول ومستوى جني الأرباح. يتم التعبير عن هذه المسافة بالنقاط (Points)، ويتم تحويلها إلى قيمة سعرية فعلية باستخدام syminfo.mintick (أصغر حركة سعرية ممكنة للأصل المتداول).
SLPoints: يحدد المسافة بين سعر الدخول ومستوى إيقاف الخسارة.
الأهمية: تتيح هذه الأوامر للمتداول تحديد الحد الأقصى للخسارة التي يرغب في تحملها والهدف الربحي الذي يسعى لتحقيقه، مما يساعد على إدارة المخاطر بشكل فعال.
تفعيل/تعطيل الصفقات:
isLongEnabled: يسمح بتفعيل أو تعطيل صفقات الشراء، مما يمكن المتداول من التداول في اتجاه واحد فقط (على سبيل المثال، التداول فقط في الاتجاه الصاعد خلال سوق صاعدة).
isShortEnabled: يسمح بتفعيل أو تعطيل صفقات البيع.
isTakeProfitEnabled: يسمح بتفعيل أو تعطيل أوامر جني الأرباح. قد يرغب المتداول في تعطيلها إذا كان يفضل إدارة صفقاته يدويًا.
isStopLossEnabled: يسمح بتفعيل أو تعطيل أوامر إيقاف الخسارة. على الرغم من أن تعطيلها قد يبدو مغريًا في بعض الحالات، إلا أنه يعتبر خطوة محفوفة بالمخاطر للغاية.
التخصيص المرئي:
نمط وعرض الخطوط:
lineStyle: يتيح للمتداول اختيار نمط الخطوط المستخدمة لرسم مستويات TP و SL (Solid, Dashed, Dotted).
lineWidth: يحدد سمك الخطوط.
حجم الملصقات:
labelSize: يسمح بتحديد حجم الملصقات التي تعرض مستويات TP و SL (Small, Normal, Large).
الألوان:
bullColor, bearColor, tpColor, slColor: تتيح للمتداول تخصيص ألوان العناصر المختلفة على الرسم البياني، مما يسهل عملية التحليل البصري.
3. منطق عمل الاستراتيجية:
تحديد إشارات الدخول: تعتمد الاستراتيجية على مؤشر Supertrend لتحديد إشارات الدخول. عندما يتغير اتجاه Supertrend من هابط إلى صاعد، يتم تفعيل صفقة شراء (إذا كانت isLongEnabled مفعلة). وعندما يتغير الاتجاه من صاعد إلى هابط، يتم تفعيل صفقة بيع (إذا كانت isShortEnabled مفعلة).
تنفيذ الأوامر: بمجرد تفعيل إشارة الدخول، تقوم الاستراتيجية بوضع أوامر الشراء أو البيع تلقائيًا.
إدارة الصفقات: بعد فتح الصفقة، تقوم الاستراتيجية بمراقبة السعر وتفعيل أوامر جني الأرباح وإيقاف الخسارة تلقائيًا في حالة وصول السعر إلى المستويات المحددة.
التمثيل المرئي: تعرض الاستراتيجية معلومات مفيدة على الرسم البياني، مثل خطوط TP و SL وإشارات الدخول والخروج، مما يساعد المتداول على فهم سلوك الاستراتيجية وتقييم أدائها.
4. نصائح متقدمة:
تحسين الإعدادات: يمكن تحسين أداء الاستراتيجية من خلال تعديل قيم المدخلات المختلفة. على سبيل المثال، يمكن للمتداول تجربة قيم مختلفة لـ atrPeriod و factor لتحسين دقة إشارات Supertrend.
الجمع بين المؤشرات: يمكن دمج هذه الاستراتيجية مع مؤشرات أخرى لتحسين دقة إشارات الدخول. على سبيل المثال، يمكن استخدام مؤشر القوة النسبية (RSI) لتأكيد إشارات Supertrend.
التحليل الزمني: يمكن تحليل أداء الاستراتيجية على مدى فترات زمنية مختلفة لتقييم مدى فعاليتها في ظروف السوق المتنوعة.
اختبار الاستراتيجية: قبل استخدام الاستراتيجية في التداول الحقيقي، يجب اختبارها على بيانات تاريخية (Backtesting) لتقييم أدائها وتحديد الإعدادات المثلى.
5. المخاطر المرتبطة:
الإشارات الخاطئة: قد يعطي مؤشر Supertrend إشارات خاطئة في بعض الأحيان، خاصة في الأسواق المتقلبة.
الخسائر: حتى مع استخدام أوامر إيقاف الخسارة، قد يتعرض المتداول لخسائر كبيرة.
التحسين المفرط: قد يؤدي التحسين المفرط للإعدادات على بيانات تاريخية إلى نتائج مضللة. يجب أن يكون المتداول حذرًا بشأن تعميم النتائج على البيانات المستقبلية.
الاعتماد الزائد على الأتمتة: يجب عدم الاعتماد بشكل كامل على الاستراتيجية الآلية. يجب على المتداول مراقبة الصفقات واتخاذ القرارات المناسبة عند الضرورة.
6. إخلاء المسؤولية:
أنا لست مستشارًا ماليًا مرخصًا. هذه الاستراتيجية مقدمة لأغراض تعليمية وتوضيحية فقط، ولا ينبغي اعتبارها نصيحة استثمارية. التداول في الأسواق المالية ينطوي على مخاطر كبيرة، وقد تخسر رأس المال المستثمر. قبل اتخاذ أي قرارات استثمارية، استشر مستشارًا ماليًا مؤهلاً وقم بإجراء بحثك الخاص. أنت وحدك المسؤول عن قراراتك التجارية ونتائجها. باستخدام هذه الاستراتيجية، فإنك تقر وتوافق على أنني لست مسؤولاً عن أي خسائر أو أضرار قد تتكبدها.

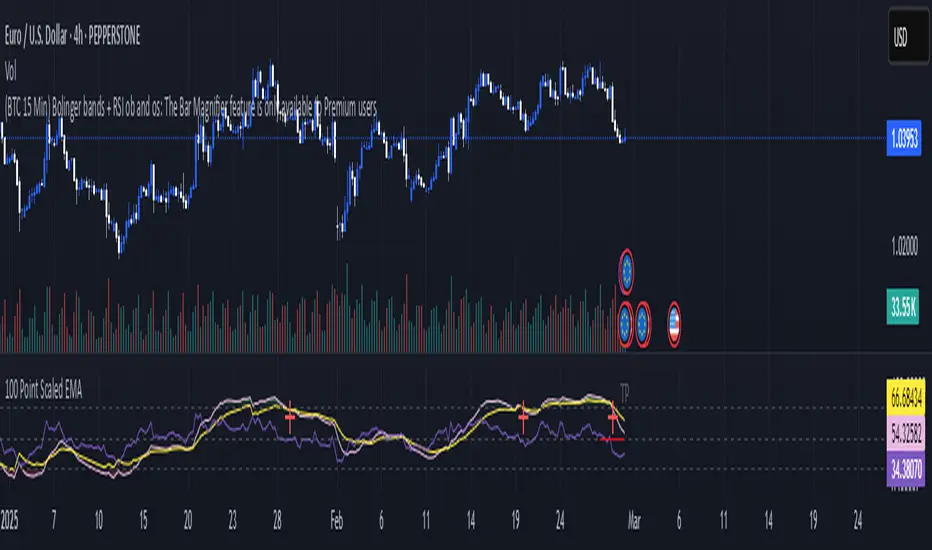
100 Point Scaled EMA100 Point Scaled EMA is a distinctive indicator that standardizes trend analysis by normalizing price data. Here’s a breakdown of its technical features:
Normalized Exponential Moving Averages (EMAs):
Dual EMAs: Configurable lengths (typically 9 and 21) are applied to calculate EMAs.
Scaling Mechanism: The EMAs are normalized to a fixed 0–100 range using the highest and lowest prices over the last 100 bars, enabling consistent analysis regardless of market volatility.
Integrated Relative Strength Index (RSI):
A 14-period RSI is incorporated to provide additional momentum and overbought/oversold insights.
Dynamic Visual Cues:
Gradient Fills: Visual gradients highlight overbought and oversold regions, enhancing the readability of trend shifts.
Crossover Signals:
The script detects EMA crossovers with specific conditions—crossover events occurring below 25 and above 75—to mark potential trade setups.
This technical approach makes the 100 Point Scaled EMA a powerful tool for traders, offering a simple unique and standardized perspective on market trends.
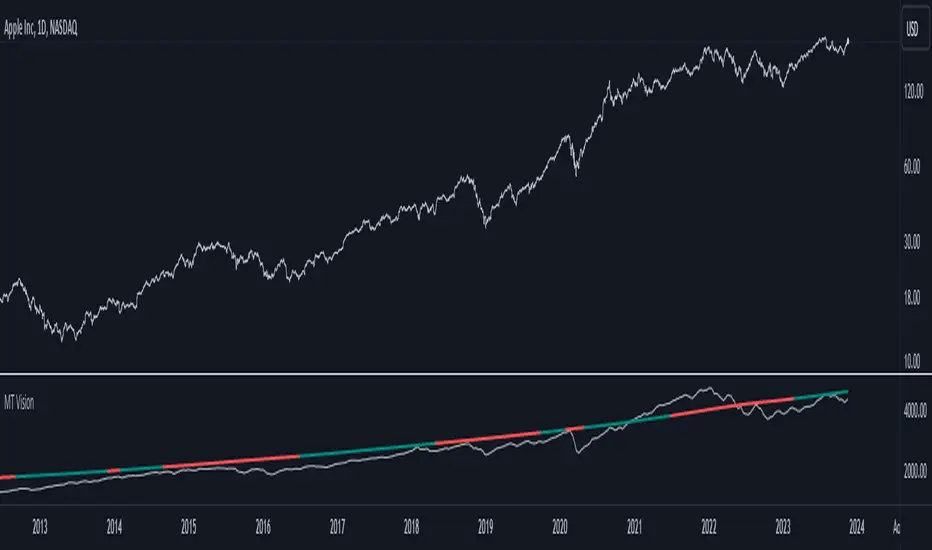
MacroTrend VisionThe "MacroTrend Vision" indicator is crafted with a singular goal – to provide traders with a quick and insightful snapshot of a country's global index. Seamlessly combining macroeconomic and technical perspectives, this tool is designed for those seeking a straightforward yet comprehensive overview. Let's explore the key features that make the "MacroTrend Vision" a valuable asset for traders looking to grasp both the big-picture economic context and technical nuances.
1. Long-Term Vision with Weekly Periods:
Gain a genuine long-term perspective with the ability to process 2500 weekly periods. This feature ensures a holistic understanding of global indices from both macroeconomic and technical viewpoints.
2. Composite Leading Indicator (CLI) Conditions:
Integrate both macroeconomic trends and technical signals through Composite Leading Indicator (CLI) conditions derived from the Relative Strength Index (RSI), offering a comprehensive outlook for informed decision-making.
3. Deviation Bands for Volatility Analysis:
Refine market analysis with strategically integrated deviation bands (0.2 and 0.4) based on smoothed linear regression. Anticipate volatility and potential trend shifts, aligning macro and technical insights.
4. Logarithmic Scale Transformation:
Enhance precision in understanding price movements with a logarithmic scale transformation, especially beneficial for assets with exponential growth patterns.
5. Separated Window for Easy Navigation:
Streamline your analysis with a user-friendly design – a separated window allowing easy navigation through different symbols without altering indicator settings.
6. Alert System for CLI Conditions:
Stay informed about critical shifts with an alert system for both long and close conditions based on the RSI of the CLI. Even during periods of limited chart monitoring, this feature keeps you connected to macroeconomic and technical changes.
In essence, the "MacroTrend Vision" is your go-to tool for a balanced view, simplifying the complexities of global indices with a blend of macroeconomic insights and technical clarity.
Based RSI (BullDozz)Installation: To use this script, open TradingView and create a new Pine Script strategy. You can paste the code provided into the Pine Script editor.
Customizable Inputs: The script includes various input parameters that you can customize to fit your trading preferences. These parameters are defined using the input function and include values like length, TPPercent, and others. You can adjust these values based on your trading strategy.
Strategy Signals: The script generates buy and sell signals based on the conditions specified in the buySignal and sellSignal variables. These signals are derived from the analysis of the oscillator (osc) and the Relative Strength Index (rsi). When a buy signal occurs, the script enters a long position, and when a sell signal occurs, it enters a short position.
Take Profit: The script includes a take profit feature (useTP) that allows you to enable or disable take profit orders. When enabled, it calculates take profit levels based on the specified percent (TPPercent) and attaches them to the open positions.
Plotting: The script also visualizes the oscillator (osc) and a midline (0) on the chart using histogram-style bars. The colors of these bars change based on the oscillator's direction.

ALMA Smoothed Gaussian Moving AverageThis indicator is an altered version of the Gaussian Moving Average (GMA) (Credit to author: © LeafAlgo ). The GMA applies weights to the prices, giving more importance to the values closer to the current period and gradually diminishing the significance of older prices. The ALMA Smoothed Gaussian Moving Average (ASGMA) applies an ALMA smoothing to its price data to minimize lag and provide a more accurate representation of the underlying trend by dynamically adapting to changing market conditions. The Arnaud Legoux Moving Average (ALMA) is a specialized smoothing technique that adjusts the weights of the moving average based on market volatility. Its calculation uses Wavelet Transform techniques which enables this type of smoothing to capture both high-frequency and low-frequency components of a signal or data. The rationale for this mashup between ALMA and Gaussian filtering is to smooth the moving average line over the smoothed price data and produce stronger trend signals.
ASGMA serves as a trend-following indicator, identifying both bullish and bearish trends. It provides buy and sell signals indicated by "B" and "S" labels plotted alongside the price data. Additionally, the ASGMA's Exponential Moving Average (EMA) line alternates between green and red, indicating bullish and bearish momentum, respectively.
The ASGMA also incorporates two popular momentum indicators, the Relative Strength Index (RSI) and the Chande Momentum Oscillator (CMO). The inclusion of these indicators aims to enhance trend identification and reversal signals. For a strong buy signal, all three indicators (RSI, CMO, and ASGMA) must indicate bullish conditions, resulting in a vertical green line. Conversely, a vertical red line is plotted when all indicators indicate bearish conditions, representing a strong sell signal.
The ASGMA, with its unique combination of smoothing techniques and indicator amalgamation, provides traders and investors with powerful analytical tools. It can be applied in trend-following strategies using the regular buy and sell signals generated by labels and the EMA line. Alternatively, the vertical lines offer stronger buy and sell signals. These features aid in identifying potential entry and exit points, thereby enhancing trading decisions and market analysis. However, it is important to remember that the future performance of any trading strategy is fundamentally unknowable, and past results do not guarantee future performance.

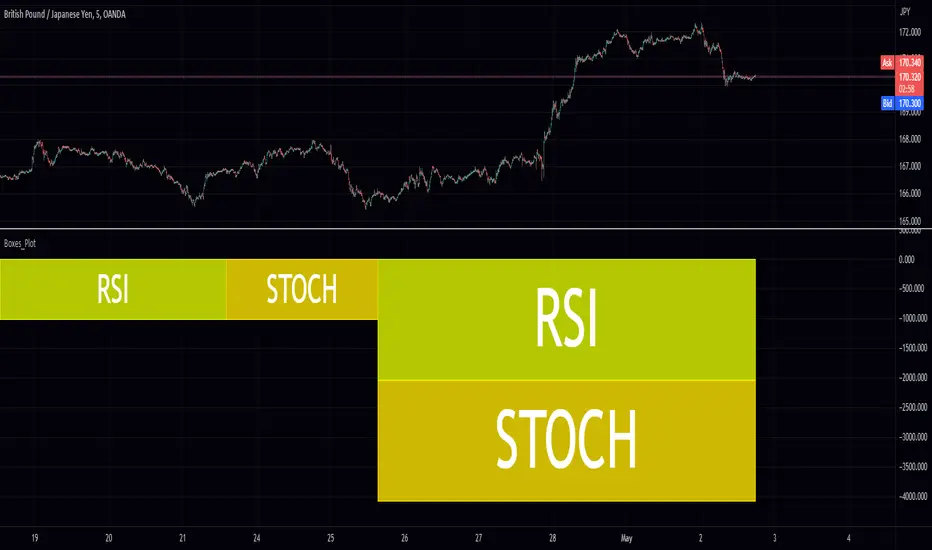
Boxes_PlotIn the world of data visualization, heatmaps are an invaluable tool for understanding complex datasets. They use color gradients to represent the values of individual data points, allowing users to quickly identify patterns, trends, and outliers in their data. In this post, we will delve into the history of heatmaps, and then discuss how its implemented.
The "Boxes_Plot" library is a powerful and versatile tool for visualizing multiple indicators on a trading chart using colored boxes, commonly known as heatmaps. These heatmaps provide a user-friendly and efficient method for analyzing the performance and trends of various indicators simultaneously. The library can be customized to display multiple charts, adjust the number of rows, and set the appropriate offset for proper spacing. This allows traders to gain insights into the market and make informed decisions.
Heatmaps with cells are interesting and useful for several reasons. Firstly, they allow for the visualization of large datasets in a compact and organized manner. This is especially beneficial when working with multiple indicators, as it enables traders to easily compare and contrast their performance. Secondly, heatmaps provide a clear and intuitive representation of the data, making it easier for traders to identify trends and patterns. Finally, heatmaps offer a visually appealing way to present complex information, which can help to engage and maintain the interest of traders.
History of Heatmaps
The concept of heatmaps can be traced back to the 19th century when French cartographer and sociologist Charles Joseph Minard used color gradients to visualize statistical data. He is well-known for his 1869 map, which depicted Napoleon's disastrous Russian campaign of 1812 using a color gradient to represent the dwindling size of Napoleon's army.
In the 20th century, heatmaps gained popularity in the fields of biology and genetics, where they were used to visualize gene expression data. In the early 2000s, heatmaps found their way into the world of finance, where they are now used to display stock market data, such as price, volume, and performance.
The boxes_plot function in the library expects a normalized value from 0 to 100 as input. Normalizing the data ensures that all values are on a consistent scale, making it easier to compare different indicators. The function also allows for easy customization, enabling users to adjust the number of rows displayed, the size of the boxes, and the offset for proper spacing.
One of the key features of the library is its ability to automatically scale the chart to the screen. This ensures that the heatmap remains clear and visible, regardless of the size or resolution of the user's monitor. This functionality is essential for traders who may be using various devices and screen sizes, as it enables them to easily access and interpret the heatmap without needing to make manual adjustments.
In order to create a heatmap using the boxes_plot function, users need to supply several parameters:
1. Source: An array of floating-point values representing the indicator values to display.
2. Name: An array of strings representing the names of the indicators.
3. Boxes_per_row: The number of boxes to display per row.
4. Offset (optional): An integer to offset the boxes horizontally (default: 0).
5. Scale (optional): A floating-point value to scale the size of the boxes (default: 1).
The library also includes a gradient function (grad) that is used to generate the colors for the heatmap. This function is responsible for determining the appropriate color based on the value of the indicator, with higher values typically represented by warmer colors such as red and lower values by cooler colors such as blue.
Implementing Heatmaps as a Pine Script Library
In this section, we'll explore how to create a Pine Script library that can be used to generate heatmaps for various indicators on the TradingView platform. The library utilizes colored boxes to represent the values of multiple indicators, making it simple to visualize complex data.
We'll now go over the key components of the code:
grad(src) function: This function takes an integer input 'src' and returns a color based on a predefined color gradient. The gradient ranges from dark blue (#1500FF) for low values to dark red (#FF0000) for high values.
boxes_plot() function: This is the main function of the library, and it takes the following parameters:
source: an array of floating-point values representing the indicator values to display
name: an array of strings representing the names of the indicators
boxes_per_row: the number of boxes to display per row
offset (optional): an integer to offset the boxes horizontally (default: 0)
scale (optional): a floating-point value to scale the size of the boxes (default: 1)
The function first calculates the screen size and unit size based on the visible chart area. Then, it creates an array of box objects representing each data point. Each box is assigned a color based on the value of the data point using the grad() function. The boxes are then plotted on the chart using the box.new() function.
Example Usage:
In the example provided in the source code, we use the Relative Strength Index (RSI) and the Stochastic Oscillator as the input data for the heatmap. We create two arrays, 'data_1' containing the RSI and Stochastic Oscillator values, and 'data_names_1' containing the names of the indicators. We then call the 'boxes_plot()' function with these arrays, specifying the desired number of boxes per row, offset, and scale.
Conclusion
Heatmaps are a versatile and powerful data visualization tool with a rich history, spanning multiple fields of study. By implementing a heatmap library in Pine Script, we can enhance the capabilities of the TradingView platform, making it easier for users to visualize and understand complex financial data. The provided library can be easily customized and extended to suit various use cases and can be a valuable addition to any trader's toolbox.
Library "Boxes_Plot"
boxes_plot(source, name, boxes_per_row, offset, scale)
Parameters:
source (float ) : - an array of floating-point values representing the indicator values to display
name (string ) : - an array of strings representing the names of the indicators
boxes_per_row (int) : - the number of boxes to display per row
offset (int) : - an optional integer to offset the boxes horizontally (default: 0)
scale (float) : - an optional floating-point value to scale the size of the boxes (default: 1)