Fuzzy SMA Trend Analyzer (experimental)[FibonacciFlux]Fuzzy SMA Trend Analyzer (Normalized): Advanced Market Trend Detection Using Fuzzy Logic Theory
Elevate your technical analysis with institutional-grade fuzzy logic implementation
Research Genesis & Conceptual Framework
This indicator represents the culmination of extensive research into applying fuzzy logic theory to financial markets. While traditional technical indicators often produce binary outcomes, market conditions exist on a continuous spectrum. The Fuzzy SMA Trend Analyzer addresses this limitation by implementing a sophisticated fuzzy logic system that captures the nuanced, multi-dimensional nature of market trends.
Core Fuzzy Logic Principles
At the heart of this indicator lies fuzzy logic theory - a mathematical framework designed to handle imprecision and uncertainty:
// Improved fuzzy_triangle function with guard clauses for NA and invalid parameters.
fuzzy_triangle(val, left, center, right) =>
if na(val) or na(left) or na(center) or na(right) or left > center or center > right // Guard checks
0.0
else if left == center and center == right // Crisp set (single point)
val == center ? 1.0 : 0.0
else if left == center // Left-shoulder shape (ramp down from 1 at center to 0 at right)
val >= right ? 0.0 : val <= center ? 1.0 : (right - val) / (right - center)
else if center == right // Right-shoulder shape (ramp up from 0 at left to 1 at center)
val <= left ? 0.0 : val >= center ? 1.0 : (val - left) / (center - left)
else // Standard triangle
math.max(0.0, math.min((val - left) / (center - left), (right - val) / (right - center)))
This implementation of triangular membership functions enables the indicator to transform crisp numerical values into degrees of membership in linguistic variables like "Large Positive" or "Small Negative," creating a more nuanced representation of market conditions.
Dynamic Percentile Normalization
A critical innovation in this indicator is the implementation of percentile-based normalization for SMA deviation:
// ----- Deviation Scale Estimation using Percentile -----
// Calculate the percentile rank of the *absolute* deviation over the lookback period.
// This gives an estimate of the 'typical maximum' deviation magnitude recently.
diff_abs_percentile = ta.percentile_linear_interpolation(math.abs(raw_diff), normLookback, percRank) + 1e-10
// ----- Normalize the Raw Deviation -----
// Divide the raw deviation by the estimated 'typical max' magnitude.
normalized_diff = raw_diff / diff_abs_percentile
// ----- Clamp the Normalized Deviation -----
normalized_diff_clamped = math.max(-3.0, math.min(3.0, normalized_diff))
This percentile normalization approach creates a self-adapting system that automatically calibrates to different assets and market regimes. Rather than using fixed thresholds, the indicator dynamically adjusts based on recent volatility patterns, significantly enhancing signal quality across diverse market environments.
Multi-Factor Fuzzy Rule System
The indicator implements a comprehensive fuzzy rule system that evaluates multiple technical factors:
SMA Deviation (Normalized): Measures price displacement from the Simple Moving Average
Rate of Change (ROC): Captures price momentum over a specified period
Relative Strength Index (RSI): Assesses overbought/oversold conditions
These factors are processed through a sophisticated fuzzy inference system with linguistic variables:
// ----- 3.1 Fuzzy Sets for Normalized Deviation -----
diffN_LP := fuzzy_triangle(normalized_diff_clamped, 0.7, 1.5, 3.0) // Large Positive (around/above percentile)
diffN_SP := fuzzy_triangle(normalized_diff_clamped, 0.1, 0.5, 0.9) // Small Positive
diffN_NZ := fuzzy_triangle(normalized_diff_clamped, -0.2, 0.0, 0.2) // Near Zero
diffN_SN := fuzzy_triangle(normalized_diff_clamped, -0.9, -0.5, -0.1) // Small Negative
diffN_LN := fuzzy_triangle(normalized_diff_clamped, -3.0, -1.5, -0.7) // Large Negative (around/below percentile)
// ----- 3.2 Fuzzy Sets for ROC -----
roc_HN := fuzzy_triangle(roc_val, -8.0, -5.0, -2.0)
roc_WN := fuzzy_triangle(roc_val, -3.0, -1.0, -0.1)
roc_NZ := fuzzy_triangle(roc_val, -0.3, 0.0, 0.3)
roc_WP := fuzzy_triangle(roc_val, 0.1, 1.0, 3.0)
roc_HP := fuzzy_triangle(roc_val, 2.0, 5.0, 8.0)
// ----- 3.3 Fuzzy Sets for RSI -----
rsi_L := fuzzy_triangle(rsi_val, 0.0, 25.0, 40.0)
rsi_M := fuzzy_triangle(rsi_val, 35.0, 50.0, 65.0)
rsi_H := fuzzy_triangle(rsi_val, 60.0, 75.0, 100.0)
Advanced Fuzzy Inference Rules
The indicator employs a comprehensive set of fuzzy rules that encode expert knowledge about market behavior:
// --- Fuzzy Rules using Normalized Deviation (diffN_*) ---
cond1 = math.min(diffN_LP, roc_HP, math.max(rsi_M, rsi_H)) // Strong Bullish: Large pos dev, strong pos roc, rsi ok
strength_SB := math.max(strength_SB, cond1)
cond2 = math.min(diffN_SP, roc_WP, rsi_M) // Weak Bullish: Small pos dev, weak pos roc, rsi mid
strength_WB := math.max(strength_WB, cond2)
cond3 = math.min(diffN_SP, roc_NZ, rsi_H) // Weakening Bullish: Small pos dev, flat roc, rsi high
strength_N := math.max(strength_N, cond3 * 0.6) // More neutral
strength_WB := math.max(strength_WB, cond3 * 0.2) // Less weak bullish
This rule system evaluates multiple conditions simultaneously, weighting them by their degree of membership to produce a comprehensive trend assessment. The rules are designed to identify various market conditions including strong trends, weakening trends, potential reversals, and neutral consolidations.
Defuzzification Process
The final step transforms the fuzzy result back into a crisp numerical value representing the overall trend strength:
// --- Step 6: Defuzzification ---
denominator = strength_SB + strength_WB + strength_N + strength_WBe + strength_SBe
if denominator > 1e-10 // Use small epsilon instead of != 0.0 for float comparison
fuzzyTrendScore := (strength_SB * STRONG_BULL +
strength_WB * WEAK_BULL +
strength_N * NEUTRAL +
strength_WBe * WEAK_BEAR +
strength_SBe * STRONG_BEAR) / denominator
The resulting FuzzyTrendScore ranges from -1 (strong bearish) to +1 (strong bullish), providing a smooth, continuous evaluation of market conditions that avoids the abrupt signal changes common in traditional indicators.
Advanced Visualization with Rainbow Gradient
The indicator incorporates sophisticated visualization using a rainbow gradient coloring system:
// Normalize score to for gradient function
normalizedScore = na(fuzzyTrendScore) ? 0.5 : math.max(0.0, math.min(1.0, (fuzzyTrendScore + 1) / 2))
// Get the color based on gradient setting and normalized score
final_color = get_gradient(normalizedScore, gradient_type)
This color-coding system provides intuitive visual feedback, with color intensity reflecting trend strength and direction. The gradient can be customized between Red-to-Green or Red-to-Blue configurations based on user preference.
Practical Applications
The Fuzzy SMA Trend Analyzer excels in several key applications:
Trend Identification: Precisely identifies market trend direction and strength with nuanced gradation
Market Regime Detection: Distinguishes between trending markets and consolidation phases
Divergence Analysis: Highlights potential reversals when price action and fuzzy trend score diverge
Filter for Trading Systems: Provides high-quality trend filtering for other trading strategies
Risk Management: Offers early warning of potential trend weakening or reversal
Parameter Customization
The indicator offers extensive customization options:
SMA Length: Adjusts the baseline moving average period
ROC Length: Controls momentum sensitivity
RSI Length: Configures overbought/oversold sensitivity
Normalization Lookback: Determines the adaptive calculation window for percentile normalization
Percentile Rank: Sets the statistical threshold for deviation normalization
Gradient Type: Selects the preferred color scheme for visualization
These parameters enable fine-tuning to specific market conditions, trading styles, and timeframes.
Acknowledgments
The rainbow gradient visualization component draws inspiration from LuxAlgo's "Rainbow Adaptive RSI" (used under CC BY-NC-SA 4.0 license). This implementation of fuzzy logic in technical analysis builds upon Fermi estimation principles to overcome the inherent limitations of crisp binary indicators.
This indicator is shared under Attribution-NonCommercial-ShareAlike 4.0 International (CC BY-NC-SA 4.0) license.
Remember that past performance does not guarantee future results. Always conduct thorough testing before implementing any technical indicator in live trading.
Cari dalam skrip untuk "Relative Strength Index (RSI)"

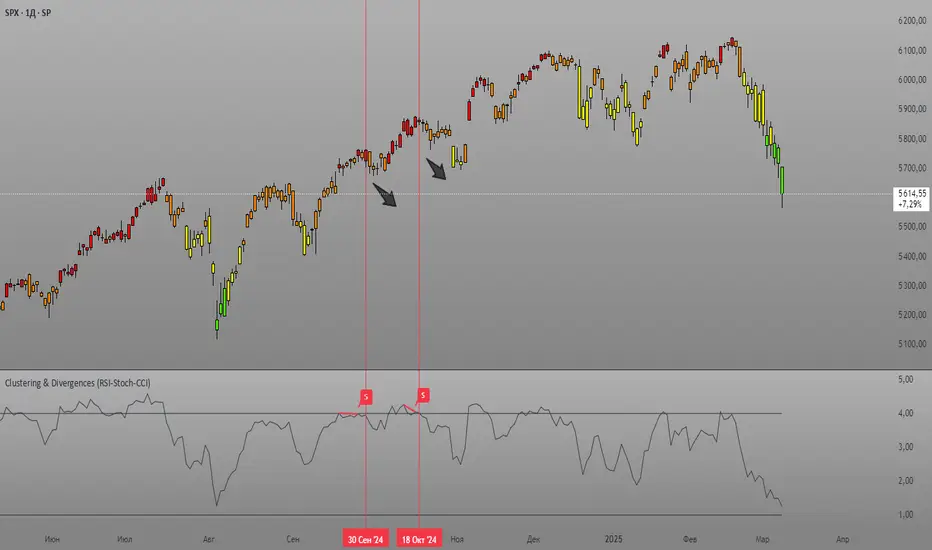
Clustering & Divergences (RSI-Stoch-CCI) [Sam SDF-Solutions]The Clustering & Divergences (RSI-Stoch-CCI) indicator is a comprehensive technical analysis tool that consolidates three popular oscillators—Relative Strength Index (RSI), Stochastic, and Commodity Channel Index (CCI)—into one unified metric called the Score. This Score offers traders an aggregated view of market conditions, allowing them to quickly identify whether the market is oversold, balanced, or overbought.
Functionality:
Oscillator Clustering: The indicator calculates the values of RSI, Stochastic, and CCI using user-defined periods. These oscillator values are then normalized using one of three available methods: MinMax, Z-Score, or Z-Bins.
Score Calculation: Each normalized oscillator value is multiplied by its respective weight (which the user can adjust), and the weighted values are summed to generate an overall Score. This Score serves as a single, interpretable metric representing the combined oscillator behavior.
Market Clustering: The indicator performs clustering on the Score over a configurable window. By dividing the Score range into a set number of clusters (also configurable), the tool visually represents the market’s state. Each cluster is assigned a unique color so that traders can quickly see if the market is trending toward oversold, balanced, or overbought conditions.
Divergence Detection: The script automatically identifies both Regular and Hidden divergences between the price action and the Score. By using pivot detection on both price and Score data, the indicator marks potential reversal signals on the chart with labels and connecting lines. This helps in pinpointing moments when the price and the underlying oscillator dynamics diverge.
Customization Options: Users have full control over the indicator’s behavior. They can adjust:
The periods for each oscillator (RSI, Stochastic, CCI).
The weights applied to each oscillator in the Score calculation.
The normalization method and its manual boundaries.
The number of clusters and whether to invert the cluster order.
Parameters for divergence detection (such as pivot sensitivity and the minimum/maximum bar distance between pivots).
Visual Enhancements:
Depending on the user’s preference, either the Score or the Cluster Index (derived from the clustering process) is plotted on the chart. Additionally, the script changes the color of the price bars based on the identified cluster, providing an at-a-glance visual cue of the current market regime.
Logic & Methodology:
Input Parameters: The script starts by accepting user inputs for clustering settings, oscillator periods, weights, divergence detection, and manual boundary definitions for normalization.
Oscillator Calculation & Normalization: It computes RSI, Stochastic, and CCI values from the price data. These values are then normalized using either the MinMax method (scaling between a lower and upper band) or the Z-Score method (standardizing based on mean and standard deviation), or using Z-Bins for an alternative scaling approach.
Score Computation: Each normalized oscillator is multiplied by its corresponding weight. The sum of these products results in the overall Score that represents the combined oscillator behavior.
Clustering Algorithm: The Score is evaluated over a moving window to determine its minimum and maximum values. Using these values, the script calculates a cluster index that divides the Score into a predefined number of clusters. An option to invert the cluster calculation is provided to adjust the interpretation of the clustering.
Divergence Analysis: The indicator employs pivot detection (using left and right bar parameters) on both the price and the Score. It then compares recent pivot values to detect regular and hidden divergences. When a divergence is found, the script plots labels and optional connecting lines to highlight these key moments on the chart.
Plotting: Finally, based on the user’s selection, the indicator plots either the Score or the Cluster Index. It also overlays manual boundary lines (for the chosen normalization method) and adjusts the bar colors according to the cluster to provide clear visual feedback on market conditions.
_________
By integrating multiple oscillator signals into one cohesive tool, the Clustering & Divergences (RSI-Stoch-CCI) indicator helps traders minimize subjective analysis. Its dynamic clustering and automated divergence detection provide a streamlined method for assessing market conditions and potentially enhancing the accuracy of trading decisions.
For further details on using this indicator, please refer to the guide available at:
RSI & EMA IndicatorMulti-Timeframe EMA & RSI Analysis with Trend Merging Detection
Overview
This script provides traders with a multi-timeframe analysis tool that simplifies trend detection, momentum confirmation, and potential trend shifts. It integrates Exponential Moving Averages (EMAs) and the Relative Strength Index (RSI) across Daily, Weekly, and Monthly timeframes, helping traders assess both long-term and short-term market conditions at a glance.
This script is a simplification and modification of the EMA Cheatsheet by MarketMoves, reducing chart clutter while adding EMA merging detection to highlight potential trend reversals or breakouts.
Originality and Usefulness
Unlike traditional indicators, which focus on a single timeframe, this script combines multiple timeframes in a single view to offer a comprehensive market outlook.
What Makes This Indicator Unique?
This Indicator to Combine RSI and EMA Clouds for Multiple Timeframes
Multi-Timeframe Trend Analysis in One Visual Tool
EMA Merging Detection to Spot Trend Shifts Early
Momentum Validation Using RSI Across Daily, Weekly, and Monthly Timeframes
Reduces Chart Clutter While Providing Actionable Trade Signals
I couldn't find a TradingView indicator that displayed RSI and EMA clouds together across Daily, Weekly, and Monthly timeframes. This tool bridges that gap, allowing traders to see trend strength and momentum shifts across key timeframes without switching charts.
How the Script Works
1. Trend Direction via EMAs
The script tracks Short-term (5 & 12-period), Medium-term (34 & 50-period), and Long-term (72 & 89-period) EMAs across Daily, Weekly, and Monthly timeframes.
Bullish trend: When faster EMAs are above slower EMAs.
Bearish trend: When faster EMAs are below slower EMAs.
A visual table simplifies trend recognition with:
Green cells for bullish alignment.
Red cells for bearish alignment.
This color-coded system allows traders to quickly assess market momentum across different timeframes without excessive manual analysis.
2. Momentum Confirmation with RSI
The RSI(14) values for Daily, Weekly, and Monthly timeframes are displayed alongside the EMAs.
RSI above 70 suggests overbought conditions.
RSI below 30 suggests oversold conditions.
By combining RSI with EMA trends, traders can confirm whether momentum supports the trend direction or if the market is losing strength.
3. Trend Shift Detection (EMA Merging Mechanism)
A unique feature of this script is EMA merging detection, which occurs when:
The short, medium, and long-term EMAs come within 0.5% of the price.
This often signals trend reversals, breakouts, or consolidations.
When this condition is met, a warning signal appears, alerting traders to potential market shifts.
Who This Indicator Is For?
This script is designed for traders who want to track trends across multiple timeframes while keeping a clean and simplified chart.
Swing & Position Traders – Identify strong trends and potential momentum shifts for longer-term trades.
Trend Followers – Stay aligned with major market trends and avoid trading against momentum.
Day Traders – Use the Daily timeframe for entries while referencing higher timeframes for confirmation.
How to Use the Indicator
Add the indicator to any chart.
Check the trend table in the top-right corner:
Green cells indicate a bullish trend.
Red cells indicate a bearish trend.
Look at RSI values to confirm momentum:
RSI above 70 = Overbought.
RSI below 30 = Oversold.
Watch for the "Merge" alert to spot potential reversals or consolidations.
Combine signals from multiple timeframes for stronger trade decisions.
Why This Indicator is Unique on TradingView?
Before this script, no TradingView indicator displayed RSI and EMA clouds together across multiple timeframes (Daily, Weekly, Monthly).
This tool eliminates the need to:
Manually check multiple timeframes for trend alignment.
Add multiple EMA and RSI indicators to the same chart, creating clutter.
Constantly switch between different timeframes to confirm momentum and trend direction.
With this indicator, traders can see trend strength and momentum shifts instantly, improving their decision-making process.
Chart Guidelines
The script is designed for use on a clean chart to maximize clarity.
The trend alignment table is displayed in a non-intrusive manner so traders can focus on price action.
No additional indicators are required, but users may combine this script with volume-based indicators for further confirmation.
The script name and timeframe should always be visible on published charts to help traders understand the analysis.
Final Notes
This script is a simplification and modification of the EMA Cheatsheet by MarketMoves, improving trend detection, momentum confirmation, and EMA merging detection.
It is designed to help traders quickly identify trend direction, confirm momentum, and detect potential trend shifts, reducing the need for excessive manual analysis.
Disclaimer: This indicator is for educational purposes only and does not constitute financial advice. Trading involves risk; always use proper risk management when applying this tool in live markets.

Uptrick: Zero Lag HMA Trend Suite1. Name and Purpose
Uptrick: Zero Lag HMA Trend Suite is a Pine Version 6 script that builds upon the Hull Moving Average (HMA) to offer an advanced trend analysis tool. Its purpose is to help traders identify trend direction, potential reversals, and overall market momentum with reduced lag compared to traditional moving averages. By combining the HMA with Average True Range (ATR) thresholds, slope-dependent coloring, Volume Weighted Average Price (VWAP) ribbons, and optional reversal signals, the script aims to give a detailed view of price activity in various market environments.
2. Overview
This script begins with the calculation of a Hull Moving Average, a method that blends Weighted Moving Averages in a way designed to cut down on lag while still smoothing out price fluctuations. Next, several enhancements are applied. The script compares current HMA values to previous ones for slope-based coloring, which highlights uptrends and downtrends at a glance. It also plots buy and sell signals when price moves beyond or below thresholds determined by the ATR and the user’s chosen signal multiplier. An optional VWAP ribbon can be shown to confirm bullish or bearish conditions relative to a volume-weighted benchmark. Additionally, the script can plot reversal signals (labeled with B) at points where price crosses back toward the HMA from above or below. Taken together, these elements allow traders to visualize both the short-term momentum and the broader context of how price interacts with volatility and overall market direction.
3. Why These Indicators Have Been Linked Together
The reason the Hull Moving Average, the Average True Range, and the VWAP have been integrated into one script is to tackle multiple facets of market analysis in a single tool. The Zero Lag Hull Moving Average provides a responsive trend line, the ATR offers a measure of volatility that helps distinguish significant price shifts from typical fluctuations, and the VWAP acts as a reference for fair value based on traded volume. By layering all three, the script helps traders avoid the need to juggle multiple separate indicators and offers a holistic perspective. The slope-based coloring focuses on trend direction, the ATR-based thresholds refine possible buy and sell zones, and the VWAP ribbons provide insight into how price stands relative to an important volume-weighted level. The inclusion of up and down signals and reversal B labels further refines entries and exits.
4. Why Use Uptrick: Zero Lag HMA Trend Suite
The Hull Moving Average is already known for reacting more quickly to price changes compared to other moving averages while retaining a degree of smoothness. This suite enhances the basic HMA by showing colored gradients that make it easy to spot trend direction changes, highlighting potential entry or exit points based on volatility-driven thresholds, and optionally layering a volume-based measure of bullish or bearish market sentiment. By relying on a zero lag approach and additional data points, the script caters to those wanting a more responsive method of identifying shifts in market dynamics. The added reversal signals and up or down alerts give traders extra confirmation for potential turning points.
5. How This Extension Improves on the Basic HMA
This extension not only plots the Hull Moving Average but also includes data-driven alerts and visual cues that traditional HMA lines do not provide. First, it offers multi-layered slope coloring, making up or down trends quickly apparent. Second, it uses ATR-based thresholds to pinpoint moments when price may be extending beyond normal volatility, thus generating buy or sell signals. Third, the script introduces an optional VWAP ribbon to indicate whether the market is trading above or below this pivotal volume-weighted benchmark, adding a further confirmation step for bullish or bearish conditions. Finally, it incorporates optional reversal signals labeled with B, indicating points where price might swing back toward the main HMA line.
6. Core Components
The script can be broken down into several primary functions and features.
a. Zero Lag HMA Calculation
Uses two Weighted Moving Averages (half-length and full-length) combined through a smoothing step based on the square root of the chosen length. This approach is designed to reduce lag significantly compared to other moving averages.
b. Slope Detection
Compares current and prior HMA values to determine if the trend is up or down. The slope-based coloring changes between turquoise shades for upward movement and magenta shades for downward movement, making trend direction immediately visible.
c. ATR-Based Thresholding for Up and Down Signals
The script calculates an Average True Range over a user-defined period, then multiplies it by a signal factor to form two bands around the HMA. When price crosses below the lower band, an up (buy) signal appears; when it crosses above the upper band, a down (sell) signal is shown.
d. Reversal Signals (B Labels)
Tracks when price transitions back toward the main HMA from an extreme zone. When enabled, these reversal points are labeled with a B and can help traders see potential turning points or mean-reversion setups.
e. VWAP Bands
An optional Volume Weighted Average Price ribbon that plots above or below the HMA, indicating bullish or bearish conditions relative to a volume-weighted price benchmark. This can also act as a kind of support/ resistance.
7. User Inputs
a. HMA Length
Controls how quickly the moving average responds to price changes. Shorter lengths react faster but can lead to more frequent signals, whereas longer lengths produce smoother lines.
b. Source
Specifies the price input, such as close or an alternative source, for the calculation. This can help align the HMA with specific trading strategies.
c. ATR Length and Signal Multiplier
Defines how the script calculates average volatility and sets thresholds for buy or sell alerts. Adjusting these values can help filter out noise or highlight more aggressive signals.
d. Slope Index
Determines how many bars to look back for detecting slope direction, influencing how sensitive the slope coloring is to small fluctuations.
e. Show Buy and Sell Signals, Reversal Signals, and VWAP
Lets users toggle the display of these features. Turning off certain elements can reduce chart clutter if traders prefer a simpler layout.
8. Calculation Process
The script’s calculation follows a step-by-step approach. It first computes two Weighted Moving Averages of the selected price source, one over half the specified length and one over the full length. It then combines these using 2*wma1 minus wma2 to reduce lag, followed by applying another weighted average using the square root of the length. Simultaneously, it computes the ATR for a user-defined period. By multiplying ATR by the signal multiplier, it establishes upper and lower bands around the HMA, where crossovers generate buy (up) or sell (down) signals. The script can also plot reversal signals (B labels) when price crosses back from these bands in the opposite direction. For the optional VWAP feature, Pine Script’s ta.vwap function is used, and differences between the HMA and VWAP levels determine the color and opacity of the ribbon.
9. Signal Generation and Filtering
The ATR-based thresholds reduce the influence of small, inconsequential price swings. When price falls below the lower band, the script issues an up (buy) signal. If price breaks above the upper band, a down (sell) signal appears. These signals are visible through labels placed near the bars. Reversal signals, labeled with B, can be turned on to help detect when price retraces from an extended area back toward the main HMA line. Traders can disable or enable these signals to match their preferred level of chart detail or risk tolerance.
10. Visualization on the Chart
The Zero HMA Lag Trend Suite aims for visual clarity. The HMA line is plotted multiple times with increasing transparency to create a gradient effect. Turquoise gradients indicate upward slopes, and magenta gradients signify downward slopes. Bar coloring can be configured to align with the slope direction, providing quick insight into current momentum. When enabled, buy or sell labels are placed under or above the bars as price crosses the ATR-defined boundaries. If the reversal option is active, B labels appear around areas where price changes direction. The optional VWAP ribbons form background bands, using distinct coloration to signal whether price is above or below the volume-weighted metric.
11. Market Adaptability
Because the script’s parameters (HMA length, ATR length, signal multiplier, and slope index) are user-configurable, it can adapt to a wide range of markets and timeframes. Intraday traders may prefer a shorter HMA length for quick signals, while swing or position traders might use a longer HMA length to filter out short-lived price changes. The source setting can also be adjusted, allowing for specialized data inputs beyond just close or open values.
12. Risk Management Considerations
The script’s signals and labels are based on past price data and volatility readings, and they do not guarantee profitable outcomes. Sharp market reversals or unforeseen fundamental events can produce false signals. Traders should combine this tool with broader risk management strategies, including stop-loss placement, position sizing, and independent market analyses. The Zero HMA Lag Trend Suite can help highlight potential opportunities, but it should not be relied upon as the sole basis for trade decisions.
13. Combining with Other Tools
Many traders choose to verify signals from the Zero HMA Lag Trend Suite using popular indicators like the Relative Strength Index (RSI), Moving Average Convergence Divergence (MACD), or even simple volume-based metrics to confirm whether a price movement has sufficient momentum. Conventional techniques such as support and resistance levels, chart patterns, or candlestick analysis can also supplement signals generated by the script’s up, down, or reversal B labels.
14. Parameter Customization and Examples
a. Short-Term Day Trading
Using a shorter HMA length (for instance, 9 or 14) and a slightly higher ATR multiplier might provide timely buy and sell signals, though it may also produce more whipsaws in choppy markets.
b. Swing or Position Trading
Selecting a longer HMA length (such as 50 or 100) with a moderate ATR multiplier can help users track more significant and sustained market moves, potentially reducing the effect of minor fluctuations.
c. Multiple Timeframe Blends
Some traders load two versions of the indicator on the same chart, one for short-term signals (with frequent B label reversals) and another for the broader trend direction, aligning entry and exit decisions with the bigger picture.
15. Realistic Expectations
Even though the Hull Moving Average helps minimize lag and the script incorporates volatility-based filters and optional VWAP overlays, it cannot predict future market behavior with complete accuracy. Periods of low liquidity or sudden market shocks can still lead to signals that do not reflect longer-term trends. Frequent parameter review and manual confirmation are advised before executing trades based solely on the script’s outputs.
16. Theoretical Background
The Hull Moving Average formula aims to balance smoothness with reactivity, accomplished by combining Weighted Moving Averages at varying lengths. By subtracting a slower average from a faster one and then applying another smoothing step with the square root of the original length, the HMA is designed to respond more promptly to price changes than typical exponential or simple moving averages. The ATR component, introduced by J. Welles Wilder, calculates the average range of price movement over a user-defined period, allowing the script to assess volatility and adapt signals accordingly. VWAP provides a volume-weighted benchmark that many institutional traders track to gauge fair intraday value.
17. Originality and Uniqueness
Although multiple HMA-based indicators can be found, Uptrick: Zero Lag HMA Trend Suite sets itself apart by merging slope-based coloring, ATR thresholds, VWAP ribbons, up or down labels, and optional reversal signals all in one cohesive platform. This synergy aims to reduce chart clutter while still giving traders a comprehensive look at trend direction, volatility, and volume-based sentiment.
18. Summary
Uptrick: Zero Lag HMA Trend Suite is a specialized trading script designed to highlight potential market trends and reversals with minimal delay. It leverages the Hull Moving Average for an adaptive yet smooth price line, pairs ATR-based thresholds for detecting possible breakouts or dips, and provides VWAP-based ribbons for added volume-weighted context. Traders can further refine their entries and exits by enabling up or down signals and reversal labels (B) where price may revert toward the HMA. Suitable for a wide range of timeframes and instrument types, the script encourages a disciplined approach to trade management and risk control.
19. Disclaimer
This script is provided for informational and educational purposes only. Trading and investing involve significant financial risk, and no indicator can guarantee success under all conditions. Users should practice robust risk management, including the placement of stop losses and position sizing, and should confirm signals with additional analysis tools. The developer of this script assumes no liability for any trading decisions or outcomes resulting from its use.

NVOL Normalized Volume & VolatilityOVERVIEW
Plots a normalized volume (or volatility) relative to a given bar's typical value across all charted sessions. The concept is similar to Relative Volume (RVOL) and Average True Range (ATR), but rather than using a moving average, this script uses bar data from previous sessions to more accurately separate what's normal from what's anomalous. Compatible on all timeframes and symbols.
Having volume and volatility processed within a single indicator not only allows you to toggle between the two for a consistent data display, it also allows you to measure how correlated they are. These measurements are available in the data table.
DATA & MATH
The core formula used to normalize each bar is:
( Value / Basis ) × Scale
Value
The current bar's volume or volatility (see INPUTS section). When set to volume, it's exactly what you would expect (the volume of the bar). When set to volatility, it's the bar's range (high - low).
Basis
A statistical threshold (Mean, Median, or Q3) plus a Sigma multiple (standard deviations). The default is set to the Mean + Sigma × 3 , which represents 99.7% of data in a normal distribution. The values are derived from the current bar's equivalent in other sessions. For example, if the current bar time is 9:30 AM, all previous 9:30 AM bars would be used to get the Mean and Sigma. Thus Mean + Sigma × 3 would represent the Normal Bar Vol at 9:30 AM.
Scale
Depends on the Normalize setting, where it is 1 when set to Ratio, and 100 when set to Percent. This simply determines the plot's scale (ie. 0 to 1 vs. 0 to 100).
INPUTS
While the default configuration is recommended for a majority of use cases (see BEST PRACTICES), settings should be adjusted so most of the Normalized Plot and Linear Regression are below the Signal Zone. Only the most extreme values should exceed this area.
Normalize
Allows you to specify what should be normalized (Volume or Volatility) and how it should be measured (as a Ratio or Percentage). This sets the value and scale in the core formula.
Basis
Specifies the statistical threshold (Mean, Median, or Q3) and how many standard deviations should be added to it (Sigma). This is the basis in the core formula.
Mean is the sum of values divided by the quantity of values. It's what most people think of when they say "average."
Median is the middle value, where 50% of the data will be lower and 50% will be higher.
Q3 is short for Third Quartile, where 75% of the data will be lower and 25% will be higher (think three quarters).
Sample
Determines the maximum sample size.
All Charted Bars is the default and recommended option, and ignores the adjacent lookback number.
Lookback is not recommended, but it is available for comparisons. It uses the adjacent lookback number and is likely to produce unreliable results outside a very specific context that is not suitable for most traders. Normalization is not a moving average. Unless you have a good reason to limit the sample size, do not use this option and instead use All Charted Bars .
Show Vol. name on plot
Overlays "VOLUME" or "VOLATILITY" on the plot (whichever you've selected).
Lin. Reg.
Polynomial regressions are great for capturing non-linear patterns in data. TradingView offers a "linear regression curve", which this script uses as a substitute. If you're unfamiliar with either term, think of this like a better moving average.
You're able to specify the color, length, and multiple (how much to amplify the value). The linear regression derives its value from the normalized values.
Norm. Val.
This is the color of the normalized value of the current bar (see DATA & MATH section). You're able to specify the default, within signal, and beyond signal colors. As well as the plot style.
Fade in colors between zero and the signal
Programmatically adjust the opacity of the primary plot color based on it's normalized value. When enabled, values equal to 0 will be fully transparent, become more opaque as they move away from 0, and be fully opaque at the signal. Adjusting opacity in this way helps make difference more obvious.
Plot relative to bar direction
If enabled, the normalized value will be multiplied by -1 when a bar's open is greater than the bar's close, mirroring price direction.
Technically volume and volatility are directionless. Meaning there's really no such thing as buy volume, sell volume, positive volatility, or negative volatility. There is just volume (1 buy = 1 sell = 1 volume) and volatility (high - low). Even so, visually reflecting the net effect of pricing pressure can still be useful. That's all this setting does.
Sig. Zone
Signal zones make identifying extremes easier. They do not signal if you should buy or sell, only that the current measurement is beyond what's normal. You are able to adjust the color and bounds of the zone.
Int. Levels
Interim levels can be useful when you want to visually bracket values into high / medium / low. These levels can have a value anywhere between 0 and 1. They will automatically be multiplied by 100 when the scale is set to Percent.
Zero Line
This setting allows you to specify the visibility of the zero line to best suit your trading style.
Volume & Volatility Stats
Displays a table of core values for both volume and volatility. Specifically the actual value, threshold (mean, median, or Q3), sigma (standard deviation), basis, normalized value, and linear regression.
Correlation Stats
Displays a table of correlation statistics for the current bar, as well as the data set average. Specifically the coefficient, R2, and P-Value.
Indices & Sample Size
Displays a table of mixed data. Specifically the current bar's index within the session, the current bar's index within the sample, and the sample size used to normalize the current bar's value.
BEST PRACTICES
NVOL can tell you what's normal for 9:30 AM. RVOL and ATR can only tell you if the current value is higher or lower than a moving average.
In a normal distribution (bell curve) 99.7% of data occurs within 3 standard deviations of the mean. This is why the default basis is set to "Mean, 3"; it includes the typical day-to-day fluctuations, better contextualizing what's actually normal, minimizing false positives.
This means a ratio value greater than 1 only occurs 0.3% of the time. A series of these values warrants your attention. Which is why the default signal zone is between 1 and 2. Ratios beyond 2 would be considered extreme with the default settings.
Inversely, ratio values less than 1 (the normal daily fluctuations) also tell a story. We should expect most values to occur around the middle 3rd, which is why interim levels default to 0.33 and 0.66, visually simplifying a given move's participation. These can be set to whatever you like and only serve as visual aids for your specific trading style.
It's worth noting that the linear regression oscillates when plotted directionally, which can help clarify short term move exhaustion and continuation. Akin to a relative strength index (RSI), it may be used to inform a trading decision, but it should not be the only factor.

Bewakoof stock indicator**Title**: "Bewakoof Stock Indicator: Multi-Timeframe RSI and SuperTrend Entry-Exit System"
---
### Description
The **Bewakoof Stock Indicator** is an original trading tool that combines multi-timeframe RSI analysis with the SuperTrend indicator to create reliable entry and exit signals for trending markets. This indicator is designed for traders looking to follow strong trends with built-in risk management. By filtering entries through short- and long-term momentum and utilizing dynamic trailing exits, this indicator provides a structured approach to trading.
#### Indicator Components
1. **Multi-Timeframe RSI Analysis**:
- The Relative Strength Index (RSI) is calculated across three timeframes: Daily, Weekly, and Monthly.
- By examining multiple timeframes, the indicator confirms that trends align over short, medium, and long-term intervals, making buy signals more reliable.
- **Buy Condition**: All three RSI values must meet these thresholds:
- **Daily RSI > 50** – indicates short-term upward momentum,
- **Weekly RSI > 60** – signals medium-term strength,
- **Monthly RSI > 60** – confirms long-term trend alignment.
- This filtering process ensures that buy signals are generated only in stable, upward-trending markets.
2. **SuperTrend Confirmation**:
- The SuperTrend (20-period ATR with a multiplier of 2) acts as a trend filter and trailing stop mechanism.
- For a buy condition to be valid, the closing price must be above the SuperTrend level, verifying that the market is trending up.
- The combination of RSI and SuperTrend helps to avoid false signals, focusing only on well-established trends.
#### Trade Signals
- **Buy Signal**: When both the multi-timeframe RSI and SuperTrend conditions are met, a buy signal is triggered, indicated by a “BUY” label on the chart with details:
- **Entry Price**,
- **Initial Stop-Loss** (set at the SuperTrend level for risk control),
- **Target 1** – calculated with a 1:1 risk-reward ratio based on the initial stop-loss,
- **Target 2** – calculated with a 1:2 risk-reward ratio based on the initial stop-loss.
- **Exit Signals**: This indicator provides two exit strategies to protect profits:
1. **Fixed Stop-Loss**: Automatically set at the SuperTrend level at the time of entry to limit risk.
2. **Trailing Exit**: Exits are triggered if the price crosses below the SuperTrend level, adapting to potential trend reversals.
#### Labeling & Alerts
The **Bewakoof Stock Indicator** offers intuitive labeling and alert options:
- **Labels**: Buy and exit points are clearly marked, showing entry, stop-loss, and targets directly on the chart.
- **Alerts**: Custom alerts can be set for:
- **Buy signals** when both conditions are met, and
- **Exit signals** triggered by the stop-loss or trailing exit.
#### Use Case and Benefits
This indicator is ideal for trend-following traders who value risk control and trend confirmation:
- **Stronger Trend Signals**: By requiring RSI alignment across multiple timeframes, this indicator focuses only on trades with strong trend momentum.
- **Dynamic Risk Management**: Using both fixed and trailing exits enables flexible trade management, balancing risk and potential reward.
- **Simple Trade Execution**: The chart labels and alerts simplify trade decisions, making it easy to enter, manage, and exit trades.
#### How to Use
1. **Add** the Bewakoof Stock Indicator to your chart.
2. **Watch** for the "BUY" label as your entry point.
3. **Manage the trade** using the labeled stop-loss and target levels.
4. **Exit** on either a stop-loss hit or when the price crosses below the SuperTrend for a trailing exit.
The **Bewakoof Stock Indicator** is a complete solution for trend-following traders, combining the strength of multi-timeframe RSI with the SuperTrend’s trend-following capabilities. This systematic approach aims to provide high-confidence entries and effective risk management, empowering traders to follow trends with precision and control.

FMS Suite [KFB Quant]FMS Suite
Overview
The FMS Suite is a powerful and adaptive trend and momentum analysis tool that leverages multiple technical indicators to deliver a comprehensive signal for market direction. This suite combines the strengths of the Aroon, DMI, RSI, Supertrend, and Trix indicators, offering traders a well-rounded perspective on market trends.
How It Works
The FMS Suite integrates five essential components to assess market behavior:
Aroon Indicator : Detects trend strength and direction by analyzing the frequency of recent highs and lows over multiple timeframes. Directional Movement Index (DMI) : Measures the direction and strength of trends, with an ADX component for better trend assessment. Relative Strength Index (RSI) : Evaluates market momentum by indicating overbought or oversold conditions, with signals derived from the 50-line. Supertrend : Utilizes ATR-based volatility measures to establish dynamic support and resistance levels, signaling potential trend changes. Trix : A triple-smoothed EMA oscillator that highlights trend reversals using rate-of-change dynamics.
Each component is calculated across three separate timeframes (fast, medium, and slow), which are then averaged to produce a final FMS Signal . Users can also apply signal smoothing to reduce noise and enhance clarity.
Key Features
Customizable Parameters : Adjust the lengths for each component (fast, medium, slow) to optimize the indicator's responsiveness to different markets. Signal Smoothing Options : Select from various smoothing methods, including SMA, EMA, DEMA, and WMA, to fine-tune the FMS signal. Visual Representation : The FMS Suite plots a histogram representing the raw signal and a smoother line for clearer trend visualization. The background color shifts dynamically to indicate long, short, or neutral conditions. Threshold-Based Alerts : Set your own long and short thresholds, tailoring the indicator to your trading strategy and market outlook. Informative Table Display : An integrated table provides an at-a-glance summary of the current FMS and smoothed FMS signals, along with their respective scores and market state.
How to Use
Trend Confirmation : Utilize the FMS histogram and smoothed signal to validate or challenge existing trend assumptions. Trade Entries and Exits : Identify potential buy (long) or sell (short) signals based on the relationship between the FMS signal and predefined thresholds. Strategy Customization : Fine-tune the indicator settings to align with your trading style, whether it’s short-term scalping or long-term trend following.
Important Considerations
Not Predictive : The FMS Suite does not predict future price movements and should be used in conjunction with other analysis methods. It is based on historical price data, and past performance is not indicative of future results. Settings and Backtesting : Experiment with different lengths and smoothing techniques to optimize performance for specific instruments and market conditions. Always backtest thoroughly.
Disclaimer: This tool is provided for informational and educational purposes only and should not be considered as financial advice. Always conduct your own research and consult with a licensed financial advisor before making any investment decisions.

RSI Weighted Trend System I [InvestorUnknown]The RSI Weighted Trend System I is an experimental indicator designed to combine both slow-moving trend indicators for stable trend identification and fast-moving indicators to capture potential major turning points in the market. The novelty of this system lies in the dynamic weighting mechanism, where fast indicators receive weight based on the current Relative Strength Index (RSI) value, thus providing a flexible tool for traders seeking to adapt their strategies to varying market conditions.
Dynamic RSI-Based Weighting System
The core of the indicator is the dynamic weighting of fast indicators based on the value of the RSI. In essence, the higher the absolute value of the RSI (whether positive or negative), the higher the weight assigned to the fast indicators. This enables the system to capture rapid price movements around potential turning points.
Users can choose between a threshold-based or continuous weight system:
Threshold-Based Weighting: Fast indicators are activated only when the absolute RSI value exceeds a user-defined threshold. Below this threshold, fast indicators receive no weight.
Continuous Weighting: By setting the weight threshold to zero, the fast indicators always receive some weight, although this can result in more false signals in ranging markets.
// Calculate weight for Fast Indicators based on RSI (Slow Indicator weight is kept to 1 for simplicity)
f_RSI_Weight_System(series float rsi, simple float weight_thre) =>
float fast_weight = na
float slow_weight = na
if weight_thre > 0
if math.abs(rsi) <= weight_thre
fast_weight := 0
slow_weight := 1
else
fast_weight := 0 + math.sqrt(math.abs(rsi))
slow_weight := 1
else
fast_weight := 0 + math.sqrt(math.abs(rsi))
slow_weight := 1
Slow and Fast Indicators
Slow Indicators are designed to identify stable trends, remaining constant in weight. These include:
DMI (Directional Movement Index) For Loop
CCI (Commodity Channel Index) For Loop
Aroon For Loop
Fast Indicators are more responsive and designed to spot rapid trend shifts:
ZLEMA (Zero-Lag Exponential Moving Average) For Loop
IIRF (Infinite Impulse Response Filter) For Loop
Each of these indicators is calculated using a for-loop method to generate a moving average, which captures the trend of a given length range.
RSI Normalization
To facilitate the weighting system, the RSI is normalized from its usual 0-100 range to a -1 to 1 range. This allows for easy scaling when calculating weights and helps the system adjust to rapidly changing market conditions.
// Normalize RSI (1 to -1)
f_RSI(series float rsi_src, simple int rsi_len, simple string rsi_wb, simple string ma_type, simple int ma_len) =>
output = switch rsi_wb
"RAW RSI" => ta.rsi(rsi_src, rsi_len)
"RSI MA" => ma_type == "EMA" ? (ta.ema(ta.rsi(rsi_src, rsi_len), ma_len)) : (ta.sma(ta.rsi(rsi_src, rsi_len), ma_len))
Signal Calculation
The final trading signal is a weighted average of both the slow and fast indicators, depending on the calculated weights from the RSI. This ensures a balanced approach, where slow indicators maintain overall trend guidance, while fast indicators provide timely entries and exits.
// Calculate Signal (as weighted average)
sig = math.round(((DMI*slow_w) + (CCI*slow_w) + (Aroon*slow_w) + (ZLEMA*fast_w) + (IIRF*fast_w)) / (3*slow_w + 2*fast_w), 2)
Backtest Mode and Performance Metrics
This version of the RSI Weighted Trend System includes a comprehensive backtesting mode, allowing users to evaluate the performance of their selected settings against a Buy & Hold strategy. The backtesting includes:
Equity calculation based on the signals generated by the indicator.
Performance metrics table comparing Buy & Hold strategy metrics with the system’s signals, including: Mean, positive, and negative return percentages, Standard deviations (of all, positive and negative returns), Sharpe Ratio, Sortino Ratio, and Omega Ratio
f_PerformanceMetrics(series float base, int Lookback, simple float startDate, bool Annualize = true) =>
// Initialize variables for positive and negative returns
pos_sum = 0.0
neg_sum = 0.0
pos_count = 0
neg_count = 0
returns_sum = 0.0
returns_squared_sum = 0.0
pos_returns_squared_sum = 0.0
neg_returns_squared_sum = 0.0
// Loop through the past 'Lookback' bars to calculate sums and counts
if (time >= startDate)
for i = 0 to Lookback - 1
r = (base - base ) / base
returns_sum += r
returns_squared_sum += r * r
if r > 0
pos_sum += r
pos_count += 1
pos_returns_squared_sum += r * r
if r < 0
neg_sum += r
neg_count += 1
neg_returns_squared_sum += r * r
float export_array = array.new_float(12)
// Calculate means
mean_all = math.round((returns_sum / Lookback) * 100, 2)
mean_pos = math.round((pos_count != 0 ? pos_sum / pos_count : na) * 100, 2)
mean_neg = math.round((neg_count != 0 ? neg_sum / neg_count : na) * 100, 2)
// Calculate standard deviations
stddev_all = math.round((math.sqrt((returns_squared_sum - (returns_sum * returns_sum) / Lookback) / Lookback)) * 100, 2)
stddev_pos = math.round((pos_count != 0 ? math.sqrt((pos_returns_squared_sum - (pos_sum * pos_sum) / pos_count) / pos_count) : na) * 100, 2)
stddev_neg = math.round((neg_count != 0 ? math.sqrt((neg_returns_squared_sum - (neg_sum * neg_sum) / neg_count) / neg_count) : na) * 100, 2)
// Calculate probabilities
prob_pos = math.round((pos_count / Lookback) * 100, 2)
prob_neg = math.round((neg_count / Lookback) * 100, 2)
prob_neu = math.round(((Lookback - pos_count - neg_count) / Lookback) * 100, 2)
// Calculate ratios
sharpe_ratio = math.round(mean_all / stddev_all * (Annualize ? math.sqrt(Lookback) : 1), 2)
sortino_ratio = math.round(mean_all / stddev_neg * (Annualize ? math.sqrt(Lookback) : 1), 2)
omega_ratio = math.round(pos_sum / math.abs(neg_sum), 2)
// Set values in the array
array.set(export_array, 0, mean_all), array.set(export_array, 1, mean_pos), array.set(export_array, 2, mean_neg),
array.set(export_array, 3, stddev_all), array.set(export_array, 4, stddev_pos), array.set(export_array, 5, stddev_neg),
array.set(export_array, 6, prob_pos), array.set(export_array, 7, prob_neu), array.set(export_array, 8, prob_neg),
array.set(export_array, 9, sharpe_ratio), array.set(export_array, 10, sortino_ratio), array.set(export_array, 11, omega_ratio)
// Export the array
export_array
The metrics help traders assess the effectiveness of their strategy over time and can be used to optimize their settings.
Calibration Mode
A calibration mode is included to assist users in tuning the indicator to their specific needs. In this mode, traders can focus on a specific indicator (e.g., DMI, CCI, Aroon, ZLEMA, IIRF, or RSI) and fine-tune it without interference from other signals.
The calibration plot visualizes the chosen indicator's performance against a zero line, making it easy to see how changes in the indicator’s settings affect its trend detection.
Customization and Default Settings
Important Note: The default settings provided are not optimized for any particular market or asset. They serve as a starting point for experimentation. Traders are encouraged to calibrate the system to suit their own trading strategies and preferences.
The indicator allows deep customization, from selecting which indicators to use, adjusting the lengths of each indicator, smoothing parameters, and the RSI weight system.
Alerts
Traders can set alerts for both long and short signals when the indicator flips, allowing for automated monitoring of potential trading opportunities.

RSI & Volume Impact Analyzer Ver.1.00Description:
The RSI VOL Score indicator combines the Relative Strength Index (RSI) and volume data through a mathematical calculation to assist traders in identifying and confirming potential trend reversals and continuations. By leveraging both momentum (RSI) and volume data, this indicator provides a more comprehensive view of market strength compared to using RSI or volume alone.
How It Works:
This indicator calculates a score by comparing the RSI against its moving average, adjusted by the volume data. The resulting score quantifies market momentum and strength. When the score crosses its signal line, it may indicate key moments where the market shifts between bullish and bearish trends, potentially helping traders spot these changes earlier.
Calculation Methods:
The RSI VOL Score allows users to select between several calculation methods to suit their strategy:
SMA (Simple Moving Average): Provides a balanced smoothing approach.
EMA (Exponential Moving Average): Reacts more quickly to recent price changes, offering faster signals.
VWMA (Volume Weighted Moving Average): Emphasizes high-volume periods, focusing on stronger market moves.
WMA (Weighted Moving Average): Applies greater weight to recent data for a more responsive signal.
What the Indicator Plots:
Score Line: Represents a combined metric based on RSI and volume, helping traders gauge the overall strength of the trend.
Signal Line: A smoothed version of the score that helps traders identify potential trend changes. Bullish signals occur when the score crosses above the signal line, while bearish signals occur when the score drops below.
Key Features:
Trend Identification: The score and signal line crossovers can help confirm emerging bullish or bearish trends, allowing traders to act on upward or downward momentum.
Customizable Settings: Traders can adjust the lengths of the RSI and signal line and choose between different moving averages (SMA, EMA, VWMA, WMA) to tailor the indicator to their trading style.
Timeframe-Specific: The indicator works within the selected timeframe, ensuring accurate trend analysis based on the current market context.
Practical Use Cases:
Trending Markets: In trending markets, this indicator helps confirm bullish or bearish signals by validating price moves with volume. Traders can use the crossover of the score and signal line as a guide for entering or exiting trades based on trend strength.
Ranging Markets: In ranging markets, the indicator helps filter out false signals by confirming if price movements are backed by volume, making it a useful tool for traders looking to avoid entering during weak or uncertain market conditions.
Interpreting the Score and Signal Lines:
Bullish Signal: A bullish signal occurs when the score crosses above the signal line, indicating a potential upward trend in momentum and price.
Bearish Signal: A bearish signal is generated when the score crosses below the signal line, suggesting a potential downward trend or weakening market momentum.
By mathematically combining RSI and volume data into a single trend score, the RSI VOL Score indicator provides traders with a powerful tool for identifying trend shifts early and making more confident trading decisions.
Important Note:
The signals generated by this indicator should be interpreted in conjunction with other analysis tools. It is always advisable to confirm signals before making any trading decisions.
Disclaimer:
This indicator is designed to assist traders in their decision-making process and does not provide financial advice. The creators of this tool are not responsible for any financial losses or trading decisions made based on its signals. Trading involves significant risk, and users should seek professional advice or conduct their own research before making any trading decisions.

Larry Conners Vix Reversal II Strategy (approx.)This Pine Script™ strategy is a modified version of the original Larry Connors VIX Reversal II Strategy, designed for short-term trading in market indices like the S&P 500. The strategy utilizes the Relative Strength Index (RSI) of the VIX (Volatility Index) to identify potential overbought or oversold market conditions. The logic is based on the assumption that extreme levels of market volatility often precede reversals in price.
How the Strategy Works
The strategy calculates the RSI of the VIX using a 25-period lookback window. The RSI is a momentum oscillator that measures the speed and change of price movements. It ranges from 0 to 100 and is often used to identify overbought and oversold conditions in assets.
Overbought Signal: When the RSI of the VIX rises above 61, it signals a potential overbought condition in the market. The strategy looks for a RSI downtick (i.e., when RSI starts to fall after reaching this level) as a trigger to enter a long position.
Oversold Signal: Conversely, when the RSI of the VIX drops below 42, the market is considered oversold. A RSI uptick (i.e., when RSI starts to rise after hitting this level) serves as a signal to enter a short position.
The strategy holds the position for a minimum of 7 days and a maximum of 12 days, after which it exits automatically.
Larry Connors: Background
Larry Connors is a prominent figure in quantitative trading, specializing in short-term market strategies. He is the co-author of several influential books on trading, such as Street Smarts (1995), co-written with Linda Raschke, and How Markets Really Work. Connors' work focuses on developing rules-based systems using volatility indicators like the VIX and oscillators such as RSI to exploit mean-reversion patterns in financial markets.
Risks of the Strategy
While the Larry Connors VIX Reversal II Strategy can capture reversals in volatile market environments, it also carries significant risks:
Over-Optimization: This modified version adjusts RSI levels and holding periods to fit recent market data. If market conditions change, the strategy might no longer be effective, leading to false signals.
Drawdowns in Trending Markets: This is a mean-reversion strategy, designed to profit when markets return to a previous mean. However, in strongly trending markets, especially during extended bull or bear phases, the strategy might generate losses due to early entries or exits.
Volatility Risk: Since this strategy is linked to the VIX, an instrument that reflects market volatility, large spikes in volatility can lead to unexpected, fast-moving market conditions, potentially leading to larger-than-expected losses.
Scientific Literature and Supporting Research
The use of RSI and VIX in trading strategies has been widely discussed in academic research. RSI is one of the most studied momentum oscillators, and numerous studies show that it can capture mean-reversion effects in various markets, including equities and derivatives.
Wong et al. (2003) investigated the effectiveness of technical trading rules such as RSI, finding that it has predictive power in certain market conditions, particularly in mean-reverting markets .
The VIX, often referred to as the “fear index,” reflects market expectations of volatility and has been a focal point in research exploring volatility-based strategies. Whaley (2000) extensively reviewed the predictive power of VIX, noting that extreme VIX readings often correlate with turning points in the stock market .
Modified Version of Original Strategy
This script is a modified version of Larry Connors' original VIX Reversal II strategy. The key differences include:
Adjusted RSI period to 25 (instead of 2 or 4 commonly used in Connors’ other work).
Overbought and oversold levels modified to 61 and 42, respectively.
Specific holding period (7 to 12 days) is predefined to reduce holding risk.
These modifications aim to adapt the strategy to different market environments, potentially enhancing performance under specific volatility conditions. However, as with any system, constant evaluation and testing in live markets are crucial.
References
Wong, W. K., Manzur, M., & Chew, B. K. (2003). How rewarding is technical analysis? Evidence from Singapore stock market. Applied Financial Economics, 13(7), 543-551.
Whaley, R. E. (2000). The investor fear gauge. Journal of Portfolio Management, 26(3), 12-17.

Rsi Long-Term Strategy [15min]Hello, I would like to present to you The "RSI Long-Term Strategy" for 15min tf
The "RSI Long-Term Strategy " is designed for traders who prefer a combination of momentum and trend-following techniques. The strategy focuses on entering long positions during significant market corrections within an overall uptrend, confirmed by both RSI and volume. The use of long-term SMAs ensures that trades are made in line with the broader market trend. The stop-loss feature provides risk management by limiting losses on trades that do not perform as expected. This strategy is particularly well-suited for longer-term traders who monitor 15-minute charts but look for substantial trend reversals or continuations.
Indicators and Parameters:
Relative Strength Index (RSI):
- The RSI is calculated using a 10-period length. It measures the magnitude of recent price changes to evaluate overbought or oversold conditions. The script defines oversold conditions when the RSI is at or below 30 and overbought conditions when the RSI is at or above 70.
Volume Condition:
-The strategy incorporates a volume condition where the current volume must be greater than 2.5 times the 20-period moving average of volume. This is used to confirm the strength of the price movement.
Simple Moving Averages (SMA):
- The strategy uses two SMAs: SMA1 with a length of 250 periods and SMA2 with a length of 500 periods. These SMAs help identify long-term trends and generate signals based on their crossover.
Strategy Logic:
Entry Logic:
A long position is initiated when all the following conditions are met:
The RSI indicates an oversold condition (RSI ≤ 30).
SMA1 is above SMA2, indicating an uptrend.
The volume condition is satisfied, confirming the strength of the signal.
Exit Logic:
The strategy closes the long position when SMA1 crosses under SMA2, signaling a potential end of the uptrend (a "Death Cross").
Stop-Loss:
A stop-loss is set at 5% below the entry price to manage risk and limit potential losses.
Buy and sell signals are highlighted with circles below or above bars:
Green Circle : Buy signal when RSI is oversold, SMA1 > SMA2, and the volume condition is met.
Red Circle : Sell signal when RSI is overbought, SMA1 < SMA2, and the volume condition is met.
Black Cross: "Death Cross" when SMA1 crosses under SMA2, indicating a potential bearish signal.
to determine the level of stop loss and target point I used a piece of code by RafaelZioni, here is the script from which a piece of code was taken
I hope the strategy will be helpful, as always, best regards and safe trades
;)

BabyShark VWAP Strategy What the code does:
This Pine Script implements a trading strategy based on two indicators: Volume Weighted Average Price (VWAP) and On Balance Volume (OBV) Relative Strength Index (RSI). The strategy aims to identify potential buy and sell signals based on deviations from VWAP and OBV RSI crossing certain threshold levels.
How it does it:
**VWAP Calculation**: The script calculates the VWAP using either standard deviation or average deviation over a specified length. It then plots the VWAP and its upper and lower deviation bands.
**OBV RSI Calculation**: It computes the OBV and then calculates the RSI using the cumulative changes in OBV. The RSI is plotted and compared against predefined levels.
**Table Visibility and Occurrence Counting**: It allows the user to display a table showing the number of occurrences where the price is above Upper Dev 2, below Lower Dev 2, crosses above a higher RSI level, or crosses below a lower RSI level.
**Entries**: Long and short entry conditions are defined based on the position of the price relative to the VWAP deviation bands and the color of the OBV RSI. Entries are made when specific conditions are met, and there hasn't been a recent entry.
**Exit Conditions**: The script includes stop-loss and take-profit mechanisms. It exits positions based on price crossing the VWAP or a certain percentage, and it prevents further trading after a certain number of consecutive losses.
What traders can use it for:
**Trend Identification**: Traders can use the VWAP and its deviation bands to identify potential trend reversals or continuations.
**Volume Confirmation**: The inclusion of OBV RSI provides confirmation of price movements based on volume changes.
**Entry and Exit Signals**: The script generates buy and sell signals based on the specified conditions, allowing traders to enter and exit positions with defined stop-loss and take-profit levels.
**Statistical Analysis**: The visibility of occurrence counts in the table allows traders to perform statistical analysis on the frequency of price movements relative to the VWAP and OBV RSI levels.

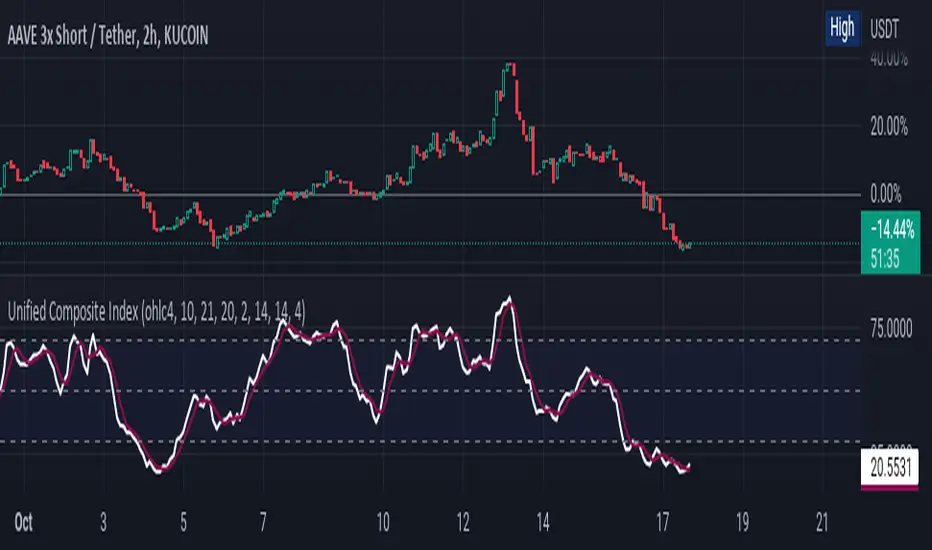
Unified Composite Index [UCI] [KuraiBlu] [LazyBear]The purpose of this indicator is to combine the four basic types of indicators (Trend, Volatility, Momentum and Volume) to create a singular, composite index in order to provide a more holistic means of observing potential changes within the market, known as the Unified Composite Index . The indicators used in this index are as follows:
Trend - Trend Composite Index
Volatility - Bollinger Bands %b
Momentum - Relative Strength Index
Volume - Money Flow Index
The average price source can’t be altered as I’ve made it an average between ((open + close) / 2) and ((high + low) / 2).
The best way to use this is by observing several of the indicators at once in conjunction with the average, rather than simply using the average produced to determine the right moment to enter, or exit a trade by itself. I've found when one indicator goes way out of bounds relative to the other three (and subsequently, the average array), then it presents a good buying, or selling opportunity.
Some adjustments were made to several of the indicators in order to standardize them on a scale of 1-100 so that they could better accommodate the average array that was finally produced. Thanks to LazyBear for letting me strip down the WaveTrend Oscillator.
Co-relation and St-deviation Strategy - BNB/USDT 15minThis indicator based on statistical analysis. it uses standard deviation and its co-relation to price action to generate signals. and following indicators has been used to calculate standard deviation and its co-relation values. finally it is capable to identify market changes in bottoms to pic most suitable points.
1. Parabolic SAR (parabolic stop and reverse)
2. Supertrend
3. Relative strength index (RSI)
4. Money flow index (MFI)
5. Balance of Power
6. Chande Momentum Oscillator
7. Center of Gravity (COG)
8. Directional Movement Index (DMI)
9. Stochastic
10. Symmetrically weighted moving average with fixed length
11. True strength index (TSI)
12. Williams %R
13. Accumulation/distribution index
14. Intraday Intensity Index
15. Negative Volume Index
16. Positive Volume Index
17. On Balance Volume
18. Price-Volume Trend
19. True range
20. Volume-weighted average price
21. Williams Accumulation/Distribution
22. Williams Variable Accumulation/Distribution
23. Simple Moving Average
24. Exponential Moving Average
25. CCI (commodity channel index)
26. Chop Zone
27. Ease of Movement
28. Detrended Price Oscillator
29. Advance Decline Line
30. Bull Bear Power

Bollinger Band Width PercentileIntroducing the Bollinger Band Width Percentile
Definitions :
Bollinger Band Width Percentile is derived from the Bollinger Band Width indicator.
It shows the percentage of bars over a specified lookback period that the Bollinger Band Width was less than the current Bollinger Band Width.
Bollinger Band Width is derived from the Bollinger Bands® indicator.
It quantitatively measures the width between the Upper and Lower Bands of the Bollinger Bands.
Bollinger Bands® is a volatility-based indicator.
It consists of three lines which are plotted in relation to a security's price.
The Middle Line is typically a Simple Moving Average.
The Upper and Lower Bands are typically 2 standard deviations above, and below the SMA (Middle Line).
Volatility is a statistical measure of the dispersion of returns for a given security or market index, measured by the standard deviation of logarithmic returns.
The Broad Concept :
Quoting Tradingview specifically for commonly noted limitations of the BBW indicator which I have based this indicator on....
“ Bollinger Bands Width (BBW) outputs a Percentage Difference between the Upper Band and the Lower Band.
This value is used to define the narrowness of the bands.
What needs to be understood however is that a trader cannot simply look at the BBW value and determine if the Band is truly narrow or not.
The significance of an instruments relative narrowness changes depending on the instrument or security in question.
What is considered narrow for one security may not be for another.
What is considered narrow for one security may even change within the scope of the same security depending on the timeframe.
In order to accurately gauge the significance of a narrowing of the bands, a technical analyst will need to research past BBW fluctuations and price performance to increase trading accuracy. ”
Here I present the Bollinger Band Width Percentile as a refinement of the BBW to somewhat overcome the limitations cited above.
Much of the work researching past BBW fluctuations, and making relative comparisons is done naturally by calculating the Bollinger Band Width Percentile.
This calculation also means that it can be read in a similar fashion across assets, greatly simplifying the interpretation of it.
Plotted Components of the Bollinger Band Width Percentile indicator :
Scale High
Mid Line
Scale Low
BBWP plot
Moving Average 1
Moving Average 2
Extreme High Alert
Extreme Low Alert
Bollinger Band Width Percentile Properties:
BBWP Length
The time period to be used in calculating the Moving average which creates the Basis for the BBW component of the BBWP.
Basis Type
The type of moving average to be used as the Basis for the BBW component of the BBWP.
BBWP Lookback
The lookback period to be used in calculating the BBWP itself.
BBWP Plot settings
The BBWP plot settings give a choice between a user defined solid color, and a choice of "Blue Green Red", or "Blue Red" spectrum palettes.
Moving Averages
Has 2 Optional User definable and adjustable moving averages of the BBWP.
Visual Alerts
Optional User adjustable High and low Signal columns.
How to read the BBWP :
A BBWP read of 95 % ... means that the current BBW level is greater than 95% of the lookback period.
A BBWP read of 5 % .... means that the current BBW level is lower than 95% of the lookback period.
Proposed interpretations :
When the BBWP gets above 90 % and particularly when it hits 100% ... this can be a signal that volatility is reaching a maximum and that a macro High or Low is about to be set.
When the BBWP gets below 10 % and particularly when it hits 0% ...... this can be a signal that volatility is reaching a minimum and that there could be a violent range breakout into a trending move.
When the BBWP hits a low level < 5 % and then gets above its moving average ...... this can be an early signal that a consolidation phase is ending and a trending move is beginning.
When the BBWP hits a high level > 95 % and then falls below its moving average ... this can be an early signal that a trending move is ending and a consolidation phase is beginning.
Essential knowledge :
The BBWP was designed with the daily timeframe in mind, but technical analysists may find use for it on other time frames also.
High and Low BBWP readings do not entail any direction bias.
Deeper Concepts :
In finance, “mean reversion” is the assumption that a financial instrument's price will tend to move towards the average price over time.
If we apply that same logic to volatility as represented here by the Bollinger band width percentile, the assumption is that the Bollinger band width percentile will tend to contract from extreme highs, and expand from extreme lows over time corresponding to repeated phases of contraction and expansion of volatility.
It is clear that for most assets there are periods of directional trending behavior followed by periods of “consolidation” ( trading sideways in a range ).
This often ends with a tightening range under reducing volume and volatility ( popularly known as “the squeeze” ).
The squeeze typically ends with a “breakout” from the range characterized by a rapid increase in volume, and volatility when price action again trends directionally, and the cycle repeats.
Typical Use Cases :
The Bollinger Band Width Percentile may be especially useful for Options traders, as it can provide a bias for when Options are relatively expensive, or inexpensive from a Volatility (Vega) perspective.
When the Bollinger Band Width Percentile is relatively high ( 85 percentile or above ) it may be more advantageous to be a net seller of Vega.
When the Bollinger Band Width Percentile is relatively low ( 15 percentile or below ) it may be advantageous to be net long Vega.
Here we examine a number of actionable signals on BTCUSD daily timeframe using the BBWP and a momentum oscillator ( using the TSI here but can equally be used with Bollinger bands, moving averages, or the traders preferred momentum oscillator ).
In this first case we will examine how a spot trader and an options trader could each use a low BBWP read to alert them to a good potential trade setup.
note: using a period of 30 for both the Bollinger bands and the BBWP period ( approximately a month ) and a BBWP lookback of 350 ( approximately a year )
As we see the Bollinger Bands have gradually contracted while price action trended down and the BBWP also fell consistently while below its moving average ( denoting falling volatility ) down to an extremely low level <5% until it broke above its moving average along with a break of range to the upside ( signaling the end of the consolidation at a low level and the beginning of a new trending move to the upside with expanding volatility).
In this next case we will continue to follow the price action presuming that the traders have taken or locked in profit at reasonable take profit levels from the previous trade setup.
Here we see the contraction of the Bollinger bands, and the BBWP alongside price action breaking below the BB Basis giving a warning that the trending move to the upside is likely over.
We then see the BBWP rising and getting above its moving average while price action fails to get above the BB Basis, likewise the TSI fails to get above its signal line and actually crosses below its zeroline.
The trader would normally take this as a signal that the next trending move could be to the downside.
The next trending move turns out to be a dramatic downside move which causes the BBWP to hit 100% signaling that volatility is likely to hit a maximum giving good opportunities for profitable trades to the skilled trader as outlined.
Limitations :
Here we will look at 2 cases where blindly taking BBWP signals could cause the trader to take a failed trade.
In this first example we will look at blindly taking a low volatility options trade
Low Volatility and corresponding low BBWP levels do not automatically mean there has to be expansion immediately, these periods of extreme low volatility can go on for quite some time.
In this second example we will look at blindly taking a high volatility spot short trade
High volatility and corresponding high BBWP levels do not automatically mean there has to be a macro high and contraction of volatility immediately, these periods of extreme high volatility can also go on for quite some time, hence the famous saying "The trend is your friend until the end of the trend" and lesser well known, but equally valid saying "never try to short the top of a parabolic blow off top"
Markets are variable and past performance is no guarantee of future results, this is not financial advice, I am not a financial advisor.
Final thoughts
The BBWP is an improvement over the BBW in my opinion, and is a novel, and useful addition to a Technical Analysts toolkit.
It is not a standalone indicator and is meant to be used in conjunction with other tools for direction bias, and Good Risk Management to base sound trades off.
John Bollinger has suggested using Bolliger bands, and its related indicators with two or three other non-correlated indicators that provide more direct market signals.
He believes it is crucial to use indicators based on different types of data.
Some of his favored technical techniques are moving average divergence/convergence (MACD), on-balance volume and relative strength index (RSI).
Thanks
Massive respect to John Bollinger, long-time technician of the markets, and legendary creator of both the Bollinger Bands® in the 1980´s, and the Bollinger band Width indicator in 2010 which this indicator is based on.
His work continues to inspire, decades after he brought the original Bollinger Bands to the market.
Much respect also to Eric Crown who gave me the fundamental knowledge of Technical Analysis, and Options trading.

Adaptive Volume-Weighted RSI (AVW-RSI)Concept Summary
The AVW-RSI is a modified version of the Relative Strength Index (RSI), where each price change is weighted by the relative trading volume for that period. This means periods of high volume (typically driven by institutions or “big money”) have a greater influence on the RSI calculation than periods of low volume.
Why AVW-RSI Helps Traders
Avoids Weak Signals During Low Volume
Standard RSI may show overbought/oversold zones even during low-volume periods (e.g., during lunch hours or after news).
AVW-RSI gives less weight to these periods, avoiding misleading signals.
Amplifies Strong Momentum Moves
If RSI is rising during high volume, it's more likely driven by institutional buying—AVW-RSI reflects that stronger by weighting the RSI component.
Filters Out Retail Noise
By prioritizing high-volume candles, it naturally discounts fakeouts caused by thin markets or retail-heavy moves.
Highlights Institutional Entry/Exit
Useful for spotting hidden accumulation/distribution that classic RSI would miss.
How It Works (Calculation Logic)
Traditional RSI Formula Recap
RSI = 100 - (100 / (1 + RS))
RS = Average Gain / Average Loss (over N periods)
Modified Step – Apply Volume Weight
For each period
Gain_t = max(Close_t - Close_{t-1}, 0)
Loss_t = max(Close_{t-1} - Close_t, 0)
Weight_t = Volume_t / AvgVolume(N)
WeightedGain_t = Gain_t * Weight_t
WeightedLoss_t = Loss_t * Weight_t
Weighted RSI
AvgWeightedGain = SMA(WeightedGain, N)
AvgWeightedLoss = SMA(WeightedLoss, N)
RS = AvgWeightedGain / AvgWeightedLoss
AVW-RSI = 100 - (100 / (1 + RS))
Visual Features on Chart
Line Color Gradient
Color gets darker as volume weight increases, signaling stronger conviction.
Overbought/Oversold Zones
Traditional: 70/30
Suggested AVW-RSI zones: Use dynamic thresholds based on historical volatility (e.g., 80/20 for high-volume coins).
Volume Spike Flags
Mark RSI turning points that occurred during volume spikes with a special dot/symbol.
Trading Strategies with AVW-RSI
1. Weighted RSI Divergence
Regular RSI divergence becomes more powerful when volume is high.
AVW-RSI divergence with volume spike is a strong signal of reversal.
2. Trend Confirmation
RSI crossing above 50 during rising volume is a good entry signal.
RSI crossing below 50 with high volume is a strong exit or short trigger.
3. Breakout Validation
Price breaking resistance + AVW-RSI > 60 with volume = Confirmed breakout.
Price breaking but AVW-RSI < 50 or on low volume = Potential fakeout.
Example Use Case
Stock XYZ is approaching a resistance zone. A trader sees:
Standard RSI: 65 → suggests strength.
Volume is 3x the average.
AVW-RSI: 78 → signals strong momentum with institutional backing.
The trader enters confidently, knowing this isn't just low-volume hype.
Limitations / Tips
Works best on liquid assets (Forex majors, large-cap stocks, BTC/ETH).
Should be used alongside price action and volume analysis—not standalone.
Periods of extremely high volume (news events) might need smoothing to avoid spikes.

Advanced Divergence IndicatorAdvanced Divergence Indicator
Unlock the full potential of your trading strategy with the Advanced Divergence Indicator, a powerful tool designed to identify and analyze bullish and bearish divergences using multiple technical indicators. Whether you're a seasoned trader or just starting out, this indicator provides clear, actionable signals to help you make informed trading decisions.
What It Does
The Advanced Divergence Indicator detects divergences between price movements and key technical indicators, specifically the Relative Strength Index (RSI) and On-Balance Volume (OBV). Divergence occurs when the price trends in one direction while the indicator trends in the opposite direction, signaling potential reversals or continuations in the market.
Key Features
Multi-Indicator Analysis
RSI Divergence: Identifies bullish and bearish divergences using the RSI, helping you spot potential reversals based on momentum.
OBV Divergence: Utilizes OBV to detect divergences related to volume flow, providing insights into the strength behind price movements.
Bullish and Bearish Signals
Bullish Divergence: Signals when indicators show higher lows while the price forms lower lows, suggesting a potential upward reversal.
Bearish Divergence: Alerts when indicators display lower highs while the price creates higher highs, indicating a possible downward reversal.
Signal Strength Classification
Standard Signals: Represent typical divergence occurrences, marked with green (bullish) and red (bearish) labels.
Strong Signals: Highlighted with yellow (strong bullish) and blue (strong bearish) labels when divergences coincide with overbought or oversold conditions, enhancing signal reliability.
Customizable Settings
Indicator Selection: Choose to enable RSI, OBV, or both based on your trading preferences.
Pivot Points: Adjust the number of bars left and right to fine-tune pivot detection for more accurate divergence identification.
Range Configuration: Set minimum and maximum bar ranges to control the sensitivity of divergence detection, suitable for different timeframes and trading styles.
Noise Cancellation: Reduce false signals by enabling noise filtering, ensuring that only significant divergences are highlighted.
Visual Clarity
Color-Coded Labels: Easily distinguish between different types of divergences with intuitive color codes—green for bullish, red for bearish, yellow for strong bullish, and blue for strong bearish signals.
Clean Chart Display: The indicator overlays seamlessly on your chart without clutter, ensuring that signals are easily identifiable without distracting from price action.
Real-Time Alerts
Custom Alert Conditions: Receive instant notifications for bullish and bearish divergences, enabling you to act promptly on potential trading opportunities.
Combined Alerts: Get alerts for either bullish or bearish signals, or both, based on your selected criteria.
How to Use
Add the Indicator to Your Chart
Apply the Advanced Divergence Indicator to your desired chart and timeframe.
Configure Settings
Select Indicators: Choose to enable RSI, OBV, or both under the "Indicator Settings" group.
Adjust Parameters: Customize RSI length, pivot points, and divergence ranges to match your trading strategy and the specific asset you are analyzing.
Enable Noise Cancellation: Activate this feature to filter out minor divergences and focus on more significant signals.
Interpret the Signals
Bullish Signals: Look for green or yellow labels below the price bars indicating potential upward reversals.
Bearish Signals: Identify red or blue labels above the price bars signaling possible downward reversals.
Strong Signals: Pay special attention to yellow and blue labels as they denote stronger divergences with higher reliability.
Set Up Alerts
Configure alert conditions within the indicator to receive real-time notifications when bullish or bearish divergences are detected, ensuring you never miss a trading opportunity.
Why Choose Advanced Divergence Indicator
Comprehensive Analysis : By combining RSI and OBV, the indicator provides a more robust analysis compared to single-indicator tools, enhancing the accuracy of divergence detection.
Flexibility : Highly customizable settings allow traders to tailor the indicator to their unique strategies and market conditions.
User-Friendly : Clear labels and color codes make it easy for traders of all levels to understand and act on the signals.
Reliability : Strong signal classification and noise cancellation features help reduce false positives, providing more trustworthy trading signals.

NASI +The NASI + indicator is an advanced adaptation of the classic McClellan Oscillator, a tool widely used to gauge market breadth. It calculates the McClellan Oscillator by measuring the difference between the 19-day and 39-day EMAs of net advancing issues, which are optionally adjusted to account for the relative strength of advancing vs. declining stocks.
To enhance this analysis, NASI + applies the Relative Strength Index (RSI) to the cumulative McClellan Oscillator values, generating a unique momentum-based view of market breadth. Additionally, two extra EMAs—a 10-day and a 4-day EMA—are applied to the RSI, providing further refinement to signals for overbought and oversold conditions.
With NASI +, users benefit from:
-A deeper analysis of market momentum through cumulative breadth data.
-Enhanced sensitivity to trend shifts with the applied RSI and dual EMAs.
-Clear visual cues for overbought and oversold conditions, aiding in intuitive signal identification.

On Balance Volume Oscillator of Trading Volume TrendOn Balance Volume Oscillator of Trading Volume Trend
Introduction
This indicator, the "On Balance Volume Oscillator of Trading Volume Trend," is a technical analysis tool designed to provide insights into market momentum and potential trend reversals by combining the On Balance Volume (OBV) and Relative Strength Index (RSI) indicators.
Calculation and Methodology
* OBV Calculation: The indicator first calculates the On Balance Volume, which is a cumulative total of the volume of up days minus the volume of down days. This provides a running tally of buying and selling pressure.
* RSI of OBV: The RSI is then applied to the OBV values to smooth the data and identify overbought or oversold conditions.
* Exponential Moving Averages (EMAs): Two EMAs are calculated on the RSI of OBV. A shorter-term EMA (9-period in this case) and a longer-term EMA (100-period) are used to generate signals.
Interpretation and Usage
* EMA Crossovers: When the shorter-term EMA crosses above the longer-term EMA, it suggests increasing bullish momentum. Conversely, a downward crossover indicates weakening bullish momentum or increasing bearish pressure.
* RSI Divergences: Divergences between the price and the indicator can signal potential trend reversals. For example, if the price is making new highs but the indicator is failing to do so, it could be a bearish divergence.
* Overbought/Oversold Conditions: When the RSI of OBV is above 70, it suggests the market may be overbought and a potential correction could be imminent. Conversely, when it is below 30, it suggests the market may be oversold.
Visual Representation
The indicator is plotted on a chart with multiple lines and filled areas:
* Two EMAs: The shorter-term EMA and longer-term EMA are plotted to show the trend of the OBV.
* Filled Areas: The area between the two EMAs is filled with a color to indicate the strength of the trend. The color changes based on whether the shorter-term EMA is above or below the longer-term EMA.
* RSI Bands: Horizontal lines at 30 and 70 mark the overbought and oversold levels for the RSI of OBV.
Summary
The On Balance Volume Oscillator of Trading Volume Trend provides a comprehensive view of market momentum and can be a valuable tool for traders. By combining the OBV and RSI, this indicator helps identify potential trend reversals, overbought and oversold conditions, and the strength of the current trend.
Note: This indicator should be used in conjunction with other technical analysis tools and fundamental analysis to make informed trading decisions.
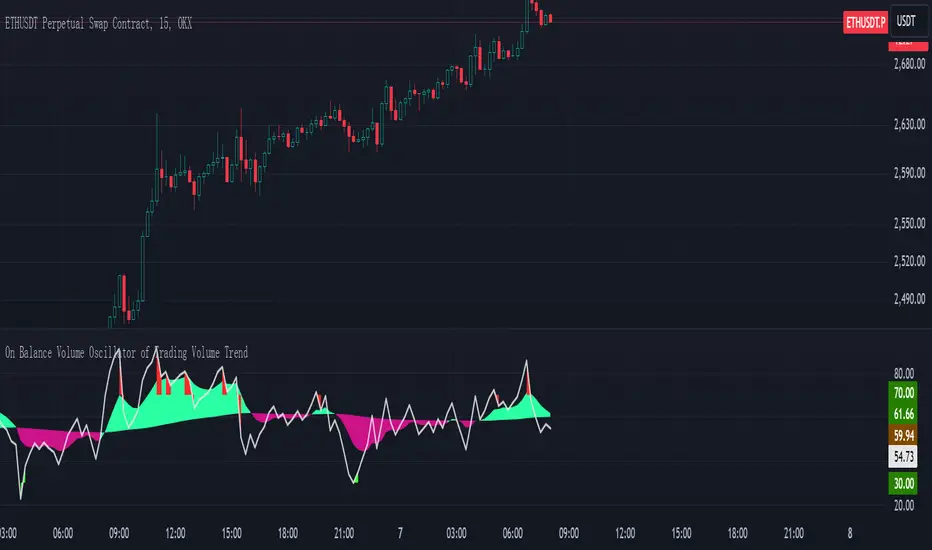
Universal Ratio Trend Matrix [InvestorUnknown]The Universal Ratio Trend Matrix is designed for trend analysis on asset/asset ratios, supporting up to 40 different assets. Its primary purpose is to help identify which assets are outperforming others within a selection, providing a broad overview of market trends through a matrix of ratios. The indicator automatically expands the matrix based on the number of assets chosen, simplifying the process of comparing multiple assets in terms of performance.
Key features include the ability to choose from a narrow selection of indicators to perform the ratio trend analysis, allowing users to apply well-defined metrics to their comparison.
Drawback: Due to the computational intensity involved in calculating ratios across many assets, the indicator has a limitation related to loading speed. TradingView has time limits for calculations, and for users on the basic (free) plan, this could result in frequent errors due to exceeded time limits. To use the indicator effectively, users with any paid plans should run it on timeframes higher than 8h (the lowest timeframe on which it managed to load with 40 assets), as lower timeframes may not reliably load.
Indicators:
RSI_raw: Simple function to calculate the Relative Strength Index (RSI) of a source (asset price).
RSI_sma: Calculates RSI followed by a Simple Moving Average (SMA).
RSI_ema: Calculates RSI followed by an Exponential Moving Average (EMA).
CCI: Calculates the Commodity Channel Index (CCI).
Fisher: Implements the Fisher Transform to normalize prices.
Utility Functions:
f_remove_exchange_name: Strips the exchange name from asset tickers (e.g., "INDEX:BTCUSD" to "BTCUSD").
f_remove_exchange_name(simple string name) =>
string parts = str.split(name, ":")
string result = array.size(parts) > 1 ? array.get(parts, 1) : name
result
f_get_price: Retrieves the closing price of a given asset ticker using request.security().
f_constant_src: Checks if the source data is constant by comparing multiple consecutive values.
Inputs:
General settings allow users to select the number of tickers for analysis (used_assets) and choose the trend indicator (RSI, CCI, Fisher, etc.).
Table settings customize how trend scores are displayed in terms of text size, header visibility, highlighting options, and top-performing asset identification.
The script includes inputs for up to 40 assets, allowing the user to select various cryptocurrencies (e.g., BTCUSD, ETHUSD, SOLUSD) or other assets for trend analysis.
Price Arrays:
Price values for each asset are stored in variables (price_a1 to price_a40) initialized as na. These prices are updated only for the number of assets specified by the user (used_assets).
Trend scores for each asset are stored in separate arrays
// declare price variables as "na"
var float price_a1 = na, var float price_a2 = na, var float price_a3 = na, var float price_a4 = na, var float price_a5 = na
var float price_a6 = na, var float price_a7 = na, var float price_a8 = na, var float price_a9 = na, var float price_a10 = na
var float price_a11 = na, var float price_a12 = na, var float price_a13 = na, var float price_a14 = na, var float price_a15 = na
var float price_a16 = na, var float price_a17 = na, var float price_a18 = na, var float price_a19 = na, var float price_a20 = na
var float price_a21 = na, var float price_a22 = na, var float price_a23 = na, var float price_a24 = na, var float price_a25 = na
var float price_a26 = na, var float price_a27 = na, var float price_a28 = na, var float price_a29 = na, var float price_a30 = na
var float price_a31 = na, var float price_a32 = na, var float price_a33 = na, var float price_a34 = na, var float price_a35 = na
var float price_a36 = na, var float price_a37 = na, var float price_a38 = na, var float price_a39 = na, var float price_a40 = na
// create "empty" arrays to store trend scores
var a1_array = array.new_int(40, 0), var a2_array = array.new_int(40, 0), var a3_array = array.new_int(40, 0), var a4_array = array.new_int(40, 0)
var a5_array = array.new_int(40, 0), var a6_array = array.new_int(40, 0), var a7_array = array.new_int(40, 0), var a8_array = array.new_int(40, 0)
var a9_array = array.new_int(40, 0), var a10_array = array.new_int(40, 0), var a11_array = array.new_int(40, 0), var a12_array = array.new_int(40, 0)
var a13_array = array.new_int(40, 0), var a14_array = array.new_int(40, 0), var a15_array = array.new_int(40, 0), var a16_array = array.new_int(40, 0)
var a17_array = array.new_int(40, 0), var a18_array = array.new_int(40, 0), var a19_array = array.new_int(40, 0), var a20_array = array.new_int(40, 0)
var a21_array = array.new_int(40, 0), var a22_array = array.new_int(40, 0), var a23_array = array.new_int(40, 0), var a24_array = array.new_int(40, 0)
var a25_array = array.new_int(40, 0), var a26_array = array.new_int(40, 0), var a27_array = array.new_int(40, 0), var a28_array = array.new_int(40, 0)
var a29_array = array.new_int(40, 0), var a30_array = array.new_int(40, 0), var a31_array = array.new_int(40, 0), var a32_array = array.new_int(40, 0)
var a33_array = array.new_int(40, 0), var a34_array = array.new_int(40, 0), var a35_array = array.new_int(40, 0), var a36_array = array.new_int(40, 0)
var a37_array = array.new_int(40, 0), var a38_array = array.new_int(40, 0), var a39_array = array.new_int(40, 0), var a40_array = array.new_int(40, 0)
f_get_price(simple string ticker) =>
request.security(ticker, "", close)
// Prices for each USED asset
f_get_asset_price(asset_number, ticker) =>
if (used_assets >= asset_number)
f_get_price(ticker)
else
na
// overwrite empty variables with the prices if "used_assets" is greater or equal to the asset number
if barstate.isconfirmed // use barstate.isconfirmed to avoid "na prices" and calculation errors that result in empty cells in the table
price_a1 := f_get_asset_price(1, asset1), price_a2 := f_get_asset_price(2, asset2), price_a3 := f_get_asset_price(3, asset3), price_a4 := f_get_asset_price(4, asset4)
price_a5 := f_get_asset_price(5, asset5), price_a6 := f_get_asset_price(6, asset6), price_a7 := f_get_asset_price(7, asset7), price_a8 := f_get_asset_price(8, asset8)
price_a9 := f_get_asset_price(9, asset9), price_a10 := f_get_asset_price(10, asset10), price_a11 := f_get_asset_price(11, asset11), price_a12 := f_get_asset_price(12, asset12)
price_a13 := f_get_asset_price(13, asset13), price_a14 := f_get_asset_price(14, asset14), price_a15 := f_get_asset_price(15, asset15), price_a16 := f_get_asset_price(16, asset16)
price_a17 := f_get_asset_price(17, asset17), price_a18 := f_get_asset_price(18, asset18), price_a19 := f_get_asset_price(19, asset19), price_a20 := f_get_asset_price(20, asset20)
price_a21 := f_get_asset_price(21, asset21), price_a22 := f_get_asset_price(22, asset22), price_a23 := f_get_asset_price(23, asset23), price_a24 := f_get_asset_price(24, asset24)
price_a25 := f_get_asset_price(25, asset25), price_a26 := f_get_asset_price(26, asset26), price_a27 := f_get_asset_price(27, asset27), price_a28 := f_get_asset_price(28, asset28)
price_a29 := f_get_asset_price(29, asset29), price_a30 := f_get_asset_price(30, asset30), price_a31 := f_get_asset_price(31, asset31), price_a32 := f_get_asset_price(32, asset32)
price_a33 := f_get_asset_price(33, asset33), price_a34 := f_get_asset_price(34, asset34), price_a35 := f_get_asset_price(35, asset35), price_a36 := f_get_asset_price(36, asset36)
price_a37 := f_get_asset_price(37, asset37), price_a38 := f_get_asset_price(38, asset38), price_a39 := f_get_asset_price(39, asset39), price_a40 := f_get_asset_price(40, asset40)
Universal Indicator Calculation (f_calc_score):
This function allows switching between different trend indicators (RSI, CCI, Fisher) for flexibility.
It uses a switch-case structure to calculate the indicator score, where a positive trend is denoted by 1 and a negative trend by 0. Each indicator has its own logic to determine whether the asset is trending up or down.
// use switch to allow "universality" in indicator selection
f_calc_score(source, trend_indicator, int_1, int_2) =>
int score = na
if (not f_constant_src(source)) and source > 0.0 // Skip if you are using the same assets for ratio (for example BTC/BTC)
x = switch trend_indicator
"RSI (Raw)" => RSI_raw(source, int_1)
"RSI (SMA)" => RSI_sma(source, int_1, int_2)
"RSI (EMA)" => RSI_ema(source, int_1, int_2)
"CCI" => CCI(source, int_1)
"Fisher" => Fisher(source, int_1)
y = switch trend_indicator
"RSI (Raw)" => x > 50 ? 1 : 0
"RSI (SMA)" => x > 50 ? 1 : 0
"RSI (EMA)" => x > 50 ? 1 : 0
"CCI" => x > 0 ? 1 : 0
"Fisher" => x > x ? 1 : 0
score := y
else
score := 0
score
Array Setting Function (f_array_set):
This function populates an array with scores calculated for each asset based on a base price (p_base) divided by the prices of the individual assets.
It processes multiple assets (up to 40), calling the f_calc_score function for each.
// function to set values into the arrays
f_array_set(a_array, p_base) =>
array.set(a_array, 0, f_calc_score(p_base / price_a1, trend_indicator, int_1, int_2))
array.set(a_array, 1, f_calc_score(p_base / price_a2, trend_indicator, int_1, int_2))
array.set(a_array, 2, f_calc_score(p_base / price_a3, trend_indicator, int_1, int_2))
array.set(a_array, 3, f_calc_score(p_base / price_a4, trend_indicator, int_1, int_2))
array.set(a_array, 4, f_calc_score(p_base / price_a5, trend_indicator, int_1, int_2))
array.set(a_array, 5, f_calc_score(p_base / price_a6, trend_indicator, int_1, int_2))
array.set(a_array, 6, f_calc_score(p_base / price_a7, trend_indicator, int_1, int_2))
array.set(a_array, 7, f_calc_score(p_base / price_a8, trend_indicator, int_1, int_2))
array.set(a_array, 8, f_calc_score(p_base / price_a9, trend_indicator, int_1, int_2))
array.set(a_array, 9, f_calc_score(p_base / price_a10, trend_indicator, int_1, int_2))
array.set(a_array, 10, f_calc_score(p_base / price_a11, trend_indicator, int_1, int_2))
array.set(a_array, 11, f_calc_score(p_base / price_a12, trend_indicator, int_1, int_2))
array.set(a_array, 12, f_calc_score(p_base / price_a13, trend_indicator, int_1, int_2))
array.set(a_array, 13, f_calc_score(p_base / price_a14, trend_indicator, int_1, int_2))
array.set(a_array, 14, f_calc_score(p_base / price_a15, trend_indicator, int_1, int_2))
array.set(a_array, 15, f_calc_score(p_base / price_a16, trend_indicator, int_1, int_2))
array.set(a_array, 16, f_calc_score(p_base / price_a17, trend_indicator, int_1, int_2))
array.set(a_array, 17, f_calc_score(p_base / price_a18, trend_indicator, int_1, int_2))
array.set(a_array, 18, f_calc_score(p_base / price_a19, trend_indicator, int_1, int_2))
array.set(a_array, 19, f_calc_score(p_base / price_a20, trend_indicator, int_1, int_2))
array.set(a_array, 20, f_calc_score(p_base / price_a21, trend_indicator, int_1, int_2))
array.set(a_array, 21, f_calc_score(p_base / price_a22, trend_indicator, int_1, int_2))
array.set(a_array, 22, f_calc_score(p_base / price_a23, trend_indicator, int_1, int_2))
array.set(a_array, 23, f_calc_score(p_base / price_a24, trend_indicator, int_1, int_2))
array.set(a_array, 24, f_calc_score(p_base / price_a25, trend_indicator, int_1, int_2))
array.set(a_array, 25, f_calc_score(p_base / price_a26, trend_indicator, int_1, int_2))
array.set(a_array, 26, f_calc_score(p_base / price_a27, trend_indicator, int_1, int_2))
array.set(a_array, 27, f_calc_score(p_base / price_a28, trend_indicator, int_1, int_2))
array.set(a_array, 28, f_calc_score(p_base / price_a29, trend_indicator, int_1, int_2))
array.set(a_array, 29, f_calc_score(p_base / price_a30, trend_indicator, int_1, int_2))
array.set(a_array, 30, f_calc_score(p_base / price_a31, trend_indicator, int_1, int_2))
array.set(a_array, 31, f_calc_score(p_base / price_a32, trend_indicator, int_1, int_2))
array.set(a_array, 32, f_calc_score(p_base / price_a33, trend_indicator, int_1, int_2))
array.set(a_array, 33, f_calc_score(p_base / price_a34, trend_indicator, int_1, int_2))
array.set(a_array, 34, f_calc_score(p_base / price_a35, trend_indicator, int_1, int_2))
array.set(a_array, 35, f_calc_score(p_base / price_a36, trend_indicator, int_1, int_2))
array.set(a_array, 36, f_calc_score(p_base / price_a37, trend_indicator, int_1, int_2))
array.set(a_array, 37, f_calc_score(p_base / price_a38, trend_indicator, int_1, int_2))
array.set(a_array, 38, f_calc_score(p_base / price_a39, trend_indicator, int_1, int_2))
array.set(a_array, 39, f_calc_score(p_base / price_a40, trend_indicator, int_1, int_2))
a_array
Conditional Array Setting (f_arrayset):
This function checks if the number of used assets is greater than or equal to a specified number before populating the arrays.
// only set values into arrays for USED assets
f_arrayset(asset_number, a_array, p_base) =>
if (used_assets >= asset_number)
f_array_set(a_array, p_base)
else
na
Main Logic
The main logic initializes arrays to store scores for each asset. Each array corresponds to one asset's performance score.
Setting Trend Values: The code calls f_arrayset for each asset, populating the respective arrays with calculated scores based on the asset prices.
Combining Arrays: A combined_array is created to hold all the scores from individual asset arrays. This array facilitates further analysis, allowing for an overview of the performance scores of all assets at once.
// create a combined array (work-around since pinescript doesn't support having array of arrays)
var combined_array = array.new_int(40 * 40, 0)
if barstate.islast
for i = 0 to 39
array.set(combined_array, i, array.get(a1_array, i))
array.set(combined_array, i + (40 * 1), array.get(a2_array, i))
array.set(combined_array, i + (40 * 2), array.get(a3_array, i))
array.set(combined_array, i + (40 * 3), array.get(a4_array, i))
array.set(combined_array, i + (40 * 4), array.get(a5_array, i))
array.set(combined_array, i + (40 * 5), array.get(a6_array, i))
array.set(combined_array, i + (40 * 6), array.get(a7_array, i))
array.set(combined_array, i + (40 * 7), array.get(a8_array, i))
array.set(combined_array, i + (40 * 8), array.get(a9_array, i))
array.set(combined_array, i + (40 * 9), array.get(a10_array, i))
array.set(combined_array, i + (40 * 10), array.get(a11_array, i))
array.set(combined_array, i + (40 * 11), array.get(a12_array, i))
array.set(combined_array, i + (40 * 12), array.get(a13_array, i))
array.set(combined_array, i + (40 * 13), array.get(a14_array, i))
array.set(combined_array, i + (40 * 14), array.get(a15_array, i))
array.set(combined_array, i + (40 * 15), array.get(a16_array, i))
array.set(combined_array, i + (40 * 16), array.get(a17_array, i))
array.set(combined_array, i + (40 * 17), array.get(a18_array, i))
array.set(combined_array, i + (40 * 18), array.get(a19_array, i))
array.set(combined_array, i + (40 * 19), array.get(a20_array, i))
array.set(combined_array, i + (40 * 20), array.get(a21_array, i))
array.set(combined_array, i + (40 * 21), array.get(a22_array, i))
array.set(combined_array, i + (40 * 22), array.get(a23_array, i))
array.set(combined_array, i + (40 * 23), array.get(a24_array, i))
array.set(combined_array, i + (40 * 24), array.get(a25_array, i))
array.set(combined_array, i + (40 * 25), array.get(a26_array, i))
array.set(combined_array, i + (40 * 26), array.get(a27_array, i))
array.set(combined_array, i + (40 * 27), array.get(a28_array, i))
array.set(combined_array, i + (40 * 28), array.get(a29_array, i))
array.set(combined_array, i + (40 * 29), array.get(a30_array, i))
array.set(combined_array, i + (40 * 30), array.get(a31_array, i))
array.set(combined_array, i + (40 * 31), array.get(a32_array, i))
array.set(combined_array, i + (40 * 32), array.get(a33_array, i))
array.set(combined_array, i + (40 * 33), array.get(a34_array, i))
array.set(combined_array, i + (40 * 34), array.get(a35_array, i))
array.set(combined_array, i + (40 * 35), array.get(a36_array, i))
array.set(combined_array, i + (40 * 36), array.get(a37_array, i))
array.set(combined_array, i + (40 * 37), array.get(a38_array, i))
array.set(combined_array, i + (40 * 38), array.get(a39_array, i))
array.set(combined_array, i + (40 * 39), array.get(a40_array, i))
Calculating Sums: A separate array_sums is created to store the total score for each asset by summing the values of their respective score arrays. This allows for easy comparison of overall performance.
Ranking Assets: The final part of the code ranks the assets based on their total scores stored in array_sums. It assigns a rank to each asset, where the asset with the highest score receives the highest rank.
// create array for asset RANK based on array.sum
var ranks = array.new_int(used_assets, 0)
// for loop that calculates the rank of each asset
if barstate.islast
for i = 0 to (used_assets - 1)
int rank = 1
for x = 0 to (used_assets - 1)
if i != x
if array.get(array_sums, i) < array.get(array_sums, x)
rank := rank + 1
array.set(ranks, i, rank)
Dynamic Table Creation
Initialization: The table is initialized with a base structure that includes headers for asset names, scores, and ranks. The headers are set to remain constant, ensuring clarity for users as they interpret the displayed data.
Data Population: As scores are calculated for each asset, the corresponding values are dynamically inserted into the table. This is achieved through a loop that iterates over the scores and ranks stored in the combined_array and array_sums, respectively.
Automatic Extending Mechanism
Variable Asset Count: The code checks the number of assets defined by the user. Instead of hardcoding the number of rows in the table, it uses a variable to determine the extent of the data that needs to be displayed. This allows the table to expand or contract based on the number of assets being analyzed.
Dynamic Row Generation: Within the loop that populates the table, the code appends new rows for each asset based on the current asset count. The structure of each row includes the asset name, its score, and its rank, ensuring that the table remains consistent regardless of how many assets are involved.
// Automatically extending table based on the number of used assets
var table table = table.new(position.bottom_center, 50, 50, color.new(color.black, 100), color.white, 3, color.white, 1)
if barstate.islast
if not hide_head
table.cell(table, 0, 0, "Universal Ratio Trend Matrix", text_color = color.white, bgcolor = #010c3b, text_size = fontSize)
table.merge_cells(table, 0, 0, used_assets + 3, 0)
if not hide_inps
table.cell(table, 0, 1,
text = "Inputs: You are using " + str.tostring(trend_indicator) + ", which takes: " + str.tostring(f_get_input(trend_indicator)),
text_color = color.white, text_size = fontSize), table.merge_cells(table, 0, 1, used_assets + 3, 1)
table.cell(table, 0, 2, "Assets", text_color = color.white, text_size = fontSize, bgcolor = #010c3b)
for x = 0 to (used_assets - 1)
table.cell(table, x + 1, 2, text = str.tostring(array.get(assets, x)), text_color = color.white, bgcolor = #010c3b, text_size = fontSize)
table.cell(table, 0, x + 3, text = str.tostring(array.get(assets, x)), text_color = color.white, bgcolor = f_asset_col(array.get(ranks, x)), text_size = fontSize)
for r = 0 to (used_assets - 1)
for c = 0 to (used_assets - 1)
table.cell(table, c + 1, r + 3, text = str.tostring(array.get(combined_array, c + (r * 40))),
text_color = hl_type == "Text" ? f_get_col(array.get(combined_array, c + (r * 40))) : color.white, text_size = fontSize,
bgcolor = hl_type == "Background" ? f_get_col(array.get(combined_array, c + (r * 40))) : na)
for x = 0 to (used_assets - 1)
table.cell(table, x + 1, x + 3, "", bgcolor = #010c3b)
table.cell(table, used_assets + 1, 2, "", bgcolor = #010c3b)
for x = 0 to (used_assets - 1)
table.cell(table, used_assets + 1, x + 3, "==>", text_color = color.white)
table.cell(table, used_assets + 2, 2, "SUM", text_color = color.white, text_size = fontSize, bgcolor = #010c3b)
table.cell(table, used_assets + 3, 2, "RANK", text_color = color.white, text_size = fontSize, bgcolor = #010c3b)
for x = 0 to (used_assets - 1)
table.cell(table, used_assets + 2, x + 3,
text = str.tostring(array.get(array_sums, x)),
text_color = color.white, text_size = fontSize,
bgcolor = f_highlight_sum(array.get(array_sums, x), array.get(ranks, x)))
table.cell(table, used_assets + 3, x + 3,
text = str.tostring(array.get(ranks, x)),
text_color = color.white, text_size = fontSize,
bgcolor = f_highlight_rank(array.get(ranks, x)))

Adaptive RSI-Stoch with Butterworth Filter [UAlgo]The Adaptive RSI-Stoch with Butterworth Filter is a technical indicator designed to combine the strengths of the Relative Strength Index (RSI), Stochastic Oscillator, and a Butterworth Filter to provide a smooth and adaptive momentum-based trading signal. This custom-built indicator leverages the RSI to measure market momentum, applies Stochastic calculations for overbought/oversold conditions, and incorporates a Butterworth Filter to reduce noise and smooth out price movements for enhanced signal reliability.
By utilizing these combined methods, this indicator aims to help traders identify potential market reversal points, momentum shifts, and overbought/oversold conditions with greater precision, while minimizing false signals in volatile markets.
🔶 Key Features
Adaptive RSI and Stochastic Oscillator: Calculates RSI using a configurable period and applies a dual-smoothing mechanism with Stochastic Oscillator values (K and D lines).
Helps in identifying momentum strength and potential trend reversals.
Butterworth Filter: An advanced signal processing filter that reduces noise and smooths out the indicator values for better trend identification.
The filter can be enabled or disabled based on user preferences.
Customizable Parameters: Flexibility to adjust the length of RSI, the smoothing factors for Stochastic (K and D values), and the Butterworth Filter period.
🔶 Interpreting the Indicator
RSI & Stochastic Calculations:
The RSI is calculated based on the closing price over the user-defined period, and further smoothed to generate Stochastic Oscillator values.
The K and D values of the Stochastic Oscillator provide insights into short-term overbought or oversold conditions.
Butterworth Filter Application:
What is Butterworth Filter and How It Works?
The Butterworth Filter is a type of signal processing filter that is designed to have a maximally flat frequency response in the passband, meaning it doesn’t distort the frequency components of the signal within the desired range. It is widely used in digital signal processing and technical analysis to smooth noisy data while preserving the important trends in the underlying data. In this indicator, the Butterworth Filter is applied to the trigger value, making the resulting signal smoother and more stable by filtering out short-term fluctuations or noise in price data.
Key Concepts Behind the Butterworth Filter:
Filter Design: The Butterworth filter works by calculating weighted averages of current and past inputs (price or indicator values) and outputs to produce a smooth output. It is characterized by the absence of ripple in the passband and a smooth roll-off after the cutoff frequency.
Cutoff Frequency: The period specified in the indicator acts as a control for the cutoff frequency. A higher period means the filter will remove more high-frequency noise and retain longer-term trends, while a lower period means it will respond more to short-term fluctuations in the data.
Smoothing Process: In this script, the Butterworth Filter is calculated recursively using the following formula,
butterworth_filter(series float input, int period) =>
float wc = math.tan(math.pi / period)
float k1 = 1.414 * wc
float k2 = wc * wc
float a0 = k2 / (1 + k1 + k2)
float a1 = 2 * a0
float a2 = a0
float b1 = 2 * (k2 - 1) / (1 + k1 + k2)
float b2 = (1 - k1 + k2) / (1 + k1 + k2)
wc: This is the angular frequency, derived from the period input.
k1 and k2: These are intermediate coefficients used in the filter calculation.
a0, a1, a2: These are the feedforward coefficients, which determine how much of the current and past input values will contribute to the filtered output.
b1, b2: These are feedback coefficients, which determine how much of the past output values will contribute to the current output, effectively allowing the filter to "remember" past behavior and smooth the signal.
Recursive Calculation: The filter operates by taking into account not only the current input value but also the previous two input values and the previous two output values. This recursive nature helps it smooth the signal by blending the recent past data with the current data.
float filtered_value = a0 * input + a1 * prev_input1 + a2 * prev_input2
filtered_value -= b1 * prev_output1 + b2 * prev_output2
input: The current input value, which could be the trigger value in this case.
prev_input1, prev_input2: The previous two input values.
prev_output1, prev_output2: The previous two output values.
This means the current filtered value is determined by the combination of:
A weighted sum of the current input and the last two inputs.
A correction based on the last two output values to ensure smoothness and remove noise.
In conclusion when filter is enabled, the Butterworth Filter smooths the RSI and Stochastic values to reduce market noise and highlight significant momentum shifts.
The filtered trigger value (post-Butterworth) provides a cleaner representation of the market's momentum.
Cross Signals for Trade Entries:
Buy Signal: A bullish crossover of the K value above the D value, particularly when the values are below 40 and when the Stochastic trigger is below 1 and the filtered trigger is below 35.
Sell Signal: A bearish crossunder of the K value below the D value, particularly when the values are above 60 and when the Stochastic trigger is above 99 and the filtered trigger is above 90.
These signals are plotted visually on the chart for easy identification of potential trading opportunities.
Overbought and Oversold Zones:
The indicator highlights the overbought zone when the filtered trigger surpasses a specific threshold (typically above 100) and the oversold zone when it drops below 0.
The color-coded fill areas between the Stochastic and trigger lines help visualize when the market may be overbought (likely a reversal down) or oversold (potential reversal up).
🔶 Disclaimer
Use with Caution: This indicator is provided for educational and informational purposes only and should not be considered as financial advice. Users should exercise caution and perform their own analysis before making trading decisions based on the indicator's signals.
Not Financial Advice: The information provided by this indicator does not constitute financial advice, and the creator (UAlgo) shall not be held responsible for any trading losses incurred as a result of using this indicator.
Backtesting Recommended: Traders are encouraged to backtest the indicator thoroughly on historical data before using it in live trading to assess its performance and suitability for their trading strategies.
Risk Management: Trading involves inherent risks, and users should implement proper risk management strategies, including but not limited to stop-loss orders and position sizing, to mitigate potential losses.
No Guarantees: The accuracy and reliability of the indicator's signals cannot be guaranteed, as they are based on historical price data and past performance may not be indicative of future results.

ToxicJ3ster - Day Trading SignalsThis Pine Script™ indicator, "ToxicJ3ster - Signals for Day Trading," is designed to assist traders in identifying key trading signals for day trading. It employs a combination of Moving Averages, RSI, Volume, ATR, ADX, Bollinger Bands, and VWAP to generate buy and sell signals. The script also incorporates multiple timeframe analysis to enhance signal accuracy. It is optimized for use on the 5-minute chart.
Purpose:
This script uniquely combines various technical indicators to create a comprehensive and reliable day trading strategy. Each indicator serves a specific purpose, and their integration is designed to provide multiple layers of confirmation for trading signals, reducing false signals and increasing trading accuracy.
1. Moving Averages: These are used to identify the overall trend direction. By calculating short and long period Moving Averages, the script can detect bullish and bearish crossovers, which are key signals for entering and exiting trades.
2. RSI Filtering: The Relative Strength Index (RSI) helps filter signals by ensuring trades are only taken in favorable market conditions. It detects overbought and oversold levels and trends within the RSI to confirm market momentum.
3. Volume and ATR Conditions: Volume and ATR multipliers are used to identify significant market activity. The script checks for volume spikes and volatility to confirm the strength of trends and avoid false signals.
4. ADX Filtering: The ADX is used to confirm the strength of a trend. By filtering out weak trends, the script focuses on strong and reliable signals, enhancing the accuracy of trade entries and exits.
5. Bollinger Bands: Bollinger Bands provide additional context for the trend and help identify potential reversal points. The script uses Bollinger Bands to avoid false signals and ensure trades are taken in trending markets.
6. Higher Timeframe Analysis: This feature ensures that signals align with broader market trends by using higher timeframe Moving Averages for trend confirmation. It adds a layer of robustness to the signals generated on the 5-minute chart.
7. VWAP Integration: VWAP is used for intraday trading signals. By calculating the VWAP and generating buy and sell signals based on its crossover with the price, the script provides additional confirmation for trade entries.
8. MACD Analysis: The MACD line, signal line, and histogram are calculated to generate additional buy/sell signals. The MACD is used to detect changes in the strength, direction, momentum, and duration of a trend.
9. Alert System: Custom alerts are integrated to notify traders of potential trading opportunities based on the signals generated by the script.
How It Works:
- Trend Detection: The script calculates short and long period Moving Averages and identifies bullish and bearish crossovers to determine the trend direction.
- Signal Filtering: RSI, Volume, ATR, and ADX are used to filter and confirm signals, ensuring trades are taken in strong and favorable market conditions.
- Multiple Timeframe Analysis: The script uses higher timeframe Moving Averages to confirm trends, aligning signals with broader market movements.
- Additional Confirmations: VWAP, MACD, and Bollinger Bands provide multiple layers of confirmation for buy and sell signals, enhancing the reliability of the trading strategy.
Usage:
- Customize the input parameters to suit your trading strategy and preferences.
- Monitor the generated signals and alerts to make informed trading decisions.
- This script is made to work best on the 5-minute chart.
Disclaimer:
This indicator is not perfect and can generate false signals. It is up to the trader to determine how they would like to proceed with their trades. Always conduct thorough research and consider seeking advice from a financial professional before making trading decisions. Use this script at your own risk.

Altered Money Flow Index by CoffeeShopCrypto**Use the comments section below to request access to the script**
Market Trends need to be confirmed each and every time.
Over the years the Money Flow Index has been a tool to find where the money is flowing
either long or short in market movements.
Long confirmation and false short
Confirming a long entry:
1. Wait for price to close above a previous swing high.
2. Look to see if the MFI is in UPCOLOR and above ZERO.
Confriming a short entry:
1. Wait for price to close below a previous swing low.
2. Look to see if the MFI is in DOWNCOLOR and below ZERO.
NON-Confirmed market: (Flat Market)
Anytime you believe you have a confirmation via price action, check the MFI to see if it is in FLAT MARKET color.
If this is true, do not enter until it is out of FLAT MARKET color.
Flat Market ALtered MFI
A Flat Market Altered MFI reading can do a few things for you.
It can help to confirm the following:
1. price action is moving sideways.
2. a pullback or market stall that was deep enough where dis-intrest in the market occured.
3. a sudden loss of momentum in the short term trend of closing prices.
Utilizing the Altered Money Flow Index indicator by CoffeeShopCrypto offers traders a nuanced approach to identifying market trends, including periods of flat market conditions. Alongside its directional bias indicating bullish or bearish activity based on whether values are above or below zero, respectively, the script incorporates a distinctive feature to recognize flat markets. When neither bullish nor bearish momentum dominates, the indicator designates a flat market, denoted by a distinct color. This feature enhances traders' ability to discern not only bullish and bearish phases but also periods of market consolidation or indecision.
In addition to its ability to recognize bullish and bearish trends, the Altered Money Flow Index indicator by CoffeeShopCrypto incorporates a unique feature to signify potential pullbacks or pauses in market momentum. This is particularly evident when the MFI crosses below zero while displaying a flat market color. Such occurrences suggest that although the short-term movement may appear bearish, it's likely a temporary pullback rather than a sustained trend reversal. Similarly, when the MFI crosses above zero amidst a flat market color, it indicates a potential pause in bullish momentum, urging traders to exercise caution and await confirmation of a sustained uptrend. By incorporating these nuanced observations, traders can effectively discern between short-term fluctuations and significant trend changes, enabling them to make more judicious trading decisions and avoid premature entries or exits.
Alongside its directional bias indicating bullish or bearish activity based on whether values are above or below zero, respectively, the script integrates the Relative Strength Index (RSI) to further refine market analysis. When the Altered MFI and RSI are both above zero, it suggests a strong bullish trend, indicating significant buying pressure. Conversely, when both indicators are below zero, it indicates a strong bearish trend, signifying heightened selling pressure. By observing the confluence between the Altered MFI and RSI, traders can gain valuable confirmation of bullish or bearish money flow in the market, enabling them to make more informed trading decisions.