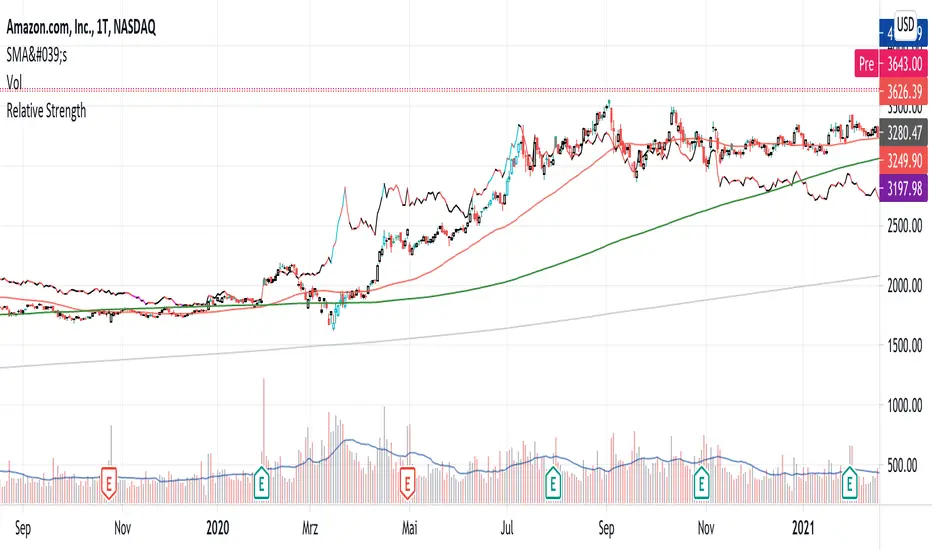
Relative StrengthPowerful tool to calculate and display the strength of a security compared to another security.
Some Main purposes are:
- finding new leadership in a market correction
- comparing a market leader with a top competitor
- tracking rotation in the market
.. and so much more!
This tool is highly configurable, you can especially change:
- The reference symbol (SPY, QQQ, BTCUSD, ...)
- The time span to indicate a new High or Low in a certain time-frame
- Factorize your RS-Chart to make it fit to the original chart. (Moves the chart up or down)
- Option to repaint your candles / bars when a new RS High occurs in the given timeframe.
Enjoy and have a great day!
Powerful_Trading
Cari dalam skrip untuk "Relative"
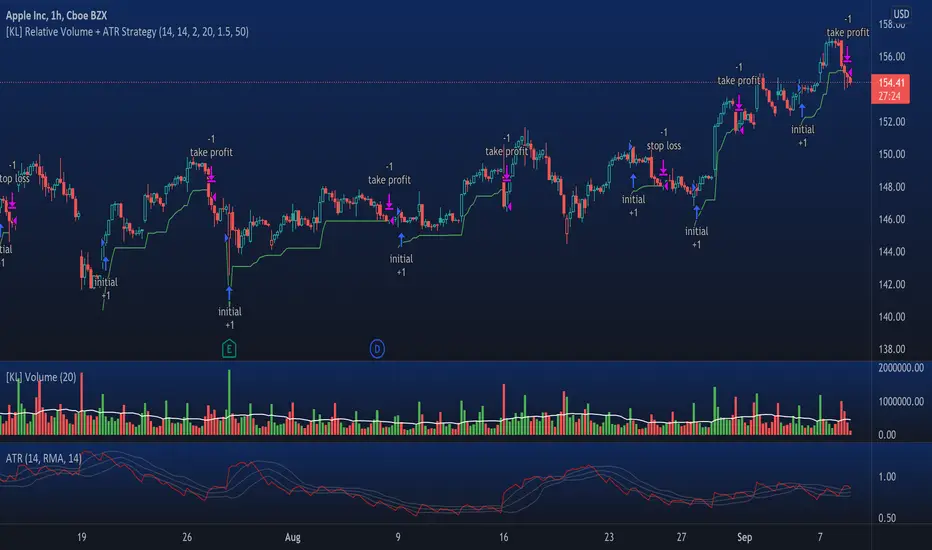
[KL] Relative Volume + ATR StrategyThis strategy will enter into long position when (a) current volume is above the average volume, and when (b) volatility of prices (based on ATR) is relatively low.
Backtested on hourly timeframes, win rates range between 35% to 50% on stocks with positive drifts (i.e. tendency to move upwards). Default setups are as follows:
- Average volume is computed using simple moving average (sma) of 14 periods. By default, 1.4x ratio seems to work well on most large cap stocks. If it's too high, then amount of potential points for entry will decrease. But if it's too low, then this indicator becomes meaningless.
- ATR (for determining volatility), look back period is 14 (following conventions). I have noticed that the profits could change drastically when changed to different values for each individually security. Feel free to experiment around with this parameter.
Other information: This strategy is based off of one of my previous scripts; a script called "Relatively Volume Strategy". The objective of this new script is to simplify the process of determining periods of low volatility. In this new script, we assume prices are consolidating when current ATR is within its moving average value by +/- one standard deviation.
[KL] Relative Volume StrategyThis strategy will Long when:
Confirmation #1: when volume is relatively high
Confirmation #2: during periods of price consolidation (See )
It exits when either (a) stop loss limit is reached, or when (b) price actions suggest trend is bearish.
Measuring price volatility to assume consolidation:
For each candlestick, we quantify price volatility by referring to the value of standard deviations (2x) of closing prices over a look-back period of 20 candles. This is exactly what the Bollinger Band (“BOLL”) indicates by default.
Knowing the value of standard deviation (2x) of prices (aka the width of lower/upper BOLL bands), we then compare it with ATR (x2) over a user-defined length (can be configured in settings). Volatility is considered to be low, relatively, when the standard deviation (x2) of prices is less than ATR (2x).

Relative Strength Index w/ STARC Bands and PivotsThis is an old script that I use with some useful RSI strategies from "Technical Analysis for the Trading Professional" 2nd edition by Constance Brown.
The base RSI comes with the option for custom length, and has some pre-configured ranges for looking at exits and entrances. The idea is to be bullish when bounces happen in the red zone during an already bullish trend or when the indicator enters green without a rejection. Be bearish if the indicator falls through the red zone or fails to enter green during an already bearish trend.
I have added the formulas used for creating STARC bands (just think fancier volatility bands) with adjustable tolerances. The idea is to look out for when the RSI touches one of the bands and reverses. This is usually indicative of a strong reversal (though the timing will be up to the trader). Best use this on shorter time frames during a volatile time of a stock's price action.
Although a little messy, there is a small segment of the script which includes pivot points. I like to use these because they make indicating local highs/lows for finding divergences easier.
Finally, I have added a couple of customizable EMAS for the RSI itself. Useful when combined with the other features!

Relative Strength Improved (Premal Parekh ASR Version)This script is improved over the existing script developed by Mr. modhelius
I have added ASR Concept of Mr. Premal Parekh.
This script will remove manual calculation of Trading Days from ASR Date.

Reverse Relative Strength Indicator [CC]The Reverse Relative Strength Index was created by Giorgos Siligardos (Stocks & Commodities V. 21:6 (18-30)). It is a handy indicator that reverse engineers the RSI price calculation to show what the price would have to be for the RSI value to match our chosen input. You can select your chosen RSI level using the RSI Level input for this indicator. For example if you wanted to see what the price would be for the RSI value to match the oversold level then you would set the RSI Level for 30 and it will plot that price on the chart. This uses some simple math to extrapolate the price with some basic algebra from the typical RSI calculation. This, of course, is a very similar concept to my previous Reverse Moving Average Convergence Divergence script. This indicator formula can be used for any oscillator with some slight tweaking and could also be customized to show the price for overbought and oversold levels, which I will probably do in the near future. This indicator is useful in many ways such as a trend indicator as my example shows or for a price projection tool. For example, if you had a current RSI level of 66 and it was going up and you want to see what the price would be if it reached the overbought level then you could do that. Let me know what works well for you and if you have any suggestions for how to further improve upon this script. I have included darker colors to show stronger signals and lighter colors to show normal signals. Buy when the line turns green and sell when it turns red.
I have a bunch of backlogged scripts that I'm trying to publish, so I figured I would focus on my RSI scripts since I have a bunch, so be prepared to see a bunch of those over the next week or so. Let me know if there are any other scripts you would like to see me publish!

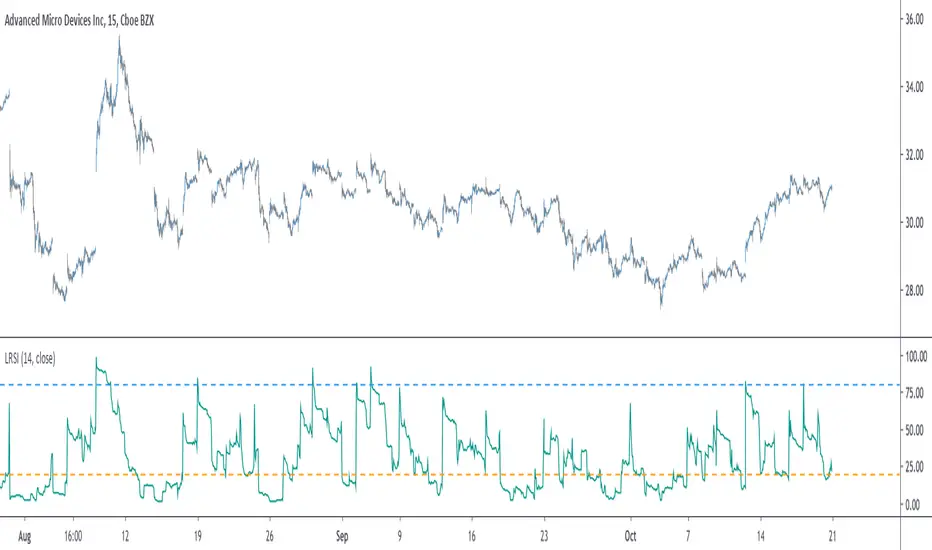
Liquid RSI - Marrying The Relative Strength Index And The VolumeIntroduction
I recently derived the calculation of the relative strength index, an indicator that aim to spot overbought and oversold assets, but what is an overbought/sold asset ? Can such things be estimated with price alone ?
This why i propose a modification of the relative strength using my recently proposed efficient calculation including volume information in order to spot overbought/sold asset.
Scaling A Liquid Market
The relative strength index detect an overbought/sold asset when higher/lower than a certain level, often 80/20. An overbought asset, or better say over evaluated, is more attractive to sell because prices are no longer attractive to buy, it has reached its value of interest for traders looking to go long, we can then expect the price to correct and start a trend of opposite direction, while an oversold asset is more attractive to buy based on the same logic.
The idea of talking about over bought and over sold without taking into account the volume can be a bit strange, since volume is directly related to the quantity of contracts traded, an higher volume can show sign of a more active market, which can describe the terms : overbought/sold a bit better. Many indicators used the rsi framework with volume, the money flow index for example, but it can be interesting to provide other alternatives.
The Indicator
The indicator is based on the average positive changes in price multiplied by positive changes in volume divided by the average absolute change in price multiplied by the absolute changes in volume. The average is based on the wilder moving average which is a simple exponential filter with smoothing constant 1/length .
The indicator will react according to the volume magnitude, higher volumes will make the indicator go over/under the overbought/sold threshold more easily, in the image above, the indicator is currently saying that the market is under evaluated, which is not the case for the RSI. Such situation allow us to take a position that we could't take if we base our judgement only on price change magnitude.
The indicator has a tendency to be over/under the thresholds a longer period of time if the volume is relatively high.
An interesting effect the indicator has it to ignore movements with moderate volume, the indicator is less prone to cross under a threshold and to go back to it, this is shown in the image above. Another observation we can make is that the proposed indicator is smoother than the rsi, this is certainly due to the fact that the volume underweight small price changes.
Conclusions
I proposed a modification of the relative strength index that also take into account volume information. The proposed indicator is also smoother. Regarding its ability to detect overbought and oversold market, it has indeed the capacity to do it, however the problem remain the same, what is the extent of the correction following an overbought/oversold market ? We can see that the correction can be minor, and thus be followed by a large movements correlated with the main trend.
With those oscillators we are interested into knowing the end of the "whole trend", and they fail to do this because they use past information. I still hope the indicator find some creative usages amongst the community.
Thanks for reading ! And remember to ask before using the script code, it pains me to see minor changes on scripts i can pass 3 hours on.
TechniTrend: Relative Volume IndexRelative Volume Index (RVI)
Short Description:
Relative Volume Index (RVI) with customizable volume bands, moving averages, and alerts for high and low volume thresholds. Includes options for displaying daily and weekly relative volume for enhanced analysis.
Full Description:
The Relative Volume Index is a powerful and versatile tool designed to help traders easily identify volume trends and anomalies in the market. By comparing the current volume to its moving average, this indicator highlights significant increases or decreases in relative volume, allowing traders to catch potential breakouts, breakdowns, or volume spikes early on.
Key Features:
Relative Volume Comparison : Compares the current volume to the moving average volume over a customizable period, highlighting overbought and oversold conditions.
Volume Alerts : Customizable alert thresholds for high and low relative volume to quickly notify traders when volume exceeds predefined limits.
Custom Moving Averages : Choose from various moving average types (SMA, EMA, WMA) to calculate the average volume over a given length.
Volume Normalization : For better readability, volumes greater than 1000 are divided by 1000 and displayed with a 'K' suffix (thousands).
Volume Bands : Configurable high, average, and low volume bands for visual reference.
Daily Relative Volume : Option to display the daily relative volume in comparison to its daily average.
Weekly Average Volume : Option to display the weekly average volume for broader market trends.
Customization Options:
Length : Customize the period for calculating the moving average.
Volume Moving Average : Toggle to show/hide the volume moving average (normalized in 'K').
Alerts : Set thresholds for high and low volume alerts and configure alerts for immediate notification.
Volume Bands : Toggle to show/hide volume bands for easy visual identification of volume zones.
Daily/Weekly Relative Volume : Optional display of relative volume data on a daily and weekly basis.
This indicator provides traders with a more intuitive view of market volume dynamics, making it easier to spot significant volume changes and take action accordingly.
Recommended Settings:
High Volume Alert Threshold: 2.0
Low Volume Alert Threshold: 0.5
Length for Moving Average Calculation: 14
Show Weekly Average Volume: On for broader trend insights
Use this indicator to stay ahead of market moves by monitoring volume trends with precision.
Alerts:
High Volume Alert : Get notified when relative volume exceeds your high threshold.
Low Volume Alert : Get notified when relative volume drops below your low threshold.

Volume RSIRelative strength index based on volume data.
Indicate volume momentum, and help you define divergences on volume.
The goal is to have an idea and represent in another form volumes and kept eyes on volume momentum on a certain period.
RSI is an indicator about the strength, I keep the oversold/overbought thresholds. I think it still makes sense to interpret.
the calculations is simple, we use the average volume up (avg_vol_up) and average volume down (avg_vol_down) over the period.
then calculate the relatives strength : ( avg_vol_up / ( avg_vol_up + avg_vol_down ) ) * 100
The period is 14 by default. The period is used for calculating mean.
I also add MA it helps to have a global look on the indicator.
In my code I used the idea of @Padronhosnai in his code "positve/negative volume" to get volumes in the right form.
For pictures I also use his indicator it's the one above.

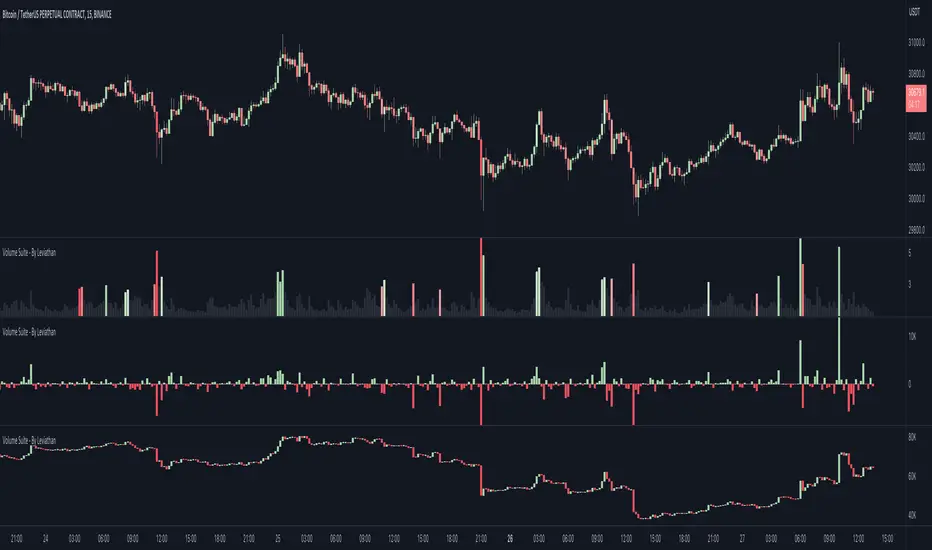
Volume Suite - By Leviathan (CVD, Volume Delta, Relative Volume)Volume Suite is an all-in-one script that includes several volume-based indicators such as CVD, Volume Delta, Relative Volume, Buy/Sell Volume, Cumulative Relative Volume and more. Additionally, it offers fully customisable appearance and features for improved data visualization, such as highlights for high volume activity, small price changes with high volume, or large price changes with low volume and more.
Data available in version 1:
- Volume Delta
Volume Delta is the net difference between Buy Volume and Sell Volume at a given bar. Positive Delta indicates that Buy Volume > Sell Volume, while Negative Delta means that Sell Volume > Buy Volume. As there is not way to get tick data on Tradingview, calculating Volume Delta is improvised by using the direction of lower timeframe candles and their volume.
- Cumulative Volume Delta (CVD)
CVD is a running total/cumulation of Volume Delta values, where positive VD gets added to the sum and negative VD gets subtracted from the sum. It can be used for trend strength analysis, divergence strategies, sentiment, etc.
- Buy/Sell Volume
Buy and Sell Volume provides an insight into volume activity in a given bar by estimating the buying/selling volume based on the direction of lower timeframe candles and their volume.
- Relative Volume
Relative Volume is used to compare current trading volume to past trading volume over a given period. For instance, a relative volume of 1.0 indicates that volume is at an average level, while a relative volume of 2.0 suggests that the volume is twice as high as the average.
- Cumulative Relative Volume (CRVOL)
CRVOL is a running total/cumulation of Relative Volume values, where RVOL at close>open gets added to the sum and RVOL at close
Strategy - Relative Volume GainersStrategy - Relative Volume Gainers
Overview:
This trading strategy, called "Relative Volume Gainers," is designed for Long Entry opportunities in the stock market. The strategy aims to identify potential trading candidates based on specific technical conditions, including volume, price movements, and indicator alignments.
Strategy Rules:
The strategy is focused solely on Long Entry positions.
The volume for the current trading day must be greater than or equal to the volume of the previous day.
The percentage change in price must be greater than or equal to 2.5%.
The Last Traded Price (LTP) must be greater than or equal to the Exponential Moving Average (EMA) 200.
The Relative Volume for the current trading day (calculated over the last 30 days) must be greater than or equal to the Simple Moving Average (SMA) of Relative Volume over the same 30 days.
The current candle on the chart should be Green or Bullish, indicating positive price movement.
The price difference between bid and ask prices should be kept to a minimum.
It's recommended to also analyze market depth for better insights.
Strategy Requirements:
Add the Exponential Moving Average (EMA) 200 to your trading chart.
This strategy can be applied on charts of any timeframe.
For intraday trading, particularly for early entry, consider using a 1-minute timeframe.
It is advisable to create a screener to identify potential trades in real-time market conditions.
Risk Warning:
Stocks that meet the strategy criteria might exhibit high volatility and a high beta, making them inherently risky to trade. Exercise caution and adhere to predetermined risk management strategies.
Determine your trading quantity based on your entry price and stop loss in order to manage risk effectively.
Quantity Calculation Formula:
Quantity calculation is crucial to manage risk and position sizing. The following formulas can be used based on your trading scenario:
Quantity with Leverage:
Quantity = (((Using Capital / 100) * Risk Percent) / (Entry Price - Stop Loss)) * Leverage
Eg: Quantity = (((10000 / 100) * 0.2) / (405.5 - 398.5)) * 5
Quantity = 14
Risk = Rs.100 (Rs.100 is 1% of Rs.10000. So the risk is 1%, means we lose only Rs.100 when the SL is hit. If SL is increased the Quantity will get reduced to maintain a fixed risk of Rs.100)
Quantity without Leverage:
Quantity = (((Using Capital / 100) * Risk Percent) / (Entry Price - Stop Loss))
Note:
Always stay informed about market conditions and be prepared for potential rapid price movements when trading stocks that meet the strategy criteria. Strictly adhere to your predefined risk management strategy to safeguard your capital.

RVol+ Enhanced Relative Volume Indicator📊 RVol+ Enhanced Relative Volume Indicator
Overview
RVol+ (Relative Volume Plus) is an advanced time-based relative volume indicator designed specifically for swing traders and breakout detection. Unlike simple volume comparisons, RVol+ analyzes volume at the same time of day across multiple sessions, providing statistically significant insights into institutional activity and breakout potential.
🎯 Key Features
Core Volume Analysis
Time-Based RVol Calculation - Compares current cumulative volume to the average volume at this exact time over the past N days
Statistical Z-Score - Measures volume in standard deviations from the mean for true anomaly detection
Volume Percentile - Shows where current volume ranks historically (0-100%)
Sustained Volume Filter - 3-bar moving average prevents false signals from single-bar spikes
Breakout Detection
🚀 Confirmed Breakouts - Identifies price breakouts validated by high volume (RVol > 1.5x)
⚠️ False Breakout Warnings - Alerts when price breaks key levels on low volume (high failure risk)
Multi-Timeframe Context - Weekly volume overlay prevents chasing daily noise
Advanced Metrics
OBV Divergence Detection - Spots bullish/bearish accumulation/distribution patterns
Volume Profile Integration - Identifies institutional positioning
Money Flow Analysis - Tracks smart money vs retail activity
Extreme Volume Alerts - 🔥 Labels mark unusual spikes beyond the display cap
Visual Intelligence
Smart Color Coding:
🟢 Bright Teal = High activity (RVol ≥ 1.5x)
🟡 Medium Teal = Caution zone (RVol ≥ 1.2x)
⚪ Light Teal = Normal activity
🟠 Orange = Breakout confirmed
🔴 Red = False breakout risk
Comprehensive Stats Table:
Current Volume (formatted as M/K/B)
RVol ratio
Z-Score with significance
Volume percentile
Historical average and standard deviation
Sustained volume confirmation
📈 How to Use
For Swing Trading (1D - 3W Holds)
Perfect Setup:
✓ RVol > 1.5x (bright teal)
✓ Z-Score > 2.0 (⚡ alert)
✓ Percentile > 90%
✓ Sustained = ✓
✓ 🚀 Breakout label appears
Avoid:
✗ Red "Low Vol" warning during breakouts
✗ RVol < 1.0 at key levels
✗ Sustained volume not confirmed
Signal Interpretation
⚡ Z>2 Labels - Statistically significant volume (95th+ percentile) - highest probability moves
↗️ OBV+ Labels - Bullish accumulation (OBV rising while price consolidates)
↘️ OBV- Labels - Bearish distribution (OBV falling while price rises)
🔵 Blue Background - Weekly volume elevated (confirms daily strength)
⚙️ Customization
Basic Settings
N Day Average - Number of historical days for comparison (default: 5)
RVol Thresholds - Customize highlight levels (default: 1.2x, 1.5x)
Visual Display Cap - Prevent extreme spikes from compressing view (default: 4.0x)
Advanced Metrics (Toggle On/Off)
Z-Score analysis
Weekly RVol context
OBV divergence detection
Volume percentile ranking
Breakout signal generation
Table Customization
Position - 9 placement options to avoid chart overlap
Size - Tiny to Huge
Colors - Full customization of positive/negative/neutral values
Transparency - Adjustable background
Debug Mode
Enable Pine Logs for calculation transparency
Adjustable log frequency
Real-time calculation breakdown
🔬 Technical Details
Algorithm:
Binary search for historical lookups (O(log n) performance)
Time-zone aware session detection
DST-safe timestamp calculations
Exponentially weighted standard deviation
Anti-repainting architecture
Performance:
Optimized for max_bars_back = 5000
Efficient array management
Built-in function optimization
Memory-conscious data structures
📊 What Makes RVol+ Different?
vs. Standard Volume:
Context-aware (time-of-day matters)
Statistical significance testing
False breakout filtering
vs. Basic RVol:
Z-Score normalization (2-3 sigma detection)
Multi-timeframe confirmation
OBV divergence integration
Sustained volume filtering
Smart visual scaling
vs. Professional Tools:
Free and open-source
Fully customizable
No black-box algorithms
Educational debug logs
💡 Best Practices
Wait for Confirmation - Don't enter on first bar; wait for sustained volume ✓
Combine with Price Action - RVol validates, price structure determines entry
Weekly Context Matters - Blue background = institutional interest
Z-Score is King - Focus on ⚡ alerts for highest probability
Avoid Low Volume Breakouts - Red ⚠️ labels = high failure risk
🎓 Trading Psychology
Volume precedes price. When RVol+ shows:
High RVol + Rising OBV = Accumulation before breakout
High RVol at Resistance = Test of conviction
Low RVol on Breakout = Retail-driven (fade candidate)
Z-Score > 3 = Potential "whale" positioning
📝 Credits
Based on the time-based RVol concept from /u/HurlTeaInTheSea, enhanced with:
Statistical analysis (z-scores, percentiles)
Multi-timeframe integration
OBV divergence detection
Professional-grade visualization
Swing trading optimization
🔧 Version History
v2.0 - Enhanced Edition
Added Z-Score analysis
Multi-timeframe volume context
OBV divergence detection
Breakout confirmation system
Smart color coding
Customizable stats table
Debug logging mode
Performance optimizations
📚 Learn More
For optimal use with swing trading:
Combine with support/resistance levels
Watch for volume clusters in consolidation
Use weekly timeframe for trend confirmation
Monitor OBV divergence for early warnings
⚠️ Disclaimer
This indicator is for educational purposes. Volume analysis is one component of trading decisions. Always use proper risk management, consider multiple timeframes, and validate signals with price structure. Past performance does not guarantee future results.
🚀 Getting Started
Add indicator to chart
Adjust "N Day Average" to your preference (5-10 days typical)
Position stats table to avoid overlap
Enable features you want to monitor
Watch for 🚀 breakout confirmations!
Happy Trading! 📈

Sector Relative Strength [Afnan]This indicator calculates and displays the relative strength (RS) of multiple sectors against a chosen benchmark. It allows you to quickly compare the performance of various sectors within any global stock market. While the default settings are configured for the Indian stock market , this tool is not limited to it; you can use it for any market by selecting the appropriate benchmark and sector indices.
📊 Key Features ⚙️
Customizable Benchmark: Select any symbol as your benchmark for relative strength calculation. The default benchmark is set to `NSE:CNX100`. This allows for global market analysis by selecting the appropriate benchmark index of any country.
Multiple Sectors: Analyze up to 23 different sector indices. The default settings include major NSE sector indices. This can be customized to any market by using the relevant sector indices of that country.
Individual Sector Control: Toggle the visibility of each sector's RS on the chart.
Color-Coded Plots: Each sector's RS is plotted with a distinct color for easy identification.
Adjustable Lookback Period: Customize the lookback period for RS calculation.
Interactive Table: A sortable table displays the current RS values for all visible sectors, allowing for quick ranking.
Table Customization: Adjust the table's position, text size, and visibility.
Zero Line: A horizontal line at zero provides a reference point for RS values.
🧭 How to Use 🗺️
Add the indicator to your TradingView chart.
Select your desired benchmark symbol. The default is `NSE:CNX100`. For example, use SPY for the US market, or DAX for the German market.
Adjust the lookback period as needed.
Enable/disable the sector indices you want to analyze. The default includes major NSE sector indices like `NSE:CNXIT`, `NSE:CNXAUTO`, etc.
Customize the table's appearance as needed.
Observe the RS plots and the table to identify sectors with relative strength or weakness.
📝 Note 💡
This indicator is designed for sectorial analysis. You can use it with any market by selecting the appropriate benchmark and sector indices.
The default settings are configured for the Indian stock market with `NSE:CNX100` as the benchmark and major NSE sector indices pre-selected.
The relative strength calculation is based on the price change of the sector index compared to the benchmark over the lookback period.
Positive RS values indicate relative outperformance, while negative values indicate relative underperformance.
👨💻 Developer 🛠️
Afnan Tajuddin

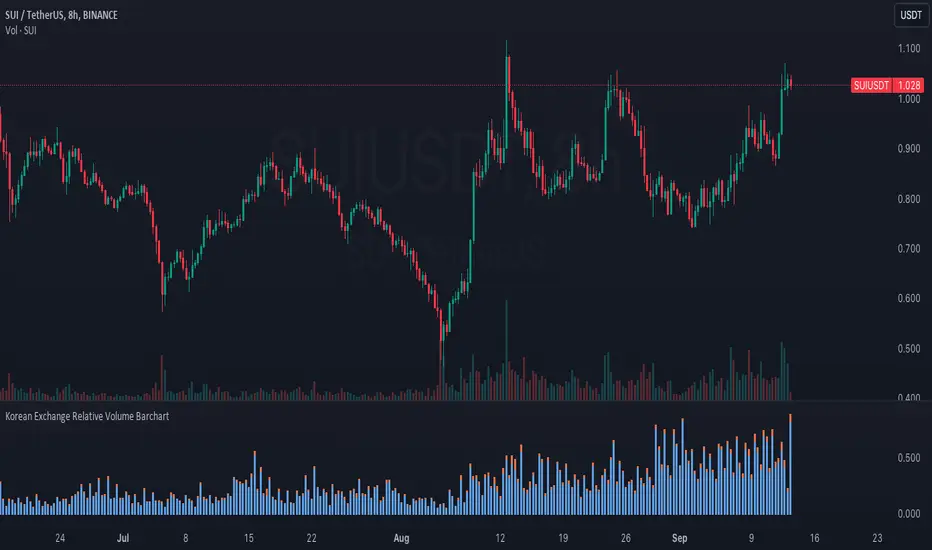
Korean Exchange Relative Volume BarchartKorean Exchange Relative Volume Barchart
The Korean Exchange Relative Volume Barchart indicator compares the trading volume of a cryptocurrency on any symbol with the combined volumes of major Korean exchanges, Upbit and Bithumb. This tool helps traders understand regional trading activities, offering insights into market sentiment influenced by Korean markets.
For example 0.5 would indicate that the Korean exchanges are doing 50% of the volume of the selected symbol.
Features:
Exchange Selection: Include or exclude Upbit and Bithumb in the comparison.
Automatic Symbol Mapping: Automatically maps the current chart's symbol to equivalent symbols on Upbit and Bithumb.
Stacked Bar Chart Visualization: Plots a stacked bar chart showing the relative volume contributions of Binance, Upbit, and Bithumb.
Usage:
Add the Indicator: Apply it to a cryptocurrency chart on TradingView.
Configure Settings: Toggle inclusion of Upbit and Bithumb in the settings.
Interpret the Chart: The stacked bar chart displays the proportion of trading volumes from each exchange.
Notes:
Symbol Compatibility: Ensure the cryptocurrency is listed on the Korean exchanges for accurate comparison.
Data Accuracy: Volumes are compared in the same base currency (e.g., BTC), so no exchange rate conversion is necessary.
Enhance your trading analysis by understanding the influence of Korean exchanges on cryptocurrency volumes with the Korean Exchange Volume Comparison indicator.
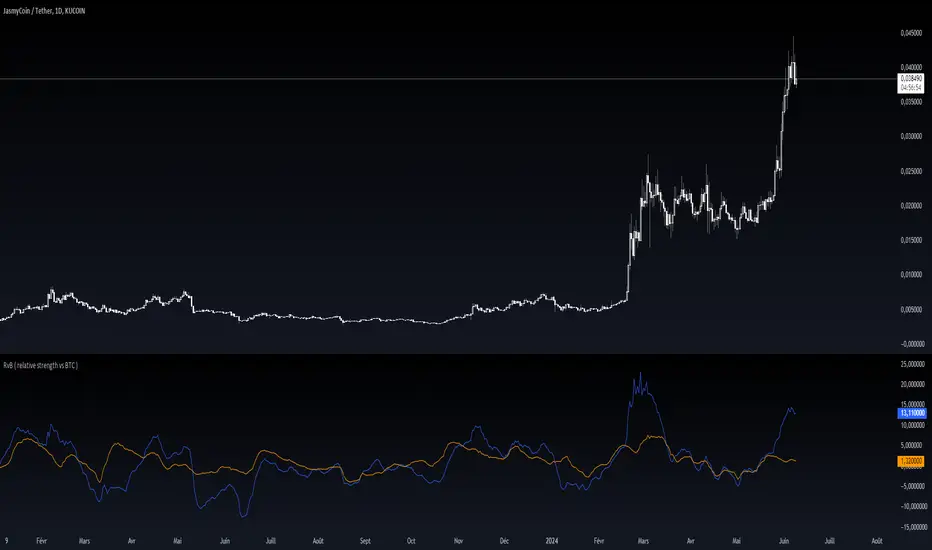
RvB ( relative strength vs BTC ) Overview
The "Coin vs BTC" indicator is designed to compare the performance of a selected cryptocurrency against Bitcoin (BTC) using Exponential Moving Averages (EMAs). By plotting the difference in EMA values as a percentage, this indicator helps traders visualize the relative strength of a cryptocurrency compared to Bitcoin over specified periods.
How It Works
EMA Calculation: The indicator calculates two EMAs (lengths specified by the user) for both the selected cryptocurrency and Bitcoin (BTC).
Length 1: Fast EMA (default: 9)
Length 2: Slow EMA (default: 21)
Score Calculation:
For both the selected coin and Bitcoin, it computes a score representing the percentage difference between the fast and slow EMAs relative to the previous closing price. This is done using the following steps:
Calculate the difference between the fast and slow EMAs.
Compute the percentage of this difference relative to the previous closing price.
Round the percentage to two decimal places for clarity.
Plotting: The scores for both the selected cryptocurrency and Bitcoin are plotted on the same chart:
Coin Score: Displayed in blue.
BTC Score: Displayed in orange.
Potential Uses
Relative Strength Analysis:
This indicator helps traders compare the strength of a cryptocurrency against Bitcoin. A higher score for the selected coin compared to Bitcoin indicates it is performing better relative to its moving averages.
Trend Confirmation:
By observing the EMA differences, traders can confirm trends and potential reversals. Consistently higher scores may indicate a strong upward trend, while lower scores could suggest a weakening trend.
Market Comparison:
This tool is particularly useful for those looking to understand how their selected cryptocurrency is performing in the broader market context, especially in relation to Bitcoin, which is often considered a market benchmark.
[blackcat] L2 Ehlers Relative Vigor IndexLevel: 2
Background
John F. Ehlers introuced Relative Vigor Index in his "Cybernetic Analysis for Stocks and Futures" chapter 6 on 2004.
Function
Relative Vigor Index (RVI) uses concepts dating back over three decades and also uses modern filter and digital signal processing theory to realize those concepts as a practical and useful indicator. The RVI merges the old concepts with the new technologies. The basic idea of the RVI is that prices tend to close higher than
they open in up markets and tend to close lower than they open in down markets. The vigor of the move is thus established by where the prices reside at the end of the day. To normalize the index to the daily trading range, the change in price is divided by the maximum range of prices for the day.
The RVI is an oscillator, and we are therefore only concerned with the cycle modes of the market in its use. The sharpest rate of change for a cycle is at its midpoint. Therefore, in the ascending part of the cycle we would expect the difference between the close and open to be at a maximum. This is like a derivative in calculus, where the derivative of a sinewave produces a negative cosine wave. The derivative is therefore a waveform that leads the original sinewave by a quarter cycle. Also, from calculus, integration of a sinewave over a half-cycle period results in another sinewave delayed by a quarter cycle. Summing over a half cycle is basically the same as mathematically integrating, with the result that the waveshape of the sum is delayed by a quarter wavelength relative to the input. The net result of taking the differences and summing produces an oscillator output in phase with the cyclic component of the price. It is also possible to generate a leading function if the summation window is less than a half wavelength of the Dominant Cycle. If a cycle measurement is not available, you can sum the RVI components over a fixed default period. A nominal value of 8 is suggested because this is approximately half the period of most cycles of interest.
Key Signal
RVI ---> Relative Vigor Index fast line
Trigger ---> Relative Vigor Index slow line
Pros and Cons
100% John F. Ehlers definition translation of original work, even variable names are the same. This help readers who would like to use pine to read his book. If you had read his works, then you will be quite familiar with my code style.
Remarks
The 27th script for Blackcat1402 John F. Ehlers Week publication.
Readme
In real life, I am a prolific inventor. I have successfully applied for more than 60 international and regional patents in the past 12 years. But in the past two years or so, I have tried to transfer my creativity to the development of trading strategies. Tradingview is the ideal platform for me. I am selecting and contributing some of the hundreds of scripts to publish in Tradingview community. Welcome everyone to interact with me to discuss these interesting pine scripts.
The scripts posted are categorized into 5 levels according to my efforts or manhours put into these works.
Level 1 : interesting script snippets or distinctive improvement from classic indicators or strategy. Level 1 scripts can usually appear in more complex indicators as a function module or element.
Level 2 : composite indicator/strategy. By selecting or combining several independent or dependent functions or sub indicators in proper way, the composite script exhibits a resonance phenomenon which can filter out noise or fake trading signal to enhance trading confidence level.
Level 3 : comprehensive indicator/strategy. They are simple trading systems based on my strategies. They are commonly containing several or all of entry signal, close signal, stop loss, take profit, re-entry, risk management, and position sizing techniques. Even some interesting fundamental and mass psychological aspects are incorporated.
Level 4 : script snippets or functions that do not disclose source code. Interesting element that can reveal market laws and work as raw material for indicators and strategies. If you find Level 1~2 scripts are helpful, Level 4 is a private version that took me far more efforts to develop.
Level 5 : indicator/strategy that do not disclose source code. private version of Level 3 script with my accumulated script processing skills or a large number of custom functions. I had a private function library built in past two years. Level 5 scripts use many of them to achieve private trading strategy.
Price Relative / Relative StrengthThe Price Relative indicator compares the performance of one security to another with a ratio chart. This indicator is also known as the Relative Strength indicator or Relative Strength Comparative. Often, the Price Relative indicator is used to compare the performance of a stock against a benchmark index, S&P 500, BIST:XU100 etc.
Chartists can also use the Price Relative to compare the performance of a stock to its sector or industry group. This makes it possible to determine if a stock is leading or lagging its peers. The Price Relative indicator can also be used to find stocks that are holding up better during a broad market decline or showing weakness during a broad market advance. (Source: stockcharts)
This also can be used for Trend Identification and Bullish/Bearish Divergences.
Good Luck

Stock Relative Strength Rotation Graph🔄 Visualizing Market Rotation & Momentum (Stock RSRG)
This tool visualizes the sector rotation of your watchlist on a single graph. Instead of checking 40 different charts, you can see the entire market cycle in one view. It plots Relative Strength (Trend) vs. Momentum (Velocity) to identify which assets are leading the market and which are lagging.
📜 Credits & Disclaimer
Original Code: Adapted from the open-source " Relative Strength Scatter Plot " by LuxAlgo.
Trademark: This tool is inspired by Relative Rotation Graphs®. Relative Rotation Graphs® is a registered trademark of JOOS Holdings B.V. This script is neither endorsed, nor sponsored, nor affiliated with them.
📊 How It Works (The Math)
The script calculates two metrics for every symbol against a benchmark (Default: SPX):
X-Axis (RS-Ratio): Is the trend stronger than the benchmark? (>100 = Yes)
Y-Axis (RS-Momentum): Is the trend accelerating? (>100 = Yes)
🧩 The 4 Market Quadrants
🟩 Leading (Top-Right): Strong Trend + Accelerating. (Best for holding).
🟦 Improving (Top-Left): Weak Trend + Accelerating. (Best for entries).
⬜ Weakening (Bottom-Right): Strong Trend + Decelerating. (Watch for exits).
🟥 Lagging (Bottom-Left): Weak Trend + Decelerating. (Avoid).
✨ Significant Improvements
This open-source version adds unique features not found in standard rotation scripts:
📝 Quick-Input Engine: Paste up to 40 symbols as a single comma-separated list (e.g., NVDA, AMD, TSLA). No more individual input boxes.
🎯 Quadrant Filtering: You can now hide specific quadrants (like "Lagging") to clear the noise and focus only on actionable setups.
🐛 Trajectory Trails: Visualizes the historical path of the rotation so you can see the direction of momentum.
🛠️ How to Use
Paste Watchlist: Go to settings and paste your symbols (e.g., US Sectors: XLK, XLF, XLE...).
Find Entries: Look for tails moving from Improving ➔ Leading.
Find Exits: Be cautious when tails move from Leading ➔ Weakening.
Zoom: Use the "Scatter Plot Resolution" setting to zoom in or out if dots are bunched up.

TASC 2022.05 Relative Strength Exponential Moving Average█ OVERVIEW
TASC's May 2022 edition Traders' Tips includes the "Relative Strength Moving Averages" article authored by Vitali Apirine. This is the code implementing the Relative Strength Exponential Moving Average (RS EMA) indicator introduced in this publication.
█ CONCEPTS
RS EMA is an adaptive trend-following indicator with reduced lag characteristics. By design, this was made possible by harnessing the relative strength of price. It operates in a similar fashion to a traditional EMA, but it has an improved response to price fluctuations. In a trading strategy, RS EMA can be used in conjunction with an EMA of the same length to identify the overall trend (see the preview chart). Alternatively, RS EMAs with different lengths can define turning points and filter price movements.
RS EMA is an adaptive trend-following indicator with reduced lag characteristics. By design, this was made possible by harnessing the relative strength of price. It operates in a similar fashion to a traditional EMA, but it has an improved response to price fluctuations.
█ CALCULATIONS
The following steps are used in the calculation process:
• Calculate the relative strength (RS) of a given length.
• Multiply RS by a chosen coefficient (multiplier) to adapt the EMA filtering the original time series. Calculate the EMA of the resulting time series.
The author recommends RS EMA(10,10,10) as typical settings, where the first parameter is the EMA length, the second parameter is the RS length, and the third parameter is the RS multiplier. Other values may be substituted depending on your trading style and goals.
Combo Backtest 123 Reversal & Relative Momentum Index This is combo strategies for get a cumulative signal.
First strategy
This System was created from the Book "How I Tripled My Money In The
Futures Market" by Ulf Jensen, Page 183. This is reverse type of strategies.
The strategy buys at market, if close price is higher than the previous close
during 2 days and the meaning of 9-days Stochastic Slow Oscillator is lower than 50.
The strategy sells at market, if close price is lower than the previous close price
during 2 days and the meaning of 9-days Stochastic Fast Oscillator is higher than 50.
Second strategy
The Relative Momentum Index (RMI) was developed by Roger Altman. Impressed
with the Relative Strength Index's sensitivity to the number of look-back
periods, yet frustrated with it's inconsistent oscillation between defined
overbought and oversold levels, Mr. Altman added a momentum component to the RSI.
As mentioned, the RMI is a variation of the RSI indicator. Instead of counting
up and down days from close to close as the RSI does, the RMI counts up and down
days from the close relative to the close x-days ago where x is not necessarily
1 as required by the RSI). So as the name of the indicator reflects, "momentum" is
substituted for "strength".
WARNING:
- For purpose educate only
- This script to change bars colors.

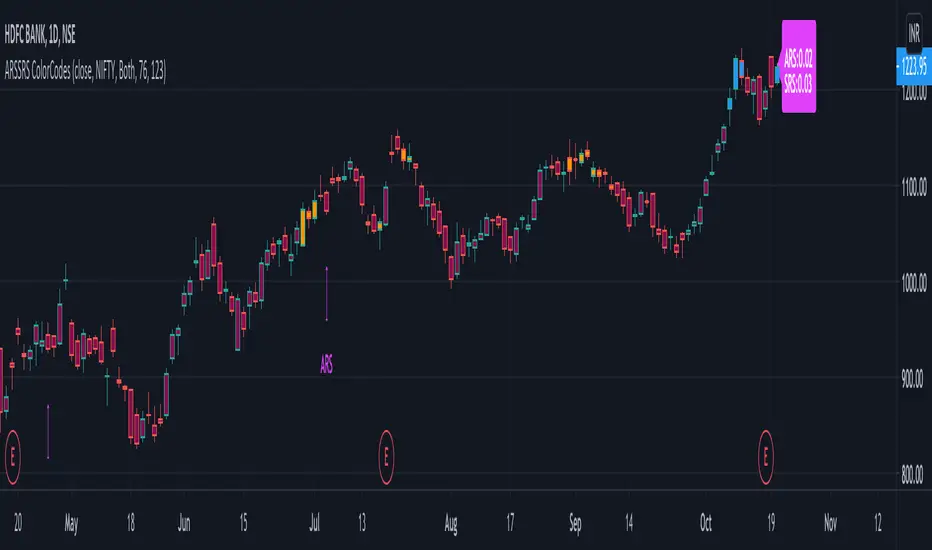
Adaptive and Static Relative Strength OverlayThis indictor combines adaptive and static relative strengths and displays the strength in a unique colour coding on the bars.
With this the one can view the performance of both the relative strengths in one indicator and overlay-ed on the price chart.
Adaptive Relative Strength - Date is identified based on market scenarios. It will change based on how the market trends in the future.
Static Relative Strength - Date is fixed (123 sessions). Roughly corresponds to 6 months.
The (default) colour coding is:
If "Both" is selected:
ars > 0 and srs > 0 = Blue
ars <=0 and srs <= 0 = Maroon
Orange otherwise (Any of ars or srs is negative)
If "Only ARS" is selected:
ars > 0 = Blue
Maroon otherwise
If "Only SRS" is selected:
srs > 0 = Blue
Maroon otherwise
Additionally the ARS and the SRS will be marked as labels on the bars corresponding to the reference dates.
The current ARS and SRS values will be market as label on the last bar.
Source can be any valid source, close is selected by default.
Default benchmark is "Nifty 50" the NSE Indian benchmark. This can be changed.
Volume, Relative Volume HighlightThe indicator plots regular volume bars.
The highlight is given by the current cumulative volume for the day, compared to a custom average (standard 20 periods). The stronger the color, the higher the relative volume is. Stocks moving of higher relative volume have higher chances of making predictable moves.

Comparative Relative Strength - HongQuanTraderThis script is designed to enhance your trading strategy by comparing the current symbol with another comparative symbol. The goal is to trade a symbol only when its Relative Strength (RS) value surpasses the long moving average of the RS value, ensuring more informed and strategic trading decisions.
Default Mode
In the default mode, the RS value is calculated by simply dividing the base symbol by the comparative symbol:
RS_SIMPLE = baseSymbol / comparativeSymbol
Period Mode
When you enable the “use period” option, the script uses the RS_PERIOD equation. This mode is particularly useful for comparing multiple symbols against the same comparative symbol, with the output normalized around 1.0 for easier comparison:
RS_PERIOD = baseSymbol / baseSymbol / (comparativeSymbol / comparativeSymbol )
By leveraging these calculations, you can gain deeper insights into the relative performance of different symbols, allowing you to make more precise and confident trading decisions. Whether you’re comparing stocks, currencies, or any other assets, this script provides a robust framework for enhancing your trading strategy.
