Relative Strength Index with AlertsRSI with alert on enter and exit overbough and oversold area.
You can change the overbough and oversold levels as well.
Cari dalam skrip untuk "Relative"

RSI with Overpriced and Underpriced highlightRelative Strength Index (RSI) with Overpriced and Underpriced highlights, respectively set at 70% and 30%

Relative Strength Index with Averageadds an avg input to smooth the RSI. Helps with determining tend-direction at a glance

Relative Strength Index 50 LineSuper simple script that just adds a line at the 50 level for the RSI.

Relative Strength & sma delta2 RSI with different length at your choise, with 2 sma signal. 4 Plots show the difference between the 2 RSI and 2 Signals , the difference of the 2 RSI and the difference of the Delta of the 2 RSI. So you can have a close view toghether with a bird s eye view. The black line is the middle way.


Relative Strength Leadership Engine v2.0Relative Strength Leadership Engine v2.0OverviewThe Relative Strength Leadership Engine v2.0 is a context-first diagnostic tool designed to identify true market leadership. Instead of simple ratio lines, this script employs a multi-layered scoring model to determine if a symbol is truly outperforming its benchmark (e.g., SPY) or simply riding market beta.The Problem It SolvesMany relative strength indicators fail to distinguish between idiosyncratic leadership and market correlation. A stock might look strong simply because it is a high-beta names moving in lockstep with a rising index. This engine uses Pearson Correlation Filtering and Volatility Normalization to decouple these factors.How It Works (The Math)To ensure full transparency for the TradingView community, the "Leadership Score" (0–100) is calculated based on four proprietary technical pillars:Baseline Alignment (30 pts): Measures if the $Price / Benchmark$ ratio is above its 21-period EMA.Volatility-Normalized Momentum (25 pts): We calculate a Z-score of the RS slope and divide it by the asset's ATR % of price. This ensures momentum is measured by "clean" price action rather than high-beta volatility spikes.Beta-Decoupling (20 pts): Using ta.correlation, the script penalizes "Market Huggers." Points are awarded when a stock shows strength independent of the benchmark's immediate fluctuations.Freshness & Highs (25 pts): Points are awarded for proximity to 252-day relative strength highs, identifying stocks entering a "Power Zone" of leadership.Interpreting the StatesThe dashboard in the bottom-right identifies three distinct permission states:ENGAGE (Score 80+): Full leadership permission. The asset is outperforming with idiosyncratic strength and clean momentum (See FDX example in the gallery).OBSERVE (Score 50–79): Leadership is present but aging or overly correlated to the market (See MU example in the gallery).STAND DOWN (Score <50): Leadership is broken; the asset is a relative laggard (See CBLL example in the gallery).Technical FeaturesMulti-Timeframe Validation: Optional Weekly/Monthly RS confirmation to filter out "noise."Benchmark Timing Filter: A built-in gate that checks if the broader market (Benchmark) is in a "Risk-Off" regime.Non-Repainting: All security calls use lookahead=barmerge.lookahead_off to ensure historical accuracy.Customizable UI: Toggle the dashboard on/off via the "Style" menu for a cleaner workspace.DisclaimerThis script is an informational diagnostic tool and does not generate trade signals, entries, or exits. Educational use only.

Sector Relative StrengthDescription
This script compares sector performance relative to the S&P 500. Sector price levels or charts alone can mislead, because they tend to move with the broader market. An increase in a sector’s price does not necessarily indicate strength, as it may simply be following the index.
For more a more reliable picture, the script calculates a ratio between each sector ETF and SPY. If the ratio has increased, the sector has outperformed the index. In case it has declined, the sector has underperformed. If the value is near zero, the sector has moved in line with the index. The sectors are presented in a table and sorted on relative performance.
Calculation Method
The performance is expressed as a percentage change in the ratio over a user-defined lookback period. The default lookback is set to 21 bars, which corresponds to one month on a daily chart. This value can be adopted in the settings to match preferred time period.
Z-Score
In addition to the percentage change, the script calculates a Z-score of the ratio, which measures how far the current value deviates from its recent mean. A high positive Z-score indicates that the ratio is significantly above its average, while a negative value indicates it is below. This normalization allows for comparison between sectors with different price levels or volatility profiles.
Table Columns
- Relative %: The sector's performance relative to SPY over the selected lookback period
- Z-Score: Standardized measure of current performance ratio is relative to its average
- Trend Arrow: Indicates the direction of relative performance up down or flat
Example Interpretation
For example, if XLK shows a 3.7% change, it has outperformed SPY over the selected period. Another sector might show a -2.1% change, which indicates underperformance. While both values shows relative strength or weakness, the Z-score is optional and can provide additional context based on how unusual that performance is compared to the sector's own recent behavior.
Use Case
This approach helps evaluate overall market conditions and supports a top-down method. By starting with sector performance, it becomes easier to identify where the market is showing leadership or weakness. This allows the stock selection process to be more deliberate and can help refine or customize screeners based on certain sectors.

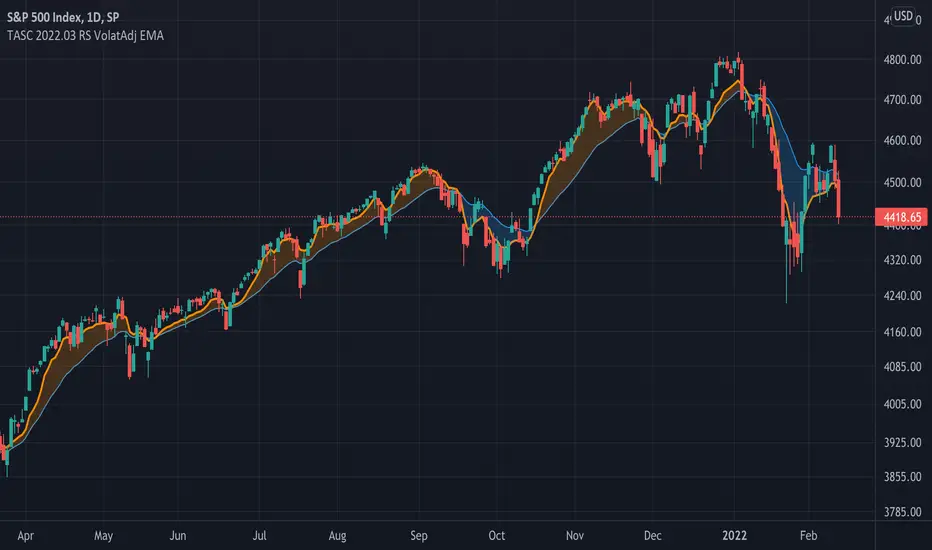
TASC 2022.03 Relative Strength Volatility-Adjusted EMA█ OVERVIEW
TASC's March 2022 edition of Traders' Tips includes the "Relative Strength Moving Averages - Part 3: The Relative Strength Volatility-Adjusted Exponential Moving Average" article authored by Vitali Apirine. This is the code that implements the "RS VolatAdj EMA" from the article.
█ CONCEPTS
In a three-part article series, Vitaly Apirine examines ways to filter price movements and define turning points by applying the Relative Strength concept to exponential moving averages . The resulting indicator is more responsive and is intended to account for the relative strength of volatility .
█ CALCULATIONS
The calculation process uses the following steps:
Select an appropriate volatility index (in our case it is VIX ).
Calculate up day volatility (UV) smoothed by a 10-day EMA.
Calculate down day volatility (DV) smoothed by a 10-day EMA.
Take the absolute value of the difference between UV and DV and divide by the sum of UV and DV. This is the Volatility Strength we need.
Calculate a MLTP constant - the weighting multiplier for an exponential moving average.
Combine Volatility Strength and MLTP to create an exponential moving average on current price data.
Join TradingView!
RedK Relative Strength Ribbon: RS Ribbon and RS ChartsRedK Relative Strength Ribbon (RedK RS_Ribbon) is TA tool that plots the Relative Strength of the current chart symbol against another symbol, or an index of choice. It enables us to see when a stock is gaining strength (or weakness) relative to (an index that represents) the market, and when it hits new highs or lows of that relative strength, which may lead to better trading decisions.
I searched TV for existing RS indicators but didn't find what I really wanted, so I put this together and added some additional features for my own use. It started as a simple RS line with new x-weeks Hi/Lo markers, then evolved into what you see here in v1.0 with the ability to plot a full RS chart in regular or HA candle types. Hope this will be useful to some other growth traders here on TV.
What is Relative Strength (RS)
------------------------------------
(RS is a comprehensive concept in TA, below is a quick summary - please research further if it's not already a familiar topic)
Relative Strength (RS) is a technical concept / indicator used mainly by growth / swing / momentum traders to compare the performance of one security or asset against another. RS measures the price performance of a specific security relative to a benchmark, such as an index or another asset. It's not to be confused with the famous Relative Strength Index (RSI) technical indicator
For example, In the context of comparing a stock's relative strength to the SPY (S&P 500) index, the relative strength calculation involves dividing the stock's price or price-related value (e.g., close price) by the corresponding value of the SPY index. The resulting ratio (and its trend over time) indicates the relative performance of the stock compared to the index.
Traders and investors use relative strength analysis to identify securities that have been showing relative strength or weakness compared to a benchmark, which can help in making investment decisions or identifying the "market leaders" and potential trading opportunities.
There are so many books and documentation about the RS concept and its importance to identify market leaders, especially when recovering from a bear market - if you're interested in the concept, please search more about it and review some of that literature. There's also a more detailed definition of Relative Strength in this article on Invstopedia
RedK RS_Ribbon features and options
---------------------------------------------------
The indicator settings provide many options and features - see the settings box below
- Change / choose base symbol
The default is to use SPY as the base symbol - so we're comparing the chart's symbol to a proxy of the S&P 500 - Some traders may prefer to use the QQQ - or other index or ETF that acts as a proxy for the industry / sector / market they are trading
- RS Calculation / RS line
we use the simple form of the RS calculation,
RS = closing price of current chart symbol / closing price of the base symbol (default is SPY) * 100
some RS documentation will use the Rate of Change (RoC) - but that's not what we're using here.
- The RS_Ribbon
* Once the RS line is plotted, it made sense to add couple of moving averages to it, to make it easier to observe the trend of the RS and the changes in that trend as you can see in the sample chart on top.
* The RS_Ribbon is made up of a fast and slow moving averages and will change color (green / red) based on detected trend RS direction - the 2 MA types and lengths can be changed until you get the setup that provides the best view for you of the RS trend over time. My preferred settings are used as defaults here.
- Identifying New (x)Week Hi/Lo RS Values
* Most traders would be interested when the calculated RS hits a new 52-week high or low value.
* There are cases where we may want to see when a new RS Hi/Lo has been hit for a different period - for example, a quarter (13 weeks)
* the number of weeks can be changed as well as adjusting the numbers of trading days per week (if needed for certain symbols/exchanges)
- Working with Different Timeframes
* Now these "markers" will only be available in the daily and weekly timeframes and there is a good reason for that, it's not the fact that i'm lazy :) and that enabling this in timeframes lower than 1D would have been some heavy lifting, but the reality is that with RS, we're really interested if a "day's close" hits a new RS high or low value against the moving window of x weeks (and the weeks close also) - if you think of this more, at lower TF, RS can hit a lower value that never end up registering on the daily closing and that causes a lot of visual confusion. So i took the "cleaner way out" of that issue.
* note that you can choose a different timeframe for the RS_Ribbon than the chart - if you do, please make sure the chart is at a lower timeframe than the indicator's - (and in that case remember to hide the candles because they won't make much sense)
i wanted to leverage TV's built-in multi-Timeframe (MTF) support with the caveat that using the indicator at lower TF with a chart at a higher TF (example chart at 1Wk and indicator at 1D) will show inaccurate results. If this sounds confusing, keep the indicator TF same as the chart.
the example here shows a 2-Hr chart against 1D RS_Ribbon
- Using RS Charts and RS Candles
* Beside the ability to plot the RS "closing" value with the RS line, the indicator provides the ability to show a "full" RS Chart with candles that represent the relative values of open, high, low. and close against the base symbol.
* the RS Charts can be used for regular chart analysis, for example, we can identify common chart patterns like Cup & Handle, VCP, Head & Shoulder..etc using these charts .. which can provide some edge over the price charts
* for the Heikin Ashi fans, I added the ability to choose classic or HA candles for the chart. note you have to enable the option to show the RS candles first before you choose the option to switch to HA.
The chart below shows a side-by-side comparison on the 2 RS chart types
Closing remarks
-----------------------
* RS is a good way to identify market/sector leaders (who will usually recover from a bear market before others) - and enable us to see the strength that comes from the broader makrket versus the one that comes from the stock's own performance and identify good trading opportunities
* I'll continue to update this work and alerts will come in next version - but wanted to check initial reaction and value
* as usual, if you decide to use this in your chart analysis, it's necessary to combine with other momentum, trend, ...etc indicators and do not make trading decision only based on the signales from a single indicator

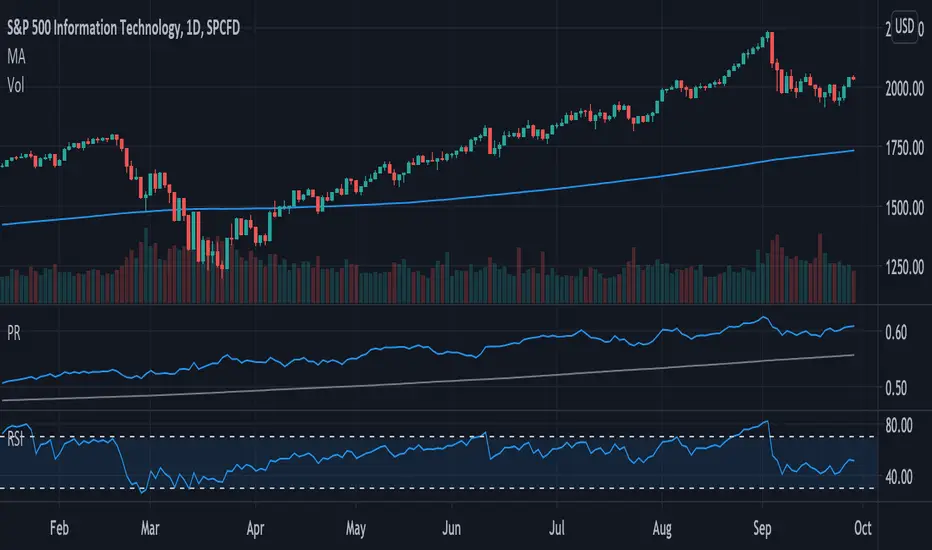
Price Relative / Relative StrengthThe Price Relative indicator compares the performance of one security to another. This indicator can be used to compare the performance of a stock against a benchmark index, such as the S&P 500, or its sector/industry group. This makes it possible to determine if a stock is leading or lagging its peers.
The Price Relative is used to gauge relative strength, which is important when it comes to stock selection. Many portfolio managers compare their performance to a benchmark, such as the S&P 500. Their goal is to outperform that benchmark. In order to achieve this goal, managers often look for stocks that are showing relative strength. Enter the Price Relative. The Price Relative rises when a stock shows relative strength and is outperforming its benchmark. Conversely, the Price Relative falls when a stock shows relative weakness and is underperforming its benchmark.
Source: school.stockcharts.com
This script allows the user to
Add a new indicator pane for Price Relative (PR)
Edit the benchmark symbol (Comparative Symbol)
Edit or hide the moving average
Quickly determine if the symbol is outperforming or underperforming its benchmark
Quickly determine if the symbols is trending higher or lower based on a simple moving average
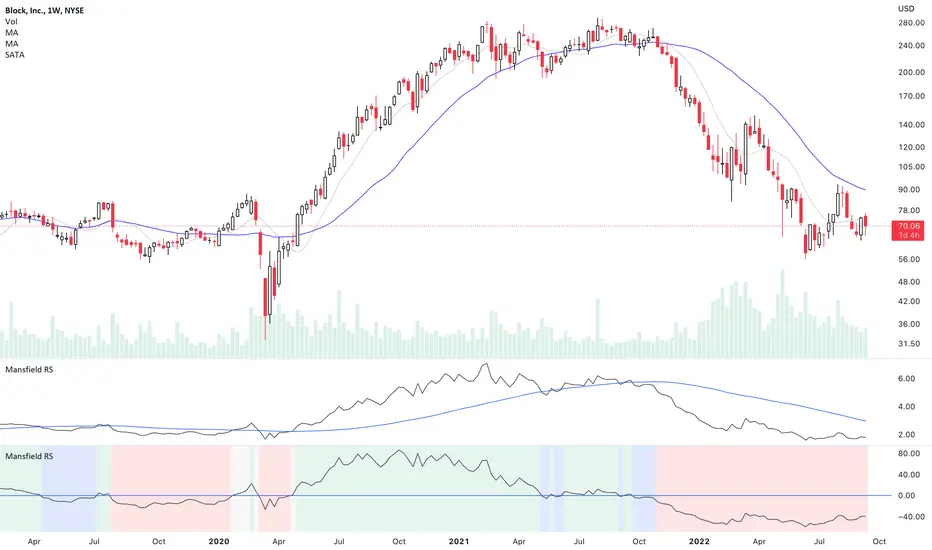
Mansfield Relative Strength (Original Version) by stageanalysisThe Mansfield Relative Strength ( Mansfield RS ) is one of the core components of the Stan Weinstein's Stage Analysis method as discussed in his classic book Stan Weinstein's Secrets for Profiting in Bull and Bear Markets .
The Mansfield RS measures the relative performance of the stock compared to an index such as the S&P 500, or to another stock etc.
However, this should not to be confused with the popular RSI (Relative Strength Index developed J. Welles Wilder), which is a momentum oscillator that measures the speed and change of price movements on a single stock.
The Mansfield RS indicator consists of the Relative Strength comparison line versus the S&P 500 (default universal setting, but can be edited), and the "Zero Line" – which is the 52 week MA of the Relative Strength line, that's been flattened to create the oscillator style.
How to use the Indicator:
Outperforming – Above the Zero Line
When the Relative Strength line crosses above the Zero Line (it's flattened 52 week RS MA), it is outperforming the index or stock that it's comparing against, and so it is showing stronger relative strength.
Underperforming – Below the Zero Line
When the Relative Strength line crosses below the Zero Line (it's flattened 52 week RS MA), it is underperforming the index or stock that it's comparing against, and so it is showing weaker relative strength.
Settings:
When you first add the indicator is has a coloured background, with a green tint for a postive RS score, and a red tint for a negative RS score. However, this can be turned off, or edited in the indicator settings, in the Style tab. So you can change the colors or remove it and just have the RS line and zero line showing. Both of which can also be edited in the settings.
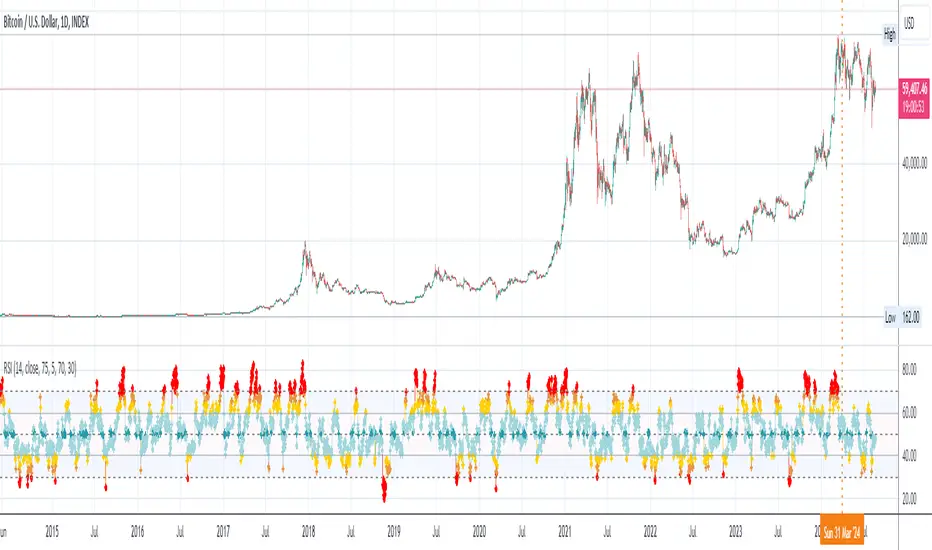
Change the symbol that it compares against. The default is the S&P 500. But for crypto you might want to use Bitcoin for example. Or you might want to compare against competing stocks in the same peer group, or against the industry group or sector. The choice is yours. But the S&P 500 is a universal measure for the Mansfield RS. So I would recommend leaving it on that unless you have a particular reason to change it as mentioned.
MA Length is also an editable setting. This creates the Zero Line. So it will affect the values of the Mansfield RS if you change it. 52 is the default setting, and is set as such for the weekly chart. So I'd recommend not editing it on the weekly chart, but for other timeframes, different settings can be used.
4C Volume w/ Relative Volume at TimeThis is a Volume indicator that also shows Relative Volume at Time (RVOL).
The RVOL is easily visible as a background color, that changes between Low and High RVOL colors.
The RVOL portion of the indicator is a modified version of the 'Relative Volume At Time' indicator by Tradingview (which has been the best/most accurate RVOL indicator i have seen yet on Tradingview, and seems to closely match the how the "Zanger Volume" indicator works).
Elevated RVOL can be a very important criteria for trading , especially on lower time frames.
This indicator can be used as a simple filter when looking at charts to determine whether it should be traded or not, based on the RVOL.
Higher volume/participation relative to previous time periods can lead to better follow through of moves and price action, and can lead to trending conditions.
Lower RVOL can lead to choppy market conditions, with lower participation and follow through on chart patterns.
The RVOL portion of the indicator draws from the Tradingview 'Relative Volume At Time' indicator developed by authors @e2e4mfck and @LucF , for TradingView.
This indicator takes the Past Volume mark and changes it into a background color.
High RVOL = When the day's cumulative volume is greater than the Past Volume levels, then the background is painted Blue by default
Low RVOL = When the day's cumulative volume is lower than the Past Volume levels, then the background is painted Purple by default
See annotated examples in the chart Below, which compares/contrasts this new indicator with the RVOL indicator by Tradingview:
Portions of the 'Relative Volume At Time' indictor code have been removed to clean up the script.
Plans in the future are to remove more code were possible, to further refine the script and speed up the processing times for the indicator.
If anyone is able to strip out more and keep it functioning the same, please let me know.
Enjoy.
Credit also goes to author @LazyBear . Portions of the Volume indicator is adapted from - HawkEye Volume Indicator

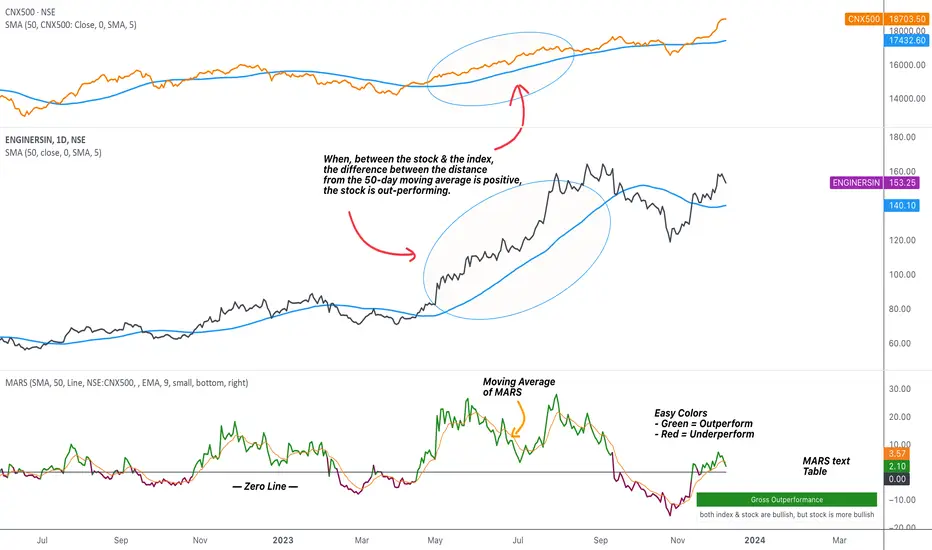
MARS - Moving Average Relative StrengthThe original idea from this script is from the script " Percentage Relative Strength " by dman103 . The original script compared a symbol to an index by their everyday percentage change. The symbol percentage was subtracted from percentage change of the index, & the results were then smoothed by moving averages.
Instead of daily percentage changes, this script directly calculates relative strength via a moving average. We call this simpler approach as MARS (Moving Average Relative Strength) .
MARS compares a symbol to the index by making use of the price's distance from a moving average. By default, we compare the distance from the 50-day simple moving average of the stock vs that of the index. Both the type & the length of the moving average is customisable.
Background color indicates the index being above or below its moving average.
Blue background: index is above its moving average
Pink background: index is below its moving average
The histogram indicates whether the stock is under-performing or out-performing the index.
Up-bars : stock is out-performing the index i.e. between the stock & the index, the difference between the distance to/from the 50-day moving average is a positive value.
Down-bars : stock is under-performing the index i.e. between the stock & the index, the difference between the distance to/from the 50-day moving average is a negative value.
The color of the histogram indicates the type of out-performance or under-performance. There can be a total of 6 such colors:
Relative out-performance : both index & stock are bearish, but stock is less bearish. The script prints light green up-bars on a pink background.
Gross out-performance : both index & stock are bullish, but stock is more bullish. The script prints green up-bars on a blue background.
Absolute out-performance : index is bearish, but stock is bullish! The script prints blue up-bars on a pink background.
Relative under-performance : both index & stock are bullish, but stock is less bullish. The script prints light red bars on a blue background.
Gross under-performance : both index & stock are bearish, but stock is more bearish. The script prints dark red bars on a pink background.
Absolute under-performance : index is bullish, but stock is bearish! The script prints black down-bars on a blue background.
Additional customisation options:
Paint bars option changes the bar colors to mirror the histogram colors.
Easy colors option just changes the histogram colors to either blue or pink, indicating out-performance or under-performance, respectively. This is when the trader does not wish to demarcate between the above-mentioned 6 conditions.
Anchored Relative StrengthThe Anchored Relative Strength (RS) Indicator is a tool designed for traders to compare the performance of a selected stock or security against a benchmark index or another security starting from a specific point in time.
Traditional Relative Strength
The traditional RS line is a popular tool used to compare the performance of a stock, typically calculated as the ratio of the stock's price to a benchmark index's price. It helps identify outperformers and underperformers relative to the market or a specific sector.
The Anchored Approach
The Anchored RS line enhances the traditional concept of the RS line by introducing an anchored approach, where calculations begin from a user-defined date. This feature provides the flexibility to start the comparison from a specific historical event, earnings, market peak, trough, or any date significant to the trader's analysis.
Calculating Relative Strength
The RS value is calculated by dividing the close price of the chosen stock by the close price of the comparative symbol (SPX by default). This calculation is performed for each bar since the Anchor Date.
Indicator Features
🔶Custom Start Date
🔶Custom Comparison Symbol
🔶RS Line Moving Average
🔶Comparison Symbol Line
🔶Customize Colors & Appearance
Users can change the anchor date simply by clicking on the indicator and dragging the anchor point.

Market Relative Candle Ratio ComparatorIntroducing the Market Relative Candle Ratio Comparator, a visually captivating script that eases the way you compare two financial assets, such as cryptocurrencies and market indices. Leveraging a distinctive calculation method based on percentage changes and their averages, this tool presents a crystal-clear view of how your chosen assets perform in relation to each other, both for individual candles and over a range of previous candles.
Tailoring the script to your preferences is a walk in the park, as it allows you to easily adjust input symbols, moving average lengths, and other parameters to match your analytical approach. The visually arresting column chart it creates employs vivid red and green colors to underscore the differences between the two assets on each candle. Simultaneously, the lower-opacity columns depict the accumulated differences over a specified lookback period. This vibrant blend of colors and opacities results in a dynamic visual experience, enabling you to better grasp market trends relative to each other.
The reverse bool input is a handy feature that lets you invert the effect of the input symbol (DXY by default) in the comparison. When you set the reverse input to true, the script multiplies the calculated DXY percentage change by -1, effectively reversing the comparison. This is particularly useful when examining assets with an inverse relationship or when you'd like to analyze the input symbol's impact in the opposite direction.
For instance, if the input symbol represents a market index that generally moves in the opposite direction of the selected cryptocurrency, enabling the reverse input will help you better visualize and understand the relationship between the two assets by inverting the input symbol's effect on the comparison.
In the accompanying chart, you can observe the comparison of Bitcoin's movement relative to the Dollar, Gold, Bonds, and the S&P 500. The indicator reveals that in the last day, Bitcoin outperformed Bonds, Gold, and the Dollar but not the S&P 500!

Linear Regression Relative Strength[image/x/iZvwDWEY/
Relative Strength indicator comparing the current symbol to SPY (or any other benchmark). It may help to pick the right assets to complement the portfolio build around core ETFs such as SPY.
The general idea is to show if the current symbol outperforms or underperforms the benchmark (SPY by default) when bought some certain time ago. Relative performance is displayed as percent and is calculated for three different time ranges - short (1 mo by default), mid (1 quarter), and long (half a year). To smooth the volatility, the script uses linear regression to estimate the trend and takes the start and the end points of the linear regression line to compute the relative strength.
It is important to remember that the script shows the gain relative to SPY (or other selected benchmark), not the asset's gain. Therefore, it may indicate that the asset is profitable, but it still may lose value if SPY is in downtrend.
Therefore, it is crucial to check other indicators before making a decision. In the example above, standard linear regression for one quarter is used to indicate the direction of the trend.
