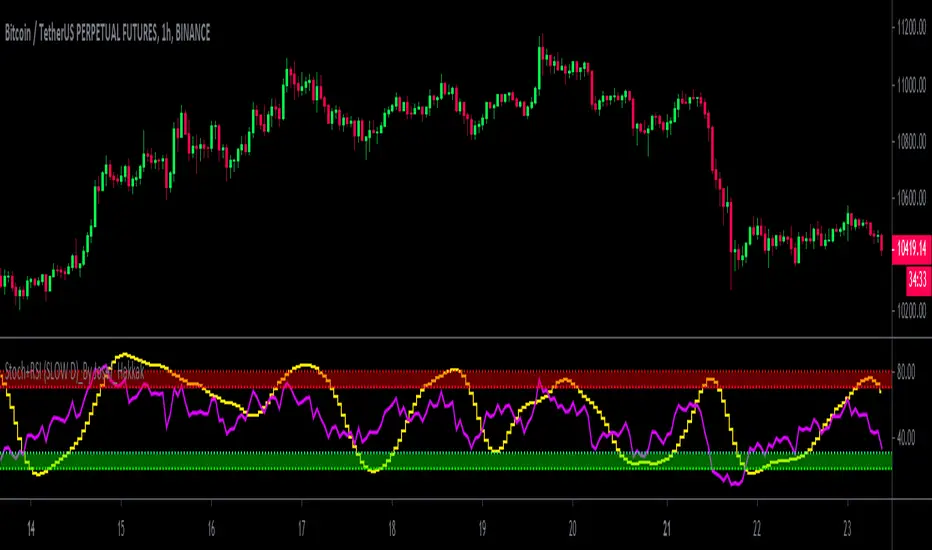
Stoch+RSI (SLOW D)_By Josef_HakkakStoch+RSI (SLOW D)_By Josef_Hakkak
Stochastic and RSI by SLOW D%
-> How to use:
B UY = When the yellow line (D of Slow Stoch ) goes out of the green range, it is better that the purple line ( RSI ) is be low
SELL = When the yellow line (D of Slow Stoch ) goes out of the red range, it is better to have the purple line ( RSI ) is be high
This script was previously written by RRanjanFX and has now been edited by me and changes have been made to optimize for shorter timeframes.
Edited and updated and optimized from:
RRanjanFX
Many thanks and loyal to RRanjanFX
Cari dalam skrip untuk "STOCH RSI"

Stoch RSI, Div, Zone S3 by Gammaprod>> How to use this indicator :
1. Set your teadingview theme to dark theme.
2. My indicator is valid for forex, stock and but more valid for crypto.
3. Use three timeframe for more validation (choose between those, that fit to your trading style) :
- Timeframe 1m, 5m, and 15m for Scalping
- Timeframe 30m, 1h and 4h for Intraday
- Timeframe 4h, 1D and 1W for Swing Trading
4 . Always use THREE INDICATORS FROM GAMMAPROD, those three indicators is back to back each other, by the way, I only made those three indicators only (for now) :
- Trendlines Boll Ichi Crypto by Gammaprod
- Stoch RSI Divs Zone Crypto by Gammaprod
- MACD Volume Crypto by Gammaprod
>> How to setting :
1. Trendlines Boll Ichi Crypto by Gammaprod
A. Support and Resistence
- Well if you familiar with this indicator you can add it, but recommended for Timeframe 30m or more
B. Trendlines Primary or Trendlines Secondary
- Timeframe 1m you DON'T NEED Trendlines Primary or Trendlines Secondary
- Timeframe 5m you DON'T NEED Trendlines Secondary, but you CAN ADD Trendlines Primary if you fell it helpful (for me, it is helpful to find where the candles start or the end trend or a consolidation or where the candles will surpass a resistance or a support).
- Timeframe 15m you DON'T NEED Trendlines Secondary, DEFENITELY add Trendlines Primary it will help to find where the candles stop or a consolidation or where the candles will surpass a resistance or a support).
- Timeframe 30m or more, DEFENITELY NEED BOTH Trendlines Primary and Secondary Trendlines, it will help to find where the candle stop or consolidation or where the candle will surpass a resistance or support).
C. Bolinger, Ichimoku Cloud and Lagging Span
- Please DON'T CHANGE IT at all, it's really helpful to know when and where to make an entry decesion or a trend or a consolidation, if you don't understand how to read it, you better to learn it first (on "how to read" section and "How to OPEN position" the section below)
2. Stoch RSI Divs Zone Crypto by Gammaprod (DON'T CHANGE IT)
3. MACD Volume Crypto by Gammaprod (DON'T CHANGE IT)
>> How to read :
1. Sell or Buy Priority :
A. Buy Priority
- Color background on macd and stoch rsi is pink or purple sell is the priority, (if you're not sure to buy, just wait until the best moment to sell)
B. Buy Priority
- Color background on macd and stoch rsi Teal or light green buy is the priority, (if you're not sure to sell, just wait until the best moment to buy)
C. Indecision / Golden Moment
- Color background on stoch rsi yellow is indecision / golden moment of reversal pattern (wait until it formed background only on Stoch RSI), please becareful at this moment.
2. Trend / Consolidation :
A. BULLISH trend
- When Stoch RSI and MACD have teal or light green background that's means BULLISH trend, better to confirm by the candle is above green cloud and lagging span (red line) is also above the candle.
B. BEARISH trend
- When Stoch RSI and MACD have the Pink or purple background that's means BEARISH trend, better to confirm by the candle is above purple cloud and lagging span (red line) is also below the candle.
C. CONSOLIDATION
- When Stoch RSI have the mix background that's means CONSOLIDATION, better to confirm by the candle is in or near to green / purple cloud and lagging span (red line) is also on the candle.
3. Special Mark
A. Ideal Bullish :
- Near line 20 and green / teal background = When Stoch RSI have the char R / H on lime color label, that's means divergence or hidden divergence for buy position, if you not see this label that's means just a standard confirmation for buy
B. Not an Ideal Bullish :
- Near line 80 and green / teal background = if this happens make sure you know what happen, it could be a false signal or bullish continual pattern
C. Ideal Bearish :
- Near line 80 and pink / purple background = When Stoch RSI have the char R / H on lime color label, that's means divergence or hidden divergence for buy position, if you not see this label that's means just a standard confirmation for sell position.
D. Not an Ideal Bearish:
- Near line 20 and pink / purple background = if this happens make sure you know what happen, it could be a false signal or bearish continual pattern
E. The Beginning of Reversal (from BEARISH to BULLISH) :
- When Stoch RSI line shaping GREEN position is near 20.
- MACD lines still PINK, position lines is UNDER the HISTOGRAM, but the HISTOGRAM start to SHAPE FALL PINK (light pink) and the BACKGROUND still PINK / PURPLE.
- Position CANDLES NEAR BLUE line, NEAR PURPLE CLOUD, and lagging span (red line) STILL ON the area candle. (it used to be confirmed with the golden moment).
F. The Beginning of Reversal (from BULLISH to BEARISH) :
- When Stoch RSI line shaping PINK position is near 80.
- MACD lines still GREEN, position lines is ABOVE the HISTOGRAM, but the HISTOGRAM start to SHAPE FALL GREEN (light green) and the BACKGROUND still TEAL / GREEN.
- Position CANDLES NEAR WHITE line, NEAR TEAL CLOUD, and lagging span (red line) STILL ON the area candle. (it used to be confirmed with the golden moment).
G. False Signals, or It could be a Golden Moment (better to see it on TF 15 or bigger):
- Near line 20 or 80 and yellow background = When Stoch RSI have the char R / H on color label, that's means divergence or hidden divergence for buy / sell position, if you not see this label that's means just a standard confirmation for buy / sell depends on where the Stoch RSI line if near 20 that's means buy, near 80 means sell
>> How to OPEN position:
A. Bullish
1. Trendlines Boll Ichi Crypto by Gammaprod
- The candles above the green cloud.
- Lagging span (red line) above the candles.
- then open buy near yellow line (the first option) / blue line (the second option) (always confirm the position with two other indicators below).
2. Stoch RSI Divs Zone Crypto by Gammaprod
- Teal or Green background.
- The lines is shaping green.
- Better if on the bottom (at a range 20).
3. MACD Volume Crypto by Gammaprod
- Teal or Green background.
- The lines is shaped or shaping green.
- Better if at the green histogram.
B. Bearish
1. Trendlines Boll Ichi Crypto by Gammaprod
- The candles below the purple cloud.
- Lagging span (red line) below the candles.
- then open buy near yellow line (the first option) / white line (the second option) (always confirm the position with two other indicators below).
2. Stoch RSI Divs Zone Crypto by Gammaprod
- Pink or purple background.
- The lines are shaping pink.
- Better if the line on the top (at a range 80).
3. MACD Volume Crypto by Gammaprod
- Pink or purple background.
- The lines are shaped or shaping green.
- Better if at the pink histogram.
C. Consolidation
1. Trendlines Boll Ichi Crypto by Gammaprod
- The candles on the cloud (green or purple).
- Lagging span (red line) on the candles.
- then open buy near the white or blue line (always confirm the position with two other indicators below).
2. Stoch RSI Divs Zone Crypto by Gammaprod
- Mix background specially on a timeframe 15m or more.
- The line move fast up and down.
- Better if on the bottom or the top of the lines (at a range 20 or 80).
3. MACD Volume Crypto by Gammaprod
- Changing the background.
- The line is near the middle line.
- Have small Histogram.
>> The secret ingridient is comparing the timeframe :
The example scalping (Timeframe 1m, 5m and 15m)
- TF 1m is for making an open position.
- TF 5m is for making a judgement of the trend market.
- TF 15m is to confirm that judgement from TF 5m, be careful if it not similar then it used to be a consolidation or the beginning of the reversal.
There's a lot a way to open the position than above information that i gave it to you, but consider there are a limit char on this column, I hope it will help your trading and make a more profit on it.

stoch rsi dmi plusSo in this indicator I put the improved DMI together with stoch rsi
the area in light blue are buy zone by the improved DMI
the area in light red are potential sell zone by the improved DMI
the green columns are stoch rsi crossing up
the red columns are stoch rsi crossing down

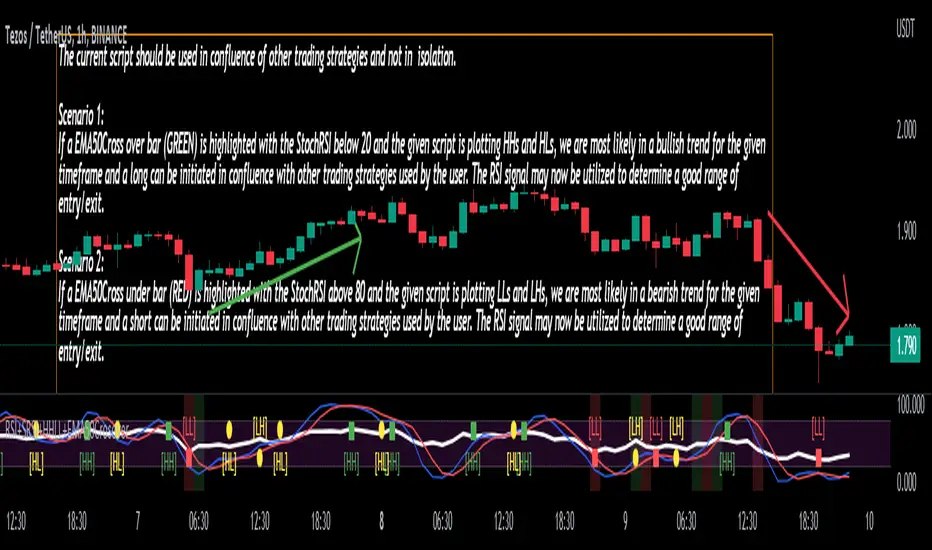
Stoch/RSI with EMA50 Cross & HHLLA hybrid but simple indicator that plots 4 strategies in one pane .
1) RSI Indicator
2) Stoch RSI
3) EMA50 Cross (To determine direction in current timeframe)
4) Higher Highs & Lower Lows to analyze the trend and break of trend
The relative strength index (RSI) is a momentum indicator used in technical analysis. It is displayed as an oscillator (a line graph) on a scale of zero to 100. When the RSI indicator crosses 30 on the RSI chart, it is a bullish sign and when it crosses 70, it is a bearish sign.
The Stochastic RSI (StochRSI) is also a momentum indicator used in technical analysis. It is displayed as an oscillator (a line graph) on a scale of zero to 100. When the StochRSI indicator crosses 20 on the RSI chart, it is a bullish sign and when it crosses 80, it is a bearish sign.
The EMA50Cross denotes two cases in the script:
a) A crossover of CMP on the EMA50 is highlighted by a green bar signals a possible bullish trend
b) A crossunder of CMP on the EMA50 is highlighted by a red bar signals a possible bearish trend
The HHLL is denoted by mneumonics HH, HL,LH, LL. A combination of HHs and HLs denotes a uptrend while the combination of LLs and LHs denoted a downtrend
The current script should be used in confluence of other trading strategies and not in isolation.
Scenario 1:
If a EMA50Cross over bar (GREEN) is highlighted with the StochRSI below 20 and the given script is plotting HHs and HLs, we are most likely in a bullish trend for the given timeframe and a long can be initiated in confluence with other trading strategies used by the user. The RSI signal may now be utilized to determine a good range of entry/exit.
Scenario 2:
If a EMA50Cross under bar (RED) is highlighted with the StochRSI above 80 and the given script is plotting LLs and LHs, we are most likely in a bearish trend for the given timeframe and a short can be initiated in confluence with other trading strategies used by the user. The RSI signal may now be utilized to determine a good range of entry/exit.
Disclaimer:
The current script should be used in confluence with other trading strategies and not in isolation. The scripts works best on 4H and 1D Timeframes and should be used with caution on lower timeframes.
This indicator is not intended to give exact entry or exit points for a trade but to provide a general idea of the trend & determine a good range for entering or exiting the trade. Please DYOR
Credit & References:
This script uses the default technical analysis reference library provided by PineScript (denoted as ta)
Rsi, Stoch, DMI, Doble(Stoch RSi) // By MocheroWith this indicator we seek to find convergence of the
First Oscillator (RSI, Stoch and DMI) and the Second Oscillator (Stoch, Stoch RSI 1 and Stoch RSI 2) for purchases or sales.
Search Buy when,
First Oscillator
-Rsi oversold
-Stoch over sold
-DMI oversold
Second Oscillator
-Stoch over sold
-Stoch RSI 1 oversold
-Stoch RSI 2 oversold
Suggested values
First Oscillator
Rsi: 4
Stoch: 5.1.1
DMI: 10.3
Second Oscillator
Stoch: 14.3.3
Stoch RSI 1: 14 .14.3.3
Stoch RSI 2: 6. 6.3.3
Suggested time, 3M 5M 15M

WT + Stoch RSI Reversal ComboOverview – WT + Stoch RSI Reversal Combo
This custom TradingView indicator combines WaveTrend (WT) and Stochastic RSI (Stoch RSI) to detect high-probability market reversal zones and generate Buy/Sell signals.
It enhances accuracy by requiring confirmation from both oscillators, helping traders avoid false signals during noisy or weak trends.
🔧 Key Features:
WaveTrend Oscillator with optional Laguerre smoothing.
Stochastic RSI with adjustable smoothing and thresholds.
Buy/Sell combo signals when both indicators agree.
Histogram for WT momentum visualization.
Configurable overbought/oversold levels.
Custom dotted white lines at +100 / -100 levels for reference.
Alerts for buy/sell combo signals.
Toggle visibility for each element (lines, signals, histogram, etc.).
✅ How to Use the Indicator
1. Add to Chart
Paste the full Pine Script code into TradingView's Pine Editor and click "Add to Chart".
2. Understand the Signals
Green Triangle (BUY) – Appears when:
WT1 crosses above WT2 in oversold zone.
Stoch RSI %K crosses above %D in oversold region.
Red Triangle (SELL) – Appears when:
WT1 crosses below WT2 in overbought zone.
Stoch RSI %K crosses below %D in overbought region.
⚠️ A signal only appears when both WT and Stoch RSI agree, increasing reliability.
3. Tune Settings
Open the settings ⚙️ and adjust:
Channel Lengths, smoothing, and thresholds for both indicators.
Enable/disable visibility of:
WT lines
Histogram
Stoch RSI
Horizontal level lines
Combo signals
4. Use with Price Action
Use this indicator in conjunction with support/resistance zones, chart patterns, or trendlines.
Works best on lower timeframes (5m–1h) for scalping or 1h–4h for swing trading.
5. Set Alerts
Set alerts using:
"WT + Stoch RSI Combo BUY Signal"
"WT + Stoch RSI Combo SELL Signal"
This helps you catch setups in real time without watching the chart constantly.
📊 Ideal Use Cases
Reversal trading from extremes
Mean reversion strategies
Timing entries/exits during consolidations
Momentum confirmation for breakouts

IchimokuBuy Sell With Stoch RSIIchimoku Kumo Cloud Crossover Indicator
The "Ichimoku Kumo Cloud Crossover" indicator is a custom technical analysis tool designed for use in the TradingView platform. This indicator is built to assist traders in identifying potential buy and sell signals based on a combination of Ichimoku Cloud analysis, Moving Average Convergence Divergence (MACD), Exponential Moving Average (EMA), Relative Strength Index (RSI), and Stochastic RSI.
Key Components and Parameters:
Ichimoku Kumo Cloud Calculation:
The Ichimoku Kumo Cloud is calculated using the Ichimoku Cloud's Conversion Line and Base Line.
Conversion Line, Base Line, Leading Span 1, and Leading Span 2:
These are key components of the Ichimoku Cloud, and they help identify trends and potential support/resistance levels in the market.
MACD Oscillator:
The Moving Average Convergence Divergence (MACD) is used to gauge the strength and direction of the trend.
EMA 200 (Exponential Moving Average):
The EMA 200 is a long-term moving average used to identify the overall trend direction.
RSI (Relative Strength Index):
The RSI is a momentum oscillator that measures the speed and change of price movements, helping to identify overbought and oversold conditions.
Stochastic RSI (Stoch RSI):
Stoch RSI is calculated based on the RSI values and helps to identify overbought and oversold conditions in a more dynamic manner.
Signal Generation:
The indicator generates buy and sell signals based on the following criteria:
Buy Signal (Long Position):
The Conversion Line crosses above the Base Line (Ichimoku Cloud crossover).
The closing price is above the EMA 200, indicating a bullish bias.
The RSI is between 50 and 70, suggesting the potential for an uptrend.
The MACD Histogram is positive, indicating increasing bullish momentum.
The high price is at least 25% above the EMA 200.
Sell Signal (Short Position):
The Conversion Line crosses below the Base Line (Ichimoku Cloud crossover).
The closing price is below the EMA 200, indicating a bearish bias.
The RSI is between 20 and 50, suggesting the potential for a downtrend.
The MACD Histogram is negative, indicating increasing bearish momentum.
The low price is at least 25% below the EMA 200.
Stoch RSI Filter:
Additionally, a filter based on Stoch RSI slope is applied. The indicator will only open a position if the Stoch RSI is declining for short positions (sell) and rising for long positions (buy).
Visualization:
Buy signals are marked with green triangles below the bars.
Sell signals are marked with red triangles above the bars.
The Ichimoku Cloud is plotted in the background, with cloud colors changing based on whether the Conversion Line or Base Line is higher.
This indicator can be a valuable tool for traders looking to combine multiple technical analysis techniques to make informed trading decisions in the financial markets.
MTF Stoch RSI + Realtime DivergencesMulti-timeframe Stochastic RSI + Realtime Divergences + Alerts + Pivot lookback periods.
This version of the Stochastic RSI adds the following additional features to the stock UO by Tradingview:
- Optional 3 x Multiple-timeframe overbought and oversold signals, indicating where 3 selected timeframes are all overbought (>80) or all oversold (<20) at the same time, with alert option.
- Optional divergence lines drawn directly onto the oscillator in realtime, with alert options.
- Configurable lookback periods to fine tune the divergences drawn in order to suit different trading styles and timeframes, including the ability to enable automatic adjustment of pivot period per chart timeframe.
- Alternate timeframe feature allows you to configure the oscillator to use data from a different timeframe than the chart it is loaded on.
- Indications where the Stoch RSI is crossing down from above the overbought threshold (<80) and crossing above the oversold threshold (>20) levels on a given user selected timeframe, by printing gold dots on the indicator.
- Also includes standard configurable Stoch RSI options, including k length, d length, RSI length, Stochastic length, and source type (close, hl2, etc)
While this version of the Stochastic RSI has the ability to draw divergences in realtime along with related settings and alerts so you can be notified as divergences occur without spending all day watching the charts, the main purpose of this indicator was to provide the triple multiple-timeframe overbought and oversold confluence signals and alerts, in an attempt to add more confluence, weight and reliability to the single timeframe overbought and oversold states, commonly used for trade entry confluence. It's primary purpose is intended for scalping on lower timeframes, typically between 1-15 minutes. The triple timeframe overbought can often indicate near term reversals to the downside, with the triple timeframe oversold often indicating neartime reversals to the upside. The default timeframes for this confluence are set to check the 1 minute, 5 minute, and 15 minute timeframes, ideal for scalping the < 15 minute charts.
The Stochastic RSI
The popular oscillator has been described as follows:
“The Stochastic RSI is an indicator used in technical analysis that ranges between zero and one (or zero and 100 on some charting platforms) and is created by applying the Stochastic oscillator formula to a set of relative strength index (RSI) values rather than to standard price data. Using RSI values within the Stochastic formula gives traders an idea of whether the current RSI value is overbought or oversold. The Stochastic RSI oscillator was developed to take advantage of both momentum indicators in order to create a more sensitive indicator that is attuned to a specific security's historical performance rather than a generalized analysis of price change.”
How do traders use overbought and oversold levels in their trading?
The oversold level, that is when the Stochastic RSI is above the 80 level is typically interpreted as being 'overbought', and below the 20 level is typically considered 'oversold'. Traders will often use the Stochastic RSI at an overbought level as a confluence for entry into a short position, and the Stochastic RSI at an oversold level as a confluence for an entry into a long position. These levels do not mean that price will necessarily reverse at those levels in a reliable way, however. This is why this version of the Stoch RSI employs the triple timeframe overbought and oversold confluence, in an attempt to add a more confluence and reliability to this usage of the Stoch RSI.
What are divergences?
Divergence is when the price of an asset is moving in the opposite direction of a technical indicator, such as an oscillator, or is moving contrary to other data. Divergence warns that the current price trend may be weakening, and in some cases may lead to the price changing direction.
There are 4 main types of divergence, which are split into 2 categories;
regular divergences and hidden divergences. Regular divergences indicate possible trend reversals, and hidden divergences indicate possible trend continuation.
Regular bullish divergence: An indication of a potential trend reversal, from the current downtrend, to an uptrend.
Regular bearish divergence: An indication of a potential trend reversal, from the current uptrend, to a downtrend.
Hidden bullish divergence: An indication of a potential uptrend continuation.
Hidden bearish divergence: An indication of a potential downtrend continuation.
Setting alerts.
With this indicator you can set alerts to notify you when any/all of the above types of divergences occur, on any chart timeframe you choose, and also when the triple timeframe overbought and oversold confluences occur.
Configurable pivot lookback values.
You can adjust the default pivot lookback values to suit your prefered trading style and timeframe. If you like to trade a shorter time frame, lowering the default lookback values will make the divergences drawn more sensitive to short term price action. By default, this indicator has enabled the automatic adjustment of the pivot periods for 4 configurable timeframes, in a bid to optimise the divergences drawn when the indicator is loaded onto any of the 4 timeframes. These timeframes and the auto adjusted pivot periods on each of them can also be reconfigured within the settings menu.
How do traders use divergences in their trading?
A divergence is considered a leading indicator in technical analysis , meaning it has the ability to indicate a potential price move in the short term future.
Hidden bullish and hidden bearish divergences, which indicate a potential continuation of the current trend are sometimes considered a good place for traders to begin, since trend continuation occurs more frequently than reversals, or trend changes.
When trading regular bullish divergences and regular bearish divergences, which are indications of a trend reversal, the probability of it doing so may increase when these occur at a strong support or resistance level . A common mistake new traders make is to get into a regular divergence trade too early, assuming it will immediately reverse, but these can continue to form for some time before the trend eventually changes, by using forms of support or resistance as an added confluence, such as when price reaches a moving average, the success rate when trading these patterns may increase.
Typically, traders will manually draw lines across the swing highs and swing lows of both the price chart and the oscillator to see whether they appear to present a divergence, this indicator will draw them for you, quickly and clearly, and can notify you when they occur.
Disclaimer: This script includes code from the stock UO by Tradingview as well as the Divergence for Many Indicators v4 by LonesomeTheBlue.

WT + Stoch RSI Reversal Combo📊MR.Z RSI : WT + Stochastic RSI Reversal Combo
This custom indicator combines WaveTrend oscillator and Stochastic RSI to detect high-confidence market reversal points, filtering signals so they only appear when both indicators align.
🔍 Core Components:
✅ WaveTrend Oscillator
Based on smoothed deviation from EMA (similar to TCI logic)
Plots:
WT1 (main line)
WT2 (signal line = SMA of WT1)
Uses overbought/oversold thresholds (default: ±53) to filter signals
✅ Stochastic RSI
Momentum oscillator based on RSI's stochastic value
Plots:
%K: smoothed Stoch of RSI
%D: smoothed version of %K
Adjustable oversold/overbought thresholds (default: 20/80)
🔁 Combined Reversal Signal Logic:
🔼 Buy Signal
WT1 crosses above WT2 below WT oversold level (e.g., -53)
%K crosses above %D below Stoch RSI oversold level (e.g., 20)
🔽 Sell Signal
WT1 crosses below WT2 above WT overbought level (e.g., 53)
%K crosses below %D above Stoch RSI overbought level (e.g., 80)
🔔 Signals are only plotted and alerted if both conditions are true.
📌 Features:
Toggle on/off:
WaveTrend lines and histogram
Stochastic RSI
Combined Buy/Sell signals
Horizontal reference lines (±100, OB/OS)
Fully customizable smoothing lengths and thresholds
Signal plots:
✅ Green up-triangle = Combo Buy
✅ Red down-triangle = Combo Sell
Optional: Circle/cross markers for WT-only and Stoch-only signals
🔔 Built-in alerts for Buy/Sell signals
📈 Use Cases:
Reversal Trading: Wait for both indicators to confirm momentum shift
Entry Filter: Use in combination with trend indicators (like EMA)
Scalping or Swing: Works on intraday and higher timeframes

S73 RSI & Stoch RSIRSI and Stoch RSI combined into 1.
Get 2 for the price of 1.
Stoch RSI has two extra h lines, 10 an 90, as well as the traditional 20 and 80.
Remember, High Stoch RSI can mark the strength of a trend, doesn't necessarily mean there will be a change in trend once top and bottom levels are hit.
Click here to see how BTC has been topped out between levels of 90-100 for 14 weeks on the weekly chart.
[Sextan] MACD with Stoch RSI and Baseline with risk controlLevel 1
Background
An example to take 3 mintes to backtest "Full System MACD with Stoch RSI and Baseline with risk control" with sextan backtest framework
Function
Courtesy of @SoftKill21
Full System MACD with Stoch RSI and Baseline with risk control
This system can be used on all timeframes. It works on scalping, daytrading and swing trading.Its made from a Baseline slow and fast , together with MACD , Stochastic RSI .
Remarks
Courtesy of @SoftKill21
Feedbacks are appreciated.

BD RSI & STOCH RSI BAR COLOR CHANGERA simple indicator displaying RSI and STOCHASTIC RSI combined in the one indicator. This indicator also changes the bar colour to yellow when it meets the overbrought conditions of both the RSI and the STOCH RSI and changes the bar colour to black when it meets the oversold conditions of both the RSI and STOCH RSI. The values of these conditions are set as the regular defaults but can be changed in the input settings to suit different time frames and user requirements. This does NOT generate signals but simply shows when both the RSI & STOCH RSI are oversold or overbrought.

Normalized MACD with RSI & Stoch RSI + SignalsNormalized MACD with RSI & Stoch RSI Indicator
Overview:
This indicator combines three popular momentum indicators (MACD, RSI, and Stochastic RSI) into a single cohesive, normalized view, making it easier for traders to interpret market momentum and potential buy/sell signals. It specifically addresses an important issue—the different scale ranges of indicators—by normalizing MACD values to match the 0–100 scale of RSI and Stochastic RSI.
Here’s a clear and concise description of your updated Pine Script indicator:
⸻
Normalized MACD with RSI & Stoch RSI Indicator
Overview:
This indicator combines three popular momentum indicators (MACD, RSI, and Stochastic RSI) into a single cohesive, normalized view, making it easier for traders to interpret market momentum and potential buy/sell signals. It specifically addresses an important issue—the different scale ranges of indicators—by normalizing MACD values to match the 0–100 scale of RSI and Stochastic RSI.
⸻
Key Components:
① MACD (Normalized):
• The Moving Average Convergence Divergence (MACD) originally has an unlimited numerical range.
• Normalization Method:
• Uses a custom tanh(x) function implemented directly in Pine Script:
\tanh(x) = \frac{e^{x}-e^{-x}}{e^{x}+e^{-x}}
• MACD values are scaled using this method to a range of 0–100, with the neutral line at exactly 50.
• Interpretation:
• Values above 50 indicate bullish momentum.
• Values below 50 indicate bearish momentum.
② RSI (Relative Strength Index):
• Measures market momentum on a 0–100 scale.
• Traditional RSI interpretation:
• Overbought conditions: RSI > 70–80.
• Oversold conditions: RSI < 30–20.
③ Stochastic RSI:
• Combines RSI and Stochastic Oscillator to give short-term, highly sensitive signals.
• Helps identify immediate market extremes:
• Above 80 → Short-term overbought.
• Below 20 → Short-term oversold.
⸻
How the Indicator Works:
• Visualization:
• All three indicators (Normalized MACD, RSI, Stochastic RSI) share the same 0–100 scale.
• Clear visual lines and reference levels:
• Midline at 50 indicates neutral momentum.
• Dashed lines at 20 and 80 clearly mark oversold/overbought zones.
• Trading Signals (Recommended approach):
• Bullish Signal (Potential Buy):
• Normalized MACD crosses above 50.
• RSI below or approaching oversold zone (below 30–20).
• Stochastic RSI below 20, indicating short-term oversold conditions.
• Bearish Signal (Potential Sell):
• Normalized MACD crosses below 50.
• RSI above or approaching overbought zone (above 70–80).
• Stochastic RSI above 80, indicating short-term overbought conditions.
⸻
Why Use This Indicator?
• Harmonized Signals:
Normalization of MACD significantly improves clarity and comparability with RSI and Stochastic RSI, providing a unified momentum picture.
• Intuitive Analysis:
Traders can rapidly and intuitively identify momentum shifts without needing multiple indicator windows.
• Improved Decision-Making:
Clear visual references and signals help reduce subjective interpretation, potentially improving trading outcomes.
⸻
Suggested Usage:
• Combine with traditional support

RSI / Stoch / Stoch RSI (SRSI) Overlay [SigmaDraconis]One indicator combining RSI, Stochastic Oscillator and Stochastic RSI in one.
Credits for rwhiteside and his RSI / Stoch RSI Overlay indicator who served as inspiration to all three.
I believe this will be very useful to a lot of people.
If you like, use and i prove to be , you can contribute to my
TIP JAR :

RSI AND SMOOTHED STOCH RSI TOGETHERi dont know pine script but here i used some free ones and merged them and modified some
especially smoothed stoch rsi is Good to decide when buy coz i modified it and when fast K value is over D value it changes color
visually better this way
also rsi is shown as area o histogram but if u dont like u can change to line
for stoch rsi i unclick xtrigger (d value) for better appearance

MTF Stoch RSI Confluence + Combined AlertMTF STOCH RSI CONFLUENCE INDICATOR 1m/5m/15m ( Scalping Indicator added on SRSI 1H)
IF all three Stoch are overbought(above 80) the indicator creates a red vertical line. If all Stoch are oversold(below 20) the indicator creates a green vertical line.
RULES!!!!
NEVER TRADE AGAINST THE TREND!!! This is super important!!!!
If 1H SRSI is above 80 with MTF overbouht and ZC is red (Downtrend) then we open a MR Short- (Prefered at PA Spikes) The same for opposites MR Longs.
If 1H SRSI is above 80 with the MTF oversold and ZC green then we can open a Long position. Prefered Momo Long. The same applies for opposite, hence momo short.

ReadyFor401ks Stoch + RSIThis indicator is a powerful tool that combines the classic Relative Strength Index (RSI) with a Stochastic RSI to provide traders with a more nuanced view of market momentum and potential reversal points. By blending these two techniques, the script offers a detailed insight into price action, highlighting when a market might be overbought or oversold. The RSI is calculated once and then used both for a traditional RSI plot and to derive the Stochastic RSI, ensuring consistency and efficiency in your analysis.
One of the standout features of this indicator is its dynamic visual presentation. A gradient color scheme is applied to the RSI line, which changes based on its position between customizable overbought and oversold levels. This visual cue allows traders to quickly identify critical zones without having to constantly monitor numerical values. Additionally, the background fill between these levels enhances clarity, making it easier to spot when conditions are ripe for a potential reversal.
The indicator is highly customizable, allowing you to adjust parameters such as the RSI period, Stochastic length, and smoothing factors. This flexibility means you can fine-tune the tool to suit different market conditions, whether you’re trading trending markets or range-bound environments. For example, an RSI crossover above the oversold level can signal an emerging upward trend, while a crossover below the overbought level may indicate a downturn, providing actionable alerts that can be integrated into your trading strategy.
Overall, the ReadyFor401k Stoch + RSI indicator is designed to offer a clear, concise, and visually engaging method for monitoring market momentum. It serves as an excellent complement to other technical analysis tools and can help improve your decision-making process by providing early warning signals for potential market reversals. Whether you’re a seasoned trader or just starting out, this indicator can be a valuable addition to your TradingView toolkit.

Hull Suite + Stoch RSI Strategy v1.1 This strategy uses Hull Suite with Stoch RSI
Uses Hull Suite as trend and only trades with the direction of the trend.
Entry conditions:
Hull Suite as a trend
Stoch RSI overbought for short entries & oversold for long entries
Current parameters works best on BINANCE:BNBBUSDPERP pair.

Multi-timeframe MAs + Stoch RSI SignalsHello traders,
I welcome you to my first published script on TradingView: “Multi-timeframe Moving Averages + Stochastic RSI”.
The script is based on a simple formula: Buy signals are generated when a fast moving average is above a slower moving average (uptrend) and the Stochastic RSI K line is crossing above the oversold level (entry).
Sell signals are generated when a fast moving average is below a slower moving average (downtrend) and the Stochastic RSI K line is crossing below the overbought level (entry).
This indicator works best in strong trends!
**Please note the above example has repainting turned on which may produce unrealistic results when viewing historical data. See below for more information regarding this and how you can turn it off.**
The user has the following inputs:
- Option to change the Stochastic RSI settings, including the oversold and overbought levels.
- Option to enter any value for both the Fast Moving Average and the Slow Moving Average.
- Option to change between EMA or SMA for each moving average.
- Multiple time frames to choose from, as well as the ability to selectively turn off individual time frames (both plots and alerts).
(Default time frames are 1 hour, 4 hour, and Daily. You can have a 4th time frame by changing your current time frame to something lower than the other 3 time frames)
- Turn on/off repainting: If repainting is turned on you will get an alert and buy/sell signal on chart immediately when condition is met, however the signal may disappear from chart if the condition reverses during the same candle.
If repainting is turned off, the indicator will wait for the candle to close before issuing the alert and painting the signal on chart.
For higher time frames, the indicator will wait for the candle in the higher time frame to close before issuing a signal if repaint is turned off. Default is set to Repaint on, so please be aware of this if you do not want repainting.
How to use alerts:
- Before you do anything, make sure your current time frame is the lowest time frame you’d like alerts on, as you will still receive alerts for the higher time frames you selected in settings.
- Once you have all the settings changed to how you like, save your chart first. Then right click on any of the indicator’s buy/sell signals on the chart and click “Add Alert on MAs + Stoch RSI”.
- Make sure “Any alert() function call” is selected under the Condition.
- You can delete or change the text in “Alert name” if you want as the alert message is already built into the indicator, and it will tell you in the alert message which asset and time frame to buy or sell.
Other things to note:
- The indicator will not display the buy/sell signals of lower time frames when you are on a higher time frame. This was done purposely to reduce clutter on the chart when you switch to higher time frames.
- While the alert message will tell you which time frame a signal was generated, the plots on the chart will instead show “Buy/Sell TF1, or TF2, or TF3”.
If the signal is from the current time frame that the alert was created on, then it will simply show “Buy” or “Sell”.
Hope you guys enjoy using this one, please drop a like if you found it useful. If anyone wants to modify my script in any way, please just credit me for the original work when you publish the script. Good luck!

RSI/Stoch RSI ComboIt shows both rsi and stoch rsi as one indicator. You need to select which one using checkbox.
CCU MFI + RSI + STOCH RSIThis demonstrates the accuracy of entry signal of the MFI + RSI + STOCH RSI strategy

RSI and Stoch RSI Midline Crossover ArrowsPuts arrows on chart when RSI crosses over 52 and also when Stoch RSI crosses up 52 based on Warsnop strategy.
