[blackcat] L2 Ehlers Roofing Filter IndicatorLevel: 2
Background
John F. Ehlers introuced Roofing Filter Indicator in his "Cycle Analytics for Traders" chapter 7 on 2013.
Function
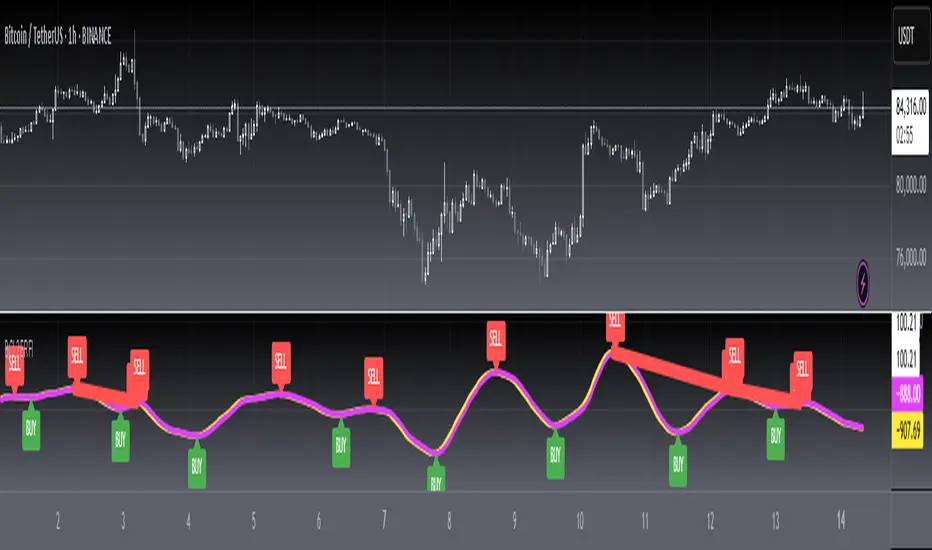
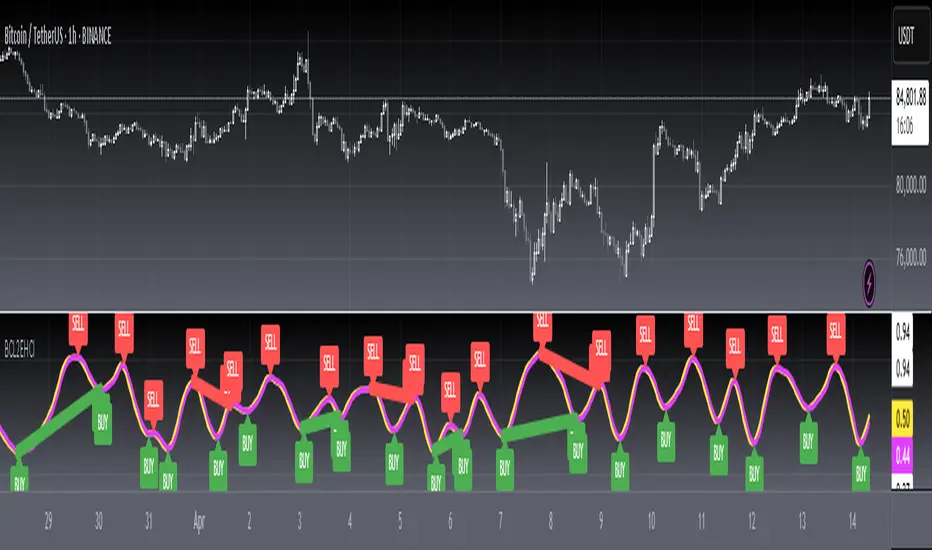
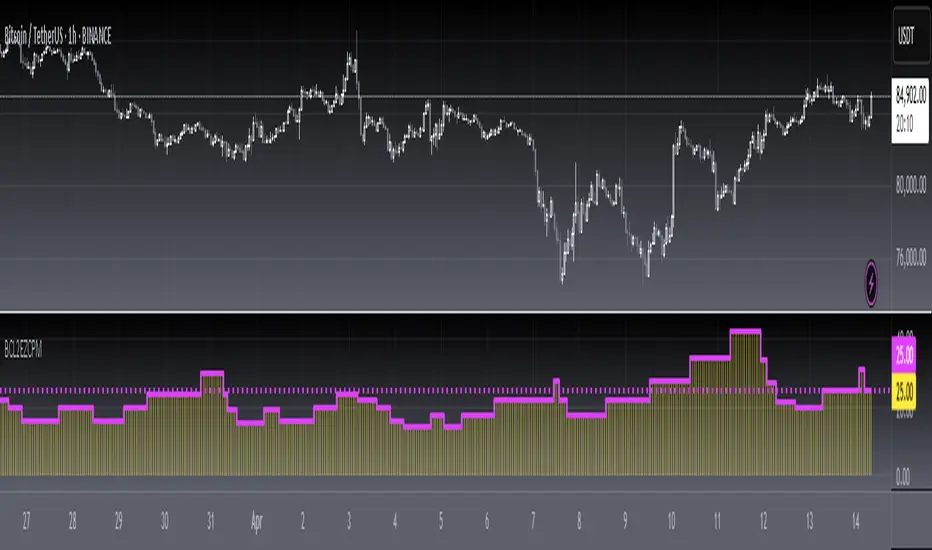
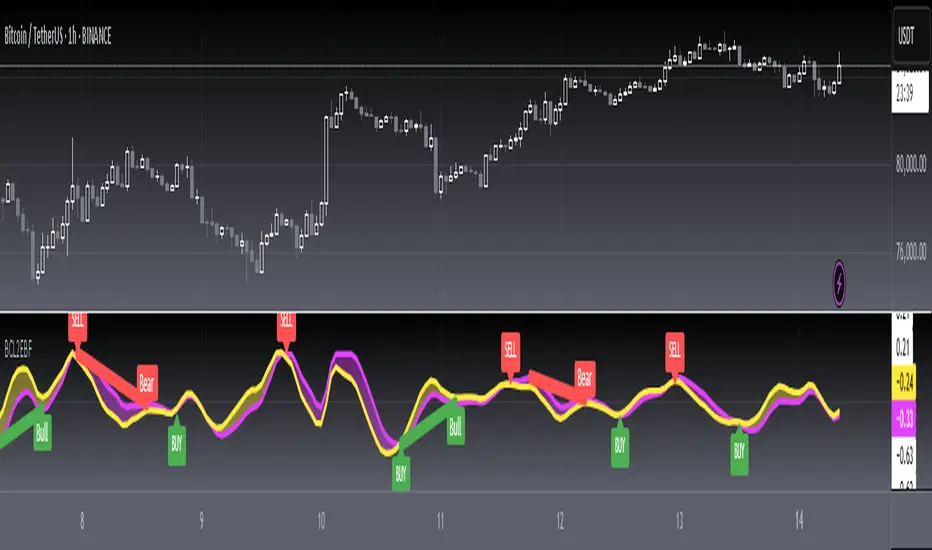
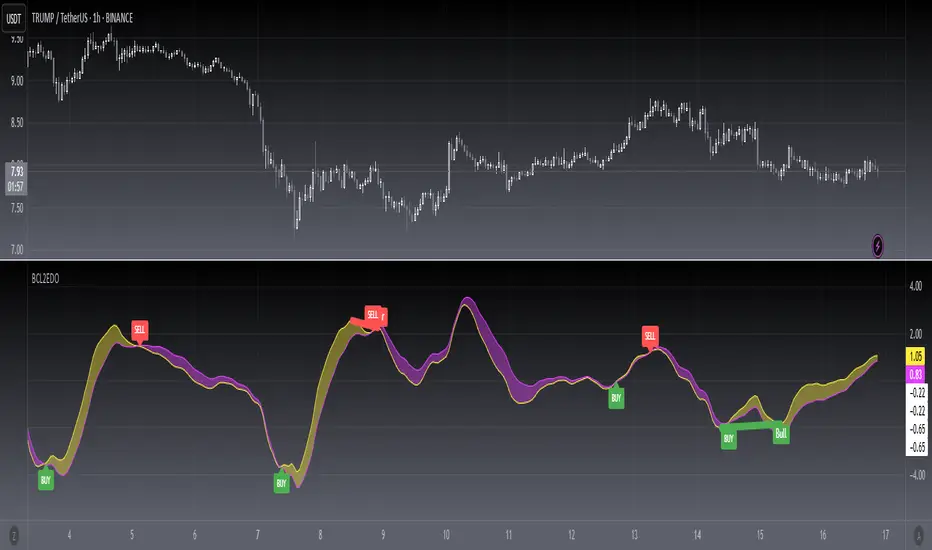
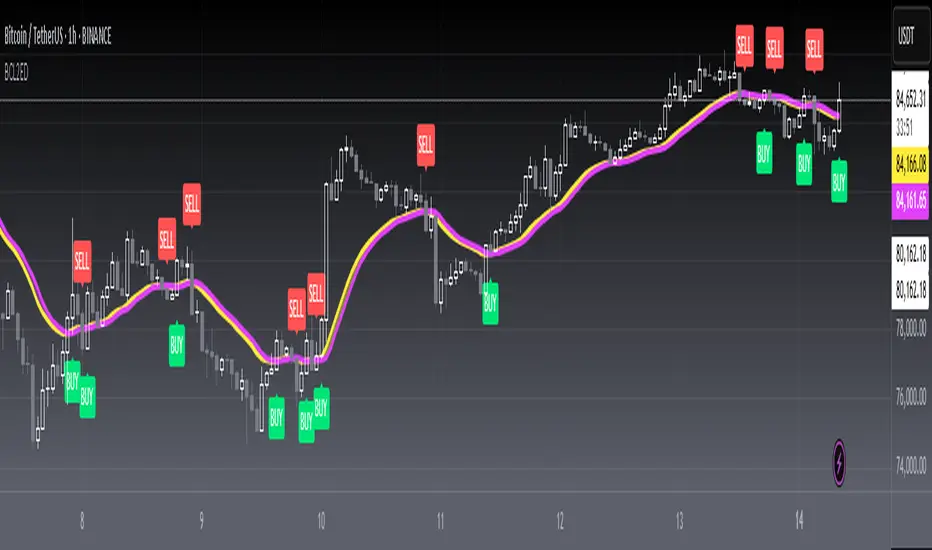
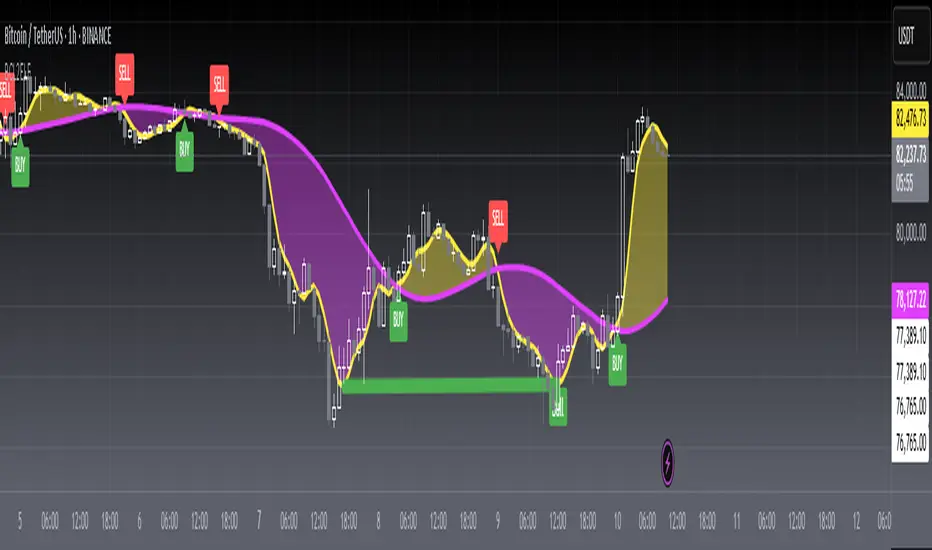
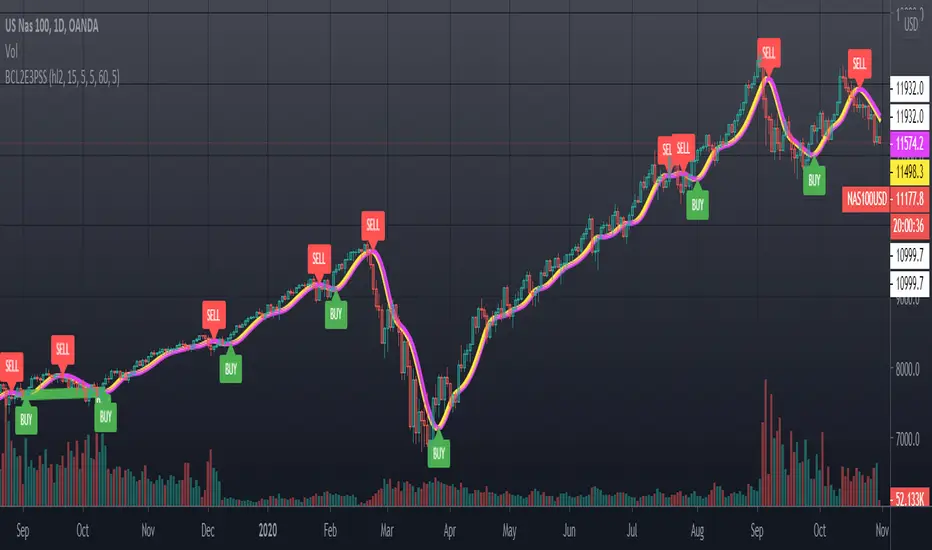
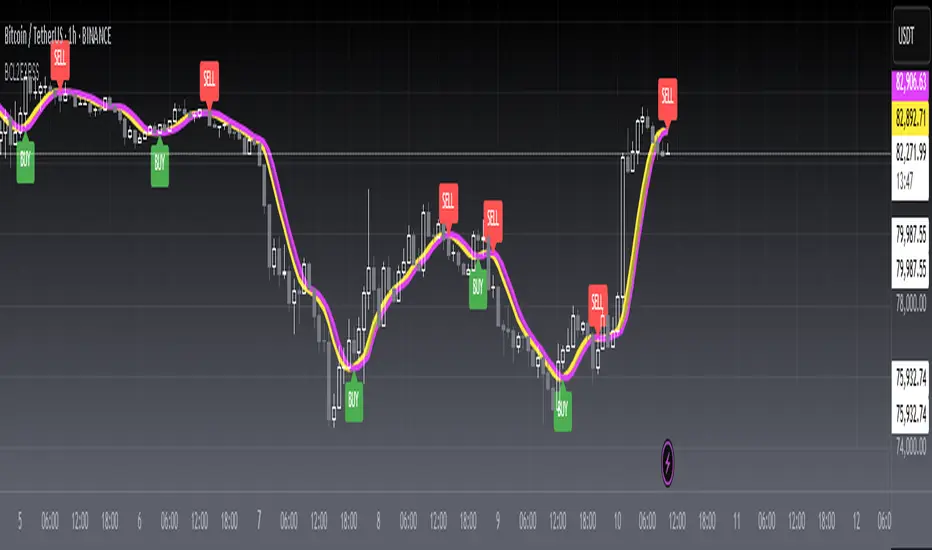
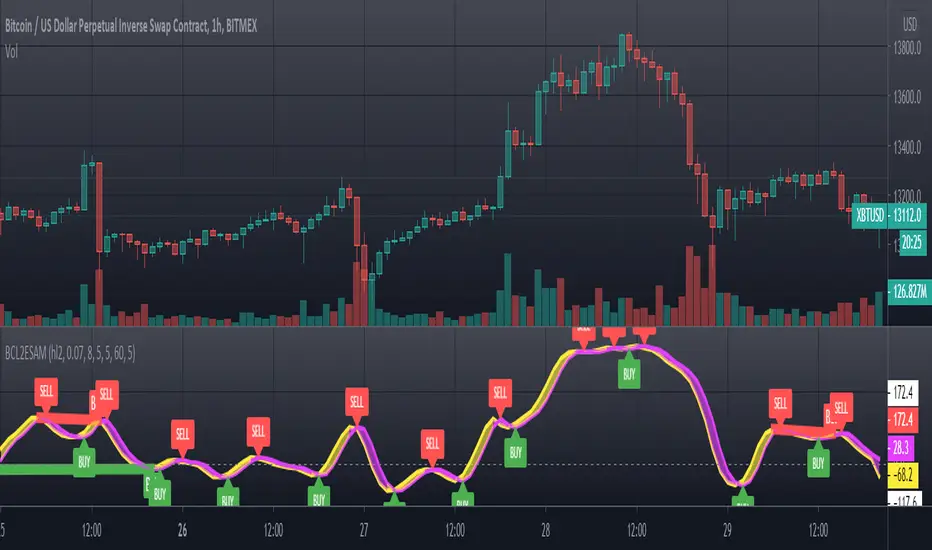
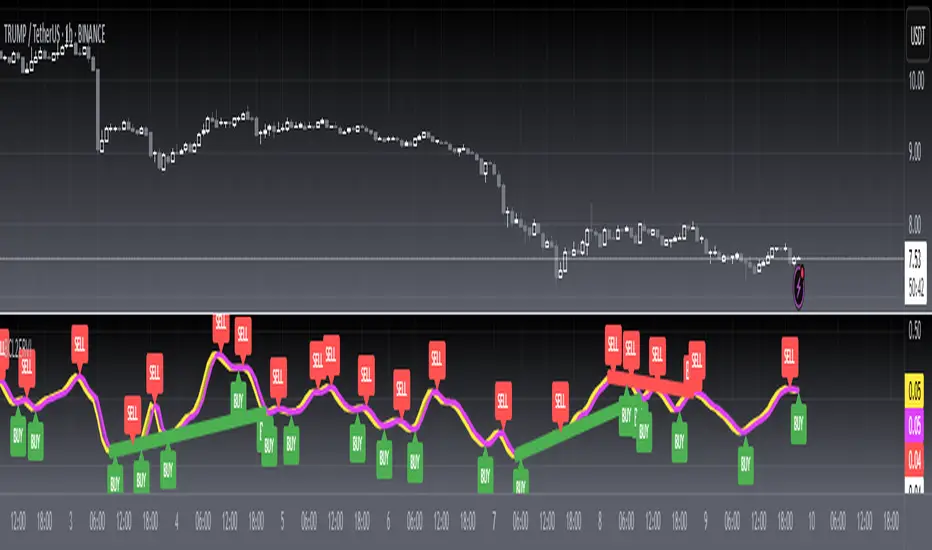
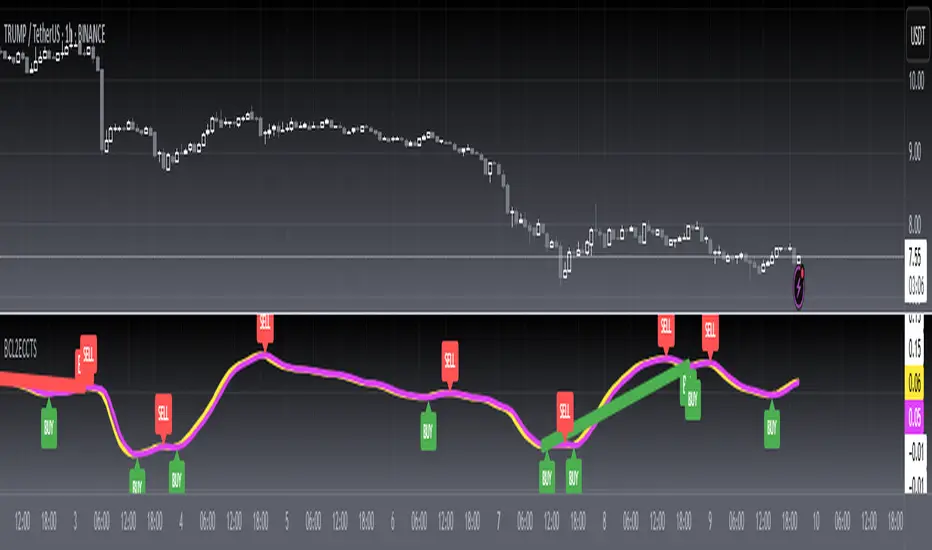
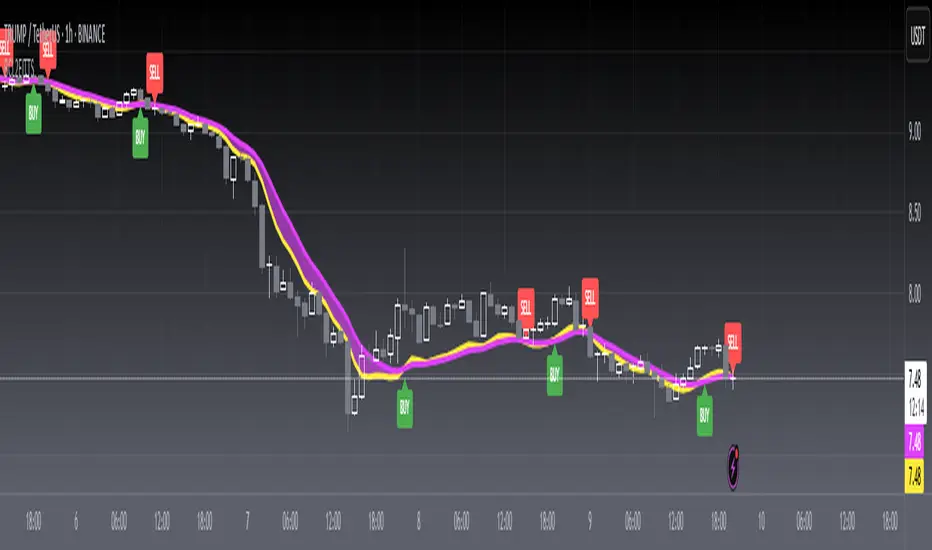
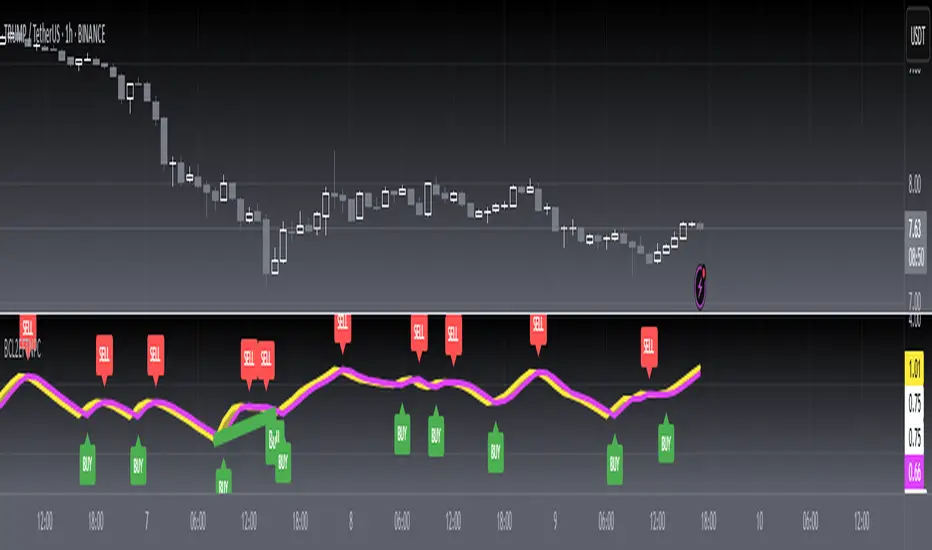
The roofing filter does an excellent job of using only the frequency components between its upper and lower critical periods. All that needs to be done to create an indicator from the roofing filter is to add more generality by allowing the high-pass and low-pass critical periods be supplied as indicator inputs. The two high-pass filters have been implemented as a single two-pole high-pass filter. The ideal time to buy is when the cycle is at a trough, and the ideal time to exit a long position or to sell short is when the cycle is at a peak. These conditions are flagged by the filter crossing itself delayed by one bar, and are included as part of the indicator.
Key Signal
Filt --> Roofing Filter Indicator fast line
Trigger --> Roofing Filter Indicator slow line
Pros and Cons
100% John F. Ehlers definition translation of original work, even variable names are the same. This help readers who would like to use pine to read his book. If you had read his works, then you will be quite familiar with my code style.
Remarks
The 43th script for Blackcat1402 John F. Ehlers Week publication.
Readme
In real life, I am a prolific inventor. I have successfully applied for more than 60 international and regional patents in the past 12 years. But in the past two years or so, I have tried to transfer my creativity to the development of trading strategies. Tradingview is the ideal platform for me. I am selecting and contributing some of the hundreds of scripts to publish in Tradingview community. Welcome everyone to interact with me to discuss these interesting pine scripts.
The scripts posted are categorized into 5 levels according to my efforts or manhours put into these works.
Level 1 : interesting script snippets or distinctive improvement from classic indicators or strategy. Level 1 scripts can usually appear in more complex indicators as a function module or element.
Level 2 : composite indicator/strategy. By selecting or combining several independent or dependent functions or sub indicators in proper way, the composite script exhibits a resonance phenomenon which can filter out noise or fake trading signal to enhance trading confidence level.
Level 3 : comprehensive indicator/strategy. They are simple trading systems based on my strategies. They are commonly containing several or all of entry signal, close signal, stop loss, take profit, re-entry, risk management, and position sizing techniques. Even some interesting fundamental and mass psychological aspects are incorporated.
Level 4 : script snippets or functions that do not disclose source code. Interesting element that can reveal market laws and work as raw material for indicators and strategies. If you find Level 1~2 scripts are helpful, Level 4 is a private version that took me far more efforts to develop.
Level 5 : indicator/strategy that do not disclose source code. private version of Level 3 script with my accumulated script processing skills or a large number of custom functions. I had a private function library built in past two years. Level 5 scripts use many of them to achieve private trading strategy.
Penunjuk Pine Script®