Simple Trendlines📈 Trendlines, made easy.
Simple Trendlines is a carefully made library that provides an easy and accessible way to draw trendlines on the chart.
Containing only 10 properties and 2 methods, the implementation is designed to be understandable through an object-oriented structure and provides developers the opportunity to expand without having to deal with slope calculation while also ensuring that there's no leakage between the trendlines before they're drawn.
Developers only need to provide 5 expressions to get everything up in running. This includes the following but is not limited to
The x-axis
Point A (Y1 Value)
Point B (Y2 Value)
A condition to draw the line
A condition to keep the trendline under continuation
Automatic x-axis calculation is not a built-in feature due to the inconsistency it could bring.
📕 Quick Example
import HoanGhetti/SimpleTrendlines/1 as tl
input_len = input.int(defval = 10)
pivotLow = fixnan(ta.pivotlow(input_len, input_len))
xAxis = ta.valuewhen(ta.change(pivotLow), bar_index, 0) - ta.valuewhen(ta.change(pivotLow), bar_index, 1)
prevPivot = ta.valuewhen(ta.change(pivotLow), pivotLow, 1)
pivotCondition = ta.change(pivotLow) and pivotLow > prevPivot
plData = tl.new(x_axis = xAxis, offset = input_len)
plData.drawLine(pivotCondition, prevPivot, pivotLow)
plData.drawTrendline(close > 0)
plData.lines.trendline.set_style(line.style_dashed)
plData.lines.trendline.set_width(2)
plData.lines.startline.set_width(2)
Excluding the styling at the bottom, that was only 8 lines of code which yields the following result.
⏳ Before continuing
The library does not support block-scoped execution. Conditions must be declared before and integrated as a parameter. This doesn't limit any capabilities and only involves thinking logically about precedence. It was made this way for code readability and to keep things organized.
The offset value inside the TrendlineSettings object can potentially affect performance (although very minimal) if you're using strict mode. When using strict mode, it loops through historical values to then do backend calculations.
🔽 Getting Started 🔽
Creating trendlines without a library isn't a hard task. However, the library features a built-in system called strict mode. We'll dive further into this below.
Creating an Instance
You can create an instance of the library by calling the new() function. Passing an identifier is conventionally mandatory in this case so you can reference properties and methods.
import HoanGhetti/SimpleTrendlines/2 as tl
lineData = tl.new(int x_axis, int offset, bool strictMode, int strictType)
___
int x_axis (Required) The distance between point A and point B provided by the user.
int offset (Optional) The offset from x2 and the current bar_index. Used in situations where conditions execute ahead of where the x2 location is such as pivót events.
bool strictMode (Optional) Strict mode works in the backend of things to ensure that the price hasn't closed below the trendline before the trendline is drawn.
int strictType (Optional) Only accepts 0 and 1, 0 ensures that the price during slope calculation is above the line, and 1 ensures that the price during slope calculation is below the line.
The Initial Line
After instantiating the library, we can go ahead use the identifer we made above and create an instance of our initial line by calling the drawLine() method.
lineData.drawLine(bool condition, float y1, float y2, float src)
___
bool condition (Required) The condition in order to draw a new line.
float y1 (Required) The y-value of point A.
float y2 (Required) The y-value of point B.
float src (Optional) Determines which value strict mode will actively check for leakage before a trendline is drawn.
Typically used if you're not referencing OHLC values for your y-values, or you want to check for another value to exceed the line besides using the close value.
The Trendline
The trendline that gets drawn solely uses the values of the initial line and can be called using the drawTrendline() method. The library enforces a condition as a parameter in order to maintain simplicity.
lineData.drawTrendline(bool condition)
___
bool condition (Required) The condition in order to maintain and continue drawing the trendline.
⚙️ Features
🔹 Automatic Slope Calculation
In the background, the library calculates the next Y2 and X2 values on every tick for the trendline. Preventing the developer from having to do such a process themself.
🔹 Object-Oriented
Each object contains manipulative properties that allow the developer to debug and have the freedom they want.
🔹 Enforced Error Checking
Runtime errors have been put in place to ensure you're doing things correctly.
🔹 Strict Mode & Offset
Strict mode can only be used when the offset value is over 0. It's a feature that's only meant to function under scenarios where a condition executes further than where the X2 is relative to the current bar_index value.
Let's think about pivot systems. As you're aware, pivot events are detected based on historical factors. If a swing low occurred nth bars ago, then the pivot condition will execute at the current bar_index instead of executing nth bars back.
Now because of this, what if you wanted to draw a trendline when the pivot event is executed? The offset value takes care of this just as you would when developing your other scripts, basically how we always do bar_index - n. However, what does this mean for strict mode?
The photo below represents the logic behind the execution.
When looking at this image, imagine this just happened, the event just executed and the trendline is now drawn. Pay attention to all the values inside the surrounding box. As you can see there are some candles that closed below the trendline before the trendline was drawn.
From what I can see 5-6 candles closed below the trendline during slope calculation. The goal of strict mode is to be a provisional system that prevents such occurrences from happening.
Here's a photo with strict mode on.
🔹 Strict Type
A parameter used in the new() function that acts as a representation of what strict mode should calculate for. It accepts only two values, 0 and 1.
0 - Ensures that all candles have closed above the trendline before the trendline is drawn.
1 - Ensures that all candles have closed below the trendline before the trendline is drawn.
In the most recent photo above, I used 0 for strict type, since I was wanting to have a clean trendline and ensure that not a single candlestick closed below.
If you want to reference something else besides the close value during strict mode calculation, you can change it in the drawLine() method.
If it's still difficult to understand, think 0 for pivot lows, and 1 for pivot highs.
📕 Methods and Property Inheritance
The library isn't crazy, but hopefully, it helps.
That is all.👍
Cari dalam skrip untuk "TRENDLINES"

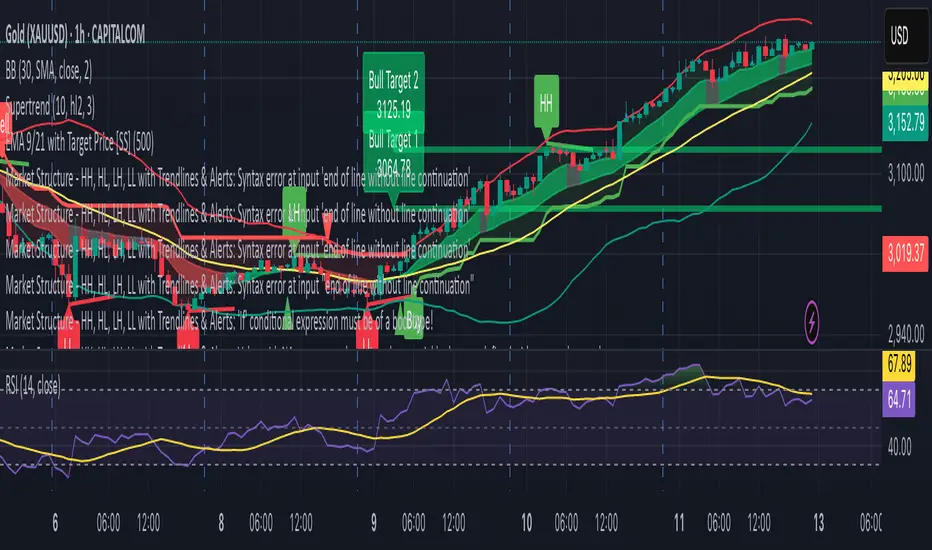
Market Structure - HH, HL, LH, LL with Trendlines & AlertsMarket Structure Script – HH, HL, LH, LL with Trendlines & Alerts
This Pine Script is designed to help identify key market structure patterns such as Higher Highs (HH), Higher Lows (HL), Lower Highs (LH), and Lower Lows (LL) on price charts. It also draws trendlines connecting the respective swing points and provides alerts when these important price patterns occur.
Key Features:
Swing High and Low Detection:
The script uses the ta.pivothigh and ta.pivotlow functions to identify significant swing highs and swing lows based on the pivot length (pivotLen). These points mark local peaks and troughs in the price action.
Dynamic Pivot Length:
The script adjusts the pivotLen (which defines the number of bars used to calculate swing points) based on the current timeframe of the chart. For example, for a 15-minute chart, it uses a pivot length of 5 bars, while for a daily chart, it uses 10 bars. This dynamic adjustment ensures that the script works across different timeframes.
Higher Highs (HH), Higher Lows (HL), Lower Highs (LH), Lower Lows (LL):
Higher High (HH): Identifies a price peak that is higher than the previous swing high, indicating an uptrend.
Higher Low (HL): Identifies a price trough that is higher than the previous swing low, supporting the idea of an ongoing uptrend.
Lower High (LH): Identifies a price peak that is lower than the previous swing high, suggesting a potential reversal or downtrend.
Lower Low (LL): Identifies a price trough that is lower than the previous swing low, indicating a downtrend.
Trendlines:
For each identified Higher High, Higher Low, Lower High, or Lower Low, the script automatically draws a trendline connecting the corresponding swing points. These trendlines provide a visual representation of the market’s price structure, showing support and resistance levels.
Labels:
The script places labels on the chart next to the respective swing points. These labels mark whether the point is a Higher High (HH), Higher Low (HL), Lower High (LH), or Lower Low (LL). This helps traders easily visualize the price pattern at a glance.
Alerts:
Alert conditions are set for when a Higher High (HH), Higher Low (HL), Lower High (LH), or Lower Low (LL) is detected. Users can set up alerts to be notified whenever one of these key market structure patterns forms. Alerts are an essential feature for traders who want to act quickly when important trend changes are happening.
Auto TrendLines [TradingFinder] Support Resistance Signal Alerts🔵 Introduction
The trendline is one of the most essential tools in technical analysis, widely used in financial markets such as Forex, cryptocurrency, and stocks. A trendline is a straight line that connects swing highs or swing lows and visually indicates the market’s trend direction.
Traders use trendlines to identify price structure, the strength of buyers and sellers, dynamic support and resistance zones, and optimal entry and exit points.
In technical analysis, trendlines are typically classified into three categories: uptrend lines (drawn by connecting higher lows), downtrend lines (formed by connecting lower highs), and sideways trends (moving horizontally). A valid trendline usually requires at least three confirmed touchpoints to be considered reliable for trading decisions.
Trendlines can serve as the foundation for a variety of trading strategies, such as the trendline bounce strategy, valid breakout setups, and confluence-based analysis with other tools like candlestick patterns, divergences, moving averages, and Fibonacci levels.
Additionally, trendlines are categorized into internal and external, and further into major and minor levels, each serving unique roles in market structure analysis.
🔵 How to Use
Trendlines are a key component in technical analysis, used to identify market direction, define dynamic support and resistance zones, highlight strategic entry and exit points, and manage risk. For a trendline to be reliable, it must be drawn based on structural principles—not by simply connecting two arbitrary points.
🟣 Selecting Pivot Types Based on Trend Direction
The first step is to determine the market trend: uptrend, downtrend, or sideways.
Then, choose pivot points that match the trend type :
In an uptrend, trendlines are drawn by connecting low pivots, especially higher lows.
In a downtrend, trendlines are formed by connecting high pivots, specifically lower highs.
It is crucial to connect pivots of the same type and structure to ensure the trendline is valid and analytically sound.
🟣 Pivot Classification
This indicator automatically classifies pivot points into two categories :
Major Pivots :
MLL : Major Lower Low
MHL : Major Higher Low
MHH : Major Higher High
MLH : Major Lower High
These define the primary structure of the market and are typically used in broader structural analysis.
Minor Pivots :
mLL: minor Lower Low
mHL: minor Higher Low
mHH: minor Higher High
mLH: minor Lower High
These are used for drawing more precise trendlines within corrective waves or internal price movements.
Example : In a downtrend, drawing a trendline from an MHH to an mHH creates structural inconsistency and introduces noise. Instead, connect points like MHL to MHL or mLH to mLH for a valid trendline.
🟣 Drawing High-Precision Trendlines
To ensure a reliable trendline :
Use pivots of the same classification (Major with Major or Minor with Minor).
Ensure at least three valid contact points (three touches = structural confirmation).
Draw through candles with the least deviation (choose wicks or bodies based on confluence).
Preferably draw from right to left for better alignment with current market behavior.
Use parallel lines to turn a single trendline into a trendline zone, if needed.
🟣 Using Trendlines for Trade Entries
Bounce Entry: When price approaches the trendline and shows signs of reversal (e.g., a reversal candle, divergence, or support/resistance), enter in the direction of the trend with a logical stop-loss.
Breakout Entry: When price breaks through the trendline with strong momentum and a confirmation (such as a retest or break of structure), consider trading in the direction of the breakout.
🟣 Trendline-Based Risk Management
For bounce entries, the stop-loss is placed below the trendline or the last pivot low (in an uptrend).
For breakout entries, the stop-loss is set behind the breakout candle or the last structural level.
A broken trendline can also act as an exit signal from a trade.
🟣 Combining Trendlines with Other Tools (Confluence)
Trendlines gain much more strength when used alongside other analytical tools :
Horizontal support and resistance levels
Moving averages (such as EMA 50 or EMA 200)
Fibonacci retracement zones
Candlestick patterns (e.g., Engulfing, Pin Bar)
RSI or MACD divergences
Market structure breaks (BoS / ChoCH)
🔵 Settings
Pivot Period : This defines how sensitive the pivot detection is. A higher number means the algorithm will identify more significant pivot points, resulting in longer-term trendlines.
Alerts
Alert :
Enable or disable the entire alert system
Set a custom alert name
Choose how often alerts trigger (every time, once per bar, or on bar close)
Select the time zone for alert timestamps (e.g., UTC)
Each trendline type supports two alert types :
Break Alert : Triggered when price breaks the trendline
React Alert : Triggered when price reacts or bounces off the trendline
These alerts can be independently enabled or disabled for all trendline categories (Major/Minor, Internal/External, Up/Down).
Display :
For each of the eight trendline types, you can control :
Whether to show or hide the line
Whether to delete the previous line when a new one is drawn
Color, line style (solid, dashed, dotted), extension direction (e.g., right only), and width
Major lines are typically thicker and more opaque, while minor lines appear thinner and more transparent.
All settings are designed to give the user full control over the appearance, behavior, and alert system of the indicator, without requiring manual drawing or adjustments.
🔵 Conclusion
A trendline is more than just a line on the chart—it is a structural, strategic, and flexible tool in technical analysis that can serve as the foundation for understanding price behavior and making trading decisions. Whether in trending markets or during corrections, trendlines help traders identify market direction, key zones, and high-potential entry and exit points with precision.
The accuracy and effectiveness of a trendline depend on using structurally valid pivot points and adhering to proper market logic, rather than relying on guesswork or personal bias.
This indicator is built to solve that exact problem. It automatically detects and draws multiple types of trendlines based on actual price structure, separating them into Major/Minor and Internal/External categories, and respecting professional analytical principles such as pivot type, trend direction, and structural location.

Machine Learning Trendlines Cluster [LuxAlgo]The ML Trendlines Cluster indicator allows traders to automatically identify trendlines using a machine learning algorithm based on k-means clustering and linear regression, highlighting trendlines from clustered prices.
For trader's convenience, trendlines can be filtered based on their slope, allowing them to filter out trendlines that are too horizontal, or instead keep them depending on the user-selected settings.
🔶 USAGE
Traders only need to set the number of trendlines (clusters) they want the tool to detect and the algorithm will do the rest.
By default the tool is set to detect 4 clusters over the last 500 bars, in the image above it is set to detect 10 clusters over the same period.
This approach only focuses on drawing trendlines from prices that share a common trading range, offering a unique perspective to traditional trendlines. Trendlines with a significant slope can highlight higher dispersion within its cluster.
🔹 Trendline Slope Filtering
Traders can filter trendlines by their slope to display only steep or flat trendlines relative to a user-defined threshold.
The image above shows the three different configurations of this feature:
Filtering disabled
Filter slopes above threshold
Filter slopes below threshold
🔶 DETAILS
K-means clustering is a popular machine-learning algorithm that finds observations in a data set that are similar to each other and places them in a group.
The process starts by randomly assigning each data point to an initial group and calculating the centroid for each. A centroid is the center of the group. K-means clustering forms the groups in such a way that the variances between the data points and the centroid of the cluster are minimized.
The trendlines are displayed according to the linear regression function calculated for each cluster.
🔶 SETTINGS
Window Size: Maximum number of bars to get data from
Clusters: Maximum number of clusters (trendlines) to detect
🔹 Optimization
Maximum Iteration Steps: Maximum loop iterations for cluster computation
🔹 Slope Filter
Threshold Multiplier: Multiplier applied to a volatility measure, higher multiplier equals higher threshold
Filter Slopes: Enable/Disable Trendline Slope Filtering, select to filter trendlines with slopes ABOVE or BELOW the threshold
🔹 Style
Upper Zone: Color to display in the top zone
Lower Zone: Color to display in the bottom zone
Lines: Style for the lines
Size: Line size

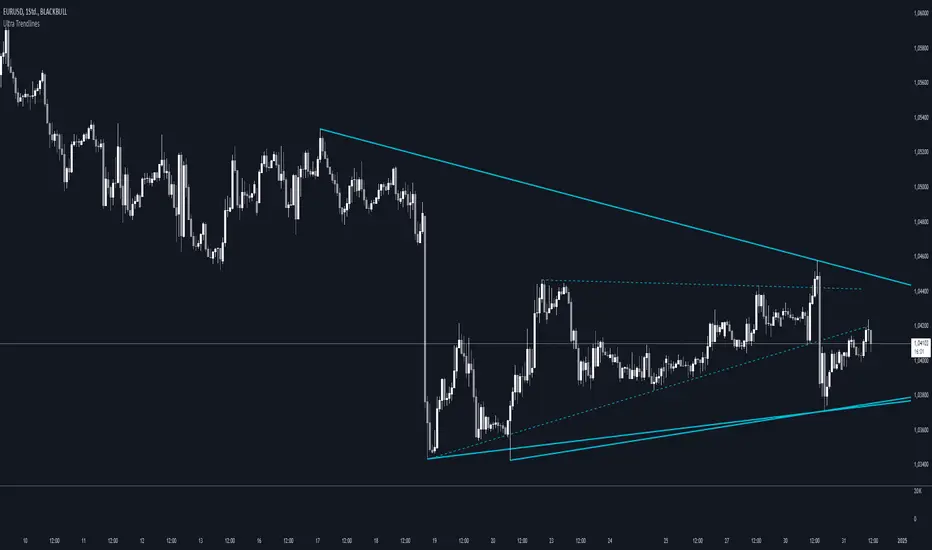
Ultra TrendlinesThis indicator automatically draws trendlines based on every pivot point, helping traders visualize key support and resistance levels. It dynamically adjusts as new pivots are detected and validates the trendlines against price movement.
Introduction
The Ultra Trendlines indicator is designed to help traders identify and track significant trendlines on their charts. By automatically detecting pivot points (both highs and lows), it draws trendlines that highlight key market movements. These trendlines are valuable for understanding the broader trend and for making informed trading decisions.
Detailed Description
The indicator analyzes price data to find pivot points highs and lows over a user-defined lookback period. Once a pivot is detected, it draws trendlines between the pivot points.
.........
Accuracy
To ensure accuracy, the indicator only keeps trendlines that are confirmed by price action. It checks if the price crosses the trendline and deletes invalid lines.
Additionally, it checks if the trendlines stay within predefined price thresholds, filtering out irrelevant lines that are too far from current price action.
The indicator also has an option to only show "rising lows" and "falling highs" trendlines, offering further precision in trend direction.
As new pivots are detected, older trendlines that fall outside the lookback period are removed, ensuring the chart remains clean.
.....
Style
The trendlines can extend forward (infinite and userdefined), backward, both or none. The lines are drawn with a customizable style (solid, dotted, or dashed), color, and width.
.........
Summary of Key Points
The indicator automatically detects pivot points (highs and lows) and draws trendlines based on them. It allows you to customize the style, color, and width of the trendlines. The indicator filters out invalid trendlines by checking if they are still relevant based on price action and price thresholds. Additionally, you can choose to only display rising lows and falling highs for more accurate trend analysis. It also removes outdated trendlines to keep the chart clean.
Scaling_mastery:Free TrendlinesScaling_mastery Trendlines is a clean, trading-ready smart trendline tool built for the Scaling_mastery community.
It automatically finds swing highs/lows and draws dynamic trendlines or channels that stay locked to price, on any symbol and any timeframe.
🔧 Modes
Trendline type
Wicks – classic trendlines anchored on candle wicks (high/low).
Bodies – trendlines anchored on candle bodies (open/close), great for closing structure.
Channel – 3-line channel:
outer lines form a band around price
middle line runs through the centre of the channel
thickness is adjustable (Small / Medium / Large).
Trend strength
Controls how strong the pivots must be to form a line.
Weak → more lines, reacts faster.
Medium → balanced, good for most pairs.
Strong → only the cleanest swings, higher-probability trendlines.
🎨 Visual controls
Max support / resistance lines – cap how many lines are kept on chart.
Show broken lines – hide broken trendlines or keep them for structure history.
Extend lines – None / Right / Both.
Support / Resistance colors – separate colors for active vs broken.
Channel thickness – Small / Medium / Large (0.5% / 1% / 2% of price).
Channel outer lines – color for channel edges.
Channel middle line – color + style (dotted / dashed / solid).
Broken lines are automatically faded + dotted, so you can instantly see what’s still respected and what’s already been taken out.
🧠 How to use
Add the indicator to any chart.
Start with:
Trendline type: Wicks
Trend strength: Strong
Max lines: 1–2 for both support & resistance
Once you like the behavior, experiment with:
Switching between Wicks / Bodies / Channel
Adjusting Channel thickness and Trend strength
Use the lines as a visual confluence tool with your own strategy:
HTF trend direction
LTF entries / retests
Liquidity grabs around broken lines
This script doesn’t generate entries or risk management – it’s designed to give you clean, reliable structure so you can execute your own edge.
⚠️ Disclaimer
This tool is for educational and visual purposes only and is not financial advice.
Always do your own research and manage risk.

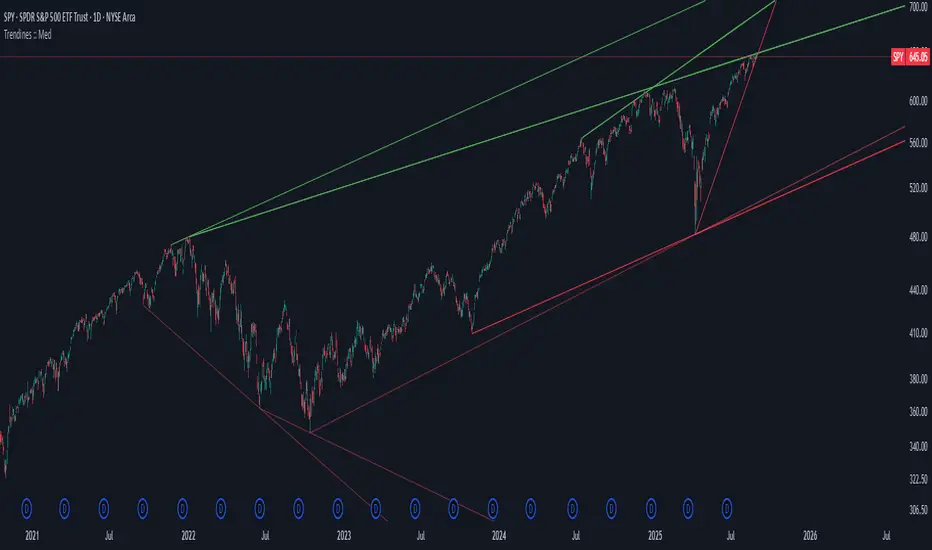
Algo + Trendlines :: Medium PeriodThis indicator helps me to avoid overlooking Trendlines / Algolines. So far it doesn't search explicitly for Algolines (I don't consider volume at all), but it's definitely now already not horribly bad.
These are meant to be used on logarithmic charts btw! The lines would be displayed wrong on linear charts.
The biggest challenge is that there are some technical restrictions in TradingView, f. e. a script stops executing if a for-loop would take longer than 0.5 sec.
So in order to circumvent this and still be able to consider as many candles from the past as possible, I've created multiple versions for different purposes that I use like this:
Algo + Trendlines :: Medium Period : This script looks for "temporary highs / lows" (meaning the bar before and after has lower highs / lows) on the daily chart, connects them and shows the 5 ones that are the closest to the current price (=most relevant). This one is good to find trendlines more thoroughly, but only up to 4 years ago.
Algo + Trendlines :: Long Period : This version looks instead at the weekly charts for "temporary highs / lows" and finds out which days caused these highs / lows and connects them, Taking data from the weekly chart means fewer data points to check whether a trendline is broken, which allows to detect trendlines from up to 12 years ago! Therefore it misses some trendlines. Personally I prefer this one with "Only Confirmed" set to true to really show only the most relevant lines. This means at least 3 candle highs / lows touched the line. These are more likely stronger resistance / support lines compared to those that have been touched only twice.
Very important: sometimes you might see dotted lines that suddenly stop after a few months (after 100 bars to be precise). This indicates you need to zoom further out for TradingView to be able to load the full line. Unfortunately TradingView doesn't render lines if the starting point was too long ago, so this is my workaround. This is also the script's biggest advantage: showing you lines that you might have missed otherwise since the starting bars were outside of the screen, and required you to scroll f. e back to 2015..
One more thing to know:
Weak colored line = only 2 "collision" points with candle highs/lows (= not confirmed)
Usual colored line = 3+ "collision" points (= confirmed)
Make sure to move this indicator above the ticker in the Object Tree, so that it is drawn on top of the ticker's candles!
More infos: www.reddit.com
Algo + Trendlines :: Long PeriodThis indicator helps me to avoid overlooking Trendlines / Algolines. So far it doesn't search explicitly for Algolines (I don't consider volume at all), but it's definitely now already not horribly bad.
These are meant to be used on logarithmic charts btw! The lines would be displayed wrong on linear charts.
The biggest challenge is that there are some technical restrictions in TradingView, f. e. a script stops executing if a for-loop would take longer than 0.5 sec.
So in order to circumvent this and still be able to consider as many candles from the past as possible, I've created multiple versions for different purposes that I use like this:
Algo + Trendlines :: Medium Period : This script looks for "temporary highs / lows" (meaning the bar before and after has lower highs / lows) on the daily chart, connects them and shows the 5 ones that are the closest to the current price (=most relevant). This one is good to find trendlines more thoroughly, but only up to 4 years ago.
Algo + Trendlines :: Long Period : This version looks instead at the weekly charts for "temporary highs / lows" and finds out which days caused these highs / lows and connects them, Taking data from the weekly chart means fewer data points to check whether a trendline is broken, which allows to detect trendlines from up to 12 years ago! Therefore it misses some trendlines. Personally I prefer this one with "Only Confirmed" set to true to really show only the most relevant lines. This means at least 3 candle highs / lows touched the line. These are more likely stronger resistance / support lines compared to those that have been touched only twice.
Very important: sometimes you might see dotted lines that suddenly stop after a few months (after 100 bars to be precise). This indicates you need to zoom further out for TradingView to be able to load the full line. Unfortunately TradingView doesn't render lines if the starting point was too long ago, so this is my workaround. This is also the script's biggest advantage: showing you lines that you might have missed otherwise since the starting bars were outside of the screen, and required you to scroll f. e back to 2015..
One more thing to know:
Weak colored line = only 2 "collision" points with candle highs/lows (= not confirmed)
Usual colored line = 3+ "collision" points (= confirmed)
Make sure to move this indicator above the ticker in the Object Tree, so that it is drawn on top of the ticker's candles!
More infos: www.reddit.com

Trendline Pivots [QuantVue]Trendline Pivots
The Trend Line Pivot Indicator works by automatically drawing and recognizing downward trendlines originating from and connecting pivot highs or upward trendlines originating from and connecting pivot lows.
These trendlines serve as reference points of potential resistance and support within the market.
Once identified, the trend line will continue to be drawn and progress with price until one of two conditions is met: either the price closes(default setting) above or below the trend line, or the line reaches a user-defined maximum length.
If the price closes(default setting) above a down trend line or below an up trend line, an "x" is displayed, indicating the resistance or support has been broken. At the same time, the trend line transforms into a dashed format, enabling clear differentiation from active non-breached trend lines.
This indicator is fully customizable from line colors, pivot length, the number lines you wish to see on your chart and works on any time frame and any market.
Don't hesitate to reach out with any questions or concerns.
We hope you enjoy!
Cheers.

Constant Auto Trendlines (Extended Right)📈 Constant Auto Trendlines (Extended Right)
This indicator automatically detects market structure by connecting swing highs and lows with permanent, forward-projecting trendlines.
Unlike standard trendline tools that stop at the last pivot, this version extends each trendline infinitely into the future — helping traders visualize where price may react next.
🔍 How It Works
The script identifies pivot highs and lows using user-defined left/right bar counts.
When a new lower high or higher low appears, the indicator draws a line between the two pivots and extends it forward using extend.right.
Each new confirmed trendline stays fixed, creating a historical map of structure that evolves naturally with market action.
Optional filters:
Min Slope – ignore nearly flat trendlines
Show Latest Only – focus on the most relevant trendline
Alerts – get notified when price crosses the most recent uptrend or downtrend line
🧩 Why It’s Useful
This tool helps traders:
Spot emerging trends early
Identify dynamic support/resistance diagonals
Avoid redrawing trendlines manually
Backtest structure breaks historically
⚙️ Inputs
Pivot Left / Right bars
Min slope threshold
Line color, width, and style
Show only latest line toggle
Alert options

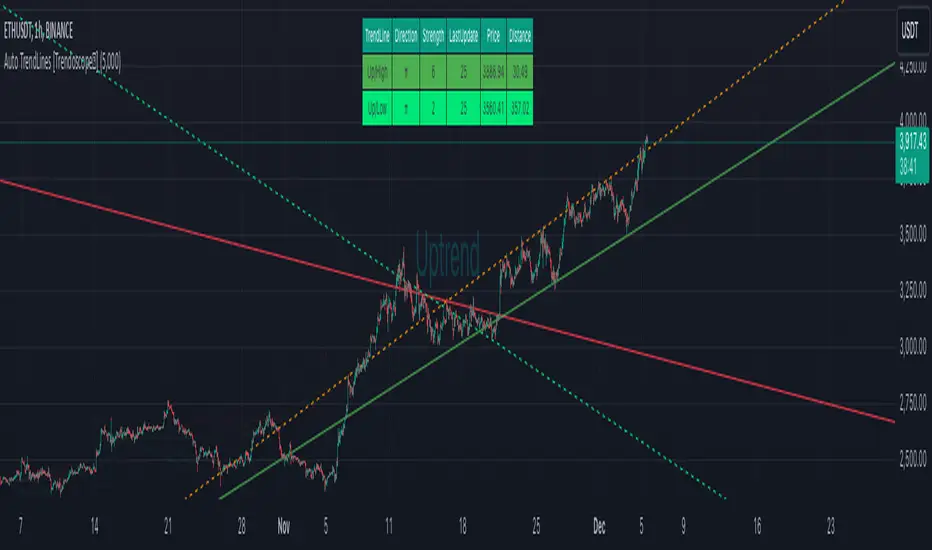
TradeScope: MA Reversion • RVOL • Trendlines • GAPs • TableTradeScope is an all-in-one technical analysis suite that brings together price action, momentum, volume dynamics, and trend structure into one cohesive and fully customizable indicator.
An advanced, modular trading suite that combines moving averages, reversion signals, RSI/CCI momentum, relative volume, gap detection, trendline analysis, and dynamic tables — all within one powerful dashboard.
Perfect for swing traders, intraday traders, and analysts who want to read price strength, volume context, and market structure in real time.
⚙️ Core Components & Inputs
🧮 Moving Average Settings
Moving Average Type & Length:
Choose between SMA or EMA and set your preferred period for smoother or more reactive trend tracking.
Multi-MA Plotting:
Up to 8 customizable moving averages (each with independent type, color, and length).
Includes a “window filter” to show only the last X bars, reducing chart clutter.
MA Reversion Engine:
Detects when price has extended too far from its moving average.
Reversion Lookback: Number of bars analyzed to determine historical extremes.
Reversion Threshold: Sensitivity multiplier—lower = more frequent signals, higher = stricter triggers.
🔄 Trend Settings
Short-Term & Long-Term Trend Lookbacks:
Uses linear regression to detect the slope and direction of the short- and long-term trend.
Results are displayed in the live table with color-coded bias:
🟩 Bullish | 🟥 Bearish
📈 Momentum Indicators
RSI (Relative Strength Index):
Adjustable period; displays the current RSI value, overbought (>70) / oversold (<30) zones, and trending direction.
CCI (Commodity Channel Index):
Customizable length with color-coded bias:
🟩 Oversold (< -100), 🟥 Overbought (> 100).
Tooltip shows whether the CCI is trending up or down.
📊 Volume Analysis
Relative Volume (RVOL):
Estimates end-of-day projected volume using intraday progress and compares it against the 20-day average.
Displays whether today’s volume is expected to exceed yesterday’s, and highlights color by strength.
Volume Trend (Short & Long Lookbacks):
Visual cues for whether current volume is above or below short-term and long-term averages.
Estimated Full-Day Volume & Multiplier:
Converts raw volume into “X” multiples (e.g., 2.3X average) for quick interpretation.
🕳️ Gap Detection
Automatically identifies and plots bullish and bearish price gaps within a defined lookback period.
Gap Lookback: Defines how far back to search for gaps.
Gap Line Width / Visibility: Controls the thickness and display of gap lines on chart.
Displays the closest open gap in the live table, including its distance from current price (%).
🔍 ATR & Volatility
14-day ATR (% of price):
Automatically converts the Average True Range into a percent, providing quick volatility context:
🟩 Low (<3%) | 🟨 Moderate (3–5%) | 🟥 High (>5%)
💬 Candlestick Pattern Recognition
Auto-detects popular reversal and continuation patterns such as:
Bullish/Bearish Engulfing
Hammer / Hanging Man
Shooting Star / Inverted Hammer
Doji / Harami / Kicking / Marubozu / Morning Star
Each pattern is shown with contextual color coding in the table.
🧱 Pivot Points & Support/Resistance
Optional Pivot High / Pivot Low Labels
Adjustable left/right bar lengths for pivot detection
Theme-aware text and label color options
Automatically drawn diagonal trendlines for both support and resistance
Adjustable line style, color, and thickness
Detects and tracks touches for reliability
Includes breakout alerts (with optional volume confirmation)
🚨 Alerts
MA Cross Alerts:
Triggers when price crosses the fast or slow moving average within a tolerance band (default ±0.3%).
Diagonal Breakout Alerts:
Detects and alerts when price breaks diagonal trendlines.
Volume-Confirmed Alerts:
Filters breakouts where volume exceeds 1.5× the 20-bar average.
🧾 Live Market Table
A fully dynamic table displayed on-chart, customizable via input toggles:
Choose which rows to show (e.g., RSI, ATR, RVOL, Gaps, CCI, Trend, MA info, Diff, Low→Close%).
Choose table position (top-right, bottom-left, etc.) and text size.
Theme selection: Light or Dark
Conditional background colors for instant visual interpretation:
🟩 Bullish or Oversold
🟥 Bearish or Overbought
🟨 Neutral / Moderate
🎯 Practical Uses
✅ Identify confluence setups combining MA reversion, volume expansion, and RSI/CCI extremes.
✅ Track trend bias and gap proximity directly in your dashboard.
✅ Monitor relative volume behavior for intraday strength confirmation.
✅ Automate MA cross or breakout alerts to stay ahead of key price action.
🧠 Ideal For
Swing traders seeking confluence-based setups
Intraday traders monitoring multi-factor bias
Analysts looking for compact market health dashboards
💡 Summary
TradeScope is designed as a single-pane-of-glass market view — combining momentum, trend, volume, structure, and reversion into one clear visual system.
Fully customizable. Fully dynamic.
Use it to see what others miss — clarity, confluence, and confidence in every trade.

Dynamic Trendlines Multi-TimeframeThe Dynamic Trendlines indicator is a useful tool for traders to identify potential support and resistance levels in the market. By analyzing price volatility and drawing trendlines based on high volatility candles, it helps traders visualize key price levels that may influence future price action. This indicator uses the Average True Range (ATR) as a measure of price volatility to determine the threshold for high volatility candles. This indicator can be used on multiple time frames, so just choose which one works best for you!
The underlying concept of this indicator revolves around the calculation of the True Range and Average True Range. The True Range is the maximum value among the difference between the current high and low, the absolute value of the difference between the current high and previous close, and the absolute value of the difference between the current low and previous close. The ATR is then calculated as the simple moving average of the True Range over a user-defined period (default is 14). The threshold for high volatility candles is determined by multiplying the ATR by a user-defined multiplier (default is 1.5).
The indicator identifies high volatility candles when the closing price is greater than the previous closing price plus the threshold. Based on the price action, trendlines are drawn connecting the high or low of high volatility candles. The initial color and style of the trendline are determined by whether the price is moving up or down. Green solid lines represent upward price movement, while red solid lines represent downward price movement.
As the price crosses the trendlines, the indicator tracks the number of crosses and updates the line's style accordingly. If the price crosses a trendline twice, the line style is changed to dashed, indicating the potential weakening of the support or resistance level.
This indicator works best with trading methods that focus on capturing price breakouts or reversals. Traders can use the trendlines to identify potential entry or exit points, stop-loss levels, or take-profit targets. It's important to note that this indicator should be used in conjunction with other technical analysis tools and an understanding of the overall market context to make informed trading decisions.
When using the Dynamic Trendlines indicator on TradingView, users can customize the ATR length, threshold multiplier, and the number of recent trendlines displayed on the chart. Additionally, small triangles are plotted below high volatility candles, with their color based on the trendline it starts, providing a quick visual reference for traders.
In summary, the Dynamic Trendlines indicator is a valuable tool for identifying potential support and resistance levels in the market by analyzing price volatility and drawing trendlines based on high volatility candles. It is best suited for breakout and reversal trading strategies and should be used in conjunction with other technical analysis tools for optimal results.

Pivot Trendlines with Breaks [HG]🧾 Pivot Trendlines and Breaks
A script meant to debut and provide an example usage of the Simple Trendlines library using Pine Script's built-in pivot system.
In under 50 lines of code, with inputs, plots, styling, and alerts included we're able to create trendlines with a breakout system.
▶️ How it works
Calculating pivot points helps traders identify moments at which the market's attitude can shift from bullish to bearish. In the background, the script tracks pivot events for trendlines and uses a system that prevents any leakage between the trendlines before they are drawn.
⚫️ Settings
Pivot Length
Color Adjustments
⚫️ Alerts

Precision Trendlines - Relevant Current TFPrecision Structural Trendlines (Current TF)
Overview
The Precision Structural Trendlines indicator is a high-performance price action tool designed for traders who rely on market structure and trend convergence. Unlike standard trendline scripts that clutter the chart with every possible connection, this indicator strictly follows professional structural rules—connecting Lower Highs for resistance and Higher Lows for support.
Key Features
Structural Integrity: The engine ensures that resistance lines are only drawn during bearish sequences (Lower Highs) and support lines during bullish sequences (Higher Lows), aligning with core Price Action principles.
Dynamic Relevance Filter: Solve the "web of lines" problem. By default, the script only shows trendlines that are currently relevant to price. As price moves away from old trends, they fade out, keeping your workspace clean.
Zero Drift Synchronization: Built using absolute time-anchoring (xloc.bar_time), ensuring that trendlines stay perfectly "glued" to the candle wicks regardless of how much you scroll or zoom.
Customizable Aesthetics: Choose between Random Dark Colors to easily distinguish overlapping trends or a Static Color for a unified look. Global width controls allow for instant visibility adjustments.
How to Use
Trend Confirmation: Use the Minimum Points setting. Set it to 2 for aggressive, early trend detection, or 3 to only see lines that have been validated by multiple touches.
Major vs. Minor Swings: Adjust the Pivot Strength. A value of 30 (default) captures significant intraday turns, while 20+ is ideal for identifying major swing structure.
Relevance Buffer: Tune the Price Buffer % to determine how close price must be to a historical trendline before it reappears on your chart.
Settings Breakdown
Minimum Points: Number of pivot points required to anchor a line.
Pivot Strength: The "look-left/look-right" requirement to confirm a peak or valley.
Validation Tolerance: The vertical buffer allowed for a 3rd point to "hit" the trendline.
Show Relevant Only: Toggles the visibility filter (highly recommended for high-volume traders).

Stochastic Trendlines with Breakouts [Jamshid] - EnhancedStochastic Trendlines with Breakouts - Enhanced Version
This advanced Stochastic Trendlines with Breakouts script combines several powerful features to provide enhanced breakout detection based on the Stochastic Oscillator and additional confirmation signals. This script is designed to help traders identify key trend reversals, breakout points, and pivot levels with more accuracy by integrating advanced filters such as RSI confirmation, moving average trend filtering, volatility filtering, divergence detection, and multi-timeframe analysis.
Key Features:
Stochastic Oscillator-Based Breakouts:
Automatically detects breakouts based on the smoothed Stochastic Oscillator values (%K and %D), providing insights into overbought and oversold conditions.
Customizable overbought and oversold levels, with a mid-level (50) line for additional reference.
Trendlines on Pivot Points:
Automatically plots dynamic trendlines based on pivot highs and lows of the smoothed Stochastic %K, helping to visualize potential reversal points.
RSI Confirmation (Optional):
Filters breakout signals using the Relative Strength Index (RSI) to confirm breakouts only when the RSI is below 50 for downtrend breakouts and above 50 for uptrend breakouts.
Visual confirmation with a green "RSI Conf." label displayed on the chart when the RSI condition is met.
Moving Average Filter (Optional):
Confirms breakout signals in the direction of a user-defined Moving Average (MA) to trade in the overall market trend direction.
MA length is fully customizable.
Stochastic Divergence Filter (Optional):
Detects bullish or bearish divergence between the price and Stochastic Oscillator values, adding an extra layer of confirmation.
Multi-Timeframe Confirmation (Optional):
Confirms breakouts by checking the Stochastic %K and %D values from a higher timeframe. This helps in avoiding false signals by aligning with the broader market trend.
The higher timeframe can be customized to any timeframe (e.g., daily, weekly, etc.).
Volatility Filter (Optional):
Uses the ATR (Average True Range) to filter out breakouts during periods of low volatility, ensuring signals are only triggered when there is sufficient price movement.
ATR length and multiplier are fully customizable.
Custom Alerts:
Alerts are available for new trendline detections (both pivot high and pivot low) and for confirmed breakout signals. These alerts help traders stay informed in real-time without needing to monitor the chart continuously.
How to Use:
Customize the Stochastic Oscillator settings, such as %K smoothing and %D line parameters, to fit your trading strategy.
Enable or disable additional filtering features (RSI, MA, divergence, MTF, volatility) as needed.
Set up alerts for specific breakout conditions directly in TradingView to stay notified when breakout signals are triggered.
This script is designed for traders who are looking for precision breakout signals with added layers of confirmation to avoid false breakouts and enhance trading accuracy.

Dynamic Touch Trendlines [QuantVue]The Dynamic Touch Trendlines (DTT) indicator automatically draws and manages trendlines on your chart, helping traders identify key support and resistance levels.
What sets the DTT indicator apart from other trendline indicators is its ability to let traders customize the number of touches required to validate a trendline. This flexibility allows you to fine-tune the indicator for different markets or trading styles, ensuring only strong trendlines with the specified number of touches are considered valid.
This indicator features both uptrend lines (drawn from pivot lows) and downtrend lines (drawn from pivot highs), making it suitable for detecting bullish and bearish trends.
An uptrend line connects three (default setting) or more significant lows, showing where price has historically found support. Traders often look for price to bounce off this line during pullbacks in an uptrend.
When price breaks below an uptrend line, it suggests a weakening of the bullish trend. This could mean that buyers are losing strength, and the market may be transitioning into a bearish phase, providing a potential opportunity for traders to enter short positions or exit long positions.
Conversely, a downtrend line connects three (default setting) or more significant highs, indicating potential resistance in a downtrend. Price action below this line can signal continued bearish momentum.
When price breaks above a downtrend line, it indicates a potential reversal of the bearish trend. This can signal the end of selling pressure and the beginning of a new bullish phase, offering traders a potential opportunity to enter long positions.
Key settings:
Minimum Touches: This sets the number of price touches required to validate a trendline. Increasing the minimum touches filters out weaker trends, ensuring that only more reliable trendlines are drawn.
Buffer: The buffer is used to account for minor price overshoots or near misses relative to the trendline. It creates a margin around the trendline, allowing price to come close to the line—whether it overshoots slightly or falls just short—and still count as a valid touch. This helps ensure that small price fluctuations or market noise don’t prevent valid trendline touches from being recognized, making the trendlines more reliable.
Trendline Break Source: Allows traders to define how a trendline is considered broken—either based on the close of the price bar or the wicks (highs and lows) of the price action.
The DTT indicator also features alerts whenever a new trendline is detected or an existing trendline is broken!

Adaptive Trend-Based Fib Extension + TrendlinesThis advanced analysis tool is designed to take the guesswork out of Fibonacci trading. By combining Adaptive Fibonacci Extensions with multi-method Pivot Detection, Dynamic Trendlines, and Horizontal Support/Resistance, this indicator provides a comprehensive roadmap for any market trend.
Learn volume trading - @pricevolumetraders
Key Features
Adaptive Fibonacci Engine: Unlike static tools, this indicator uses an ATR-based adaptive factor to adjust extension levels according to current market volatility.
Smart Trend Detection: Automatically identifies trend direction using EMA cross-overs or Higher High/Higher Low sequences to determine whether to plot Bullish or Bearish extensions.
Multi-Method Pivots: Choose from six different pivot detection methods, including Volume-Based, Fractal, ATR-Based, and Long Wick detection, to suit your specific trading style.
Automated Trendlines & S/R: High-probability diagonal trendlines and horizontal S/R levels are drawn only when they meet a minimum "touch" requirement and volume confirmation.
Institutional Zones: Highlights the "Golden Zone" between the 127.2% and 161.8% extension levels, where trends often reach exhaustion or find major targets.
How to Use
Trend Alignment: Use the built-in Dashboard to quickly identify the current trend (Bull/Bear) and RSI momentum.
The 3-Point Setup: The indicator automatically finds Point 1 (Trend Start), Point 2 (Impulse End), and Point 3 (Retracement/Last Touch) to project future price targets.
Entry Confirmation: Look for price action near the 61.8% or 78.6% Retracement levels for high-probability entries in the direction of the trend.
Targeting: Use the extension levels (100%, 127.2%, 161.8%) as your primary Take Profit zones.
Confluence: The strongest setups occur when a Fibonacci level aligns perfectly with a Horizontal S/R line or a Diagonal Trendline.
Technical Settings
Pivot Settings: Adjust 'Left' and 'Right' bars to change the sensitivity of swing high/low detection.
Fib Timeframe: You can anchor Fibonacci levels to a higher timeframe (e.g., 1-hour levels) while trading on a lower timeframe (e.g., 5-minute).
Volume Multiplier: Filter for horizontal levels that were formed with significant institutional volume.
Disclaimer: Trading involves significant risk. This tool is for educational and analytical purposes only and should be used in conjunction with a complete trading plan.

TRAPPER TRENDLINES — PRICEDraws dynamic trendlines on price by connecting the two most recent confirmed swing points (highs to highs for resistance, lows to lows for support). Swings are defined with a symmetric left/right pivot window. Old anchors are ignored so lines stay attached to current structure. Optional break alerts are included.
How it works (plain language)
Pivots: A bar is a swing high (or low) only if it’s the most extreme point compared with a set number of bars on the left and the right.
Lines:
Support connects the last two confirmed swing lows.
Resistance connects the last two confirmed swing highs.
Lines can be extended right only or both left & right (toggle).
Recency filter: Only swings within the last N bars are kept. This avoids anchoring to very old pivots far from current price.
Alerts: Optional alerts fire when price closes above resistance or below support.
Inputs
Auto Settings
Auto pivot size by chart timeframe: When ON, the script picks a pivot size suitable for the current timeframe (you can scale it with Auto pivot multiplier). When OFF, the manual left/right inputs are used.
Auto pivot multiplier: Scales the auto pivot size (e.g., 1.5 makes pivots stricter).
Manual Pivots
Pivot Left / Pivot Right: Bars to the left/right required to confirm a swing. Example: Left=50 & Right=50 keeps only major swings.
Recency Filter
Use last N bars for pivots: Swings older than this window are discarded so trendlines stay relevant to current price.
Style
Support/Resistance color: Line colors.
Extend Left & Right: When ON, both endpoints extend; when OFF, lines extend to the right only.
Alerts
Enable Break Alerts: When ON, alert conditions are exposed:
Price: Break Up — close above resistance.
Price: Break Down — close below support.
Suggested settings
Higher timeframes (4H / 1D / 1W):
Manual: Pivot Left = 50, Pivot Right = 50, Use last N bars = 400–800.
Or enable Auto with Auto pivot multiplier = 1.0–1.5.
Intraday (15m / 30m / 1H):
Manual: Pivot Left = 30, Pivot Right = 30, Use last N bars = 300–500.
Or enable Auto with multiplier ≈ 1.0–1.2.
Pairing with RSI for confluence/divergence
This tool is designed to pair with a companion TRAPPER TRENDLINES — RSI (or any RSI trendline script):
To mirror swings, set RSI Pivot Lookback equal to the price Pivot Left/Right you use here.
Example: Price = 50/50 → RSI Pivot Lookback = 50.
Keep RSI at Length 14 with 70/30 channel for clarity.
Confluence: Price holds/rejects at a trendline while RSI trendline agrees.
Divergence: Price prints a higher high (resistance line rising) while RSI prints a lower high (RSI resistance line falling), or vice-versa for lows. Matching pivot windows makes these relationships clear and reduces false signals.
Reading the signals
Trendline touch/hold: Potential reaction area; wait for follow-through.
Break Up / Break Down (alerts): Close beyond the line. Consider retest behavior, higher-timeframe context, and volume/RSI confirmation.
Notes & limitations
Pivots require future bars to confirm (by design). Lines update as pivots confirm.
“Use last N bars” purposely ignores very old swings. Increase this value if you need legacy structure.
Lines are based on two most recent confirmed pivots per side; rapidly changing markets can replace anchors as new swings confirm.
This is a visual/analytical tool. No strategy entries/exits or performance claims are provided.
Compliance
This script is for educational purposes only and does not constitute financial advice. Trading involves risk. Past results do not guarantee future outcomes. No promises of profit, accuracy, or performance are made.
Alerts (titles/messages)
Price: Break Up — “Price broke above resistance trendline.”
Price: Break Down — “Price broke below support trendline.”
Quick start
Add the indicator to your chart.
Choose Auto or set Pivot Left/Right manually.
Set Use last N bars for how far back to consider swings.
Toggle Extend Left & Right to your preference.
(Optional) Add your RSI trendline indicator and match Pivot Lookback with your price pivot size for clean confluence/divergence.
Enable alerts if you want notifications on breaks.

Historical Volatility with HV Average & High/Low Trendlines
### 📊 **Indicator Title**: Historical Volatility with HV Average & High/Low Trendlines
**Version**: Pine Script v5
**Purpose**:
This script visualizes market volatility using **Historical Volatility (HV)** and enhances analysis by:
* Showing a **moving average** of HV to identify volatility trends.
* Marking **high and low trendlines** to highlight extremes in volatility over a selected period.
---
### 🔧 **Inputs**:
1. **HV Length (`length`)**:
Controls how many bars are used to calculate Historical Volatility.
*(Default: 10)*
2. **Average Length (`avgLength`)**:
Number of bars used for calculating the moving average of HV.
*(Default: 20)*
3. **Trendline Lookback Period (`trendLookback`)**:
Number of bars to look back for calculating the highest and lowest values of HV.
*(Default: 100)*
---
### 📈 **Core Calculations**:
1. **Historical Volatility (`hv`)**:
$$
HV = 100 \times \text{stdev}\left(\ln\left(\frac{\text{close}}{\text{close} }\right), \text{length}\right) \times \sqrt{\frac{365}{\text{period}}}
$$
* Measures how much the stock price fluctuates.
* Adjusts annualization factor depending on whether it's intraday or daily.
2. **HV Moving Average (`hvAvg`)**:
A simple moving average (SMA) of HV over the selected `avgLength`.
3. **HV High & Low Trendlines**:
* `hvHigh`: Highest HV value over the last `trendLookback` bars.
* `hvLow`: Lowest HV value over the last `trendLookback` bars.
---
### 🖍️ **Visual Plots**:
* 🔵 **HV**: Blue line showing raw Historical Volatility.
* 🔴 **HV Average**: Red line (thicker) indicating smoothed HV trend.
* 🟢 **HV High**: Green horizontal line marking volatility peaks.
* 🟠 **HV Low**: Orange horizontal line marking volatility lows.
---
### ✅ **Usage**:
* **High HV**: Indicates increased risk or potential breakout conditions.
* **Low HV**: Suggests consolidation or calm markets.
* **Cross of HV above Average**: May signal rising volatility (e.g., before breakout).
* **Touching High/Low Levels**: Helps identify volatility extremes and possible reversal zones.

Auto TrendLines [HeWhoMustNotBeNamed]I started off with the intention of creating script to identify Wolfe wave projection. But, soon ran into problem with loops. Realized drawing wedge is more difficult than drawing converging triangle. Hence, took a step back and started working on wedges and triangle identification. Ended up with a messy output which looked like this.
Had to take another step back and hence decided to make Trendlines detection script and here we are :)
⬜ Process
▶ Scan pivots which are in trend. This means, series of pivot Highs or pivot lows either in ascending order or descending order.
▶ Draw trend line between each of the pivots in the trend series. For example, if there are 5 pivot high uptrend pivots, draw mXn lines between each of these points.
▶ Select the trend line which is more accurate or stronger. Accuracy is measured by number of candles/wicks touching the line and number of candles which fall outside the line. Stronger trendlines will touch more candles and pivots with less overflow.
▶ Remove all lines except the most accurate one for each direction.
At any point of time, you will see upto 4 trend lines in this script.
▶ Trendline joining pivot highs in uptrending condition
▶ Trendline joining pivot lows in uptrending condition
▶ Trendline joining pivot highs in downtrending condition
▶ Trendline joining pivot lows in downtrending conditions
The older line will remain until the new one comes through of same type. Hence, you will still be able to see uptrending high and low trend lines for downtrending instruments which are created way back!! Also, new trendlines replace old ones only if they are more stronger (connect to more pivots with less overflow)
⬜ Settings
Settings are simple.
User can select preferred Zigzag Length and Search Depth. Higher numbers for these two parameters will present longer term trends whereas lower numbers will display shorter ones.
Trend Lines controlls will allow users to enable/disable specific type of trend line, set color and line style to it.
⬜ Few Examples
▶ Uptrending Market : NASDAQ:NDX
▶ Downtrending Market : NYSE:BABA
▶ Ranging Market : NYSE:PLTR
strategy of RSI with trendlines and S/RBefore I go through this chart I want to acknowledge the great programmers who spent much of their time and effort to assist many TV users and traders.
Thank you to LunaOwl for the RSI American lines her script made me realize the need to have trendlines, supports, and resistance on RSI charts.
Also, a copy of Lij_MC code from was taken which had been credited to Duyck. Thank you Duyck.
The BB was copied from morpheus747
As I researched different strategies one strategy seemed to assist the trader for entry and exits. It was the combination of Support and resistance on the RSI. In addition, diagonal lines (Recently introduced in pine script V4) assists in the direction and reversals that may occur. What is supplied is only a graphical representation and no trade entry or exit points are selected.
On the chart you can use;
• RSI line or bar;
• Bollinger High / Low support line;
• Diagonal trend lines. A primary and a secondary group of trendlines; and
• Trendline candle highlighter.
I am hoping people with great skills could assist to develop this to the next level.
I hope this graphical strategy may help until further development. Enjoy.
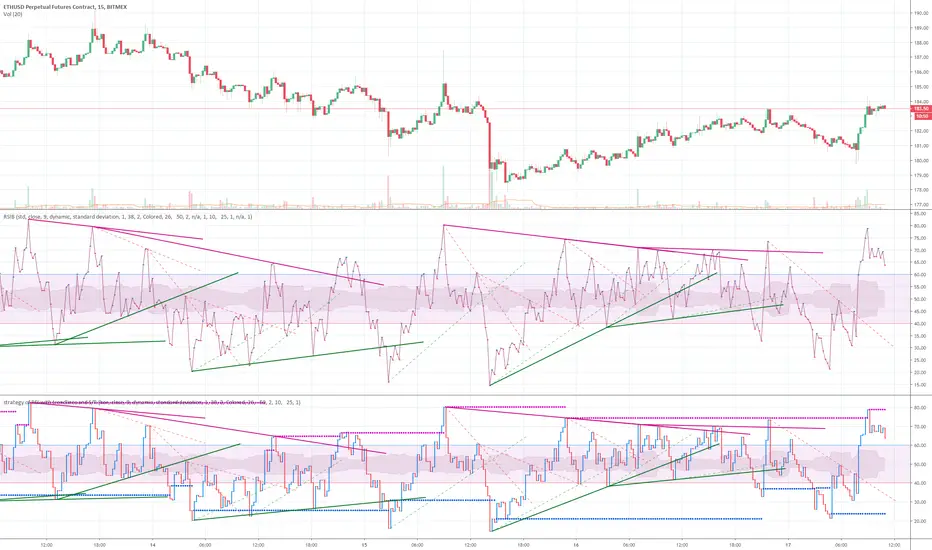
HMA-Kahlman Trend, Clipping & TrendlinesThis script utilizes three modules:
- Trendlines module (by Joris Duyck),
- Winsorizing submodule and
- HMA-Kahlman Trend module.
The Trendlines module produces crossovers predictive of the next local trend. The Winsorizing (clipping) submodule filters signals by a volume level, eliminating the ones with the volume below a threshold. The last feature obviously does not work with the assets not supporing Volume, so set the Winsorizing submodule to false. The Winsorizing and Trendlines modules can be turned off.

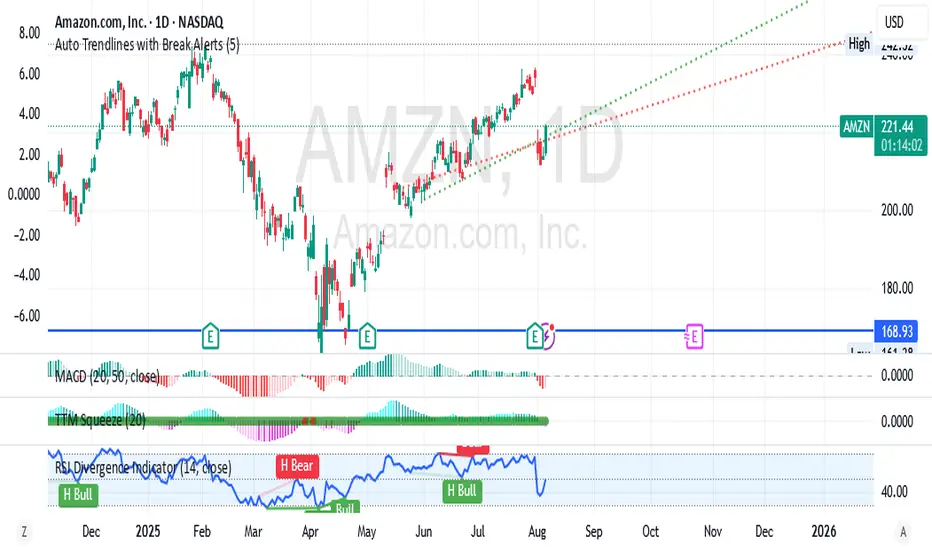
Auto Trendlines with Break AlertsIdentify the two most recent significant swing highs and swing lows based on a customizable pivot length.
Draw trendlines extending from these points.
Provide an optional visual signal (a small diamond on the chart) and a alertcondition for sound/push notifications when a trendline is broken.
Configure: Once the indicator is on your chart, you can click on the gear icon (⚙️) next to its name to adjust the settings. You will see a checkbox to enable/disable alerts and a slider to change the pivot length.
Configuring Alerts in TradingView
The alertcondition lines in the code allow you to set up official TradingView alerts for sound and push notifications.
Create an Alert: Click the clock icon (⏰) on the right-side toolbar of your TradingView chart.
Set the Condition: In the "Condition" field, select the name of the indicator: "Auto Trendlines with Break Alerts".
Choose the Alert Type: A second dropdown will appear. Select either "High Trendline Broken" or "Low Trendline Broken" to specify which break you want to be alerted for.
Select Notification Options: In the "Notifications" section, you can check the boxes for "Play sound," "Send email," "Send push notification," etc.
Create the Alert: Click "Create" to save your alert.