Automated Anchored VWAPThis was reasonably easy to put together and I can't find one that does this in the Library and I've been wanting one. Of course, the drawing tool is just fantastic, but sometimes it can be forgotten as new pivots emerge.
What you'll find elsewhere in the Library is a nice variety of fancier methods for determining an anchor point with labels, lines, timestamps and standard deviations.
This is just a simple script to pull the Anchored VWAP off of the most recent pivot and update that as new pivots become defined.
I wanted it to be really portable so it could easily work into other things you're working on while also keeping the chart reasonably clean.
The way this functions is as follows: A new pivot is found and VWAP is calculated from it. At that point the prior aVWAP is no longer tracked and it picks up from the new pivot .
Of course this means that the plot doesn't generate until the pivot is actually confirmed, which in turn means that the plot doesn't reach back to the pivot , it begins based on whatever "right bars" period you end up choosing.
I kind of like it that way, because you have your eyes on the one that matters until the new one matters.
The downside is that it doesn't track old pivots . The old aVWAP might still be in play. But if you track all of the old one's you'll have a 100 lines on your chart and no one wants that.
I recommend when you look back and think the old one is still in play, use the drawing tool to keep it on the chart.
Otherwise, let the script do the work for you.
Hope its helpful. Let me know what you think should be done to make it better.
Cari dalam skrip untuk "VWAP"

Auto AVWAP (Anchored-VWAP)Anchored Volume Weighted Average Price (AVWAP)
Pioneered by Brian Shannon, an Anchored VWAP is the measure of the average price per share since a specific moment or event. It is found as a tool in TradingView in the same toolkit as Trend Lines.
This indicator uses a Stochastic RSI measurement to define when low and high points (support and resistance levels) have occurred and applies an 'anchor' to these points.
It progressively updates these anchor points as they change. The "Next" potential AVWAP values are also displayed. When a support level is raised or a resistance level is lowered the main AVWAP value is replaced by the "Next" value.
Default Configuration:
This indicator (unconventionally) uses the high and low values instead of the HLC3 values used by a typical VWAP calculation. This allows for what appears more like support and resistance than simply an average price. Simply uncheck this configuration value to see the difference.
Breakout alerts are triggered by the open value. Uncheck this setting to use the close.

VWAP and BB strategy [EEMANI]This strategy combines VWAP and BB indicators
BUY RULE
1. EMA50 > EMA 200
2. if current close > vwap session value
3. check if price dipped BB lower band for any of last 10 candles
EXIT RULE
1. price closes above BB upper band
STOP LOSS EXIT
1. As configured --- default is set to 5%
warning: for the use of educational purposes only

CPR with SMA, EMA, VWAP & Super Trend by GuruprasadMeduriThis script will allow to add CPR with Standard Pivots and 4 Indicators.
Standard Pivot has 9 levels of support and 9 levels of resistance lines. It has CPR , 3 levels of Day-wise pivots , 3 levels of Weekly pivots and 3 Levels of Monthly Pivots .
In Addition to the CPR and Pivot, this script will allow user to Add 4 more Indicators - SMA, EMA, VWAP and SuperTrend as well.
All the Support and resistance levels can be enabled / disabled from settings. It will allow to select multiple combinations of support and resistance levels across 3 levels at any of the 3 time-frames individually and combined.
All 4 Indicators can be can be enabled / disabled from settings. This will allow the indicators to be plotted individually and combined along with any combination of CPR & Pivots.
These number of combinations will allow user to visualize the charts with desired indicators, pivot support & resistance levels on all or any of the 3 time frames.
For Ease of access, listed few points on how the script works..
- CPR and day-wise level 1 & 2 (S1 & R1) enabled by default and can be changed from settings
- Day-wise Level 2 & 3 (S2, R2, S3 & L3) can be enabled from settings
- Weekly 3 levels and Monthly 3 levels can be enabled from settings
- CPR & pivot levels colored in blue lines
- All support levels colored in Green
- All resistance levels Colored in Red
- Day-wise pivot , support & resistance are straight lines
- Weekly pivot , support & resistance are cross (+) lines
- Weekly pivot , support & resistance are circle (o) lines
- SMA, EMA, VWAP and SuperTrend Enabled by Default
- SMA Colored in Orange
- EMA Colored in Red
- EMA Colored in Teal
- SuperTrend Colored in standard Red & Green with triangle arrows
- Any combinations can be selected from settings-> Inputs & style

VWAP MVWAP with Opening rangeThe indicator plots the opening range of different time frame useful for intraday for range breakouts. It is combined with VWAP and MVWAP( EMA on VWAP ) to look for low risk areas to take positions and also filters whipsaws

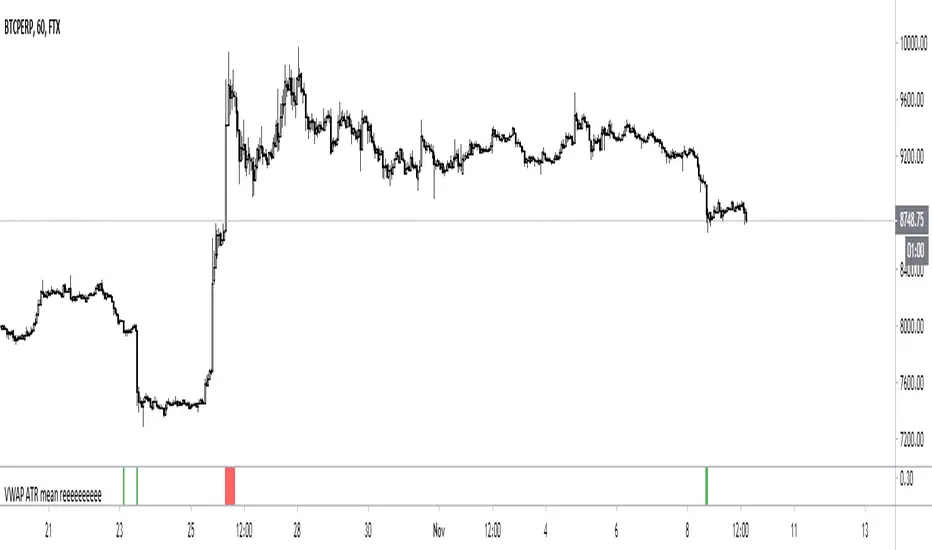
VWAP ATR mean reeeeeeeeeeMean reversion strategy which lets you set a VWAP length, ATR length - then creates signal when distance closing price from VWAP is greater than ATR x a multiplier which you set

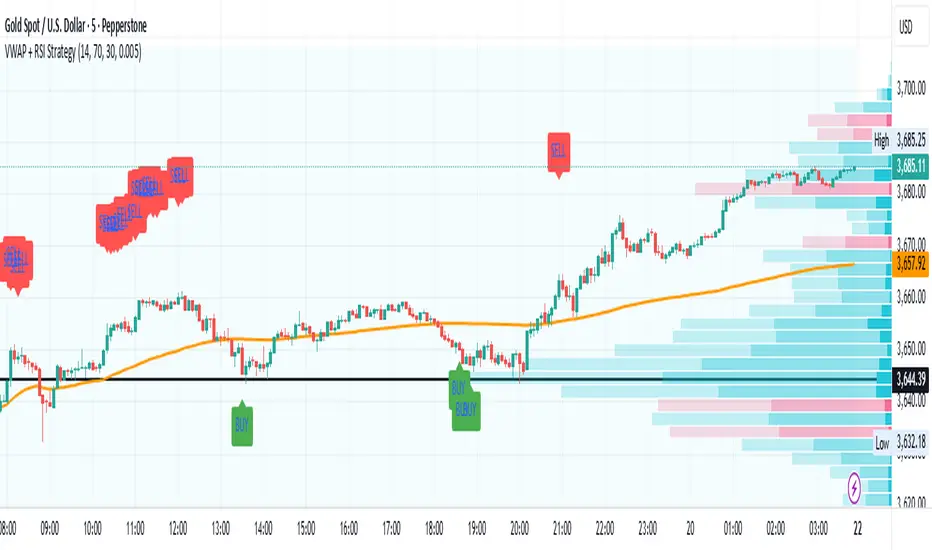
VWAP + RSI Strategytesting this method, based on RSI combine with Vwap
there is a buy and sell alert, if you like pls comment it, this is a simple method that can surely adapt to any assets,
VWAP With EMAFor those who want the classic Volume Weighted Average Price and Ema on the same overlay.
This script utilizes the same protocols as the VWAP and EMA you currently use. Just frees up an indicator space.
KEEP UP TO DATE
Are you a college student or graduate?
Join College Town Trade discord for helpful community specializing in trading stocks, options, and crypto.
Our staff consists of a group of college students with 10+ years of combined experience. Collectively we have profited and made well above an average yearly salary while being in college. The community aspect is everything and the team always listens and appreciates feedback. We all earn and learn together. There are free trials in place in order for you to see what it’s all about. These are in place so we can gain your trust and show transparency!
I look forward to seeing you in the community
advBtBjDhk

VWAP With EMA Overlay (Adjustable Anchor)For those who want the classic Volume Weighted Average Price and Ema on the same overlay.
This script utilizes the same protocols as the VWAP and EMA you currently use. Just frees up an indicator space.
KEEP UP TO DATE
Are you a college student or graduate?
Join College Town Trade discord for helpful community specializing in trading stocks, options, and crypto.
Our staff consists of a group of college students with 10+ years of combined experience. Collectively we have profited and made well above an average yearly salary while being in college. The community aspect is everything and the team always listens and appreciates feedback. We all earn and learn together. There are free trials in place in order for you to see what it’s all about. These are in place so we can gain your trust and show transparency!
I look forward to seeing you in the community
advBtBjDhk

TBM VWAP Bands Style SetupA stripped down and modified version of the 'VWAP with Standard Deviation Bands' indicator by pmk07. The bands have been modified and styled to match those used on the Tradovate platform by Matt from the Trades By Matt youtube channel so if you would like to know how they should be used go to his youtube channel and watch his strategy explanation video.
Session/Day VWAP & Std Dev Bands/VWAP and Standard Deviation Bands for intra-day & Day sessions
/Intra-day sessions be default are set to crypto
- Asia session
- London Session
- New York Session
- Close Session
Day broken up into sessions as a 24 hour period consists of different market participants and therefore different behaviour.

MTF Anchored VWAPAnchored VWAP is all the rage, but it's just one indicator. That being said, it seems like people want to add more than one at a time so why eat into your indicator cap. This script will allow you to configure 5 AVWAPS at a time.
This will not plot if the time chosen is not in market hour s. Note: market hours may be outside of YOUR timeframe. i.e, the market may open at 7:30 your time, but it will not plot until you change it to 9:30.
Enjoy

Hello VWAP "Beta"This is my 1st indicator, and my attention is to plot the VWAP "Volume-weighted average price" using the SMA "Simple Moving Average" over time... IE over the last 50,100,200 bars and just the VWAP... All of them in just one line... I have made it when I have been using the BTC/US chart, but it should work for stocks/forex or any other chart that you want to use...
I am not completely sure about this indicator and I do want to add more to this, that is how come I am posting to the community to show what I have done and people can use it and if they are open to it give me feedback or tips to make it better...
Happy trading...

VWAP-ATRstopAdapted ATR-stop with only VWAP and ATR.
Didnt test it, feel free to use it the way you want. You can turn off the bar color function and change any config.

Multi-Timeframe VWAP V2 MODQuick and dirty mod of this script in order to fit my needs.
Added one custom session
More user friendly (Enable/disable through inputs menu)

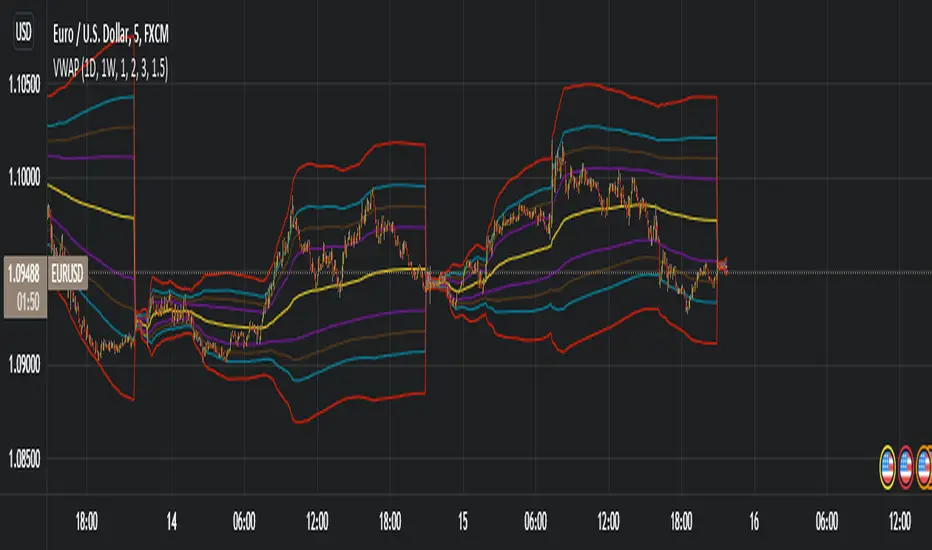
Multi MTF VWAPMulti inteveral MTF VWAP
-----------------------------------------------------------------------------------
If you find it useful please consider a tip/donation : BTC - 3BMEXEDyWJ58eXUEALYPadbn1wwWKmf6sA

VWAP ColorfulWhen the current VWAP is rising, the indicator will be green. When it is falling, it will be red. Good trades!

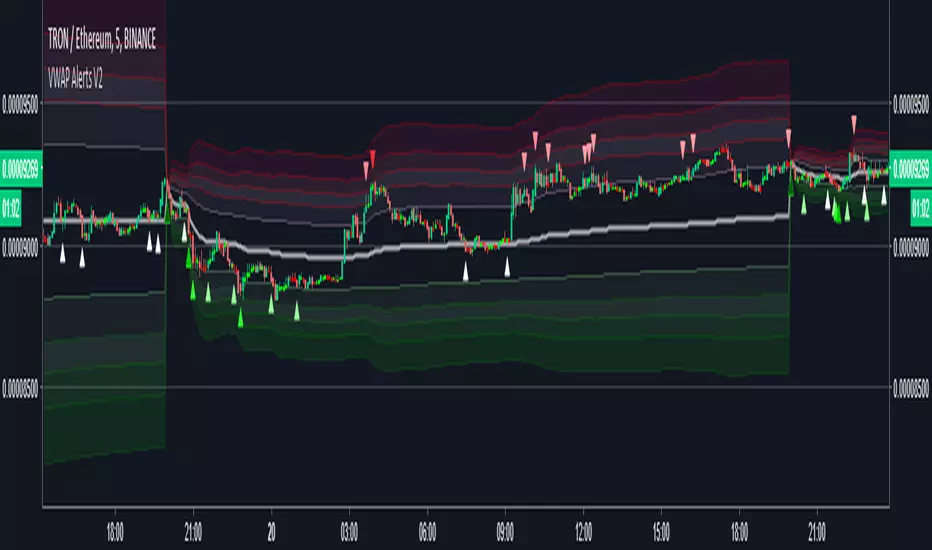
VWAP Alerts V2Alerts added to "VWAP Stdev Bands v2" by SandroTurriate
Changes
-Adjusted trigger conditions for higher signal sensitivity
-Color change on bands and signals for better readability and ease on the eyes
-Alerts added for up to 4 deviations up and down
-Re-enabled deviations 4 and 5
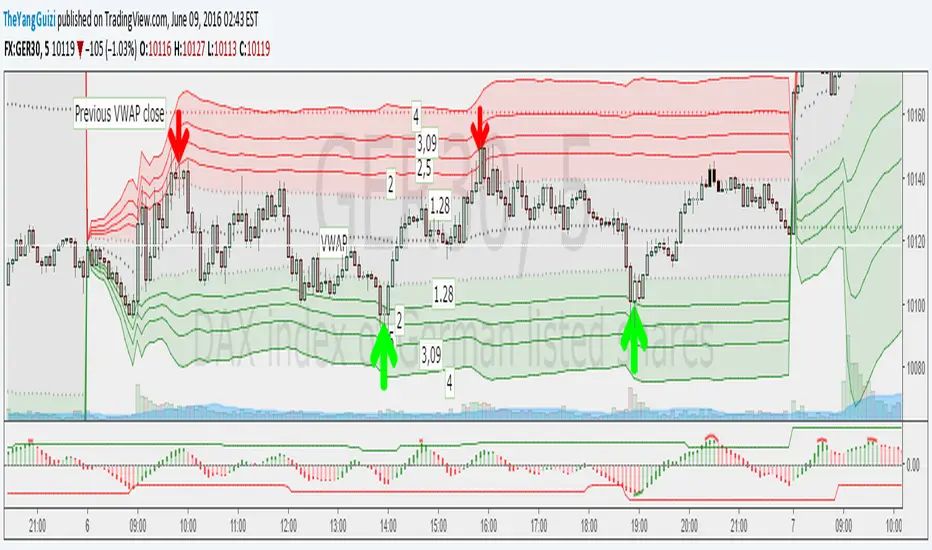
-Re-enabled previous close
BTC World Price: Multi-Exchange VWAPBTC World Price: Multi-Exchange VWAP
__________________________
WHAT IT DOES
What you see above are not Bitmex candles, but this indicator's.
Bitcoin is listed on multiple exchanges. Many people have called for a single global index that would quote BTC price and volume across all exchanges: this script is such a virtual aggregate (formerly: Multi-Listed , Volume-Weighted Average Price ).
It will, independently for each tick, for any time-frame:
- Quote the price (O, H, L, C) and volume from Bitfinex (USD), Binance (USDT), bitFlyer (Yen), Bithumb (S. Korean Won), Coinbase (USD), Kraken (EUR) and even Bitmex (USD Contracts).
- Weight each price with the corresponding volume of the exchange.
- Quote the FOREX conversion rate in USD for each currency (USDJPY etc.)
- Finally return global average price (candles) in USD.
- Additionally provide (H+L)/2 etc. values.
No more "on Coinbase this" or "on Bitstamp that", you've now got a global overview!
See CoinMarketCap: Markets for reference. I've included alternative exchanges in the comments at the top of the script.
__________________________
HOW TO USE IT
Basically just add it to your chart and use the indicator's candles instead of the chart's main ticker.
By default, BTC World Price will display candles only, but you can also display OHLC & averages (in whichever style you want).
You may indeed want to hide the main symbol (top-left corner, click the 'eye' button next to its name), or switch it to something else than candles/bars (e.g. line).
Make sure "Scale Price Chart Only" is disabled if you want to use the auto-zoom feature. (if other indicators are messing your zoom, you can try to select "Line with Breaks" or "Area with Breaks" to allow these to overflow from the main window)
By clicking the triangle next to the indicator's name, you can select "Visual Order" (e.g "Bring to Front").
You can select regular Candles or Heikin-Ashi in Options.
In the Format > Inputs tab, you can select which exchanges to quote. By default, all of them are enabled.
The script also exposes the following typical values to the backend, which you can use as Price Source for other indicators: (e.g. MA, RSI, in their "Format > Input" tab)
Open Price (grey)
High Price (green)
Low Price (red)
Close Price (white)
(H + L)/2 (light blue)
(H + L + C)/3 (blue)
(O + H + L + C)/4 (purple)
They are all hidden by default (by means of maximum transparency).
In the Format > Style tab, you can change their color, transparency and style (line, area, etc), as well as uncheck Candles and Wicks to hide these.
If you are using "Indicator Last Value" and want to clear the clutter from all these values, simply uncheck them in Style. They will still be available as Price Source for other indicators.
You can also choose to scale it to the left, right (default) or "screen" (no scaling).
Once you're satisfied with your Style, you may click "Default"> "Save as default" in the botton-left. Everytime you load the indicator, it will look the same. ("Reset Settings" will reset to the script's defaults)
__________________________
Please leave feedback below in comments or pm me directly for bugs and suggestions.

VWAP Stdev Bands v2 Modoriginal script by /u/SandroTurriate/ - I just made some small changes.
Vwap + standard deviation bands. Good for reversal trading among other things. Used intraday.
Very useful when price is ranging.
I added the option to fill the spaces between the deviation lines with color and also the option to add some extra bands. That's about it. Color/length/style etc is customizable.
VWAP_X_EMAVWAP and EMA 50 combo indicators
Long : if the close is above the VWAP and EMA
Short : Viceversa

VWAP BandsBuy Godrej Properties
Strong Retest Support of 1362-1483.
+
Trendline Support
+
Fibo 78.6 Support.
Stoploss 1158 weekly Closing.
Target should be 1900 and 2500
