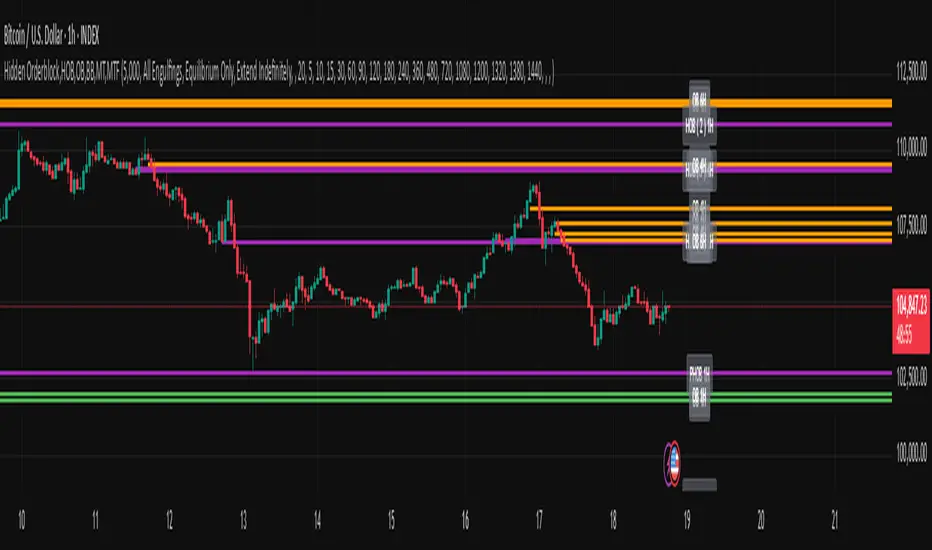
Hidden Orderblock,HOB,OB,BB,MT,MTF Hidden Order Block & Breaker Block (HOB/BB) Multi-Timeframe Analysis
A powerful tool for Smart Money traders and ICT-style practitioners seeking precision, confluence, and clean visual execution. This indicator identifies institutional price zones such as Hidden Order Blocks (HOB), Breaker Blocks (BB), Partial Hidden Order Blocks (PHOB), and traditional Order Blocks (OB)—all across multiple timeframes with minimal chart clutter.
✅ Key Features
1. Hidden Order Block (HOB) Detection
Identifies non-obvious order blocks often hidden within price action.
Requires the EQ (Equilibrium) of the block to pass through at least one Fair Value Gap (FVG).
Invalidation Rule: If price touches the EQ and then closes beyond it (depending on structure), the HOB is invalidated.
2. Breaker Block (BB) Detection
Highlights zones where price made a liquidity grab followed by a strong reversal.
Useful for anticipating support/resistance flips and high-probability reaction areas.
3. Partial Hidden Order Block (PHOB) Detection
A variation of HOBs where price only partially touches the EQ.
Often acts as an early warning zone for reversals or continuation.
Less strict than HOBs, but still institutionally relevant.
4. Traditional Order Block (OB) Detection
Identifies bullish/bearish OBs based on engulfing patterns and displacement.
Marks only the body of the engulfing candle, with the EQ line acting as a key validation/invalidation level.
Once the EQ is touched, the OB is considered invalidated.
5. Engulfing Filter Engine
Customizable logic for OB qualification.
“Easy Engulfing Mode” simplifies detection for newer traders or faster workflow.
Fine-tune aggressiveness and visual clarity with user-defined settings.
6. Multi-Timeframe (MTF) Visualization
Overlay OBs, HOBs, BBs, and PHOBs from higher timeframes (e.g., 4H, 1D) on lower timeframes (15m, 1H).
Enhances top-down confluence without switching charts.
Keeps the visual experience clean and intuitive.
7. Minimalist Visual Design
Only the zone boundaries and EQ lines are displayed.
No extra noise—perfect for both scalpers and swing traders.
Dynamic label positioning and styling for improved chart aesthetics.
8. Performance-Optimized Code
Lightweight, real-time rendering.
Designed for responsiveness—even on lower timeframes with dense historical data.
⚙️ How It Works (Simplified Logic)
Order Block Detection:
Scans for engulfing candles that show displacement.
Defines the OB as the body of the engulfing candle.
EQ line is marked and projected forward until invalidated.
Hidden Order Block Logic:
Starts from a traditional OB, but requires the EQ to pass through at least one FVG.
Upon a close beyond the EQ in the opposite direction, the HOB is invalidated.
PHOB Logic:
Similar to HOBs, but allows partial touches of the EQ before reacting.
Breaker Block Logic:
Identifies liquidity sweeps followed by impulsive moves.
Marks these zones as BBs for potential reaction areas.
📈 Use Cases
Detect institutional price zones with high precision.
Simplify decision-making with visual EQs and MTF overlays.
Integrate seamlessly into:
Smart Money Concepts (SMC)
ICT-style trading
Wyckoff methodology
Discretionary zone-to-zone strategies
🧠 Definitions Summary
OB (Order Block):
Engulfed candle body; EQ is the midpoint of the body. Invalid once EQ is touched.
HOB (Hidden Order Block):
Like OB, but EQ must pass through at least one FVG.
Invalidated when a candle touches EQ and closes beyond it.
PHOB (Partial Hidden Order Block):
Like HOB, but allows partial touch of the EQ to remain valid.
Cari dalam skrip untuk "Wyckoff"
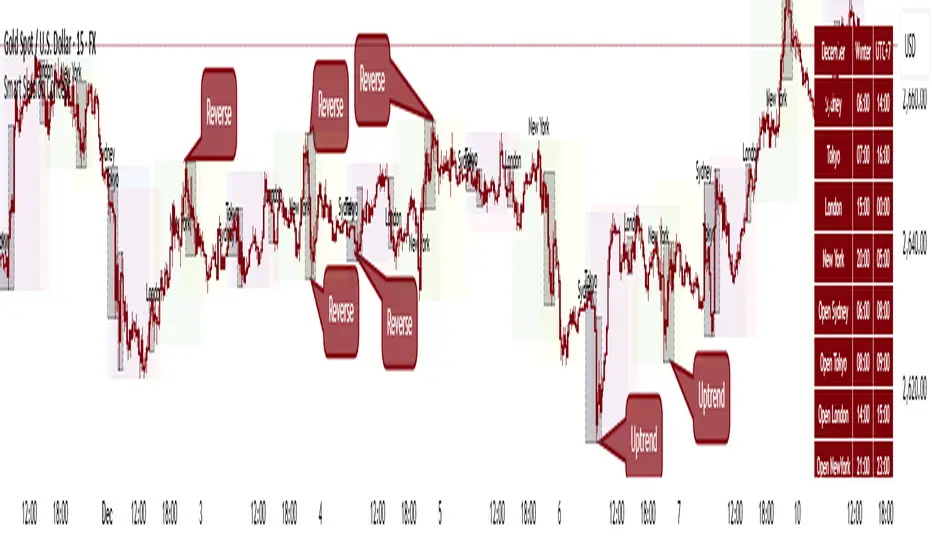
Smart Session ConceptSmart Session Concept — Intelligent Trading Session Overlay
Smart Session Concept is designed to detect major reversal points and key price pivots formed on higher timeframes, particularly during high-volume periods of the day — often marking the footprints of institutional orders and whales.
🔍 Key Features:
Displays standard sessions (Asian, London, New York) and allows adding custom time sessions.
Offers two visualization modes:
Time session table
Visual session boxes plotted on the chart
Auto-sync with seasonal time changes (Summer/Winter), supports Daylight Saving Time (DST)
Full flexibility:
Toggle table, boxes, and labels on/off
Customize colors for all session elements
Choose which months are considered summer/winter
💡 Suggested Use Case:
Use Smart Session Sync to pinpoint critical price structures such as:
Peaks and troughs of trending waves
Highs/lows in Wyckoff trading ranges
Liquidity sweeps or untouched liquidity zones
----------------------
Institutional Volume Footprint ProOVERVIEW
The Institutional Volume Footprint Pro is a comprehensive volume analysis indicator designed to identify institutional trading activity and significant volume patterns. Based on the proven Pocket Pivot Volume methodology by Chris Kacher and Gil Morales, this indicator has been enhanced with multiple additional volume analysis techniques to provide traders with a complete picture of smart money movements.
KEY FEATURES
1. Pocket Pivot Volume (PPV) Detection
- Identifies bullish volume patterns where current volume exceeds the highest down-day volume of the past 10 days
- Blue volume bars with "PPV" labels mark potential institutional accumulation
- Customizable lookback period (5-20 days)
2. Pivot Negative Volume (PNV) Detection
- Spots bearish volume patterns where selling volume exceeds recent up-day volumes
- Orange bars with "PNV" labels indicate potential institutional distribution
- Early warning system for trend reversals
3. Advanced Institutional Patterns
- Accumulation Detection (Aqua): High volume with narrow price range - classic stealth accumulation
- Churning/Distribution (Yellow): Heavy volume with minimal price progress - potential topping pattern
- Volume Dry-up (Purple): Extremely low volume periods that often precede significant moves
- Volume Climax (Fuchsia): Extreme volume spikes signaling potential exhaustion
4. Real-time Analytics Dashboard
- Relative Volume: Current volume compared to 10-day average
- Volume vs MA: Multiple of current volume to selected moving average
- Price Range Analysis: Narrow/Normal/Wide range classification
5. Accumulation/Distribution Trend
- Background coloring shows overall money flow direction
- Green tint: Net accumulation phase
- Red tint: Net distribution phase
HOW TO USE
Entry Signals:
- PPV (Blue): Consider long positions when price breaks above resistance with PPV confirmation
- Accumulation (Aqua): Watch for breakouts following multiple accumulation days
- Volume Dry-up (Purple): Prepare for potential explosive moves
Exit/Warning Signals:
- PNV (Orange): Consider taking profits or tightening stops
- Churning (Yellow): Distribution may be occurring despite stable prices
- Volume Climax (Fuchsia): Potential reversal point - extreme caution advised
CUSTOMIZATION OPTIONS
Analysis Parameters:
- PPV Lookback Period (5-20 days)
- Volume MA Length & Type (SMA/EMA/WMA)
- Relative Volume Threshold
- Climax Volume Multiplier
Visual Controls:
- Toggle Info Table display
- Enable/disable individual label types (PPV, PNV, ACC)
- Show/hide volume moving averages
- Control A/D trend background
- Customize threshold lines
BUILT-IN ALERTS
- Pocket Pivot Volume detected
- Pivot Negative Volume detected
- Institutional Accumulation pattern
- Volume Climax warning
- Volume Dry-up alert
PRO TIPS
1. Combine with Price Action: Volume confirms price - look for PPV at breakouts and PNV at breakdowns
2. Multiple Timeframes: Check daily and weekly charts for confluence
3. Relative Volume Matters: Patterns are stronger when relative volume > 1.5x
4. Watch for Divergences: Price up with decreasing volume = weakness
COLOR LEGEND
- Blue: Pocket Pivot Volume (Bullish)
- Orange: Pivot Negative Volume (Bearish)
- Aqua: Institutional Accumulation
- Yellow: Churning/Distribution
- Purple: Volume Dry-up
- Fuchsia: Volume Climax
- Green: Above-average up volume
- Red: Above-average down volume
- Gray: Below-average volume
EDUCATIONAL BACKGROUND
This indicator implements concepts from:
- "Trade Like an O'Neil Disciple" by Gil Morales & Chris Kacher
- William O'Neil's volume analysis principles
- Richard Wyckoff's accumulation/distribution methodology
Happy Trading! May the volume be with you!

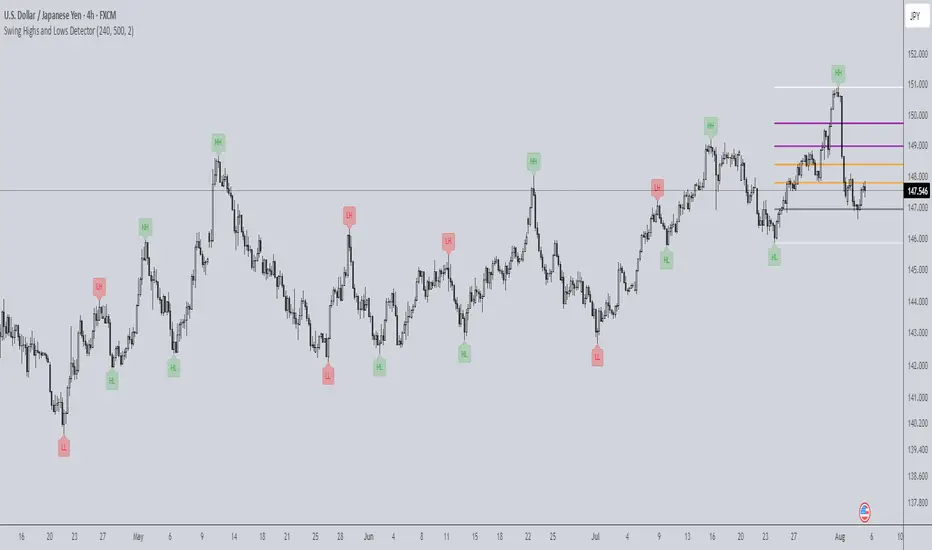
Swing Highs and Lows Detector🔍 Swing Highs and Lows Detector
The Swing Highs and Lows Detector is a powerful tool for traders looking to identify meaningful structural shifts in price action, based on swing point logic and internal trend shifts.
📈 What It Does
This indicator automatically identifies and labels:
HH (Higher High) – Price broke above the previous swing high
LH (Lower High) – Price failed to break the previous high, signaling potential weakness
LL (Lower Low) – Price broke below the previous swing low
HL (Higher Low) – Price maintained a higher support level, indicating strength
The script distinguishes between bullish and bearish internal shifts and tracks the highest/lowest points between those shifts to determine the swing structure.
⚙️ How It Works
You can choose between two shift detection modes:
"Open": Compares closing price to the first open of the opposite streak
"High/Low": Uses the high of bearish or low of bullish candles
Once a shift is confirmed, the indicator scans the bars between shifts to find the most significant swing high or low
When a valid swing is detected, it’s labeled directly on the chart with color-coded markers
🛎️ Built-in Alerts
Set alerts for:
Higher High
Lower High
Lower Low
Higher Low
These alerts help you catch key structural shifts in real time — great for breakout traders, structure-based analysts, and smart money concepts (SMC) strategies.
✅ How to Use
Confirm Trend Strength or Reversals – Use HH/HL to confirm an uptrend, LL/LH to confirm a downtrend
Combine with Liquidity Sweeps or Zones – Ideal for SMC or Wyckoff-style setups
Entry/Exit Triggers – Use swing breaks to time entries or exits near key structural points
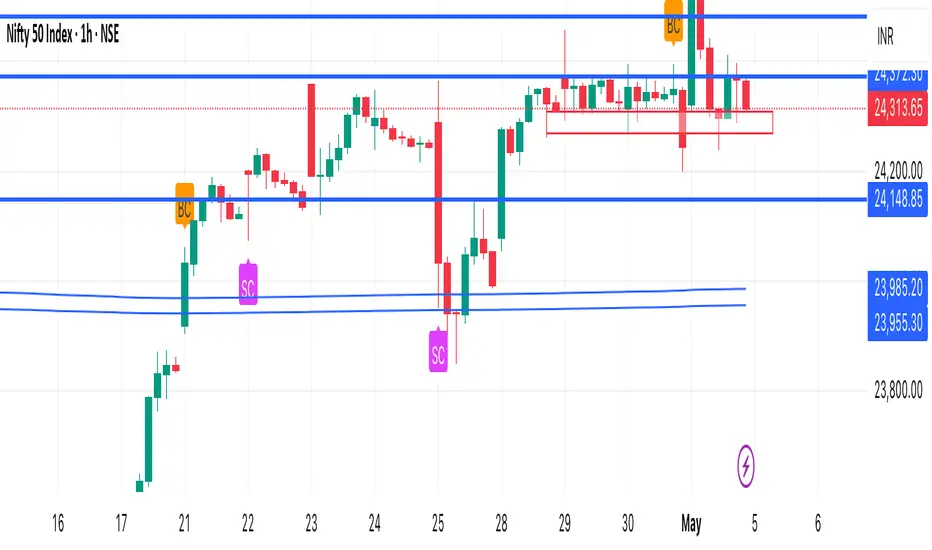
Climax Detector (Buy & Sell)This indicator identifies potential Buying Climax (BC) and Selling Climax (SC) events based on volume spikes relative to historical averages.
• Buying Climax (BC):
• Detected when a green candle forms with volume significantly higher than the average (default: 2×).
• Often signals the end of an uptrend or distribution phase.
• Selling Climax (SC):
• Detected when a red candle forms with very high volume (default: 2× average).
• Often occurs at the end of a downtrend, suggesting panic selling and potential accumulation.
How it works:
• Calculates a moving average of volume over a user-defined period (default: 20 candles)
• Flags a climax when current volume exceeds the defined multiplier (default: 2.0×)
• Marks:
• BC with an orange triangle above the bar
• SC with a fuchsia triangle below the bar
Customizable Settings:
• Volume spike sensitivity
• Lookback period for average volume
Use Cases:
• Spot possible trend exhaustion
• Confirm Wyckoff phases
• Combine with support/resistance for reversal entries
Disclaimer: This tool is designed to assist in identifying high-probability exhaustion zones but should be used alongside other confirmations or strategies.
London/NY Sessions + SMC Levels📜 Indicator Description: London/NY Sessions + SMC Levels
Overview: This indicator highlights the key trading sessions — London, New York, NY Lunch, and Asian Range — providing structured visual guides based on Smart Money Concepts (SMC) and ICT principles.
It dynamically plots:
Session Backgrounds and Boxes for London, NY, Lunch, and Asian sessions
Reference Levels for the High, Low, and Close from today, previous day, or weekly data
Midnight Open line for ICT-style power of three setups
Real-time alerts for session starts, session closes, and important price level crossings
Features:
🕰️ Session Visualization:
Toggle London, NY, Lunch, and Asian session ranges individually, with customizable colors and transparent backgrounds.
🔔 Built-in Alerts:
Alerts for:
Price crossing the previous day's high/low
Price crossing the Midnight Open
Start and end of major sessions (London, NY, Lunch, Asian)
🟩 Reference Levels:
Plot selectable session reference levels:
Today’s intraday High/Low/Close
Previous Day’s High/Low/Close
This Week’s or Previous Week’s levels for broader context.
🌙 Midnight Open:
Track the Midnight New York Open as a reference point for daily bias shifts.
🎯 Customizable Settings:
Choose your session time zones (UTC, New York, London, etc.)
Customize all border colors, background colors, and session hours.
Use Cases:
Identify killzones and optimal trade entry windows for Smart Money Concepts (SMC) and ICT strategies.
Monitor liquidity pool sweeps and session transitions.
Confirm or refine your intraday or swing trading setups by referencing session highs/lows.
Recommended For:
ICT traders
Smart Money Concepts (SMC) practitioners
Forex, indices, crypto, and futures traders focusing on session-based volatility patterns
Anyone wanting a clean, professional session mapping tool
📈
Designed to help you trade with session precision and Smart Money accuracy.
Integrates seamlessly into any ICT, Wyckoff, or Liquidity-based trading approach.

CYCLE BY RiotWolftradingDescription of the "CYCLE" Indicator
The "CYCLE" indicator is a custom Pine Script v5 script for TradingView that visualizes cyclic patterns in price action, dividing the trading day into specific sessions and 90-minute quarters (Q1-Q4). It is designed to identify and display market phases (Accumulation, Manipulation, Distribution, and Continuation/Reversal) along with key support and resistance levels within those sessions. Additionally, it allows customization of boxes, lines, labels, and colors to suit user preferences.
Main Features
Cycle Phases:
Accumulation (1900-0100): Represents the phase where large operators accumulate positions.
Manipulation (0100-0700): Identifies potential manipulative moves to mislead retail traders.
Distribution (0700-1300): The phase where large operators distribute their positions.
Continuation/Reversal (1300-1900): Indicates whether the price continues the trend or reverses.
90-Minute Quarters (Q1-Q4):
Divides each 6-hour cycle (360 minutes) into four 90-minute quarters (Q1: 00:00-01:30, Q2: 01:30-03:00, Q3: 03:00-04:30, Q4: 04:30-06:00 UTC).
Each quarter is displayed with a colored box (Q1: light purple, Q2: light blue, Q3: light gray, Q4: light pink) and labels (defaulted to black).
Support and Resistance Visualization:
Draws boxes or lines (based on settings) showing the high and low levels of each session.
Optionally displays accumulated volume at the highs and lows within the boxes.
Daily Lines and Last 3 Boxes:
How to Use the Indicator
Step 1: Add the Indicator to TradingView
Open TradingView and select the chart where you want to apply the indicator (e.g., UMG9OOR on a 5-minute timeframe, as shown in the screenshot).
Go to the Pine Editor (at the bottom of the TradingView interface).
Copy and paste the provided code.
Click Compile and then Add to Chart.
Step 2: Configure the Indicator
Click on the indicator name on the chart ("CYCLE") and select Settings (or double-click the name).
Adjust the options based on your needs:
Cycle Phases: Enable/disable phases (Accumulation, Manipulation, Distribution, Continuation/Reversal) and adjust their time slots if needed.
90-Minute Quarters: Enable/disable quarters (Q1-Q4).
Step 3: Interpret the Indicator
Identify Cycle Phases:
Observe the red boxes indicating the phases (Accumulation, Manipulation, etc.).
The high and low levels within each phase are potential support/resistance zones.
If volume is enabled, pay attention to the accumulated volume at highs and lows, as it may indicate the strength of those levels.
Use the 90-Minute Quarters (Q1-Q4):
The colored boxes (Q1-Q4) divide the day into 90-minute segments.
Each quarter shows the price range (high and low) during that period.
Use these boxes to identify price patterns within each quarter, such as breakouts or consolidations.
The labels (Q1, Q2, etc.) help you track time and anticipate potential moves in the next quarter.
Analyze Support and Resistance:
The high and low levels of each phase/quarter act as support and resistance.
Daily lines (if enabled) show key levels from the previous day, useful for planning entries/exits.
The "last 3 boxes below price" (if enabled) highlight potential support levels the price might target.
Avoid Manipulation:
During the Manipulation phase (0100-0700), be cautious of sharp moves or false breakouts.
Use the high/low levels of this phase to identify potential traps (as explained in your first question about manipulation candles).
Step 4: Trading Strategy
Entries and Exits:
Support/Resistance: Use the high/low levels of phases and quarters to set entry or exit points.
For example, if the price bounces off a Q1 support level, consider a buy.
Breakouts: If the price breaks a high/low of a quarter (e.g., Q2), wait for confirmation to enter in the direction of the breakout.
Volume: If accumulated volume is high near a key level, that level may be more significant.
Risk Management:
Place stop-loss orders below lows (for buys) or above highs (for sells) identified by the indicator.
Avoid trading during the Manipulation phase unless you have a specific strategy to handle false breakouts.
Time Context:
Use the quarters (Q1-Q4) to plan your trades based on time. For example, if Q3 is typically volatile in your market, prepare for larger moves between 03:00-04:30 UTC.
Step 5: Adjustments and Testing
Test on Different Timeframes: The indicator is set for a 5-minute timeframe (as in the screenshot), but you can test it on other timeframes (e.g., 1-minute, 15-minute) by adjusting the time slots if needed.
Adjust Colors and Styles: If the default colors are not visible on your chart, change them for better clarity.
---
📌 1. **Accumulation: Strong Institutional Activity**
- During the **accumulation phase, we see **high volume: 82.773K, which suggests strong buying interest**, likely from institutional players.
- This sets the base for the following upward move in price.
---
📌 2. **Manipulation: False Breakout with Lower Volume**
- Later, there's a manipulation phase where price breaks above previous highs, but the volume (71.814K) is **lower than during accumulation**.
- This implies that buyers are not as aggressive as before—no real demandbehind the breakout.
- It’s likely a bull trap, where smart money is selling into the breakout to exit their positions.
---
### 📌 3. Distribution: Weakness and Lack of Demand
- The market enters a distribution phase, and volume drops even further (only 7.914K).
- Price struggles to go higher, and you start seeing rejections at the top.
- This shows that demand is drying up, and smart money is offloading positions**—not accumulating anymore.
---
### 💡 Why Take the Short Here?
- Volume is not increasing with new highs—showing weak demand**.
- The manipulation volume is weaker than the accumulation volume, confirming the breakout was likely false.
- Structure starts to break down (Q levels falling), which confirms weakness.
- This creates a high-probability short setup:
- **Entry:** after confirmation of distribution and structural breakdown.
- **Stop loss:** above the manipulation high.
- **Target:** down toward previous lows or value zones.
---
### ✅ Conclusion
Since the manipulation volume failed to exceed the accumulation volume, the breakout lacked real strength. Combined with decreasing volume in the distribution phase, this indicates fading demand and supply taking control—which justifies entering a short position.

PRO SMC Full Suite BY Mashrur“PRO SMC Full Suite BY Mashrur”
A Pine Script (v5) indicator for TradingView, focused on Smart Money Concepts (SMC). It overlays on price charts and provides visual tools for identifying key institutional trading behaviors.
🎯 Purpose
This script is designed to help traders analyze and trade using SMC principles by automatically detecting:
Order Blocks (OBs)
Fair Value Gaps (FVGs)
Breaks of Structure (BoS)
Liquidity Sweeps (Buy/Sell Side Liquidity Grabs)
Mitigation Entries
⚙️ Inputs / Settings
Show Fair Value Gaps: Toggle FVGs on/off
Higher Timeframe (HTF): Choose HTF for OB analysis
Use HTF OBs: Switch between current TF OBs and HTF OBs
Show Order Blocks: Toggle OBs on/off
Show OB Mitigation Entries: Toggle mitigation entry signals on/off
🧠 Core Logic Overview
🔹 1. Swing Points Detection
Identifies swing highs/lows using a 3-bar pattern (pivot-based structure).
🔹 2. Break of Structure (BoS)
A bullish BoS happens when price closes above the last swing high.
A bearish BoS occurs when price closes below the last swing low.
🔹 3. Order Block Detection
Upon BoS, the script marks the previous candle as the Order Block.
Uses either:
Current TF OBs (based on price action)
HTF OBs (based on candle body direction)
🔹 4. Mitigation Entry Logic
A mitigation occurs when price returns to the OB and reacts with confirmation:
Bullish: price dips into OB and closes above
Bearish: price wicks into OB and closes below
Plots entry markers for these mitigations.
🔹 5. Liquidity Sweeps
Detects equal highs/lows (liquidity zones)
Marks Buy SL when price dips below an equal low then closes above
Marks Sell SL when price breaks above an equal high then closes below
🔹 6. Fair Value Gaps (FVGs)
FVG Up: Gap between candle 3 and candle 1 (low > high )
FVG Down: Gap between candle 3 and candle 1 (high < low )
Plots highlighted boxes on these gaps
📊 Visual Elements
Boxes: For OB zones and FVGs
Shapes:
Labels: OB Buy/Sell entries
Triangles: Buy SL / Sell SL liquidity sweeps
Lines: Equal Highs and Lows
🔔 Alerts
Built-in alerts to notify when:
OB entries are confirmed
Liquidity sweeps happen
Helps in automation or active monitoring
✅ Ideal For
Traders using SMC, ICT concepts, Wyckoff, or institutional trading models
Anyone wanting to automate detection of structural elements on their chart

Wave Analyzer - Bobal [hamgkia]The Bobal tool is a volume-based wave analyzer designed to highlight the effort behind price movement within trend waves. It is built with a focus on clarity, speed of response, and a Wyckoff-inspired philosophy, where volume and trend direction are deeply intertwined.
This script offers a unique visualization of directional volume flow — up or down — in clearly segmented waves, allowing traders to assess who is in control and how strong their effort is. It does this by calculating dynamic trend waves, accumulating volume within those waves, and comparing volume to volatility for normalization.
🔶 WHAT'S INCLUDED
Detects directional waves based on your selected moving average (SMA, EMA, WMA, or HMA).
Accumulates volume within each wave, creating a distinct "volume block" per wave.
Normalizes volume by ATR (optional) to adjust for current market volatility.
Applies a power function to volume strength for dynamic contrast (stronger waves stand out visually).
Plots volume histograms in real-time: green/orange for up waves, red/fuchsia for down waves.
Optional - displays trend strength background based on recent price expansion vs ATR.
🔷 HOW IT WORKS
Wave Definition
A wave is defined as a sequence of bars moving in the same direction based on a selected moving average:
If the MA rises → uptrend wave
If the MA falls → downtrend wave
Wave resets on direction change.
Volume Accumulation
Volume is accumulated within each wave, starting fresh at the beginning of each new wave. This clean segmentation reveals whether the current wave is attracting participation (volume).
Normalization (Optional)
Volume can be normalized by the ATR (Average True Range) to account for volatility differences across symbols and timeframes. This makes comparisons more meaningful.
Strength Calculation
Volume strength is calculated by comparing current wave volume to the maximum over a recent period (default: 50 bars), and applying a pow() function for expressive scaling. This emphasizes high-effort waves while de-emphasizing noise.
🔶 USAGE
A new wave starts when the selected MA (SMA, EMA, WMA, HMA) changes direction.
Read the Strength of the Current Wave
🟩 — strong up
🟧 — weak up
🟪 — weak down
🟥 — strong down
Look for these setups
📉 Strong down wave 🟥 followed by weak up wave 🟧 — possible lower high, selling may resume.
📈 Strong up wave 🟩 followed by weak down wave 🟪 — possible bullish absorption, look for long setups.
Wave is long, but volume fades (bars shrink) — trend may be slowing, consider tightening stops or avoiding late entries.
Trend is increasing, volumes are growing — potential entry points.
Use Background Strength for Context
🟩 — bright green — strong bullish
🟥 — bright red — strong bearish
Any dim or translucent color — no clear trend
What NOT to do
Don’t enter blindly on volume spikes — check direction and trend background first.
Don’t treat every strong bar as a signal — look for sequences and transitions, not isolated bars.
Ideal Use Cases
Confirming trend strength before entry.
Avoiding fakeouts in low-volume waves.
Spotting transitions in buyer/seller dominance.
Reading market participation in real time.

Volume Profile + Price Action Strategy (POC-based)This indicator combines volume dynamics, price action patterns, and a simplified Point of Control (POC) to highlight potential high-probability trade zones.
🔍 Key Features
POC-Based Logic
Plots the POC from the most recent closed 10-minute candle as a horizontal level for intraday structure.
Volume Spike Detection
Highlights unusual activity based on volume compared to the average of the last N candles.
Effort vs. Result Analysis
Based on Wyckoff-inspired logic:
Absorption: Large volume, small body → possible buyer/seller absorption
False Move: Small volume, large body → potential fakeout
Price Action Recognition Detects:
Inside Bars
Pin Bars
Engulfing Candles
Signal Highlights
🔺 Absorption Signals (below bar, teal triangle)
🔻 False Move Signals (above bar, orange triangle)
🔷 POC Line
⚙️ Customizable Inputs
You can control signal sensitivity with these inputs:
Volume Spike Multiplier
Raise to filter only extreme volume spikes
→ Recommended: 2.0 to 3.0 for cleaner setups
Absorption Body Ratio
Lower to detect only very small bodies (tight candles)
→ Try 0.3 to 0.4 for stricter absorption logic
False Move Body Ratio
Raise to catch only large candles on low volume
→ Use 2.0+ to filter weak moves
🧠 How to Use
Use in confluence with:
Support/Resistance
VWAP or moving averages
Session opens/closes
Best on 10-minute charts, but adjustable
✅ Signal Tuning Tips
Want fewer but cleaner signals?
Increase Volume Spike Multiplier: 2.5+
Decrease Absorption Body Ratio: 0.3
Increase False Move Ratio: 2.0+
Want more frequent signals?
Lower Volume Multiplier: 1.2–1.5
Raise Absorption Ratio: 0.6+
Lower False Move Ratio: 1.2–1.4
📊 Recommended Timeframe
Optimized for 10-minute charts
Works intraday, especially around session opens and POC re-tests
⚠️ Disclaimer
This script is for educational and informational purposes only. It does not constitute financial advice or a recommendation to buy or sell any asset. Past performance is not indicative of future results. Always do your own research and consult a licensed financial advisor before making trading decisions.
Use at your own risk.

Accumulation-Distribution CandlesThis structural visualization tool maps each candle through the lens of Effort vs. Result, blending Volume, Range, and closing bias into a normalized pressure score. Candle bodies are dynamically color-coded using a five-tier system—from heavy accumulation to heavy distribution—revealing where energy is building, dispersing, or neutral. This helps to visually isolate Markup, Markdown, Re-accumulation, and Distribution at a glance.
The indicator calculates a strength score by multiplying price result (close minus open) by effort (volume or price range), smoothing this raw value using a Fibonacci-based EMA. (34 for standard, 55 for crypto; the higher crypto value acknowledges that 24/7 trading offers more hours per week or month than trad markets.) The result is standardized against its rolling deviation and clamped to a range. This score determines the visual tier:
• 💙 Dark Blue = heavy Accumulation (strong upward result on strong effort)
• 🩵 Pale Blue = mild Accumulation
• 🌚 Gray = neutral (low conviction or balance)
• 💛 Pale Yellow = mild Distribution
• 🧡 Deep Yellow = heavy Distribution (strong downward result on strong effort)
The tool is optimized for the 1D chart, where Wyckoff phases are most clearly expressed. However, it adapts well to lower timeframes when used selectively. Traders may hide the body coloring and enable only zone highlighting to preserve other candle overlays such as SUPeR TReND 2.718, which offers directional clarity and trend duration. This combination is especially useful on intraday charts (15m–1H) where microstructure matters but visual clutter must be avoided.
When used alongside other Volume overlays (such as the OBVX Conviction Bias) or Volatility indicators (such as the Asymmetric Turbulence Ribbon (ATR)), this indicator adds confluence to directional setups by contextualizing pressure with Volatility. For example: compression zones marked by ATR may align with persistent pale blue candles—indicating quiet Accumulation before expansion.
Optional Overlays:
Normally ON -
• 📌 Pin Bars , filtered by volume, to isolate wick-dominant reversals from key zones
• 💪🏻 Strong-Body Candles — fuchsia candles w/ high body-to-range ratio reflect conviction
• 🧯 Wick Absorption Candles — red candles w/ long wicks and low closing strength indicate failed pushes or absorbed breakouts
• 🟦/🟧 Zone Highlighting for candles above a defined Accumulation/Distribution threshold
Normally OFF -
• 🔺 Fractals (5-bar) to map swing pivots by underlying pressure tier (normally OFF)
• 🟥/🟩 Engulfing patterns, filtered by directional conviction (normally OFF)
The Pin Bar strategy benefits most from the zone logic—when a bullish pin bar appears in an Accumulation zone (esp. pale or dark blue), and Volume exceeds its rolling average, it may mark a spring or failed breakdown. Conversely, bearish pins in Distribution zones can mark rejection or resistance.
This is not a signal engine—it’s a narrative filter designed to slot cleanly into a multi-layered workflow of visual structure and informed execution. Use it to identify bias and phase. Then deploy trade triggers from tools like SUPeR TReND 2.718, or the liquidity flows shown the The Silver Lining or the AltSeasonality - MTF indicators, for example. The candle colors tell you who’s in control—the other tools tell you when to act.
Order Blocks with Volume Heatmap & Clusters - VK TradingOrder Blocks with Volume Heatmap & Clusters - VK Trading
This script is designed to identify and highlight Order Blocks, a key concept in institutional trading, and combines it with powerful tools like volume heatmaps and accumulation clusters for enhanced market analysis. Suitable for traders of all experience levels, this script provides a clear and customizable visualization to help identify significant market zones effectively.
What Does This Script Do?
Order Block Identification: Highlights bullish and bearish order blocks directly on the chart, making it easier to spot key supply and demand zones.
Volume Heatmap: A dynamic heatmap adjusts colors based on relative volume, allowing you to quickly identify areas of heightened activity.
Institutional Accumulation Clusters: Zones of potential institutional accumulation are calculated using a combination of ATR (Average True Range), standardized volume, and RSI (Relative Strength Index).
Automatic Clearing: Invalidated order blocks are automatically removed, ensuring your charts remain clean and focused.
Key Features
Customizable Sensitivity: Adjust the script’s sensitivity to tailor order block detection to different market conditions and strategies.
Advanced Volume Display Options: Toggle volume visibility on or off. Customize the position, size, and color of volume labels for better integration with your chart's design.
Dynamic Heatmap Intensity: Fine-tune the heatmap’s intensity and color to highlight areas of interest based on trading volume.
Dual Order Block Detection: Uses two independent detection settings to analyze the market from multiple perspectives.
Visual Alerts: Automatically draws key level lines based on detected order blocks for better clarity.
User Benefits:
Clear Market Analysis: Helps pinpoint institutional activity and key levels with minimal effort.
Increased Efficiency: Automates plotting and analysis, allowing you to focus on decision-making.
Versatile Compatibility: Complements strategies like Smart Money Concepts, Wyckoff, and Price Action approaches.
Disclaimer
This script is intended as an analytical and educational tool. It does not guarantee specific outcomes or eliminate trading risks. Use this tool at your own discretion and always practice proper risk management.

Order Blocks - VK TradingOrder Blocks - VK Trading
This script in Pine Script identifies and highlights Order Blocks, key tools in institutional trading. Designed for traders of all levels, it provides clear and customizable visualization, helping you anticipate market movements with greater accuracy.
Key Features:
Order Block Visualization: Highlights relevant bullish and bearish zones directly on the chart.
Customizable Settings: Adjust sensitivity, colors, and other parameters to suit your analysis needs.
Dual Block Detection: Uses two independent settings to cover different market perspectives.
Visual Alerts: Automatic line drawing for key levels.
Automatic Clearing: Dynamic clearing of already invalidated blocks.
User Benefits:
Clear Visual Analysis: Identifies key supply and demand points used by institutions.
Improved Trading Decisions: Anticipate entry and exit zones more accurately.
Time Saver: Automates level plotting, allowing you to focus on strategy and execution.
Strategy Adaptability: Compatible with Smart Money, Wyckoff, and Price Action approaches.
Disclaimer:
This script is an educational and analytical tool. It does not guarantee specific results or eliminate trading risk. Trading in the financial markets involves significant risks; use this script at your own risk.

XAMD/AMDX ICT 01 [TradingFinder] SMC Quarterly Theory Cycles🔵 Introduction
The XAMD/AMDX strategy, combined with the Quarterly Theory, forms the foundation of a powerful market structure analysis. This indicator builds upon the principles of the Power of 3 strategy introduced by ICT, enhancing its application by incorporating an additional phase.
By extending the logic of Power of 3, the XAMD/AMDX tool provides a more detailed and comprehensive view of daily market behavior, offering traders greater precision in identifying key movements and opportunities
This approach divides the trading day into four distinct phases : Accumulation (19:00 - 01:00 EST), Manipulation (01:00 - 07:00 EST), Distribution (07:00 - 13:00 EST), and Continuation or Reversal (13:00 - 19:00 EST), collectively known as AMDX.
Each phase reflects a specific market behavior, providing a structured lens to interpret price action. Building on the fractal nature of time in financial markets, the Quarterly Theory introduces the Four Quarters Method, where a currency pair’s price range is divided into quarters.
These divisions, known as quarter points, highlight critical levels for analyzing and predicting market dynamics. Together, these principles allow traders to align their strategies with institutional trading patterns, offering deeper insights into market trends
🔵 How to Use
The AMDX framework provides a structured approach to understanding market behavior throughout the trading day. Each phase has its own characteristics and trading opportunities, allowing traders to align their strategies effectively. To get the most out of this tool, understanding the dynamics of each phase is essential.
🟣 Accumulation
During the Accumulation phase (19:00 - 01:00 EST), the market is typically quiet, with price movements confined to a narrow range. This phase is where institutional players accumulate their positions, setting the stage for future price movements.
Traders should use this time to study price patterns and prepare for the next phases. It’s a great opportunity to mark key support and resistance zones and set alerts for potential breakouts, as the low volatility makes immediate trading less attractive.
🟣 Manipulation
The Manipulation phase (01:00 - 07:00 EST) is often marked by sharp and deceptive price movements. Institutions create false breakouts to trigger stop-losses and trap retail traders into the wrong direction. Traders should remain cautious during this phase, focusing on identifying the areas of liquidity where these traps occur.
Watching for price reversals after these false moves can provide excellent entry opportunities, but patience and confirmation are crucial to avoid getting caught in the manipulation.
🟣 Distribution
The Distribution phase (07:00 - 13:00 EST) is where the day’s dominant trend typically emerges. Institutions execute large trades, resulting in significant price movements. This phase is ideal for trading with the trend, as the market provides clearer directional signals.
Traders should focus on identifying breakouts or strong momentum in the direction of the trend established during this period. This phase is also where traders can capitalize on setups identified earlier, aligning their entries with the market’s broader sentiment.
🟣 Continuation or Reversal
Finally, the Continuation or Reversal phase (13:00 - 19:00 EST) offers a critical juncture to assess the market’s direction. This phase can either reinforce the established trend or signal a reversal as institutions adjust their positions.
Traders should observe price behavior closely during this time, looking for patterns that confirm whether the trend is likely to continue or reverse. This phase is particularly useful for adjusting open positions or initiating new trades based on emerging signals.
🔵 Settings
Show or Hide Phases.
Adjust the session times for each phase :
Accumulation: 19:00-01:00 EST
Manipulation: 01:00-07:00 EST
Distribution: 07:00-13:00 EST
Continuation or Reversal: 13:00-19:00 EST
Modify Visualization : Customize how the indicator looks by changing settings like colors and transparency.
🔵 Conclusion
AMDX provides traders with a practical method to analyze daily market behavior by dividing the trading day into four key phases: Accumulation, Manipulation, Distribution, and Continuation or Reversal. Each phase highlights specific market dynamics, offering insights into how institutional activity shapes price movements.
From the quiet buildup in the Accumulation phase to the decisive trends of the Distribution phase, and the critical transitions in Continuation or Reversal, this approach equips traders with the tools to anticipate movements and make informed decisions.
By recognizing the significance of each phase, traders can avoid common traps during Manipulation, capitalize on clear trends during Distribution, and adapt to changes in the final phase of the day.
The structured visualization of market phases simplifies decision-making for traders of all levels. By incorporating these principles into your trading strategy, you can enhance your ability to align with market trends, optimize entry and exit points, and achieve more consistent results in your trading journey.

Power Of 3 ICT 01 [TradingFinder] AMD ICT & SMC Accumulations🔵 Introduction
The ICT Power of 3 (PO3) strategy, developed by Michael J. Huddleston, known as the Inner Circle Trader, is a structured approach to analyzing daily market activity. This strategy divides the trading day into three distinct phases: Accumulation, Manipulation, and Distribution.
Each phase represents a unique market behavior influenced by institutional traders, offering a clear framework for retail traders to align their strategies with market movements.
Accumulation (19:00 - 01:00 EST) takes place during low-volatility hours, as institutional traders accumulate orders. Manipulation (01:00 - 07:00 EST) involves false breakouts and liquidity traps designed to mislead retail traders. Finally, Distribution (07:00 - 13:00 EST) represents the active phase where significant market movements occur as institutions distribute their positions in line with the broader trend.
This indicator is built upon the Power of 3 principles to provide traders with a practical and visual tool for identifying these key phases. By using clear color coding and precise time zones, the indicator highlights critical price levels, such as highs and lows, helping traders to better understand market dynamics and make more informed trading decisions.
Incorporating the ICT AMD setup into daily analysis enables traders to anticipate market behavior, spot high-probability trade setups, and gain deeper insights into institutional trading strategies. With its focus on time-based price action, this indicator simplifies complex market structures, offering an effective tool for traders of all levels.
🔵 How to Use
The ICT Power of 3 (PO3) indicator is designed to help traders analyze daily market movements by visually identifying the three key phases: Accumulation, Manipulation, and Distribution.
Here's how traders can effectively use the indicator :
🟣 Accumulation Phase (19:00 - 01:00 EST)
Purpose : Identify the range-bound activity where institutional players accumulate orders.
Trading Insight : Avoid placing trades during this phase, as price movements are typically limited. Instead, use this time to prepare for the potential direction of the market in the next phases.
🟣 Manipulation Phase (01:00 - 07:00 EST)
Purpose : Spot false breakouts and liquidity traps that mislead retail traders.
Trading Insight : Observe the market for price spikes beyond key support or resistance levels. These moves often reverse quickly, offering high-probability entry points in the opposite direction of the initial breakout.
🟣 Distribution Phase (07:00 - 13:00 EST)
Purpose : Detect the main price movement of the day, driven by institutional distribution.
Trading Insight : Enter trades in the direction of the trend established during this phase. Look for confirmations such as breakouts or strong directional moves that align with broader market sentiment
🔵 Settings
Show or Hide Phases :mDecide whether to display Accumulation, Manipulation, or Distribution.
Adjust the session times for each phase :
Accumulation: 1900-0100 EST
Manipulation: 0100-0700 EST
Distribution: 0700-1300 EST
Modify Visualization : Customize how the indicator looks by changing settings like colors and transparency.
🔵 Conclusion
The ICT Power of 3 (PO3) indicator is a powerful tool for traders seeking to understand and leverage market structure based on time and price dynamics. By visually highlighting the three key phases—Accumulation, Manipulation, and Distribution—this indicator simplifies the complex movements of institutional trading strategies.
With its customizable settings and clear representation of market behavior, the indicator is suitable for traders at all levels, helping them anticipate market trends and make more informed decisions.
Whether you're identifying entry points in the Accumulation phase, navigating false moves during Manipulation, or capitalizing on trends in the Distribution phase, this tool provides valuable insights to enhance your trading performance.
By integrating this indicator into your analysis, you can better align your strategies with institutional movements and improve your overall trading outcomes.

Bollinger Bands Trend - Boosted [UOI]The legendary John Bollinger, the creator of Bollinger Bands , has done it again. He recently observed that an interaction between a long-term Bollinger band (BB 50) and a shorter-term Bollinger band (BB 20) can not only provide a frame of reference for price action and volatility but also identify trends and offer excellent entry and exit guidance. Although the concept of Bollinger Bands is not new, the concept of BB trend is. The 'Bollinger Bands Trend - Boosted' indicator is an advanced and versatile trading tool, designed to offer comprehensive analysis of market trends, price action, and volatility. This new concept captures interesting market dynamics invisible to other indicators. In addition to the power of Bollinger Band trends, this indicator is boosted and skillfully combines several technical analysis elements, including Bollinger Bands, Donchian Channels, an Exponential Moving Average (EMA), Super Trend, and a Choppiness Index, to further improve the model's performance. Each component is crafted to provide a multi-dimensional view of market dynamics. Key features include:
Dual Bollinger Bands: The indicator uses two sets of Bollinger Bands with distinct periods (50 and 20) to capture different aspects of market volatility and trend momentum. Users have the flexibility to show or hide the upper, middle, and lower bands for both sets, allowing for a customized view of market movements. Users can also enable a fill function with 90% transparency to show the area between the upper and lower BB bands. By default, only the midlines of BB 20 and BB 50 are shown on the chart, and the rest are hidden and need to be enabled by the user. Here is the default plot of BB20 and BB50:
Dynamic Color Coding of Lines: The middle bands of the Bollinger Bands dynamically change colors based on their relation to the price, offering an intuitive visual representation of the trend direction. The color turns green when the price is above the band and red when below. Dynamic Line Coloring aids traders in easily identifying trends and never going against the market trend. In this image below: BB20, BB50, Mid Donchian, EMA 100, and Super Trend all change color relative to the position of the price:
Crossover and Crossunder Detection: Detects crossovers and crossunders between the 20-period and 50-period Bollinger Bands, which can signal potential trading opportunities. Color filling and the change of color of the Bollinger midlines provide a great visual for trend detection. The color filling even without the Buy and Sell signal clearly shows the direction of the trend:
Customizable Buy and Sell Signals: The indicator generates buy and sell signals based on a complex set of conditions involving the relationship between price, Bollinger Bands, EMA, Donchian Channel, and other elements. Users can customize the length and parameters of these conditions to tailor the signals to the specific equity or market they are trading. This flexibility allows traders to optimize the indicator for different equities, trading strategies, and market conditions, making it a versatile tool for various trading styles, including short-term trading and longer-term trend following. The beauty of the "buy and sell signal" of this indicator is that users control the frequency and accuracy of the signals by changing the numbers in the setting for their favorite equity to trade:
Donchian Channel: This tool incorporates a customizable Donchian Channel to pinpoint potential support and resistance areas, providing key insights into market trends. It is especially effective in highlighting breakout points by showing the highest high and lowest low over a set number of periods, thus helping traders to identify potential entry and exit points based on price movements. The middle line of the channel changes color (lime or fuchsia) based on its position relative to the price, aiding in trend identification and strength assessment, with an option for traders to toggle its visibility on the chart.
Exponential Moving Average (EMA): Features a 100-period EMA (default but users can change the value), with an option for traders to toggle its visibility on the chart. The color of the EMA line adapts to green or red depending on whether the price is above or below it, further aiding in trend analysis.
Super Trend Indicator: Adds a Super Trend line to the analysis, providing insights into market trend direction and potential reversal points. This feature is customizable, allowing users to adjust its visibility and settings as per their analysis needs. The Super Trend is an adjustable indicator to help traders not lose sight of the longer trend:
Choppiness Index: An additional tool to assess market chop or trend robustness, with customizable settings for changing candle colors based on a defined choppiness threshold. Here is an example:
The Bollinger Band Width: BBW is a separate technical indicator derived from Bollinger Bands, used to measure market volatility. It has been added to this BB Trend indicator in an innovative manner to improve the BBT indicator. It calculates the gap between the upper and lower Bollinger Bands. A narrow BBW indicates low volatility, often seen in consolidating markets leading to a squeeze or buying opportunity, while a wide BBW signals high volatility, as observed during strong price movements or breakouts which often leads to distribution in Wyckoff terms. This indicator is crucial for traders to identify periods of market contraction and expansion, aiding in predicting volatility changes and potential trend shifts. Here is a visual presentation of BB Width:
User-Friendly Customizability: The indicator offers inputs for adjusting lengths, visibility, and parameters of its various components, empowering traders to customize the tool according to their individual trading style and preferences.
This indicator is ideal for traders who prefer a single but multi-faceted strategy, offering a blend of trend analysis, volatility measurement, and market momentum insights. Its adaptability makes it suitable for a wide range of markets and trading approaches.

MTF Smart Money ConceptsOverview
This indicator displays major elements of Smart Money Concepts and price action trading with multi-timeframes(MTF) and layered market structures with color visualization.
What is Smart Money Concepts?
Smart Money Concepts(SMC) is one of the methodologies to interpret how financial market moves and to analyze it and execute trades, focusing on liquidity and order flow of financial institutions.
Smart money means the funds invested by large financial institutions such as banks, institutional traders/investors, market makers, hedge funds etc. contrary to retail traders/investors' money.
It is important to note that there is no proof or evidence that those institutions move the market as described in Smart Money Concepts.
Personally speaking, it is one of the interpretation of the market and another angle to view the market just like other technical analysis methodologies such as Elliott Wave Principle, Gann Theory, Wyckoff Method and even traditional price action trading.
Importance of MTF Analysis
MTF analysis(a.k.a Topdown analysis) is the foundation to technically analyze charts and the most fundamental skill in trading because lower timeframes are always influenced by upper timeframes where large financial institutions operate.
How to use
This indicator is designed to help traders analyze how the market moves in terms of SMC and price action with multi-timeframes and color visualization of the market structures, which makes this indicator unique and different from other indicators.
There is two key settings that you can use based on your trading style.
1.Upper timeframe selection
You have two options to determine upper timeframe; Auto mode and Manual mode.
When Auto mode selected, upper timeframe will be determined based on chart timeframe as follows.
Chart timeframe => Upper timeframe
1M=>15M
5M/15M=>1H
30M/1H=>4H
4H=>D
D=>W
W=>M
If you select Manual mode, you can fix an upper timeframe.
2.High/low settings
This affects all other settings of the indicator and most importantly designs the market structure.
This is the key setting to determine how you view the market as price action trading is all about highs and lows and story of how highs and lows have been created with the market structure.
You can specify left bars and right bars to identify swing highs/lows and these highs/lows become the basis to design the market structure and determine how SMC elements are displayed.
Example:
Left bar&right bar: 10
You can see bigger wave(magenta line) in the market structure(stepped line).
(Magenta line is a drawn object by manual)
Left bar&right bar: 4
With this setting, you can see smaller wave in the market structure.
Since market moves like wave as there is a lot of wave theories in financial investment/trading industry such as Elliott wave, Wolf wave etc., users can define market structure with this setting depending on what degree of wave they aim to trade.
Functions:
MTF Order Block
Concept
Order block is a block of orders where buying orders and selling orders are accumulated. Order blocks are created when the institutions move the market up and down, temporality placing orders in an opposite direction to the way they want to move, in order to match their own orders with counter-orders.
Visualization by the indicator
The indicator displays both chart timeframe's order blocks and upper timeframe's order blocks(MTF).
You can also select from two options how to display order blocks;
1. Show all order blocks
2. Show strong order blocks only
Note: Strong order blocks mean order blocks created at strong highs/lows. See also strong high/low below.
Alerts can be set when prices reach strong order blocks.
MTF Fair Value Gap(FVG)/Imbalance
Concept
Fair Value Gap(FVG)(Imbalance) is a void generated among three consecutive candlesticks.
FVG(s) is created when the market moves so rapidly generating buy side or sell side order imbalances.
FVG(s) is characterized by price action that prices tend to come back to the area where FVG(s) exists, filling in the space among the candlesticks.
Visualization by the indicator
The indicator displays both chart timeframe's FVG and upper timeframe's FVG.
MTF Liquidity Grab
Concept
Liquidity grab is price action to sweep liquidity for the institutions to move the market.
This price action often happens because the size of their orders is so huge and they need a bunch of counter-orders to match their orders. This is why prices sometimes come to areas where liquidity rest and swipe them before the market goes up/down.
Liquidity visualization
Where does liquidity rest?
The answer is above highs(buy side liquidity) and below lows(sell side liquidity).
Among all highs and lows, swing highs and lows are where liquidity is accumulated the most because swing highs and lows can be created only by the institutions, therefore massive liquidity is indicated.
Visualization by the indicator
The indicator displays liquidity dots so that users can easily identify where liquidity rests and liquidity grab of both a chart timeframe and an upper timeframe.
Alerts can be set when liquidity grab happens.
MTF Strong High/Low
Concept
Strong high/low literally means strong highs and lows among all highs and lows including swing highs and lows.
There is a few different definitions of strong high/low in price action trading and the definition in this indicator is as follows.
Strong high
A high that that breaks higher low or lower low
Strong low
A low that breaks lower high or higher high
Visualization by the indicator
The indicator displays strong highs and lows of both a chart timeframe and an upper timeframe.
MTF Market Structure Visualization
Concept
Market structure is a series of price movement with highs and lows which outlines the way the market directs. It is a basis to see trend occurrence, trend reversal and sideways and analyzing the market structures in multi-timeframes is the most fundamental technical skill in trading/investment.
Visualization by the indicator
The indicator displays market structures of both a chart timeframe and an upper timeframe and provide color visualization depending on bullish and bearish market structures.
The definition of bullish and bearish market structure is as follows.
Bullish market structure
When a price breaks a Lower High or Higher High
Bearish market structure
When a price breaks a Higher Low or Lower Low
Settings
All the functions above, colors and line settings are parameterized and can be turned on/off depending on users’ needs.
———————————————————————————
概要
Smart Money Concepts(SMC)およびプライスアクショントレードにおける重要な要素をマルチタイムフレームで表示することのできるインジケーターです。
相場構造(Market structure)をマルチタイムフレームで表示し、相場構造の強弱を色で可視化することができます。
Smart Money Concepts(スマートマネーコンセプト)とは?
Smart Money Concepts(以下SMC) は金融市場がどのように動くかを解釈し、分析し、取引を執行するための相場理論の一つであり、Liquidity(リクイディティ)および機関投資家のオーダーフロー(注文の流れ)に焦点を置いていることが特徴です。
Smart Money(スマートマネー)とは、銀行や機関投資家、マーケットメーカー、ヘッジファンドといった金融機関が動かす資金を意味し、個人投資家の資金と対をなす概念です。
重要な点は、実際に上記の金融機関がSmart Money Conceptsで語られているような相場の動かし方をしているかどうかを証明する明確なエビデンスはないということです。
個人的には、エリオット波動理論やギャン理論、ワイコフ理論、伝統的なプライスアクショントレーディングの方法論と同様に、マーケットの動きを解釈するための一つの方法論であり、マーケットの動きを別の角度から見る枠組みと捉えています。
マルチタイムフレーム(MTF)分析の重要性
MTF分析はチャートをテクニカルに分析する上での基礎であり、トレードにおいて最も重要なスキルです。なぜなら下位のタイムフレームは上記のような金融機関が資金運用を行う上位のタイムフレームの影響を常に受けるためです。
使い方
このインジケーターは、SMCまたはプライスアクショントレードの観点から、トレーダーがマーケットをマルチタイムフレームで分析することを支援するために開発しています。
相場構造(Market structure/マーケットストラクチャー)を方向性に応じて色で可視化することができるため、視覚的に相場の構造を判断できることがこのインジケータのユニークな点であり、他のインジケーターと異なる点です。
ユーザーのトレードスタイルに応じて、以下の二つの設定を行うことができます。
1.上位足の決定方法
ユーザーは上位足のタイムフレームを決定するにあたり、AutoモードとManualモードを選択することができます。
Autoモードを選択した場合、上位足はチャートのタイムフレームに応じて以下のように決定されます。
チャートタイムフレーム => 上位足タイムフレーム
1M=>15M
5M/15M=>1H
30M/1H=>4H
4H=>D
D=>W
W=>M
Manualモードを選択すると上位足のタイムフレームを固定することができます。
2.High/low(高値/安値) 設定
当設定はインジケーターの他の全ての機能に影響し、また最も重要である相場構造の定義に影響します。
当設定はユーザーがマーケットをどのように見るか(=どの程度の粒度)を決定する重要な設定です。なぜならプライスアクショントレードは、高値、安値とそれらが相場構造をどのように構築してきたかの一連の流れを分析することが全てだからです。
ユーザーは相場構造を決定付けるスイングハイ·スイングローを特定するためのバーの本数を設定することができます。ここで設定した内容が、相場構造を定義し、以下で説明するSMCの要素の表示を決定することになります。
例:
Left bar&right bar(左右のバーの数): 10
この場合、ステップラインで示した相場構造の中に大きな波(マゼンタの波)を見ることができます。
(マゼンタのラインは手動で描いたオブジェクト)
Left bar&right bar: 4
この設定では、上記に比べて小さい波を描いていることが確認できます。
相場理論の中にエリオット波動理論やウォルフ波動といった数多くの波動理論があることからわかるように、相場は波として動きます。どの粒度の波を狙うかというトレーダーのスタイルに応じて、設定を変更することができます。
機能
MTFオーダーブロック
コンセプト
オーダーブロックとは買い注文と売り注文が一連となって蓄積されたオーダー(注文)のブロックのことです。
オーダーブロックは機関投資家が相場を動かす際に、本来意図する方向とは一時的に逆に動かすことで、彼ら自身の注文をマッチングさせるための反対注文を発生させることで形成されます。
インジケーターによる表示
インジケーターはチャートタイムフレームのオーダーブロックと上位足のオーダーブロックの両方を表示することができます。
また、オーダーブロックの表示オプションとして、
1.全てのオーダーブロックを表示
2.Strong(ストロング)オーダーブロックのみを表示
を選択することが可能です。
注: StrongオーダーブロックはStrong High/Lowで形成されるオーダーブロックを指します。(下記参照)
また、オーダーブロック到達でのアラート設定も可能です。
MTFフェアーバリューギャップ(FVG)/インバランス
コンセプト
フェアーバリューギャップ(FVG)/インバランスとは連続する3つのローソク足の間に形成される溝(Gap)のことです。
フェアーバリューギャップはマーケットが非常に早く動いたことにより、買いオーダーと売りオーダーの需給バランスが崩れることによって発生します。
フェアーバリューギャップには、価格がフェアーバリューギャップが発生したエリアまで戻ってくる傾向があるという特徴が存在します。
インジケーターによる表示
インジケーターはチャートタイムフレームのフェアーバリューギャップと上位足のフェアーバリューギャップの両方を表示することができます。
MTF Liquidity Grab(リクイディティ·グラブ)
コンセプト
Liquidity(リクイディティ)とはマネー、つまり注文です。
Liquidity Grab(リクイディティ·グラブ)とは、機関投資家がマーケットを動かす際にLiquidityを取得するプライスアクションのことを指します。
このプライスアクションは、機関投資家が処理する注文サイズが非常に大きいため、自身の注文を出す際に大量の反対注文を必要とすることからしばしば発生します。
これが、価格がLiquidity(注文)の集まっているエリアに接近し、それら注文をスワイプ(狩り取る)した後に上昇·下落する理由です。
Liquidityの可視化
一般的にLiquidityは高値の上(buy side liquidity)、安値の下(sell side liquidity)に存在します。
全ての高値·安値の中で、スイングハイ·ローがliquidityが最も蓄積されているエリアということができます。なぜならスイングハイ·ローは機関投資家の注文によってのみ形成されるからです。
インジケーターによる表示
ユーザーがLiquidityポイントを簡単に識別できるようにLiquidityをドット表示することが可能です。またチャートタイムフレームと上位足の両方のLiquidity Grabを表示することができます。
Liquidity Grab発生時にアラートも設定可能です。
MTF Strong High/Low(ストロングハイ·ロー)
コンセプト
Strong high/lowは文字通り、強い高値·安値のことを指します。
トレーダーの間でいくつかの異なる定義が存在しますが、当インジケーターでの定義は以下の通りです。
Strong high
Higher low(ハイアーロー) または Lower low(ロワーロー)をブレイクした高値
Strong low
Lower higher (ロワーハイ) または Higher High(ハイアーハイ)をブレイクした安値
インジケーターによる表示
チャートタイムフレーム、上位足のStrong High/Lowを表示することが可能です。
相場構造可視化
コンセプト
相場構造(Market structure/マーケットストラクチャー)とは、相場の流れを成り立たせる高値と安値を元にした一連の値動きです。建物における骨組みに該当します。
トレンドの発生、転換、レンジを見極めるための基礎であり、マルチタイムフレームで相場構造を分析することは、投資·トレードにおいて最も重要なテクニカルスキルです。
インジケーターによる表示
チャートタイムフレームと上位足タイムフレーム両方の相場構造を表示することができます。
また、相場構造が強気の状態か弱気の状態かを色で可視化するため、上位足含めた相場の流れを視覚的に判断することが可能です。
相場構造の強弱の定義は以下の通りです。
強気の相場構造(Bullish market structure)
価格がLower HighまたはHigher Highをブレイクしたとき
弱気の相場構造(Bearish market structure)
価格がHigher LowまたはLower Lowをブレイクしたとき
設定
上記の全ての機能は色やライン設定含めパラメーターで設定が可能です。またユーザの必要に応じて表示·非表示を切り替えることができます。
Volume Spread Analysis Candle PatternsVolume Spread Analysis (VSA) is a methodology used in trading and investing to analyze the relationship between volume, price spread, and price movement in financial markets. It was developed by Richard Wyckoff, a prominent trader and market observer.
The core principle of VSA is that changes in volume can provide insights into the strength or weakness of price movements and indicate the intentions of market participants. By examining the interplay between volume and price, traders aim to identify the behavior of smart money (informed institutional investors) versus less-informed market participants.
Key concepts in Volume Spread Analysis include:
1. Volume: VSA places significant emphasis on volume as a leading indicator. It suggests that changes in volume precede price movements and can provide clues about the market's sentiment.
2. Spread: The spread refers to the price range between the high and low of a given trading period (e.g., a candlestick or bar). VSA considers the relationship between volume and spread to gauge the strength of price action.
3. Upthrust and Springs: These are VSA candle patterns that indicate potential market reversals. An upthrust occurs when prices briefly move above a resistance level but fail to sustain the upward momentum. Springs, on the other hand, happen when prices briefly dip below a support level but quickly rebound.
4. No Demand and No Supply: These patterns suggest a lack of interest or participation from buyers (no demand) or sellers (no supply) at a particular price level. These conditions may foreshadow a potential price reversal or consolidation.
5. Hidden Buying and Selling: Hidden buying occurs when prices close near the high of a bar, indicating the presence of buyers even though the market appears weak. Hidden selling is the opposite, where prices close near the low of a bar, suggesting the presence of sellers despite apparent strength.
By combining these VSA concepts with other technical analysis tools, traders seek to identify potential trading opportunities with favorable risk-reward ratios. VSA can be applied to various financial markets, including stocks, futures, forex, and cryptocurrencies.
It's important to note that while VSA provides a framework for analyzing volume and price, its interpretation and application require experience, skill, and subjective judgment. Traders often use VSA in conjunction with other technical indicators and chart patterns to make well-informed trading decisions.
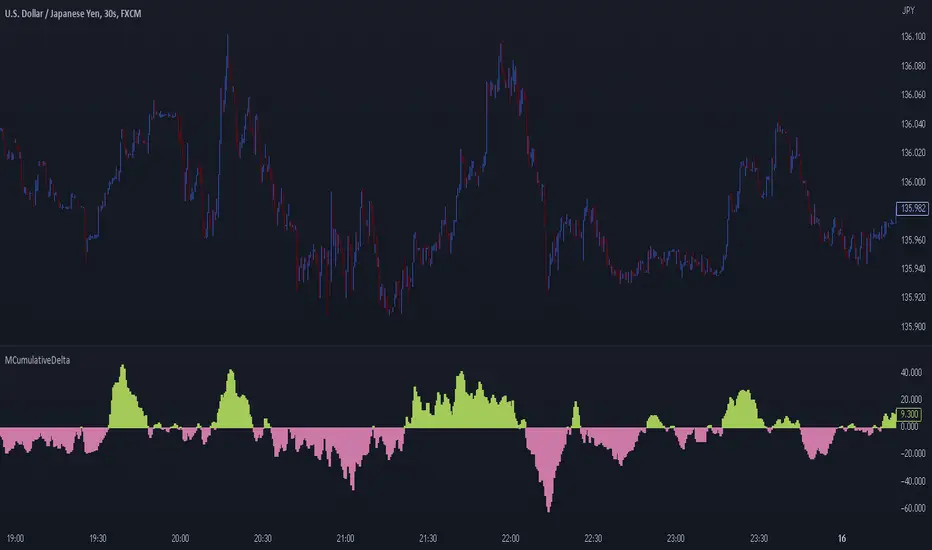
MCumulativeDelta* MCumulativeDelta Indicator *
The MCumulativeDelta Indicator shows the Buying / Selling pressure that is happening in the market. The Delta is powered by the *MBox Precision Delta* Algorithm. This indicator serves to show overall Accumulation and Distribution of the BUYERS and the SELLERS. It becomes possible to gauge if the market is overall Bullish or Bearish. This helps determine trade direction and keeping out of other trades that are counter to what the overall Buying / Selling is showing.
* WHAT THE SCRIPT DOES *
The script draws a histogram that can either be positive or negative. When the histogram is positive it means there are more Buyers in the Market. When the histogram is negative it means there are more sellers in the market. The more positive the histogram gets, the more BUYERS are flooding the market. The more negative the histogram gets, the more SELLERS are flooding the market. When the histogram switches over from negative to positive it is a Bullish sign of Buying. When the histogram switches over from positive to negative, it is a Bearish sign of Selling.
* HOW TO USE IT *
As the histogram becomes more negative, this shows that the SELLERS have taken control of the markets. Conversely, as the histogram becomes more positive, this shows that the Buyers have taken control of the markets. The side that is in control is the direction to generally place trades in, and at the same time filter out trades of the opposite direction.
* HOW IT WORKS *
The MCumulativeDelta histogram on the chart represents overall Buying / Selling. This is the DELTA (difference) between the BUYING and the SELLING. Taking the total BUYING and subtracting the total of SELLING, we produce the DELTA (difference) between the Buying / Selling and this is what is drawn by the histogram.
Unlike other Cumulative Delta indicators which determine delta from the Up / Down wick and just multiply by volume (not a true delta), the MCumulativeDelta indicator uses a sophisticated algorithm that analyzes price movement corresponding to volume movement.
The way the DELTA, BUYING, and SELLING is calculated is computed by the *MBox Precision Delta* Algorithm. The algorithm considers the following data points when making it's computation
1. Price moving up on increasing volume
2. Price moving up on decreasing volume
3. Price moving horizontally on increasing volume
4. Price moving horizontally on decreasing volume
5. Price moving down on increasing volume
6. Price moving down on decreasing volume
Using these data points allows MCumulativeDelta to effectively compute and define the following scenarios
1. Accumulation / Distribution
2. Buying / Selling Exhaustion
3. Buying / Selling EFFORT / NO RESULT
Once the scenario is determined, it will greatly aid in trade decision making. These scenarios are explained in the examples below
* EXAMPLE AND USE CASES *
- Accumulation Example -
When you see a large amount of BUYING (large positive histogram) and price entering an up trend, this is indicative of Accumulation and you would be looking for PULLBACKS to get into the up trend move.
- Distribution Example -
When you see a large amount of SELLING (large negative histogram) and price entering a down trend, this is indicative of Distribution and you would be looking for pullbacks to get into the down trend move.
- Buying EXHAUSTION Divergence -
As price makes higher highs, but the MCumulativeDelta histogram drops (becomes less positive) on the higher highs, it means BUYERS are exhausted. Potentially a reversal or change in behavior in the markets.
- Selling EXHAUSTION Divergence -
As price makes lower lows, but the MCumulativeDelta histogram contracts (becomes less negative) on the lower lows, it means SELLERS are exhausted. Potentially a reversal or change in behavior in the markets.
- BUYING EFFORT / NO RESULT -
As the MCumulativeDelta histogram increases positively, but price fails to make higher highs, it is a sign of EFFORT / NO RESULT on behalf of the Buyers. In this case Buyers are pushing hard to move price up, but are unable to, due to being OVERBOUGHT. If this is accompanied by visible SELLING, it would be a good short entry.
- SELLING EFFORT / NO RESULT -
As the MCumulativeDelta histogram increases negatively, but price fails to make lower lows, it is a sign of EFFORT / NO RESULT on behalf of the Sellers. In this case Sellers are pushing hard to move price down, but are unable to, due to being OVERSOLD. If this is accompanied by visible BUYING, it would be a good long entry.
* SETTING ALERTS *
- FOR CROSSING FROM BUYING TO SELLING OR SELLING TO BUYING -
To be alerted when the histogram crosses over from Buying to Selling (Positive to Negative) or Selling to Buying (Negative to Positive)
1. Right Click Chart -> Add Alert...
2. Select Condition to be "MCumulativeDelta"
3. Select "Crossing" with Value = 0
4. Options set "Once Per Bar Close"
5. Customize Any other Alert Options you want
* AUTHOR *
This script is published by MBoxWave LLC
XPrecisionSwing (XPS)* XPrecisionSwing (XPS) Indicator *
Is a visual representation of the Forces of Supply / Demand in the markets in the form of UP and DOWN waves. The Supply / Demand (denoted by a number on top or below the wave line) is computed using the *MBox Precision Supply / Demand* algorithm. These numbers diligently show the forces of Supply and Demand moving price in the markets. The algorithm for computing the numbers on the top and bottom of the wave lines measures the strength of the Supply / Demand. It is this algorithm that makes this indicator unique as it gives an accurate representation of the forces pulling the market up and down. When forces oppose each other, meaning when the direction of price does not agree with the direction of the Supply or Demand it creates a divergence and an opportunity in the markets. These situations are called BUY / SELL Imbalances. Explanation about this below.
* WHAT THE SCRIPT DOES *
The XPrecisionSwing indicator draws swing waves lines going up and down. These waves lines are representative of Supply and Demand. Waves going up are Demand, while waves going down are Supply. The strength of the Supply / Demand corresponds to the number drawn either on top of the wave line or below it. The numbers drawn on the chart are powered by the *MBox Precision Supply / Demand* algorithm, which are representative of the Forces of Supply / Demand in the markets. This is not just volume added up like in a regular zig zag indicator, since volume alone does not show Supply / Demand, and regular volume will not show BUY / SELL Imbalances as depicted by XPrecisionSwing. Volume summated will not show both positive and negative numbers on the chart. Having Supply / Demand split into both positive and negative numbers allows us to see BUY / SELL Imbalances, which can be a very powerful divergence. Information on how these numbers are computed are in the "HOW IT WORKS" section.
The numbers drawn on the chart can be either negative or positive. Positive relates to Demand, while negative relates to Supply. In this manner the strength of Supply and Demand can be gauged in each wave. If the price goes up but the number is negative (More Supply) it is a divergence and called a SELL Imbalance. This means there was more Supply even though price went up. It is important to pay attention to these scenarios, as often it can be indicative of NO DEMAND. Conversely. if the price goes down but the number is positive (No Demand) it is a divergence and is called a BUY Imbalance. This means there was more Demand even though price went down. This is indicative of NO SUPPLY. As such, it now becomes possible to know when there is a sign of Supply, Demand, No Supply, No Demand, Supply Exhaustion, and Demand exhaustion. Supply occurs when the negative numbers on the charts begin to increase (more negatively). Demand occurs when the positive numbers on the chart begin to increase (more positively). A Supply Exhaustion pattern happens when the price is starting to move down more slowly, while Supply is decreasing, and Demand is increasing. This means that the behavior of the market is changing and also a signal to look to reverse positions. A Demand Exhaustion pattern happens when the price is starting to move up more slowly, while Demand is decreasing, and Supply is increasing. The behavior of the market here is also changing.
* HOW IT WORKS *
- Technical Details for the Numbers on the Swing -
The numbers on the chart represent Supply / Demand. Supply or Demand is determined by analyzing the movement of price and quantity of volume.
When price goes up and is combined with an increase in volume it is Expansion of Demand.
(Positive Numbers get larger)
However if price goes up and is combined with a decrease in volume it is Contraction of Demand.
(Positive Numbers get smaller)
When price goes down and is combined with an increase in volume it is Expansion of Supply.
(Negative Numbers get larger)
However if price goes down and is combined with a decrease in volume it is Contraction of Supply.
(Negative Numbers get smaller)
- Technical Details for the Swing -
The way XPrecisionSwing draws the swings is fractal in nature, which make it very convenient and easier to use over the traditional zig zag indicator. The traditional zig zag indicator uses a tick reversal which needs to be adjusted every time you change time frames. However, with XPrecisionSwing you do not have to change any settings every time you load a different time frame since it will adjust to any time frame you are loading. How the swing is drawn is explained below.
XPrecisionSwing uses 3 bars (by default) to define a swing
This parameter can be adjusted. Can be 1, 2, 4 bars, etc...
Swings are always drawn using High / Low of the bar
- Rules -
To start upswing, bar high needs to be higher than previous 3 candle highs
To start downswing, bar low needs to be lower than previous 3 candle lows
If in upswing, a higher high will continue the upswing
if in downswing, a lower low will continue the downswing
- Exceptions -
If outside bar (both high and low exceeds previous 3 bars) swing will continue in current direction
- Swing Confirmation -
Swing wave line in progress (unconfirmed) is denoted by a brown box around the swing number
Once the brown box disappears, that swing wave and number is confirmed
* HOW TO USE IT *
As the numbers on the down waves increase (negatively), this shows that the bears have taken control of the markets. Conversely, as the numbers on the up waves increase (positively), this shows the bulls have taken control of the markets. Whoever is in control is the direction you generally want to place your trades in. When you see an increase in Supply (numbers on down wave) accompanied with a decrease in Demand (numbers on up wave) this shows a Supply + Demand Exhaustion Pattern. This is stronger than if you only see an increase in Supply without a decrease in Demand.
- The Buy / Sell Imbalances -
If you see a positive blue number on the bottom of a DOWN Wave, this means that there was more buying than selling even though price moved down.
If you see a negative red number on the top of an UP Wave, this means that there was more selling than buying even though price moved up.
Both of these cases signify and imbalance and a divergence.
* EXAMPLE AND USE CASES *
- Sell Imbalance Example -
If you see a large negative number with a lower low on a down wave, and then the next up wave is a lower high also with a negative number it shows that there is only Supply flooding the market and no sign of Demand. This is a very powerful combo.
- Buy Imbalance Example -
If you see a large positive number with a higher high on an up wave, and then the next down wave is a higher low also with a positive number it shows that there is only Demand flooding the market and no sign of Supply. This is a very powerful combo.
- Supply Exhaustion example -
If you see price movement struggling to make newer lows and the Supply numbers on the down waves are decreasing, while the Demand numbers on the up waves are increasing this is indicative of a *Change of Behavior*, and that the market is showing signs of reversal.
- Break out on Demand example -
If you see price has been ranging and now the numbers on the UP waves begin to increase while breaking out of a previous area of resistance, it is a good sign that the movement is backed by the strength coming from the Demand.
* BUY / SELL IMBALANCE ALERTS *
The Green / Red crosses on the chart show exactly where the Buy / Sell Imbalance Alerts trigger.
These will NEVER repaint! The crosses can be hidden in Styles if you wish to.
Alerts can be set very easily with the instructions below.
1. Right Click Chart -> Add Alert...
(Ignore Caution Warning. These alerts will *ONLY* trigger on Confirmed BUY / SELL Imbalances and will NOT repaint)
2. Select Condition to be "XPrecisionSwing"
3. Select "Buy Imbalance" or "Sell Imbalance"
4. Select "Greater Than" with Value = 0
5. Options set "Once Per Bar"
6. Customize Any other Alert Options you want
* WHAT MAKES IT ORIGINAL *
XPrecisionSwing gives an inside look into the markets by showing price movements as a series of waves going up and down with their corresponding Supply / Demand numbers associated with each wave. Reading the numbers shows the strength of Supply / Demand. The bigger the number the stronger the Supply / Demand is. The smaller the number the weaker the Supply / Demand is. It becomes possible to see where Supply / Demand comes in, along with Exhaustion of Supply / Demand to spot opportunities to place trades. The Buy / Sell Imbalances show imbalances where price movement and the direction of the Supply / Demand diverge to create potential opportunities as well.
* AUTHOR *
This script is published by MBoxWave LLC
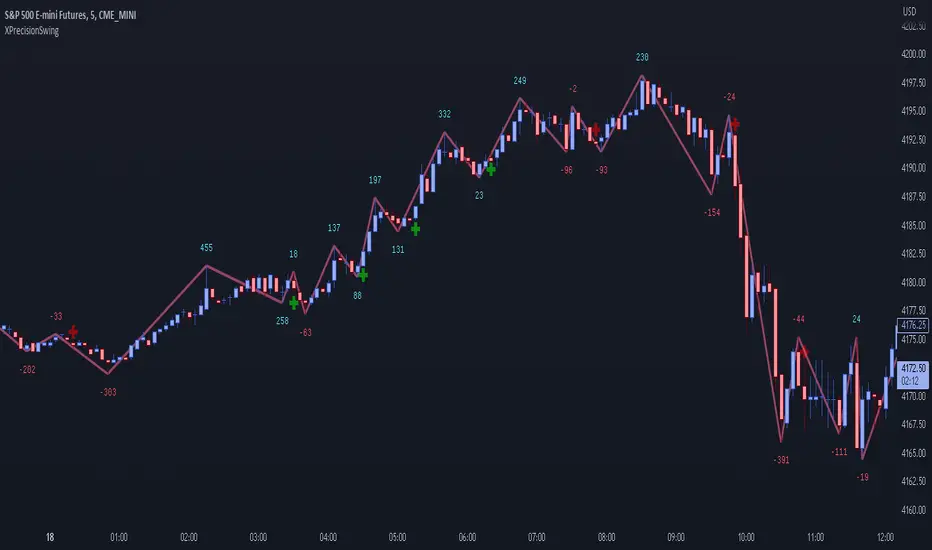
Gamma Bands v. 7.0Gamma Bands are based on previous day data of base intrument, Volatility , Options flow (imported from external source Quandl via TradingView API as TV is not supporting Options as instruments) and few other additional factors to calculate intraday levels. Those levels in correlation with even pure Price Action works like a charm what is confirmed by big orders often placed exactly on those levels on Futures Contracts. We have levels +/- 0.25, 0.5 and 1.0 that are calculated from Pivot Point and are working like Support and Resistance. Higher the number of Gamma, stronger the level. Passing Gamma +1/-1 would be good entry point for trades as almost everytime it is equal to Trend Day. Levels are calculated by Machine Learning algorithm written in Python which downloads data from Options and Darkpool markets, process and calculate levels, export to Quandl and then in PineScript I import the data to indicator. Levels are refreshed each day and are valid for particular trading day.
There's possibility also to enable display of Initial Balance range (High and Low range of bars/candles from 1st hour of regular cash session). Breaking one of extremes of Initial Balance is very often driving sentiment for rest of the session.
Volatility Reversal Levels
They're calculated taking into account Options flow imported to TV (Strikes, Call/Put types & Expiration dates) in combination with Volatility, Volume flow. Based on that we calculate on daily basis Significant Close level and "Stop and Reversal level".
Very often reaching area close to those levels either trigger immediate reversal of previous trend or at least push price into consolidation range.
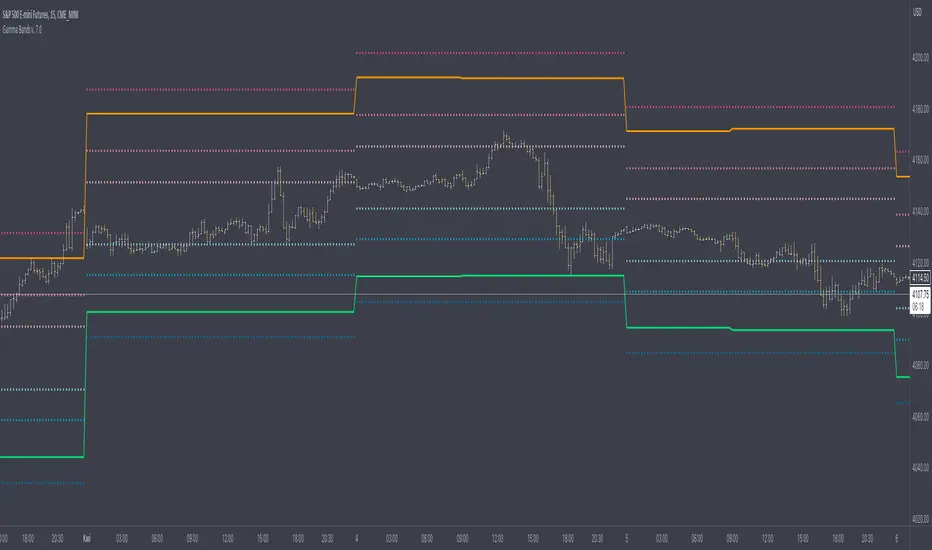
Weis V5 zigzag jayySomehow, I deleted version 5 of the zigzag script. Same name. I have added some older notes describing how the Weis Wave works.
I have also changed the date restriction that stopped the script from working after Dec 31, 2022.
What you see here is the Weis zigzag wave plotted directly on the price chart. This script is the companion to the Weis cumulative wave volume script.
What is a Weis wave? David Weis has been recognized as a Wyckoff method analyst he has written two books one of which, Trades About to Happen, describes the evolution of the now-popular Weis wave. The method employed by Weis is to identify waves of price action and to compare the strength of the waves on characteristics of wave strength. Chief among the characteristics of strength is the cumulative volume of the wave. There are other markers that Weis uses as well for example how the actual price difference between the start of the Weis wave from start to finish. Weis also uses time, particularly when using a Renko chart
David Weis did a futures io video which is a popular source of information about his method. (Search David Weis and futures.io. I strongly suggest you also read “Trades About to Happen” by David Weis.
This will get you up and running more quickly when studying charts. However, you should choose the Traditional method to be true to David Weis technique as described in his book "Trades About to Happen" and in the Futures IO Webcast featuring David Weis
. The Weis pip zigzag wave shows how far in terms of bar close price a Weis wave has traveled through the duration of a Weis wave. The Weis zigzag wave is used in combination with the Weis cumulative volume wave. The two waves should be set to the same "wave size".
To use this script, you must set the wave size: Using the traditional Weis method simply enter the desired wave size in the box "How should wave size be calculated", in this example I am using a traditional wave size of .25. Each wave for each security and each timeframe requires its own wave size. Although not the traditional method devised by David Weis a more automatic way to set wave size would be to use Average True Range (ATR). Using ATR is not the true Weis method but it does give you similar waves and, importantly, without the hassle described above. Once the Weis wave size is set then the zigzag wave will be shown with volume. Because Weis used the closing price of a wave to define waves a line Bar highs and bar lows are not captured by the Weis Wave. The default script setting is now cumulative volume waves using an ATR of 7 and a multiplication factor of .5.
To display volume in a way that does not crowd out neighbouring volumes Weis displayed volume as a maximum of 3 digits (usually). Consider two Weis Wave volumes 176,895,570 and 2,654,763,889. To display wave volume as three digits it is necessary to take a number such as 176,895,570 and truncate it. 176,895,570 can be represented as 177 X 10 to the power of 6. The number displayed must also be relative to other numbers in the field. If the highest volume on the page is: 2,654,763,889 and with only three numbers available to display the result the value shown must be 265 (265 X 10 to the power of 7). Since 176,895,570 is an order of magnitude smaller than 2,654,763,889 therefore 175,895,570 must be shown as 18 instead of 177. In this way, the relative magnitudes of the two volumes can be understood. All numbers in the field of view must be truncated by the same order of magnitude to make the relative volumes understandable. The script attempts to calculate the order of magnitude value automatically. If you see a red number in the field of view it means the script has failed to do the calculation automatically and you should use the manual method – use the dialogue box “Calculate truncated wave value automatically or manually”. Scroll down from the automatic method and select manual. Once "manual" is selected the values displayed become the power values or multipliers for each wave.
Using the manual method you will select a “Multiplier” in the next dialogue box. Scan the field and select the largest value in the field of view (visible chart) is the multiplier of interest. If you select a lower number than the maximum value will see at least one red “up”. If you are too high you will see at least one red “down”. Scroll in the direction recommended or the values on the screen will be totally incorrect. With volume truncated to the highest order values, the eye can quickly get a feel for relative volumes. It also reduces the crowding and overlapping of values on the screen. You can opt to show the full volume to help get a sense of the magnitude of the true volumes.
How does the script determine if a Weis wave is continuing to grow or not?
The script evaluates the closing price of each new bar relative to the "Weis wave size". Suppose the current bar closes at a new low close, within the current down wave, at $30.00. If the Weis wave size is $0.10 then the algorithm will remember the $30.00 close and compare it to the close of the next bar. If the bar close price does not close equal to or lower than $30.00 or close equal to or higher than $30.10 then the wave is still a down wave with a current low of $30.00. This is true even if the bar low is less than $30.00 or the bar high is greater than 30.10 – only the bar’s closing price matters. If a bar's closing price climbs back up to a close of $30.11 then because the closing price has moved more than $0.10 (the Weis wave size) then that is a wave reversal with a new up-trending wave. In the above example if there was currently a downward trending wave and the bar closes were as follows $30.00, $30.09, $30.01, $30.05, $30.10 The wave direction would continue to stay downward trending until the close of $30.10 was achieved. As such $30.00 would be the low and the following closes $30.09, $30.01, $30.05 would be allocated to the new upward-trending wave. If however There was a series of bar closes like this $30.00, $30.09, $30.01, $30.05, $29.99 since none of the closes was equal to above the 10-cent reversal target of $30.10 but instead, a new Weis wave low was achieved ($29.99). As such the closes of $30.09, $30.01, $30.05 would all be attributed to the continued down-trending wave with a current low of $29.99, even though the closing price for the interim bars was above $30.00. Now that the Weis Wave low is now 429.99 then, in order to reverse this continued downtrend price will need to close at or above $30.09 on subsequent bar closes assuming now new low bar close is achieved. With large wave sizes, wave direction can be in limbo for many bars before a close either renews wave direction or reverses it and confirms wave direction as either a reversal or a continuation. On the zig-zag, a wave line and its volume will not be "printed" until a wave reversal is confirmed.
The wave attribution is similar when using other methods to define wave size. If ATR is used for wave size instead of a traditional wave constant size such as $0.10 or $2 or 2000 pips or ... then the wave size is calculated based on current ATR instead of the Weis wave constant (Traditional selected value).
I have the option to display pseudo-Ord volume. In truth, Ord used more traditional zig-zag pivots of bar highs and lows. Waves using closes as pivots can have some significant differences. This difference can be lessened by using smaller time frames and larger wave sizes.
There are other options such to display the delta price or pip size of a Weis Wave, the number of bars in a wave, and a few other options.

ONCHAIN: BTC HOLDERS/RETAIL Assets RatioThis indicator is based on on-chain data developed exclusively for Bitcoin
This indicator measures the ratio of Hodlers' assets to Retails' assets based on the On-chain data of Intotheblock platform (you can find it on Sources). This is consistent with Wyckoff's theory of accumulation and distribution. At the top of the market, Hodlers have sold most of their assets to retailers, so this ratio is at its lowest. At market bottoms, Hodlers accumulates the asset at low prices. The uptrend and downtrend of this indicator can also be used to confirm the uptrend or downtrend of the Bitcoin market.
