Triple Digital Power this Pine Script that identifies a bearish candle with a body ratio of at least 55% that closes under the lowest point of a preceding bullish candle (also with a body ratio of at least 55%), you can follow the steps below. The body ratio is calculated as the absolute difference between the candle's open and close prices, divided by the range of the candle (high to low). This Pine Script will include:
- Calculating the body ratio for each candle.
- Identifying bullish and bearish candles based on the body ratio.
- Checking if the closing price of a bearish candle is lower than the lowest price of the preceding bullish candle with the required body ratio.
This script identifies the bearish candle that meets the criteria and marks it with a red triangle below the bar. It also optionally marks the qualifying bullish candles with a green triangle above the bar. This can help in visual analysis of the price chart to understand the pattern's occurrence within the given market conditions.
Please note, the efficiency and accuracy of this script are dependent on the characteristics of the market and the specific timeframe you are analyzing. It's always a good idea to backtest any trading strategy or script in a controlled environment to understand its potential performance.
Cari dalam skrip untuk "accuracy"

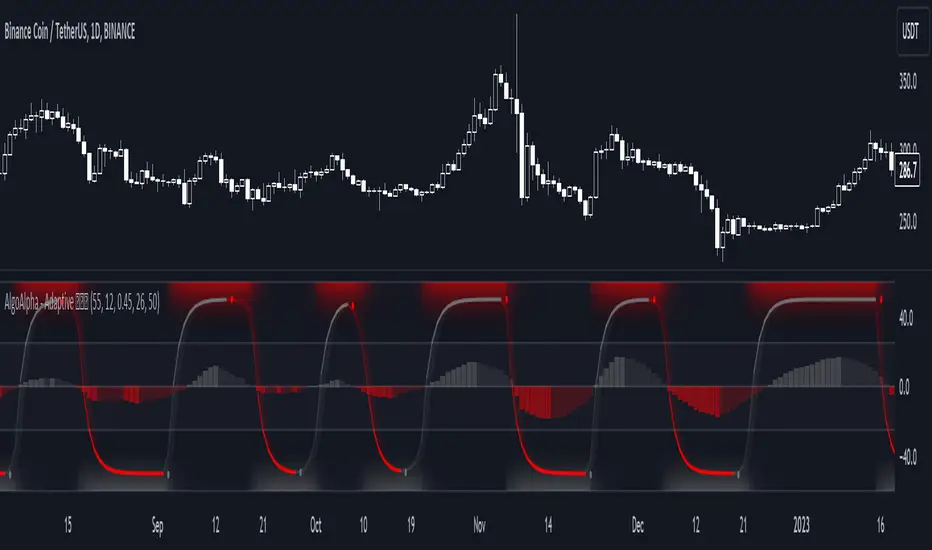
Adaptive Schaff Trend Cycle (STC) [AlgoAlpha]Introducing the Adaptive Schaff Trend Cycle by AlgoAlpha: Elevate Your Trading Strategies 🚀
Discover precision and adaptability with the Adaptive Schaff Trend Cycle 🎯, meticulously crafted for traders seeking an edge in the markets. This advanced tool integrates sophisticated algorithms to offer clear insights and real-time analytics 📈.
Key Features:
⚙️Adaptive Signal Processing: Utilizes evolving calculations to adjust to market changes, offering highly responsive signals.
🔍Enhanced MACD Analysis: Innovates on the traditional MACD, providing new insights into market dynamics through an adaptive lens.
🎨Customizable Visual Experience: Features customizable up and down colors for tailored chart analysis.
🔔Real-Time Alerts: Stay informed with instant alerts on indicator changes.
Quick Guide to Using the Adaptive STC Indicator
1. 🔧 Adding the Indicator: Search for "Adaptive Schaff Trend Cycle (STC) " within TradingView's Indicators & Strategies and apply it to your chart. Customize the settings according to your trading style for optimum results.
2.👀 Market Analysis: Monitor the STC and Histogram values closely. The indicator's color gradients provide a visual representation of momentum shifts, helping you to identify trends more clearly.
3. 🚨 Set Alerts: Enable alerts for specific conditions like significant moves up or down, or when the histogram crosses zero. This feature ensures you never miss a potential trading opportunity.
How It Works:
The Adaptive Schaff Trend Cycle by AlgoAlpha introduces a dynamic approach to market analysis, refining traditional indicators through adaptive logic to align with fluctuating market conditions. Here's a concise overview of its operation:
🔄 Adaptive MACD Adjustment: The foundation of the indicator is an enhanced MACD calculation, which dynamically adjusts its parameters based on real-time market trends and momentum. This algorithmic adjustment aims to ensure the MACD's responsiveness to market changes, adapting its sensitivity to offer timely insights .
🌟 Integration of Schaff Trend Cycle (STC): After adjusting the MACD, the indicator calculates STC values to provide a smoothed representation of market trends. By normalizing and smoothing the MACD values on a scale from 0 to 100, the STC method helps in identifying market phases with a clear visualization. The smoothing process is designed to mitigate noise and focus on significant market movements .
📊 Visualization and Alerts: To aid in the interpretation of these insights, the Adaptive Schaff Trend Cycle employs color gradients and customizable visual settings to indicate momentum shifts. These visual cues, combined with alert functionalities, are structured to assist traders in monitoring market developments, enabling them to make informed decisions based on the presented data .
🛠️The Adaptive Schaff Trend Cycle thus merges adaptive MACD adjustments with STC methodology, supported by visual and alert features, to create a tool aimed at enhancing market analysis. By focusing on adaptability and current market conditions, it provides a nuanced view of market trends, intended to support traders in their decision-making processes without promising predictive accuracy or reliability .
HTF FVG and Wick Fill trackingImbalances in the charts are some of the clearest and most traded price areas. Two of the best and most used are fair value gaps FVGs and large candle wicks. In both of these price appears to move in such a way that most are left behind having 'missed' the move. But in reality price will often come back to these price points to re-balance and absorb the liquidity that was left behind.
This indicator takes these areas and makes viewing and tracking them clearer than ever. It does this, by first allowing the user to overlay a higher timeframe candle on the current chart. This in itself provides an in depth look at a higher timeframe candle both as it forms and in its final form.
Next the indicator identifies either the FVG or large wicks, on the chosen higher timeframe, all while the chart remains on a lower timeframe. As seen here the fair value gaps are clearly highlighted, taken from a 4 hour timeframe, while the actual chart is on 15 minutes. This allows the user even greater accuracy in identifying their key trading areas.
Utilizing the indicators unique feature, these areas can optionally be extended forward to the current timeframe and 'filled' in realtime. Areas that are filled to the users defined level, will be removed from the chart.
With supplementary settings for how much history to show, how large of a wick should be highlighted and complete control over the colour scheme, users will be able to track and understand the filling of imbalances like never before.

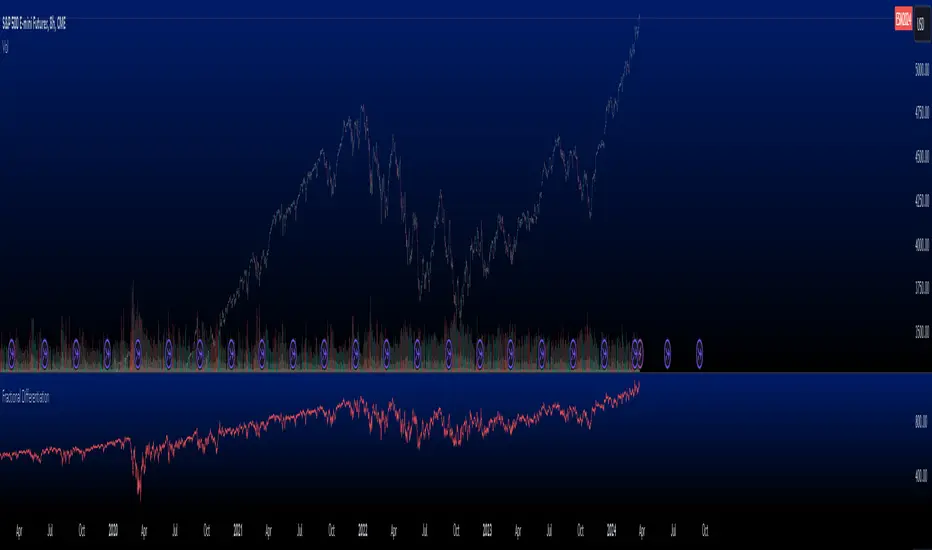
Fractional Differentiation█ Description
This Pine Script indicator implements fractional differentiation, a mathematical operation that extends the concept of differentiation to non-integer orders. Fractional differentiation is particularly significant in financial analysis, as it enables analysts to uncover underlying patterns in price series that are not evident with traditional integer-order differentiation. The motivation behind fractional differencing lies in its ability to balance the trade-off between retaining data/feature memory and ensuring stationarity.
█ Significance
Fractional differentiation offers a nuanced view of market data, allowing for the adjustment of the differentiation order to balance between signal clarity and noise reduction. This is especially useful in financial markets, where the choice of differentiation order can highlight long-term trends or short-term price movements without completely smoothing out the valuable market noise.
█ Approximations Used
The implementation relies on the Gamma function for the computation of coefficients in the fractional differentiation formula. Given the complexity of the Gamma function, this script uses an approximation method based on the Lanczos approximation for the logarithm of the Gamma function, as detailed in "An Analysis Of The Lanczos Gamma Approximation" by Glendon Ralph Pugh (2004). This approximation strikes a balance between computational efficiency and accuracy, making it suitable for real-time market analysis in Pine Script.
█ Limitations
While this script opens new avenues for market analysis, it comes with inherent limitations:
- The approximation of the Gamma function, although accurate, is not exact. The precision of the fractional differentiation result may vary slightly, especially for higher-order differentiations.
- The script's performance is subject to Pine Script's execution environment, with a default loop limit set to 100 iterations for practicality. Users might need to adjust this limit based on their specific use case, balancing between computational load and the desired depth of historical data analysis.
█ Credits
This script makes use of the `MathSpecialFunctionsGamma` library, authored by Ricardo Santos . This library provides essential mathematical functions, including an approximation of the Gamma function, which is crucial for the fractional differentiation calculation.
I also extend my sincere gratitude to
Dr. Marcos López de Prado for his seminal work, Advances in Financial Machine Learning (2018). Dr. López de Prado's insights have significantly influenced our approach to developing sophisticated analytical tools.
Dr. Ernie Chan for his freely and generously sharing valuable insights via discourse on quantitative trading strategies through his talks and publications.
Entry FraggerEntry Fragger is a simple buy signal indicator.
It is most suitable for cryptocurrency, especially for altcoins on the 5 minute to daily timeframe and is based on simple volume calculations, in combination with EMA's.
Main Signal Logic explained:
A buy signal is generated by counting candles with an above average sell volume of 130% to 170%, taking into account the candles position below and above the 50 and 200 EMA.
If criteria meet, the first green candle above the 50 EMA's suggests upcoming higher prices.
The indicator has 2 input variables.
"Signal Confirmations (0 - 7):" Changes signal accuracy by a defining an ammount of high sell volume candles necessary below the 50 EMA.
"Volume Calculation Base (9 - 200):" Sets the exponential volume multiplier, this affects candle coloring and the volume calculation inside the candle.
"Style Settings": Turn ON/OFF Signals, Cloud, Bar Coloring, EMA's, etc...
There are no generally suitable default numbers for those 2 inputs, those have to be tested out, depending on cryptocurrency and timeframe.
The calculation is very basic, the underlying idea being, market maker initiating range breakouts through rapid increase of volume above or below the EMA's .
Example settings:
SOLUSDT: Signal Confirmations: 2, Volume Calculation Base 13.
SOLUSDT: Signal Confirmations: 0, Volume Calculation Base 20.
As you can see it affects signals quite a lot, but staying accurate.
Finetune the inputs to your preference.
Risk to Reward, Stoploss, Take Profit, position sizing, etc... is up to the user.
Recommended entry is to wait for following candle closes, entering half of the candle size and setting Stoploss outside the structure, like this:
Or right below the candles open, for safety.

Kalman Price Filter [BackQuant]Kalman Price Filter
The Kalman Filter, named after Rudolf E. Kálmán, is a algorithm used for estimating the state of a linear dynamic system from a series of noisy measurements. Originally developed for aerospace applications in the early 1960s, such as guiding Apollo spacecraft to the moon, it has since been applied across numerous fields including robotics, economics, and, notably, financial markets. Its ability to efficiently process noisy data in real-time and adapt to new measurements has made it a valuable tool in these areas.
Use Cases in Financial Markets
1. Trend Identification:
The Kalman Filter can smooth out market price data, helping to identify the underlying trend amidst the noise. This is particularly useful in algorithmic trading, where identifying the direction and strength of a trend can inform trade entry and exit decisions.
2. Market Prediction:
While no filter can predict the future with certainty, the Kalman Filter can be used to forecast short-term market movements based on current and historical data. It does this by estimating the current state of the market (e.g., the "true" price) and projecting it forward under certain model assumptions.
3. Risk Management:
The Kalman Filter's ability to estimate the volatility (or noise) of the market can be used for risk management. By dynamically adjusting to changes in market conditions, it can help traders adjust their position sizes and stop-loss orders to better manage risk.
4. Pair Trading and Arbitrage:
In pair trading, where the goal is to capitalize on the price difference between two correlated securities, the Kalman Filter can be used to estimate the spread between the pair and identify when the spread deviates significantly from its historical average, indicating a trading opportunity.
5. Optimal Asset Allocation:
The filter can also be applied in portfolio management to dynamically adjust the weights of different assets in a portfolio based on their estimated risks and returns, optimizing the portfolio's performance over time.
Advantages in Financial Applications
Adaptability: The Kalman Filter continuously updates its estimates with each new data point, making it well-suited to markets that are constantly changing.
Efficiency: It processes data and updates estimates in real-time, which is crucial for high-frequency trading strategies.
Handling Noise: Its ability to distinguish between the signal (e.g., the true price trend) and noise (e.g., random fluctuations) is particularly valuable in financial markets, where price data can be highly volatile.
Challenges and Considerations
Model Assumptions: The effectiveness of the Kalman Filter in financial applications depends on the accuracy of the model used to describe market dynamics. Financial markets are complex and influenced by numerous factors, making model selection critical.
Parameter Sensitivity: The filter's performance can be sensitive to the choice of parameters, such as the process and measurement noise values. These need to be carefully selected and potentially adjusted over time.
Despite these challenges, the Kalman Filter remains a potent tool in the quantitative trader's arsenal, offering a sophisticated method to extract useful information from noisy financial data. Its use in trading strategies should, however, be complemented with sound risk management practices and an awareness of the limitations inherent in any model-based approach to trading.

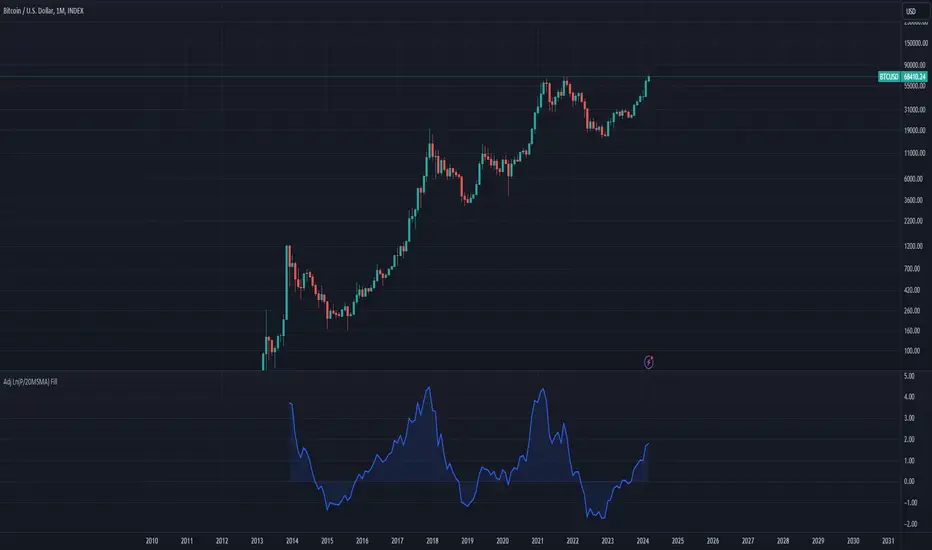
Bitcoin Bubble Risk (Adjusted for Diminishing Returns)Description:
This indicator offers a unique lens through which traders can assess risk in the Bitcoin market, specifically tailored to recognize the phenomenon of diminishing returns. By calculating the natural logarithm of the price relative to a 20-month Simple Moving Average (SMA) and applying a dynamic normalization process, this tool highlights periods of varying risk based on historical price movements and adjusted returns. The indicator is designed to provide nuanced insights into potential risk levels, aiding traders in their decision-making processes.
Usage:
To effectively use this indicator, apply it to your chart while ensuring that Bitcoin's price is set to display in monthly candles. This setting is vital for the indicator to accurately reflect the market's risk levels, as it relies on long-term data aggregation to inform its analysis.
This tool is especially beneficial for traders focused on medium to long-term investment horizons in Bitcoin, offering insights into when the market may be entering higher or lower risk phases. By incorporating this indicator into your analysis, you can gain a deeper understanding of potential risk exposures based on the adjusted price trends and market conditions.
Originality and Utility:
This script stands out for its innovative approach to risk analysis in the cryptocurrency space. By adjusting for the diminishing returns seen in mature markets, it provides a refined perspective on risk levels, enhancing traditional methodologies. This script is a significant contribution to the TradingView community, offering a unique tool for traders aiming to navigate the complexities of the Bitcoin market with informed risk management strategies.
Important Note:
This indicator is for informational purposes only and should not be considered investment advice. Users are encouraged to conduct their own research and consult with financial professionals before making investment decisions. The accuracy of the indicator's predictions can only be ensured when applied to monthly candlestick charts of Bitcoin.
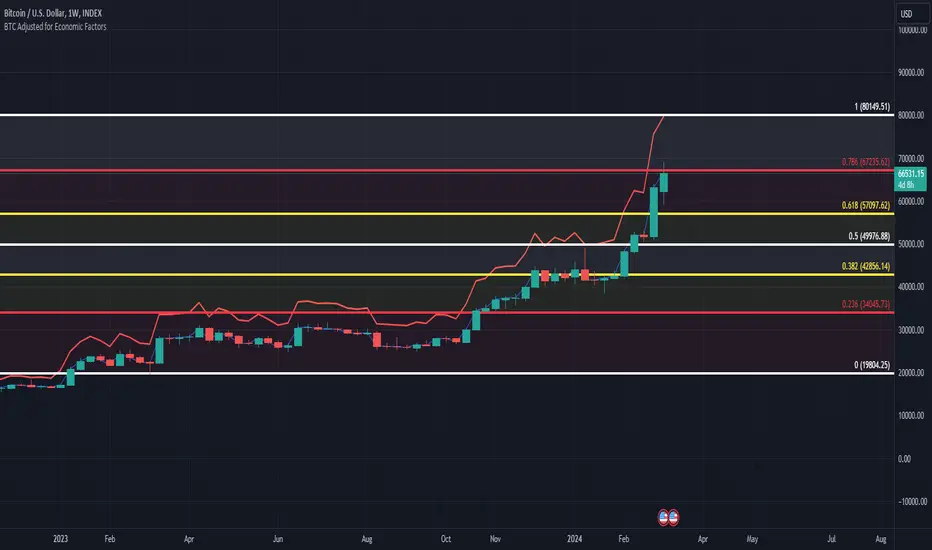
BTC/USD Inflation priced in! ~Period 2009 - 2023 (by TAS)The script creates a custom indicator titled "BTC Adjusted for Economic Factors.
Adjusted BTC Price is plotted in red, making it more prominent. The adjusted price is Bitcoin's historical closing prices adjusted for cumulative inflation over time, based on the Core Consumer Price Index (CPI) annual inflation rates from 2009 onwards.
The script calculates the adjusted price of Bitcoin by taking into account the effect of inflation on its value. It uses annual CPI rates for each year from 2009 to 2022 to calculate a cumulative inflation factor. The script assumes a placeholder inflation rate of 2.5% for 2023, indicating that this value should be updated when the actual rate is available. The script suggests adding CPI rates for additional years as they become available to maintain the accuracy of the adjustment.
Here's a breakdown of how the script works:
Core CPI Annual Inflation Rates: It starts by defining the annual inflation rates for each year from 2009 to 2022, expressed as a percentage divided by 100 to convert to a decimal.
Cumulative Inflation Calculation: The script calculates cumulative inflation starting from the year 2009 up to the current year. For each year that has passed since 2009, it multiplies the cumulative inflation factor by (1 + cpiRate), where cpiRate is the inflation rate for that year. This effectively compounds the inflation rate over time.
Adjusting Bitcoin's Price: The script then adjusts Bitcoin's closing price (close) for the calculated cumulative inflation to get the adjusted price (adjustedPrice).
Plotting the Prices: Finally, it plots both the original and the adjusted Bitcoin prices on the chart, allowing users to visually compare how inflation has theoretically impacted Bitcoin's value over time.
--------------------------------------------------------------------------------------------------
Important to notice, Fib. Retracements from the 2017 cycle top to the recent top (¬80K) doesn't look invalidated.
--------------------------------------------------------------------------------------------------
Inputs and feedback are welcome!
WaveTrendnel Oscillator [UAlgo]🔶Description:
The WaveTrendnel Oscillator, is a technical analysis tool designed for traders to identify potential trend reversals and overbought/oversold conditions in the market. It combines the concepts of wave analysis and trend analysis to generate signals based on the current market conditions. This indicator aims to provide traders with insights into the strength and direction of the prevailing trend, facilitating better decision-making in trading strategies.
🔶Key Features:
Customizable Parameters: Users can customize various parameters including the source data, channel length, average length, and signal length according to their trading preferences and market conditions.
Signal Display: The indicator offers the option to display buy and sell signals on the chart, helping traders to visually identify potential entry and exit points.
Wave and Kernel Analysis: The WaveTrendnel Oscillator utilizes a rational quadratic kernel function, which applies a mathematical approach known as the kernel method. This method analyzes historical price data by assigning weights to each data point based on its proximity to the current period, providing a smoother and more accurate representation of market trends.
Overbought/Oversold Levels: Traders can define overbought and oversold levels using customizable threshold parameters, enabling them to identify potential reversal points in the market.
🔶Credit:
The WaveTrendnel Oscillator indicator is a modification of the original WaveTrend Oscillator developed by @LazyBear on TradingView.
🔶Disclaimer:
Use with Caution: This indicator is provided for educational and informational purposes only and should not be considered as financial advice. Users should exercise caution and perform their own analysis before making trading decisions based on the indicator's signals.
Not Financial Advice: The information provided by this indicator does not constitute financial advice, and the creator (UAlgo) shall not be held responsible for any trading losses incurred as a result of using this indicator.
Backtesting Recommended: Traders are encouraged to backtest the indicator thoroughly on historical data before using it in live trading to assess its performance and suitability for their trading strategies.
Risk Management: Trading involves inherent risks, and users should implement proper risk management strategies, including but not limited to stop-loss orders and position sizing, to mitigate potential losses.
No Guarantees: The accuracy and reliability of the indicator's signals cannot be guaranteed, as they are based on historical price data and past performance may not be indicative of future results.

Moving Average PropertiesThis indicator calculates and visualizes the Relative Smoothness (RS) and Relative Lag (RL) or call it accuracy of a selected moving average (MA) in comparison to the SMA of length 2 (the lowest possible length for a moving average and also the one closest to the price).
Median RS (Relative Smoothness):
Interpretation: The median RS represents the median value of the Relative Smoothness calculated for the selected moving average across a specified look-back period (max bar lookback is set at 3000).
Significance: A more negative (larger) median RS suggests that the chosen moving average has exhibited smoother price behavior compared to a simple moving average over the analyzed period. A less negative value indicates a relatively choppier price movement.
Median RL (Relative Lag):
Interpretation: The median RL represents the median value of the Relative Lag calculated for the selected moving average compared to a simple moving average of length 2.
Significance: A higher median RL indicates that the chosen moving average tends to lag more compared to a simple moving average. Conversely, lower values suggest less lag in the selected moving average.
Ratio of Median RS to Median RL:
Interpretation: This ratio is calculated by dividing the median RS by the median RL.
Significance: Traders might use this ratio to assess the balance between smoothness and lag in the chosen moving average. This a measure of for every % of lag what is the smoothness achieved. This can be used a benchmark to decide what length to choose for a MA to get an equivalent value between two stocks. For example a TESLA stock on a 15 minute time frame with a length of 12 has a value (ratio of RS/RL) of -150 , where as APPLE stock of length 35 on a 15 minute chart also has a value (ratio of RS/RL) of -150.
I imply that a MA of length 12 working on TESLA stock is equivalent to MA of length 35 on a APPLE stock. (THIS IS A EXAMPLE).
My assumption is that finding the right moving average length for a stock isn't a one-size-fits-all situation. It's not just about using a fixed length; it's about adapting to the unique characteristics of each stock. I believe that what works for one stock might not work for another because they have different levels of smoothness or lag in their price movements. So, instead of applying the same length to all stocks, I suggest adjusting the length of the moving average to match the values that we know work best for achieving the desired smoothness or lag or its ratio (RS/RL). This way, we're customizing the indicator for each stock, tailoring it to their individual behaviors rather than sticking to a one-size-fits-all approach.
Users can choose from various types of moving averages (EMA, SMA, WMA, VWMA, HMA) and customize the length of the moving average. RS measures the smoothness of the MA, while RL measures its lag compared to a simple moving average. The script plots the median RS and RL values, the selected MA, and the ratio of median RS to median RL on the price chart. Traders can use this information to assess the performance of different moving averages and potentially inform their trading decisions.

TTP Intelligent AccumulatorThe intelligent accumulator is a proof of concept strategy. A hybrid between a recurring buy and TA-based entries and exits.
Distribute the amount of equity and add to your position as long as the TA condition is valid.
Use the exit TA condition to define your exit strategy.
Decide between adding only into losing positions to average down or take a riskier approach by allowing to add into a winning position as well.
Take full profit or distribute your exit into multiple take profit exists of the same size.
You can also decide if you allow your exit conditions to close your position in a loss or require a minimum take profit %.
The strategy includes a default built-in TA conditions just for showcasing the idea but the final intent of this script is to delegate the TA entries and exists to external sources.
The internal conditions use RSI length 7 crossing below the BB with std 1 for entries and above for exits.
To control the number of orders use the properties from settings:
- adjust the pyramiding
- adjust the percentage of equity
- make sure that pyramiding * % equity equals 100 to prevent over use of equity (unless using leverage)
The script is designed as an alternative to daily or weekly recurring buys but depending on the accuracy of your TA conditions it might prove profitable also in lower timeframes.
The reason the script is named Intelligent is because recurring buy is most commonly used without any decision making: buy no matter what with certain frequency. This strategy seeks to still perform recurring buys but filtering out some of the potential bad entries that can delay unnecessarily seeing the position in profits. The second reason is also securing an exit strategy from the beginning which no recurring buy option offers out-of-the-box.

ZigZag Multi [TradingFinder] Trend & Wave Lines - Structures🔵 Introduction
"Zigzag" is an indicator that forms based on price changes. Essentially, the function of this indicator is to connect consecutive and alternating High and Low pivots. This pattern assists in analyzing price changes and can also be used to identify classic patterns. "Zigzag" is an analytical tool that, by filtering partial price movements based on the specified period, can identify price waves across different time frames (short or long term).
🔵 Reason for Creation
The combination of "short term zigzag" and "long term zigzag" enhances accuracy and reduces analysis time. In a time frame, "long term zigzag" represents the main trend, while "short term zigzag" depicts short-term waves.
🔵 How to Use
After selecting the desired time frame and adding "zigzag" to the chart, begin utilization. Keep in mind to identify the main market trend from "long term zigzag" and the minor waves from "short term zigzag".
🟣 Important: Additionally, classic patterns such as HH, LH, LL, and HL can be recognized. All traders analyzing financial markets using classic patterns and Elliot Waves can benefit from the "zigzag" indicator to facilitate their analysis.
🔵 Settings
Short term zigzag : In this section, you can adjust settings such as time frame range, display mode, color, and line width of the zigzag lines.
Short term label : This section allows you to activate or deactivate the display of zigzag labels according to your needs. You can also customize their color and size.
Long term zigzag : Here, you can adjust settings for time frame range, display mode, color, and line width of zigzag lines.
Long term label : Similar to short term label settings.
The recommended time frame for "long term zigzag" is between 9 to 15, and for "short term zigzag" is between 3 to 5.
🟣 Important Notes :
Considering the different behaviors of financial markets and various time frames, it is recommended to experiment with different time frame settings when using "zigzag" to find the best settings for each symbol and time frame, thereby preventing potential errors.
🟣 Terminology Explanations :
"HH": When the price is higher than the previous peak (Higher High).
"HL": When the price is higher than the previous low (Higher Low).
"LH": When the price is lower than the previous peak (Lower High).
"LL": When the price is lower than the previous low (Lower Low).

FVG Detector LibraryLibrary "FVG Detector Library"
🔵 Introduction
To save time and improve accuracy in your scripts for identifying Fair Value Gaps (FVGs), you can utilize this library. Apart from detecting and plotting FVGs, one of the most significant advantages of this script is the ability to filter FVGs, which you'll learn more about below. Additionally, the plotting of each FVG continues until either a new FVG occurs or the current FVG is mitigated.
🔵 Definition
Fair Value Gap (FVG) refers to a situation where three consecutive candlesticks do not overlap. Based on this definition, the minimum conditions for detecting a fair gap in the ascending scenario are that the minimum price of the last candlestick should be greater than the maximum price of the third candlestick, and in the descending scenario, the maximum price of the last candlestick should be smaller than the minimum price of the third candlestick.
If the filter is turned off, all FVGs that meet at least the minimum conditions are identified. This mode is simplistic and results in a high number of identified FVGs.
If the filter is turned on, you have four options to filter FVGs :
1. Very Aggressive : In addition to the initial condition, another condition is added. For ascending FVGs, the maximum price of the last candlestick should be greater than the maximum price of the middle candlestick. Similarly, for descending FVGs, the minimum price of the last candlestick should be smaller than the minimum price of the middle candlestick. In this mode, a very small number of FVGs are eliminated.
2. Aggressive : In addition to the conditions of the Very Aggressive mode, in this mode, the size of the middle candlestick should not be small. This mode eliminates more FVGs compared to the Very Aggressive mode.
3. Defensive : In addition to the conditions of the Very Aggressive mode, in this mode, the size of the middle candlestick should be relatively large, and most of it should consist of the body. Also, for identifying ascending FVGs, the second and third candlesticks must be positive, and for identifying descending FVGs, the second and third candlesticks must be negative. In this mode, a significant number of FVGs are eliminated, and the remaining FVGs have a decent quality.
4. Very Defensive : In addition to the conditions of the Defensive mode, the first and third candlesticks should not resemble very small-bodied doji candlesticks. In this mode, the majority of FVGs are filtered out, and the remaining ones are of higher quality.
By default, we recommend using the Defensive mode.
🔵 How to Use
🟣 Parameters
To utilize this library, you need to provide four input parameters to the function.
"FVGFilter" determines whether you wish to apply a filter on FVGs or not. The possible inputs for this parameter are "On" and "Off", provided as strings.
"FVGFilterType" determines the type of filter to be applied to the found FVGs. These filters include four modes: "Very Defensive", "Defensive", "Aggressive", and "Very Aggressive", respectively exhibiting decreasing sensitivity and indicating a higher number of Fair Value Gaps (FVG).
The parameter "ShowDeFVG" is a Boolean value defined as either "true" or "false". If this value is "true", FVGs are shown during the Bullish Trend; however, if it is "false", they are not displayed.
The parameter "ShowSuFVG" is a Boolean value defined as either "true" or "false". If this value is "true", FVGs are displayed during the Bearish Trend; however, if it is "false", they are not displayed.
FVGDetector(FVGFilter, FVGFilterType, ShowDeFVG, ShowSuFVG)
Parameters:
FVGFilter (string)
FVGFilterType (string)
ShowDeFVG (bool)
ShowSuFVG (bool)
🟣 Import Library
You can use the "FVG Detector" library in your script using the following expression:
import TFlab/FVGDetectorLibrary/1 as FVG
🟣 Input Parameters
The descriptions related to the input parameters were provided in the "Parameter" section. In this section, for your convenience, the code related to the inputs is also included, and you can copy and paste it into your script.
PFVGFilter = input.string('On', 'FVG Filter', )
PFVGFilterType = input.string('Defensive', 'FVG Filter Type', )
PShowDeFVG = input.bool(true, ' Show Demand FVG')
PShowSuFVG = input.bool(true, ' Show Supply FVG')
🟣 Call Function
You can copy the following code into your script to call the FVG function. This code is based on the naming conventions provided in the "Input Parameter" section, so if you want to use exactly this code, you should have similar parameter names or have copied the "Input Parameter" values.
FVG.FVGDetector(PFVGFilter, PFVGFilterType, PShowDeFVG, PShowSuFVG)

ML - Momentum Index (Pivots)Building upon the innovative foundations laid by Zeiierman's Machine Learning Momentum Index (MLMI), this variation introduces a series of refinements and new features aimed at bolstering the model's predictive accuracy and responsiveness. Licensed under the Creative Commons Attribution-NonCommercial-ShareAlike 4.0 International License (CC BY-NC-SA 4.0), my adaptation seeks to enhance the original by offering a more nuanced approach to momentum-based trading.
Key Features :
Pivot-Based Analysis: Shifting focus from trend crosses to pivot points, this version employs pivot bars to offer a distinct perspective on market momentum, aiding in the identification of critical reversal points.
Extended Parameter Set: By integrating additional parameters for making predictions, the model gains improved adaptability, allowing for finer tuning to match market conditions.
Dataset Size Limitation: To ensure efficiency and mitigate the risk of calculation timeouts, a cap on the dataset size has been implemented, balancing between comprehensive historical analysis and computational agility.
Enhanced Price Source Flexibility: Users can select between closing prices or (suggested) OHLC4 as the basis for calculations, tailoring the indicator to different analysis preferences and strategies.
This adaptation not only inherits the robust framework of the original MLMI but also introduces innovations to enhance its utility in diverse trading scenarios. Whether you're looking to refine your short-term trading tactics or seeking stable indicators for long-term strategies, the ML - Momentum Index (Pivots) offers a versatile tool to navigate the complexities of the market.
For a deeper understanding of the modifications and to leverage the full potential of this indicator, users are encouraged to explore the tooltips and documentation provided within the script.
The Momentum Indicator calculations have been transitioned to the MLMomentumIndex library, simplifying the process of integration. Users can now seamlessly incorporate the momentumIndexPivots function into their scripts to conduct detailed momentum analysis with ease.

Liquidation Longs/Shorts [UAlgo]🔶Description:
The "Liquidation Longs/Shorts " indicator is designed to identify potential liquidation levels for long and short positions. It calculates the distance of the selected price source (close, high, low, or open) from two moving averages (MA) and plots the resulting values on the chart. When the price is at an extreme distance from the moving averages, it suggests a potential liquidation point for either long or short positions.
🔶Key Features:
Liquidation Calculations: The indicator calculates the distance of the selected price source from two moving averages: a simple moving average (SMA) and an exponential moving average (EMA) with customizable lengths.
Color Customization: Users can customize the colors of the plotted columns representing the distance from the moving averages for long and short liquidation levels.
Liquidation Circles: The indicator marks potential liquidation levels with small circles on the chart, with customizable colors for long and short liquidations.
Orange Circles -> Identifies Potential Short Liquidations
Aqua Circles -> Identifies Potential Long Liquidations
Example:
Adaptive Source Selection: Traders can select the price source (close, high, low, or open) for liquidation calculations, allowing flexibility based on their trading strategies.
Dynamic Threshold Calculation: The indicator dynamically adjusts the liquidation threshold based on the selected moving average lengths, providing adaptability to changing market conditions.
Disclaimer:
Use with Caution: This indicator is provided for educational purposes only and should not be considered as financial advice. Users should exercise caution and perform their own analysis before making trading decisions based on the indicator's signals.
Not Financial Advice: The information provided by this indicator does not constitute financial advice, and the creator (UAlgo) shall not be held responsible for any trading losses incurred as a result of using this indicator.
Backtesting Recommended: Traders are encouraged to backtest the indicator thoroughly on historical data before using it in live trading to assess its performance and suitability for their trading strategies.
Risk Management: Trading involves inherent risks, and users should implement proper risk management strategies, including but not limited to stop-loss orders and position sizing, to mitigate potential losses.
No Guarantees: The accuracy and reliability of the indicator's signals cannot be guaranteed, as they are based on historical price data and past performance may not be indicative of future results.
This indicator serves as a tool to assist traders in identifying potential liquidation levels, but it should be used in conjunction with other technical analysis tools and risk management practices for effective trading decision-making.

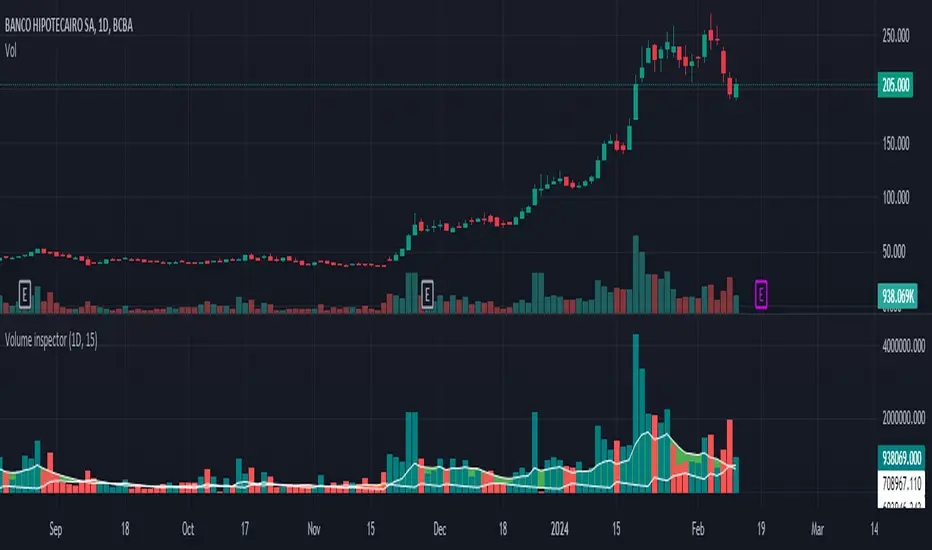
Volume inspectorThe "Volume inspector" is designed to provide a deep dive into the volume dynamics within a given larger timeframe by dissecting the positive and negative volume of candles from a lower timeframe. This analysis helps in understanding how the volume within a single candle is composed, whether it leans towards buying or selling pressure. The indicator sums up the positive and negative volumes to present the net volume in columns, offering a clear visual representation of the market's buying or selling intensity at a glance.
Additionally, it features an area between two Exponential Moving Averages (EMAs) to gauge the prevailing trend direction. A green spread between the EMAs signals strong buying pressure, with the width of the area indicating the strength of this pressure. Conversely, a red area points to selling pressure, warning users to exercise caution — it advises against buying the asset when the spread is narrow or red, suggesting weak buying momentum or strong selling momentum.
The tool recommends using daily candles as the primary timeframe for a broad market overview, with the following configurations for the lower timeframe analysis:
5 minutes for highly liquid and voluminous assets,
15 or 30 minutes for assets with lower volume to ensure accuracy without excessive market noise.
It's important to note that this indicator does not predict future market movements but rather analyzes the current behavior of the asset, making it a valuable tool for traders looking to understand immediate market sentiment and trend strength.