PRO Scalper(EN)
## What it is
**PRO Scalper** is an intraday price–action and liquidity map that helps you see where the market is likely to move **now**, not just where it has been.
It combines five building blocks that professional scalpers often watch together:
1. **Session Volume-Weighted Average Price (VWAP)** — the intraday “fair value” anchor.
2. **Opening Range** — the first minutes of the session that set the day’s balance.
3. **Trend filter** — higher-timeframe bias using **Exponential Moving Averages (EMA)** and optional **Average Directional Index (ADX)** strength.
4. **Two independent Supply/Demand zone engines** — zones are drawn from confirmed swing pivots, with midlines and **touch counters**.
5. **Order-flow style visuals**:
* **Delta bubbles** (green/red circles) show where buying or selling pressure was unusually strong, using a safe **delta proxy** (no external feeds).
* **Liquidity densities** (subtle rectangular bands) highlight clusters of large activity that often act as magnets or barriers and disappear when “eaten” by strong moves.
This mix gives you a **complete intraday picture**: the mean (VWAP), the day’s initial balance (Opening Range), the higher-timeframe push (trend filter), the nearby fuel or brakes (zones), and the live pressure points (bubbles and densities).
---
## Why these components
* **VWAP** tracks where the bulk of traded value sits. Price tends to rotate around it or accelerate away from it — a perfect compass for scalps.
* **Opening Range** frames the early auction. Many intraday breaks, fades and retests start at its boundaries.
* **EMA bias + ADX strength** separates trending conditions from chop, so you can keep only the zones that agree with the bigger push.
* **Pivot-based zones (two pairs at once)** are simple, objective and fast. Midlines help with confirmations; touch counters quantify how many times the zone was tested.
* **Bubbles and densities** add the “effort” layer: where the push appeared and where liquidity is concentrated. You see **where** a move is likely to continue or fail.
Together they reduce ambiguity: **context + level + effort** — all on one screen.
---
## How it works (plain language)
* **VWAP** resets each day and is calculated as the cumulative sum of typical price multiplied by volume divided by total volume.
* **Opening Range** is either automatic (a multiple of your chart timeframe) or a manual number of minutes. While it is forming, the highest high and lowest low are captured and plotted as the range.
* **Trend filter**
* **EMA Fast** and **EMA Slow** define directional bias.
* **ADX (optional)** adds “trend strength”: only when the Average Directional Index is above the chosen threshold do we treat the move as strong. You can source this from a higher timeframe.
* **Zones**
* There are **two independent pairs** of pivots at the same time (for example 10-left 10-right and 5-left 5-right).
* Each detected pivot creates a **Supply** (from a swing high) or **Demand** (from a swing low) box. Box depth = **zone depth × Average True Range** for adaptive sizing; the boxes **extend forward**.
* Midline (optional dashed line inside the box) is the “balance” of the zone.
* **“Only in trend”** mode can hide boxes that go against the higher-timeframe bias.
* The **touch counter** increases when price revisits the box. Labels show the pair name and the number of touches.
* **Bubbles**
* A safe **delta proxy** measures bar pressure (for example, range-weighted close vs open).
* A **quantile filter** shows only unusually large pressure: choose lookback and percentile, and the script draws a circle sized by intensity (green = bullish pressure, red = bearish).
* **Densities**
* The script marks heavy activity clusters as **subtle bands** around price (depth = fraction of Average True Range).
* If price **breaks** a density with volume above its moving average, the band **disappears** (“eaten”), which often precedes continuation.
---
## How to use — practical playbooks
> Recommended chart: crypto or index futures, one to five minutes. Use **one hour** or **fifteen minutes** for the higher-timeframe bias.
### 1) Trend pullback scalp (continuation)
1. Enable **Only in trend** zones.
2. In an uptrend: wait for a pullback into a **Demand** zone that overlaps with VWAP or sits just below the Opening Range midpoint.
3. Look for **green bubbles** near the zone’s bottom or a fresh **density** under price.
4. Enter on a candle closing **back above the zone midline**.
5. Stop-loss: below the bottom of the zone or a small multiple of Average True Range.
6. Targets: previous swing high, Opening Range high, fixed risk multiples, or VWAP.
Mirror the logic for downtrends using Supply zones, red bubbles and densities above price.
### 2) Reversion with liquidity sweep (fade)
1. Bias neutral or countertrend allowed.
2. Price **wicks through** a zone boundary (or an Opening Range line) and **closes back inside** the zone.
3. The bubble color often flips (absorption).
4. Enter toward the **inside** of the zone; stop beyond the sweep wick; first target = zone midline, second = opposite side of the zone or VWAP.
### 3) Opening Range break and retest
1. Wait for the Opening Range to complete.
2. A break with a large bubble suggests intent.
3. Look for a **retest** into a nearby zone aligned with VWAP.
4. Trade continuation toward the next zone or the session extremes.
### 4) Density “eaten” continuation
1. When a density band **disappears** on high volume, it often means the resting liquidity was consumed.
2. Trade in the direction of the break, toward the nearest opposing zone.
---
## Settings — quick guide
**Core**
* *ATR Length* — used for zone and density depths.
* *Show VWAP / Show Opening Range*.
* *Opening Range*: Auto (multiple of timeframe minutes) or Manual minutes.
**Trend Filter**
* *Mode*: Off, EMA only, or EMA with ADX strength.
* *Use higher timeframe* and its value.
* *EMA Fast / EMA Slow*, *ADX Length*, *ADX threshold*.
* *Plot EMA filter* to display the moving averages.
**Zones (two pairs)**
* *Pivot A Left / Right* and *Pivot B Left / Right*.
* *Zone depth × ATR*, *Extend bars*.
* *Show zone midline*, *Only in trend zones*.
* Labels automatically show the touch counters.
**Bubbles**
* *Show Bubbles*.
* *Quantile lookback* and *Quantile percent* (higher percent = stricter filter, fewer bubbles).
**Densities**
* *Metric*: absolute delta proxy or raw volume.
* *Quantile lookback / percent*.
* *Depth × ATR*, *Extend bars*, *Merge distance* (in ATR),
* *Break condition*: volume moving average length and multiplier,
* *Midline for densities* (optional dashed line).
---
## Tips and risk management
* This script **does not use external order-flow feeds**. Delta is a **proxy** suitable for TradingView; tune quantiles per symbol and timeframe.
* Do not trade every bubble. Combine **context (trend + VWAP + Opening Range)** with **level (zone)** and **effort (bubble/density)**.
* Set stop-losses beyond the zone or at a fraction of Average True Range. Predefine risk per trade.
* Backtest your rules with a strategy script before using real funds.
* Markets differ. Parameters that work on Bitcoin may not transfer to low-liquidity altcoins or stocks.
* Nothing here is financial advice. Scalping is high-risk; slippage and over-trading can quickly damage your account.
---
## What makes PRO Scalper unique
* Two **independent** zone engines run in parallel, so you can see both **larger structure** and **fine intraday levels** at the same time.
* Clean **“only in trend” rendering** — zones and midlines against the bias can be hidden, reducing clutter and hesitation.
* **Touch counters** convert “feel” into numbers.
* **Self-contained order-flow visuals** (bubbles and densities) that require no extra data sources.
* Careful defaults: subtle colors for densities, clearer zones, and responsive auto Opening Range.
---
(RU)
## Что это такое
**PRO Scalper** — это индикатор для внутридневной торговли, который показывает **контекст и ликвидность прямо сейчас**.
Он объединяет пять модулей, которыми профессиональные скальперы пользуются вместе:
1. **VWAP** — средневзвешенная по объему цена за сессию, «справедливая стоимость» дня.
2. **Opening Range** — первая часть сессии, задающая баланс дня.
3. **Фильтр тренда** — направление старшего таймфрейма по **экспоненциальным средним** и при желании по силе тренда **Average Directional Index**.
4. **Две независимые системы зон спроса/предложения** — зоны строятся от подтвержденных экстремумов (пивотов), имеют **среднюю линию** и **счетчик касаний**.
5. **Визуализация «ордер-флоу»**:
* **Пузыри дельты** (зеленые/красные круги) — места повышенного покупательного/продажного давления, рассчитанные через безопасный **прокси-дельты**.
* **Плотности ликвидности** (ненавязчивые прямоугольные ленты) — скопления объема, которые нередко притягивают цену или удерживают ее и исчезают, когда «разъедаются» сильным движением.
Итог — **полная картинка момента**: среднее (VWAP), баланс дня (Opening Range), старшая сила (фильтр тренда), ближайшие уровни топлива/тормозов (зоны), текущие точки усилия (пузыри и плотности).
---
## Почему именно эти элементы
* **VWAP** показывает, где сосредоточена стоимость; цена либо вращается вокруг него, либо быстро уходит — идеальный ориентир скальпера.
* **Opening Range** фиксирует ранний аукцион — от его границ часто начинаются пробои, возвраты и ретесты.
* **EMA + ADX** отделяют тренд от «пилы», позволяя оставлять на графике только зоны по направлению старшего таймфрейма.
* **Зоны от пивотов** просты, объективны и быстры; средняя линия помогает подтверждать разворот, счетчик касаний переводит субъективность в цифры.
* **Пузыри и плотности** добавляют слой «усилия»: где именно возник толчок и где сконцентрирована ликвидность.
Комбинация **контекста + уровня + усилия** уменьшает двусмысленность и ускоряет принятие решения.
---
## Как это работает (простыми словами)
* **VWAP** каждый день стартует заново: сумма «типичной цены × объем» делится на суммарный объем.
* **Opening Range** — автоматический (кратный минутам вашего таймфрейма) или вручную заданный период; пока он формируется, фиксируются максимум и минимум.
* **Фильтр тренда**
* Две экспоненциальные средние задают направление.
* **ADX** (по желанию) добавляет «силу». Источник можно взять со старшего таймфрейма.
* **Зоны**
* Одновременно работает **две пары** пивотов (например 10-лево 10-право и 5-лево 5-право).
* От пивота строится зона **предложения** (от максимума) или **спроса** (от минимума). Глубина зоны = **коэффициент × Average True Range**; зона тянется вперед.
* Внутри рисуется **средняя линия** (по желанию).
* Режим **«только по тренду»** скрывает зоны против старшего направления.
* **Счетчик касаний** увеличивается, когда цена снова входит в зону; подпись показывает пару и количество касаний.
* **Пузыри**
* Используется безопасный **прокси-дельты** — измерение «напряжения» внутри свечи.
* Через **квантильный фильтр** выводятся только необычно сильные места: настраиваются окно и процент квантиля; размер кружка — сила, цвет: зеленый покупатели, красный продавцы.
* **Плотности**
* Крупные активности отмечаются **ненавязчивыми прямоугольниками** (глубина — доля Average True Range).
* Если плотность **пробивается** объемом выше среднего, она **исчезает** — часто это предвещает продолжение.
---
## Как пользоваться — практические схемы
> Рекомендация: крипто или фьючерсы, таймфрейм 1–5 минут. Для старшего фильтра удобно взять **1 час** или **15 минут**.
### 1) Скальп на откат по тренду
1. Включите **«только по тренду»**.
2. В восходящем тренде дождитесь отката в **зону спроса**, желательно рядом с **VWAP** или серединой **Opening Range**.
3. Подтверждение — **зеленые пузыри** у нижней границы зоны или свежая **плотность** под ценой.
4. Вход после закрытия свечи **выше средней линии** зоны.
5. Стоп-лосс: за нижнюю границу зоны или небольшой множитель Average True Range.
6. Цели: предыдущий максимум, верх Opening Range, фиксированные R-множители, либо VWAP.
Для нисходящего тренда зеркально: зоны предложения, красные пузыри и плотности над ценой.
### 2) Контрдвижение с «выбиванием ликвидности»
1. Нейтральный или контртрендовый режим.
2. Цена **выносит хвостом** границу зоны (или линию Opening Range) и **закрывается обратно внутри**.
3. Цвет пузыря часто меняется (поглощение).
4. Вход внутрь зоны; стоп — за хвост выбивания; цели: средняя линия, противоположная граница зоны или VWAP.
### 3) Пробой Opening Range + ретест
1. Дождитесь завершения диапазона.
2. Сильный пробой с крупным пузырем — признак намерения.
3. Ищите **ретест** в зоне по тренду рядом с линией диапазона и VWAP.
4. Торгуйте продолжение к следующей зоне.
### 4) Продолжение после «съеденной» плотности
1. Когда прямоугольник плотности **исчезает** на повышенном объеме, это значит, что ликвидность поглощена.
2. Торгуйте в сторону пробоя к ближайшей противоположной зоне.
---
## Настройки — краткая шпаргалка
**Core**
— Длина Average True Range (для размеров зон и плотностей).
— Включение VWAP и Opening Range.
— Длина Opening Range: автоматическая (кратная минутам ТФ) или ручная.
**Trend Filter**
— Режим: выкл., только средние, либо средние + ADX.
— Источник со старшего таймфрейма и его значение.
— Длины средних, длина ADX и порог силы.
— Показать/скрыть линий средних.
**Zones (две пары одновременно)**
— Пара A: лев/прав; Пара B: лев/прав.
— Глубина зоны × Average True Range, продление по барам.
— Средняя линия, режим **«только по тренду»**.
— Подписи со счетчиком касаний.
**Bubbles**
— Вкл./выкл., окно поиска и процент квантиля (чем выше процент — тем реже пузыри).
**Densities**
— Метрика: абсолютная прокси-дельты или чистый объем.
— Окно/квантиль, глубина × Average True Range, продление,
— Порог объединения (в Average True Range),
— Условие «разъедания» по объему,
— Средняя линия плотности (по желанию).
---
## Советы и риски
* Индикатор **не использует внешние потоки ордер-флоу**. Дельта — **прокси**, подходящая для TradingView; подбирайте квантили под инструмент и таймфрейм.
* Не торгуйте каждый пузырь. Склейте **контекст (тренд + VWAP + Opening Range)** с **уровнем (зона)** и **усилием (пузырь/плотность)**.
* Стоп-лосс — за границей зоны или по Average True Range. Риск на сделку задавайте заранее.
* Перед реальными деньгами протестируйте правила в стратегии.
* Разные рынки ведут себя по-разному; настройки из Биткоина могут не подойти малоликвидным альткоинам или акциям.
* Это не инвестиционная рекомендация. Скальпинг — высокий риск; проскальзывание и переизбыток сделок быстро наносят ущерб капиталу.
---
## Чем уникален PRO Scalper
* Две **одновременные** системы зон показывают и **крупную структуру**, и **точные локальные уровни**.
* Режим **«только по тренду»** чистит экран от лишних уровней и ускоряет решение.
* **Счетчики касаний** дают количественную опору.
* **Самодостаточные визуализации усилия** (пузыри и плотности) — без сторонних источников данных.
* Аккуратная цветовая схема: плотности — мягко, зоны — ясно; Opening Range — адаптивный.
Пусть он станет вашей «картой местности» для быстрых и дисциплинированных решений внутри дня.
Cari dalam skrip untuk "adx"

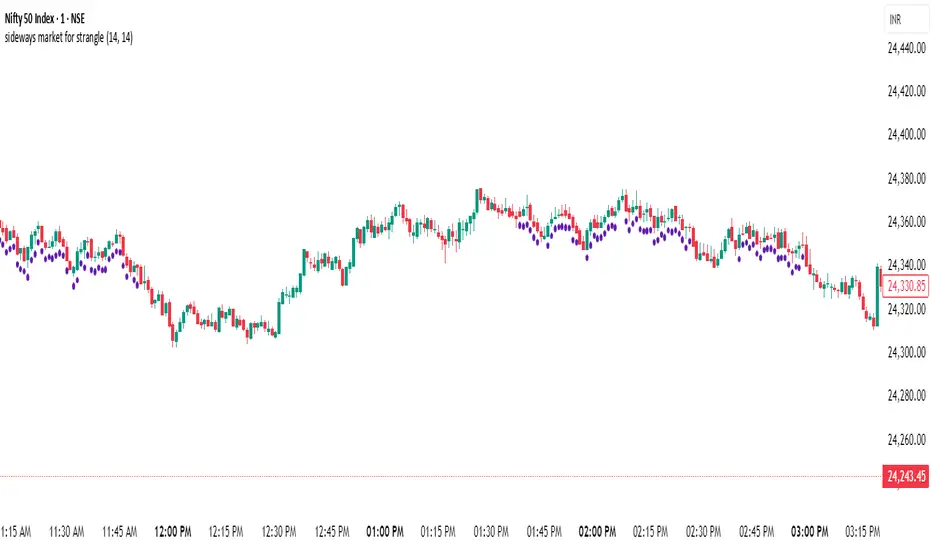
sideways market for strangleThis Pine Script is designed to identify **sideways or range-bound markets**, which are often ideal conditions for trading **options strangle strategies**. Here's a breakdown of what the script does:
---
### 🛠 **Purpose:**
To **detect low-volatility, sideways market conditions** where price is not trending strongly in either direction — suitable for **neutral options strategies like short strangles**.
---
### 📌 **Key Components:**
#### 1. **Inputs:**
- `RSI Length`: Default 14 — used for calculating the Relative Strength Index (RSI).
- `ADX Length`: Default 14 — used for calculating the Average Directional Index (ADX), DI+ (positive directional movement), and DI- (negative directional movement).
#### 2. **RSI Calculation:**
- `rsiValue` is calculated using the built-in `ta.rsi(close, rsiLength)`.
- A **sideways market** is expected when RSI is in the **40–60 range**, indicating lack of strong momentum.
#### 3. **ADX and Directional Indicators (DI+ and DI-):**
- `diPlus` and `diMinus` are calculated based on recent price movements and the True Range.
- `dx` (Directional Index) measures the strength of trend direction using the difference between DI+ and DI-.
- `adx` is a smoothed version of `dx` and represents **overall trend strength**.
#### 4. **Sideways Market Conditions:**
- **RSI Condition**: RSI is between 40 and 60.
- **ADX Condition**:
- `adx <= 25` → Weak or no trend.
- `adx < diPlus` and `adx < diMinus` → Confirms ADX is lower than directional components, reducing likelihood of a trending market.
#### 5. **Signal Plot:**
- A **green label below the bar** (`shape.labelup`) is plotted when both conditions are met.
- Indicates potential sideways market conditions.
---
### ✅ **Use Case:**
- This signal can help identify **low-volatility zones** suitable for **short strangles** or **iron condors**, where you profit from time decay while expecting the price to stay within a range.
Reversal Trading Bot Strategy[BullByte]Overview :
The indicator Reversal Trading Bot Strategy is crafted to capture potential market reversal points by combining momentum, volatility, and trend alignment filters. It uses a blend of technical indicators to identify both bullish and bearish reversal setups, ensuring that multiple market conditions are met before entering a trade.
Core Components :
Technical Indicators Used :
RSI (Relative Strength Index) :
Purpose : Detects divergence conditions by comparing recent lows/highs in price with the RSI.
Parameter : Length of 8.
Bollinger Bands (BB) :
Purpose : Measures volatility and identifies price levels that are statistically extreme.
Parameter : Length of 20 and a 2-standard deviation multiplier.
ADX (Average Directional Index) & DMI (Directional Movement Index) :
Purpose : Quantifies the strength of the trend. The ADX threshold is set at 20, and additional filters check for the alignment of the directional indicators (DI+ and DI–).
ATR (Average True Range) :
Purpose : Provides a volatility measure used to set stop levels and determine risk through trailing stops.
Volume SMA (Simple Moving Average of Volume ):
Purpose : Helps confirm strength by comparing the current volume against a 20-period average, with an optional filter to ensure volume is at least twice the SMA.
User-Defined Toggle Filters :
Volume Filter : Confirms that the volume is above average (or twice the SMA) before taking trades.
ADX Trend Alignment Filter : Checks that the ADX’s directional indicators support the trade direction.
BB Close Confirmation : Optionally refines the entry by requiring price to be beyond the upper or lower Bollinger Band rather than just above or below.
RSI Divergence Exit : Allows the script to close positions if RSI divergence is detected.
BB Mean Reversion Exit : Closes positions if the price reverts to the Bollinger Bands’ middle line.
Risk/Reward Filter : Ensures that the potential reward is at least twice the risk by comparing the distance to the Bollinger Band with the ATR.
Candle Movement Filter : Optional filter to require a minimum percentage move in the candle to confirm momentum.
ADX Trend Exit : Closes positions if the ADX falls below the threshold and the directional indicators reverse.
Entry Conditions :
Bullish Entry :
RSI Divergence : Checks if the current close is lower than a previous low while the RSI is above the previous low, suggesting bullish divergence.
Bollinger Confirmation : Requires that the price is above the lower (or upper if confirmation is toggled) Bollinger Band.
Volume & Trend Filters : Combines volume condition, ADX strength, and an optional candle momentum condition.
Risk/Reward Check : Validates that the trade meets a favorable risk-to-reward ratio.
Bearish Entry :
Uses a mirror logic of the bullish entry by checking for bearish divergence, ensuring the price is below the appropriate Bollinger level, and confirming volume, trend strength, candle pattern, and risk/reward criteria.
Trade Execution and Exit Strateg y:
Trade Execution :
Upon meeting the entry conditions, the strategy initiates a long or short position.
Stop Loss & Trailing Stops :
A stop-loss is dynamically set using the ATR value, and trailing stops are implemented as a percentage of the close price.
Exit Conditions :
Additional exit filters can trigger early closures based on RSI divergence, mean reversion (via the middle Bollinger Band), or a weakening trend as signaled by ADX falling below its threshold.
This multi-layered exit strategy is designed to lock in gains or minimize losses if the market begins to reverse unexpectedly.
How the Strategy Works in Different Market Conditions :
Trending Markets :
The ADX filter ensures that trades are only taken when the trend is strong. When the market is trending, the directional movement indicators help confirm the momentum, making the reversal signal more reliable.
Ranging Markets :
In choppy markets, the Bollinger Bands expand and contract, while the RSI divergence can highlight potential turning points. The optional filters can be adjusted to avoid false signals in low-volume or low-volatility conditions.
Volatility Management :
With ATR-based stop-losses and a risk/reward filter, the strategy adapts to current market volatility, ensuring that risk is managed consistently.
Recommendation on using this Strategy with a Trading Bot :
This strategy is well-suited for high-frequency trading (HFT) due to its ability to quickly identify reversal setups and execute trades dynamically with automated stop-loss and trailing exits. By integrating this script with a TradingView webhook-based bot or an API-driven execution system, traders can automate trade entries and exits in real-time, reducing manual execution delays and capitalizing on fast market movements.
Disclaimer :
This script is provided for educational and informational purposes only. It is not intended as investment advice. Trading involves significant risk, and you should always conduct your own research and analysis before making any trading decisions. The author is not responsible for any losses incurred while using this script.

HabibiTrades Pro System Strategy Overview
This strategy uses the following conditions:
WMA Crossover: To determine the direction of the market trend.
ADX: To confirm whether the trend is strong enough for trade.
Volume Spike: To validate the trade signal with increased market participation.
Let's break down each component and its role in the strategy.
1. WMA (Weighted Moving Average) Crossover:
The WMA is a type of moving average that gives more weight to recent prices. In this strategy, we use two WMAs:
Fast WMA (short period): Reacts quicker to price changes.
Slow WMA (long period): Reacts slower to price changes.
How it works:
Bullish Entry (Long): The Fast WMA crosses above the Slow WMA, indicating a potential upward price movement (bullish trend).
Bearish Entry (Short): The Fast WMA crosses below the Slow WMA, indicating a potential downward price movement (bearish trend).
2. ADX (Average Directional Index):
The ADX measures the strength of a trend, regardless of whether the trend is up or down.
How it works:
ADX > 20: Indicates a strong trend (either bullish or bearish). This is the threshold for considering a trade.
ADX > 30: Indicates an even stronger trend and is used to indicate high confidence in the trend direction.
3. Volume Spike:
Volume is an important indicator that tells you how much trading activity is happening in the market. A volume spike occurs when the current volume is significantly higher than the average volume over a specified period.
How it works:
Volume Spike Condition: The current volume is compared to the average volume (SMA). If the current volume is greater than the Volume SMA multiplied by the Volume Multiplier, a volume spike is detected.
Volume spikes are used to validate the strength of the trend and increase the likelihood that the trade signal is meaningful.
Strategy Logic
Long Entry Conditions (Buy Signal):
WMA Crossover: The Fast WMA crosses above the Slow WMA (bullish signal).
ADX: The ADX is above 20 (indicating a strong trend).
Volume Spike: The current volume is higher than the Volume SMA multiplied by the Volume Multiplier, confirming market participation.
Short Entry Conditions (Sell Signal):
WMA Crossover: The Fast WMA crosses below the Slow WMA (bearish signal).
ADX: The ADX is above 20 (indicating a strong trend).
Volume Spike: The current volume is higher than the Volume SMA multiplied by the Volume Multiplier, confirming market participation.
Exit Conditions:
Trailing Stop: A trailing stop is used based on the highest price for long trades or the lowest price for short trades since the entry. The position is exited when the price moves against the trade by a set amount (in ticks).

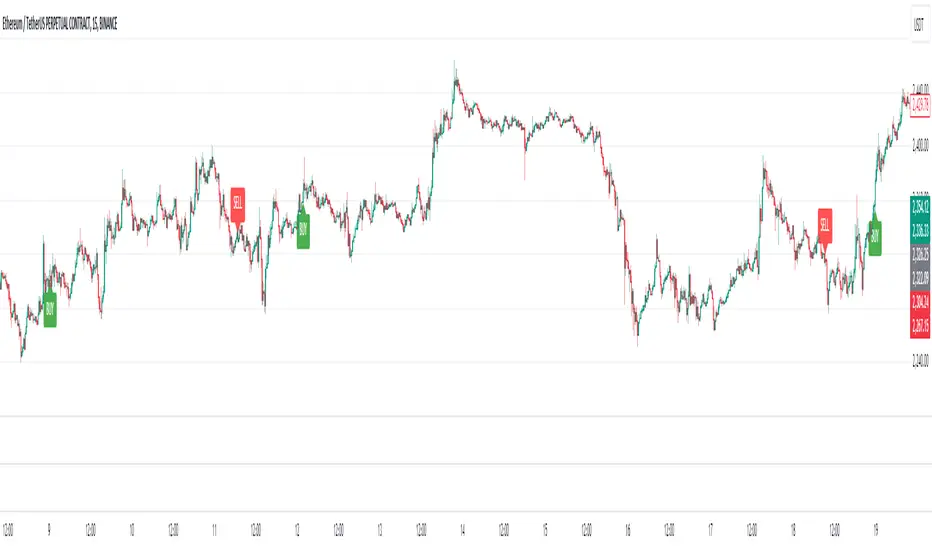
BRT Signals Buy / Sell v2Title: BRT Signals Buy/Sell v2
Description:
The BRT Signals Buy/Sell v2 script is an innovative and original trading indicator designed to generate precise buy and sell signals by uniquely combining several advanced technical analysis tools. This script introduces new methodologies not found in existing public scripts, offering traders enhanced accuracy and customization.
Key Original Features:
Proprietary Mean Reversion Channel (MRC) Oscillator:
Unlike traditional oscillators, our MRC oscillator is developed using a customized SuperSmoother function, transforming the mean reversion concept into a dynamic oscillator ranging from 0 to 100.
This unique approach allows for more responsive detection of overbought and oversold conditions, setting it apart from standard oscillators.
Advanced Moving Average Options with Jurik Moving Average (JMA):
Incorporates the Jurik Moving Average (JMA), an advanced MA that offers low lag and high smoothness, which is rarely included in public scripts due to its complexity.
Provides multiple MA types (EMA, SMA, RMA, VWMA, WMA, Wilders MA, JMA) for unparalleled customization, enabling traders to fine-tune the indicator to their specific strategies.
Enhanced ADX Trend Strength Filter:
Integrates a custom implementation of the Average Directional Index (ADX) with proprietary modifications to measure trend strength more accurately.
Our script's ADX filter reduces lag and improves the detection of strong trends, a feature not commonly available in other indicators.
Dual Signal Sensitivity Filters:
Introduces two types of signal sensitivity filters (Signal Sensitivity Type 1 and Type 2) that can be independently enabled or disabled.
This dual-filter system is a novel feature that allows for refined control over signal generation, enhancing the script's adaptability.
Sophisticated Labeling and Alert System:
Features a customizable labeling system with various styles and sizes, providing clear and immediate visual cues on the chart.
Includes meticulously configured alert conditions that work seamlessly with the script's unique logic, ensuring timely notifications.
How It Works:
Buy Signal:
Generated when the proprietary MRC oscillator value increases compared to its previous value, indicating upward momentum detected by our unique algorithm.
Price is above the selected moving average (if the EMA filter is enabled), confirming a bullish trend with enhanced precision due to the advanced MA options.
ADX conditions are met using our improved calculation method, ensuring signals occur only during strong uptrends.
Sell Signal:
Triggered when the MRC oscillator value decreases compared to its previous value, signaling downward momentum identified by our custom oscillator.
Price is below the selected moving average (if the EMA filter is enabled), confirming a bearish trend with greater accuracy.
ADX conditions are met, indicating strong downtrends, thanks to our proprietary enhancements to the ADX indicator.
Original Concepts and Calculations:
Customized SuperSmoother Filter: Our version of the SuperSmoother filter is tailored to work specifically with the MRC oscillator, providing smoother and more responsive signals than standard implementations.
Proprietary ADX Enhancements: We have modified the traditional ADX formula to better capture trend strength and direction, reducing lag and improving reliability in various market conditions.
Integration of Advanced Indicators: The script uniquely combines advanced indicators like JMA and our custom MRC oscillator, offering functionalities not found in other public scripts.
Usage Instructions:
Parameter Configuration:
Lookback Period: Adjusts the sensitivity of the Mean Reversion Channel to suit different market conditions.
Timeframe Selection: Analyze different timeframes independent of the chart's timeframe for multi-timeframe analysis.
MA Length and Type: Choose from various moving averages, including the advanced JMA, to align with your trading preferences.
Signal Sensitivity Filters: Enable or disable the EMA and ADX filters to refine signal accuracy based on your strategy.
Visual Aids and Alerts:
Customize label styles and sizes for optimal visualization on the chart.
Set up alerts using the built-in alert conditions to receive real-time notifications aligned with the script's unique logic.
Benefits of Originality:
Enhanced Signal Accuracy: The unique combination of advanced indicators and proprietary calculations reduces false signals, improving the quality of trading decisions.
High Adaptability: The script's extensive customization options allow it to be adapted to various assets, timeframes, and trading styles, making it suitable for a wide range of traders.
Unique Analytical Approach: By introducing new methodologies and integrating advanced technical tools in a novel way, this script provides traders with insights not available in other indicators.
Disclaimer:
This indicator is a unique tool developed to assist traders in making informed decisions. It should be used in conjunction with other analysis methods and does not guarantee profitable results. Always practice proper risk management and due diligence.
Trend Momentum Strength Indicator, Built for Pairs TradingOverview:
This script combines multiple indicators to provide a comprehensive analysis of both trend strength and trend momentum. It is tailored specifically for pairs trading strategies but can also be used for other trading strategies.
Benefit of Comprehensive Analysis:
Having an indicator that evaluates both trend strength and trend momentum is crucial for traders looking to make informed decisions. It allows traders to not only identify the direction and intensity of a trend but also gauge the momentum behind it. This dual capability helps in confirming potential trade opportunities, whether for entering trades with strong trends or considering reversals during overbought or oversold conditions. By integrating both aspects into one tool, traders can gain a holistic view of market dynamics, enhancing their ability to time entries and manage risk effectively.
Features:
* Trend Strength:
Enhanced ADX Formula: The script includes modifications to the standard ADX formula along with DI+ and DI- to provide more responsive trend strength readings.
Directional Indicators: DI+ (green line) indicates positive directional movement, while DI- (red line) indicates negative directional movement.
Trend Momentum:
Modified Stochastic Indicators: The script uses %K and %D indicators, modified and combined with ADX to give a clear indication of trend momentum.
Momentum Strength: This helps determine the strength and direction of the momentum.
Trading Signals:
Combining Indicators: The script combines ADX, DI+, DI-, %K, and %D to generate comprehensive trading signals.
Optimal Entry Points: Designed to identify optimal entry points for trades, particularly in pairs trading.
Colored Area at Bottom:
This area provides two easy-to-read functions:
Color:
Green: Upward momentum (ratio above 1)
Red: Downward momentum (ratio below 1)
Height:
Higher in green: Stronger upward momentum
Lower in red: Stronger downward momentum
Legend:
Green Line: DI+ (Positive)
Red Line: DI- (Negative)
Black Line: ADX
How to Read This Indicator:
1) Trend Direction:
DI+ above DI-: Indicates an upward trend.
DI- above DI+: Indicates a downward trend.
2) Trend Strength:
ADX below 20: Indicates a neutral trend.
ADX between 20 and 25: Indicates a weak trend.
ADX above 25: Indicates a strong trend.
Trading Signals in Pairs Trading:
Neutral Trend: Ideal for pairs trading when no strong trend is detected.
Overbought/Oversold: Uses %K and %D to identify overbought/oversold conditions that support trade decisions.
Entry Signals: Green signals for long positions, red signals for short positions, based on combined criteria of neutral trend strength and supportive momentum.
Application in Pairs Trading:
Neutral trend: In pairs trading strategies, where neutral movement is often sought, this indicator provides signals that are especially relevant during periods of neutral trend strength and supportive momentum, aiding traders in identifying optimal entry
Risk Management: Combining signals from ADX, DI+, DI-, %K, and %D helps traders make more informed decisions regarding entry points, enhancing risk management.
Example Chart (The indicator is on the upper right corner):
Clean Presentation: The chart only includes the necessary elements to demonstrate the indicator’s functionality.
Demonstrates: Overbought/oversold conditions, upward/downward/no momentum, and trading signals with/without specific scenarios.

AI SuperTrend x Pivot Percentile - Strategy [PresentTrading]█ Introduction and How it is Different
The AI SuperTrend x Pivot Percentile strategy is a sophisticated trading approach that integrates AI-driven analysis with traditional technical indicators. Combining the AI SuperTrend with the Pivot Percentile strategy highlights several key advantages:
1. Enhanced Accuracy in Trend Prediction: The AI SuperTrend utilizes K-Nearest Neighbors (KNN) algorithm for trend prediction, improving accuracy by considering historical data patterns. This is complemented by the Pivot Percentile analysis which provides additional context on trend strength.
2. Comprehensive Market Analysis: The integration offers a multi-faceted approach to market analysis, combining AI insights with traditional technical indicators. This dual approach captures a broader range of market dynamics.
BTC 6H L/S Performance
Local
█ Strategy: How it Works - Detailed Explanation
🔶 AI-Enhanced SuperTrend Indicators
1. SuperTrend Calculation:
- The SuperTrend indicator is calculated using a moving average and the Average True Range (ATR). The basic formula is:
- Upper Band = Moving Average + (Multiplier × ATR)
- Lower Band = Moving Average - (Multiplier × ATR)
- The moving average type (SMA, EMA, WMA, RMA, VWMA) and the length of the moving average and ATR are adjustable parameters.
- The direction of the trend is determined based on the position of the closing price in relation to these bands.
2. AI Integration with K-Nearest Neighbors (KNN):
- The KNN algorithm is applied to predict trend direction. It uses historical price data and SuperTrend values to classify the current trend as bullish or bearish.
- The algorithm calculates the 'distance' between the current data point and historical points. The 'k' nearest data points (neighbors) are identified based on this distance.
- A weighted average of these neighbors' trends (bullish or bearish) is calculated to predict the current trend.
For more please check: Multi-TF AI SuperTrend with ADX - Strategy
🔶 Pivot Percentile Analysis
1. Percentile Calculation:
- This involves calculating the percentile ranks for high and low prices over a set of predefined lengths.
- The percentile function is typically defined as:
- Percentile = Value at (P/100) × (N + 1)th position
- Where P is the desired percentile, and N is the number of data points.
2. Trend Strength Evaluation:
- The calculated percentiles for highs and lows are used to determine the strength of bullish and bearish trends.
- For instance, a high percentile rank in the high prices may indicate a strong bullish trend, and vice versa for bearish trends.
For more please check: Pivot Percentile Trend - Strategy
🔶 Strategy Integration
1. Combining SuperTrend and Pivot Percentile:
- The strategy synthesizes the insights from both AI-enhanced SuperTrend and Pivot Percentile analysis.
- It compares the trend direction indicated by the SuperTrend with the strength of the trend as suggested by the Pivot Percentile analysis.
2. Signal Generation:
- A trading signal is generated when both the AI-enhanced SuperTrend and the Pivot Percentile analysis agree on the trend direction.
- For instance, a bullish signal is generated when both the SuperTrend is bullish, and the Pivot Percentile analysis shows strength in bullish trends.
🔶 Risk Management and Filters
- ADX and DMI Filter: The strategy uses the Average Directional Index (ADX) and the Directional Movement Index (DMI) as filters to assess the trend's strength and direction.
- Dynamic Trailing Stop Loss: Based on the SuperTrend indicator, the strategy dynamically adjusts stop-loss levels to manage risk effectively.
This strategy stands out for its ability to combine real-time AI analysis with established technical indicators, offering traders a nuanced and responsive tool for navigating complex market conditions. The equations and algorithms involved are pivotal in accurately identifying market trends and potential trade opportunities.
█ Usage
To effectively use this strategy, traders should:
1. Understand the AI and Pivot Percentile Indicators: A clear grasp of how these indicators work will enable traders to make informed decisions.
2. Interpret the Signals Accurately: The strategy provides bullish, bearish, and neutral signals. Traders should align these signals with their market analysis and trading goals.
3. Monitor Market Conditions: Given that this strategy is sensitive to market dynamics, continuous monitoring is crucial for timely decision-making.
4. Adjust Settings as Needed: Traders should feel free to tweak the input parameters to suit their trading preferences and to respond to changing market conditions.
█Default Settings and Their Impact on Performance
1. Trading Direction (Default: "Both")
Effect: Determines whether the strategy will take long positions, short positions, or both. Adjusting this setting can align the strategy with the trader's market outlook or risk preference.
2. AI Settings (Neighbors: 3, Data Points: 24)
Neighbors: The number of nearest neighbors in the KNN algorithm. A higher number might smooth out noise but could miss subtle, recent changes. A lower number makes the model more sensitive to recent data but may increase noise.
Data Points: Defines the amount of historical data considered. More data points provide a broader context but may dilute recent trends' impact.
3. SuperTrend Settings (Length: 10, Factor: 3.0, MA Source: "WMA")
Length: Affects the sensitivity of the SuperTrend indicator. A longer length results in a smoother, less sensitive indicator, ideal for long-term trends.
Factor: Determines the bandwidth of the SuperTrend. A higher factor creates wider bands, capturing larger price movements but potentially missing short-term signals.
MA Source: The type of moving average used (e.g., WMA - Weighted Moving Average). Different MA types can affect the trend indicator's responsiveness and smoothness.
4. AI Trend Prediction Settings (Price Trend: 10, Prediction Trend: 80)
Price Trend and Prediction Trend Lengths: These settings define the lengths of weighted moving averages for price and SuperTrend, impacting the responsiveness and smoothness of the AI's trend predictions.
5. Pivot Percentile Settings (Length: 10)
Length: Influences the calculation of pivot percentiles. A shorter length makes the percentile more responsive to recent price changes, while a longer length offers a broader view of price trends.
6. ADX and DMI Settings (ADX Length: 14, Time Frame: 'D')
ADX Length: Defines the period for the Average Directional Index calculation. A longer period results in a smoother ADX line.
Time Frame: Sets the time frame for the ADX and DMI calculations, affecting the sensitivity to market changes.
7. Commission, Slippage, and Initial Capital
These settings relate to transaction costs and initial investment, directly impacting net profitability and strategy feasibility.

Machine Learning: Lorentzian Classification█ OVERVIEW
A Lorentzian Distance Classifier (LDC) is a Machine Learning classification algorithm capable of categorizing historical data from a multi-dimensional feature space. This indicator demonstrates how Lorentzian Classification can also be used to predict the direction of future price movements when used as the distance metric for a novel implementation of an Approximate Nearest Neighbors (ANN) algorithm.
█ BACKGROUND
In physics, Lorentzian space is perhaps best known for its role in describing the curvature of space-time in Einstein's theory of General Relativity (2). Interestingly, however, this abstract concept from theoretical physics also has tangible real-world applications in trading.
Recently, it was hypothesized that Lorentzian space was also well-suited for analyzing time-series data (4), (5). This hypothesis has been supported by several empirical studies that demonstrate that Lorentzian distance is more robust to outliers and noise than the more commonly used Euclidean distance (1), (3), (6). Furthermore, Lorentzian distance was also shown to outperform dozens of other highly regarded distance metrics, including Manhattan distance, Bhattacharyya similarity, and Cosine similarity (1), (3). Outside of Dynamic Time Warping based approaches, which are unfortunately too computationally intensive for PineScript at this time, the Lorentzian Distance metric consistently scores the highest mean accuracy over a wide variety of time series data sets (1).
Euclidean distance is commonly used as the default distance metric for NN-based search algorithms, but it may not always be the best choice when dealing with financial market data. This is because financial market data can be significantly impacted by proximity to major world events such as FOMC Meetings and Black Swan events. This event-based distortion of market data can be framed as similar to the gravitational warping caused by a massive object on the space-time continuum. For financial markets, the analogous continuum that experiences warping can be referred to as "price-time".
Below is a side-by-side comparison of how neighborhoods of similar historical points appear in three-dimensional Euclidean Space and Lorentzian Space:
This figure demonstrates how Lorentzian space can better accommodate the warping of price-time since the Lorentzian distance function compresses the Euclidean neighborhood in such a way that the new neighborhood distribution in Lorentzian space tends to cluster around each of the major feature axes in addition to the origin itself. This means that, even though some nearest neighbors will be the same regardless of the distance metric used, Lorentzian space will also allow for the consideration of historical points that would otherwise never be considered with a Euclidean distance metric.
Intuitively, the advantage inherent in the Lorentzian distance metric makes sense. For example, it is logical that the price action that occurs in the hours after Chairman Powell finishes delivering a speech would resemble at least some of the previous times when he finished delivering a speech. This may be true regardless of other factors, such as whether or not the market was overbought or oversold at the time or if the macro conditions were more bullish or bearish overall. These historical reference points are extremely valuable for predictive models, yet the Euclidean distance metric would miss these neighbors entirely, often in favor of irrelevant data points from the day before the event. By using Lorentzian distance as a metric, the ML model is instead able to consider the warping of price-time caused by the event and, ultimately, transcend the temporal bias imposed on it by the time series.
For more information on the implementation details of the Approximate Nearest Neighbors (ANN) algorithm used in this indicator, please refer to the detailed comments in the source code.
█ HOW TO USE
Below is an explanatory breakdown of the different parts of this indicator as it appears in the interface:
Below is an explanation of the different settings for this indicator:
General Settings:
Source - This has a default value of "hlc3" and is used to control the input data source.
Neighbors Count - This has a default value of 8, a minimum value of 1, a maximum value of 100, and a step of 1. It is used to control the number of neighbors to consider.
Max Bars Back - This has a default value of 2000.
Feature Count - This has a default value of 5, a minimum value of 2, and a maximum value of 5. It controls the number of features to use for ML predictions.
Color Compression - This has a default value of 1, a minimum value of 1, and a maximum value of 10. It is used to control the compression factor for adjusting the intensity of the color scale.
Show Exits - This has a default value of false. It controls whether to show the exit threshold on the chart.
Use Dynamic Exits - This has a default value of false. It is used to control whether to attempt to let profits ride by dynamically adjusting the exit threshold based on kernel regression.
Feature Engineering Settings:
Note: The Feature Engineering section is for fine-tuning the features used for ML predictions. The default values are optimized for the 4H to 12H timeframes for most charts, but they should also work reasonably well for other timeframes. By default, the model can support features that accept two parameters (Parameter A and Parameter B, respectively). Even though there are only 4 features provided by default, the same feature with different settings counts as two separate features. If the feature only accepts one parameter, then the second parameter will default to EMA-based smoothing with a default value of 1. These features represent the most effective combination I have encountered in my testing, but additional features may be added as additional options in the future.
Feature 1 - This has a default value of "RSI" and options are: "RSI", "WT", "CCI", "ADX".
Feature 2 - This has a default value of "WT" and options are: "RSI", "WT", "CCI", "ADX".
Feature 3 - This has a default value of "CCI" and options are: "RSI", "WT", "CCI", "ADX".
Feature 4 - This has a default value of "ADX" and options are: "RSI", "WT", "CCI", "ADX".
Feature 5 - This has a default value of "RSI" and options are: "RSI", "WT", "CCI", "ADX".
Filters Settings:
Use Volatility Filter - This has a default value of true. It is used to control whether to use the volatility filter.
Use Regime Filter - This has a default value of true. It is used to control whether to use the trend detection filter.
Use ADX Filter - This has a default value of false. It is used to control whether to use the ADX filter.
Regime Threshold - This has a default value of -0.1, a minimum value of -10, a maximum value of 10, and a step of 0.1. It is used to control the Regime Detection filter for detecting Trending/Ranging markets.
ADX Threshold - This has a default value of 20, a minimum value of 0, a maximum value of 100, and a step of 1. It is used to control the threshold for detecting Trending/Ranging markets.
Kernel Regression Settings:
Trade with Kernel - This has a default value of true. It is used to control whether to trade with the kernel.
Show Kernel Estimate - This has a default value of true. It is used to control whether to show the kernel estimate.
Lookback Window - This has a default value of 8 and a minimum value of 3. It is used to control the number of bars used for the estimation. Recommended range: 3-50
Relative Weighting - This has a default value of 8 and a step size of 0.25. It is used to control the relative weighting of time frames. Recommended range: 0.25-25
Start Regression at Bar - This has a default value of 25. It is used to control the bar index on which to start regression. Recommended range: 0-25
Display Settings:
Show Bar Colors - This has a default value of true. It is used to control whether to show the bar colors.
Show Bar Prediction Values - This has a default value of true. It controls whether to show the ML model's evaluation of each bar as an integer.
Use ATR Offset - This has a default value of false. It controls whether to use the ATR offset instead of the bar prediction offset.
Bar Prediction Offset - This has a default value of 0 and a minimum value of 0. It is used to control the offset of the bar predictions as a percentage from the bar high or close.
Backtesting Settings:
Show Backtest Results - This has a default value of true. It is used to control whether to display the win rate of the given configuration.
█ WORKS CITED
(1) R. Giusti and G. E. A. P. A. Batista, "An Empirical Comparison of Dissimilarity Measures for Time Series Classification," 2013 Brazilian Conference on Intelligent Systems, Oct. 2013, DOI: 10.1109/bracis.2013.22.
(2) Y. Kerimbekov, H. Ş. Bilge, and H. H. Uğurlu, "The use of Lorentzian distance metric in classification problems," Pattern Recognition Letters, vol. 84, 170–176, Dec. 2016, DOI: 10.1016/j.patrec.2016.09.006.
(3) A. Bagnall, A. Bostrom, J. Large, and J. Lines, "The Great Time Series Classification Bake Off: An Experimental Evaluation of Recently Proposed Algorithms." ResearchGate, Feb. 04, 2016.
(4) H. Ş. Bilge, Yerzhan Kerimbekov, and Hasan Hüseyin Uğurlu, "A new classification method by using Lorentzian distance metric," ResearchGate, Sep. 02, 2015.
(5) Y. Kerimbekov and H. Şakir Bilge, "Lorentzian Distance Classifier for Multiple Features," Proceedings of the 6th International Conference on Pattern Recognition Applications and Methods, 2017, DOI: 10.5220/0006197004930501.
(6) V. Surya Prasath et al., "Effects of Distance Measure Choice on KNN Classifier Performance - A Review." .
█ ACKNOWLEDGEMENTS
@veryfid - For many invaluable insights, discussions, and advice that helped to shape this project.
@capissimo - For open sourcing his interesting ideas regarding various KNN implementations in PineScript, several of which helped inspire my original undertaking of this project.
@RikkiTavi - For many invaluable physics-related conversations and for his helping me develop a mechanism for visualizing various distance algorithms in 3D using JavaScript
@jlaurel - For invaluable literature recommendations that helped me to understand the underlying subject matter of this project.
@annutara - For help in beta-testing this indicator and for sharing many helpful ideas and insights early on in its development.
@jasontaylor7 - For helping to beta-test this indicator and for many helpful conversations that helped to shape my backtesting workflow
@meddymarkusvanhala - For helping to beta-test this indicator
@dlbnext - For incredibly detailed backtesting testing of this indicator and for sharing numerous ideas on how the user experience could be improved.

Standard Error of the Estimate -Jon Andersen- V2Original implementation idea of bands by:
Traders issue: Stocks & Commodities V. 14:9 (375-379):
Standard Error Bands by Jon Andersen
Standard Error Bands are quite different than Bollinger's.
First, they are bands constructed around a linear regression curve.
Second, the bands are based on two standard errors above and below this regression line.
The error bands measure the standard error of the estimate around the linear regression line.
Therefore, as a price series follows the course of the regression line the bands will narrow , showing little error in the estimate. As the market gets noisy and random, the error will be greater resulting in wider bands .
Thanks to the work of @glaz & @XeL_arjona
In this version you can change the type of moving averages and the source of the bands.
Add a few studies of @dgtrd
1- ADX Colored Directional Movement Line
Directional Movement (DMI) (created by J. Welles Wilder ) consists of the Average Directional Index ( ADX ), to define whether or not there is a trend present, and Plus Directional Indicator (+D I) and Minus Directional Indicator (-D I) serve the purpose of determining trend direction
ADX Colored Directional Movement Line is custom interpretation of Directional Movement (DMI) with aim to present all 3 DMI indicator components with SINGLE line and ability to be added on top of the price chart (main chart)
How to interpret :
* triangle shapes:
▲- bullish : diplus >= diminus
▼- bearish : diplus < diminus
* colors:
green - bullish trend : adx >= strongTrend and di+ > di-
red - bearish trend : adx >= strongTrend and di+ < di-
gray - no trend : weekTrend < adx < strongTrend
yellow - week trend : adx < weekTrend
* color density:
darker : adx growing
lighter : adx falling
2- Volatility Colored Price/MA Line
Custom interpretation of the idea “Prices high above the moving average (MA) or low below it are likely to be remedied in the future by a reverse price movement”. Further details can be found under study “Price Distance to its MA by DGT”
How to interpret :
-▲ – Bullish , Price Action above Moving Average
-▼ – Bearish , Price Action below Moving Average
-Gray/Black - Low Volatility
-Green/Red – Price Action in Threshold Bands
-Dark Green/Red – Price Action Exceeds Threshold Bands
3- Volume Weighted Bar s
Volume Weighted Bars, a study of Kıvanç Özbilgiç, aims to present whether volume supports price movements. Volume Weighted Bars are calculated based on volume moving average.
How to interpret :
-Volume high above the volume moving average be displayed with red/green colors
-Average volume values will remain as they are and
-Volume low below the volume moving average will be indicated with darker colors
4- Fear & Greed index value, using technical anlysis approach calculated based on :
⮩1 - Price Momentum : Price Distance to its Moving Average
⮩2 - Strenght : Rate of Return, price movement over a period of time
⮩3 - Money Flow : Chaikin Money Flow, quantify changes in buying and selling pressure. CMF calculations is based on Accumulation/Distribution
⮩4 - Market Volatility : CBOE Volatility Index ( VIX ), the Volatility Index, or VIX , is a real-time market index that represents the market's expectation. It provides a measure of market risk and investors' sentiments
⮩5 -Safe Haven Demand: in this study GOLD demand is assumed
Fishing with SignalsFishing with Signals
HOW DOES IT WORK?
Fishing with Signals comprises of 3 indicators
1) Buy / Sell Signals
2) Band for Trend Recognition
3) ADX-DI Trend Identifier
Indicator 1 == Buy / Sell Signals
The signals are based on moving average exponential rectified by the previous high and low break at any real-time, it recognises the previous specified moving average deviation. If the predefined high and lows are broken along with current candle is closed below the specific moving average then sell is given and vice-versa for buy. The settings are not editable.
Indicator 2 == Band for Trend Recognition
The band comprises of 200 moving average with exponentially smoothening feature, there are three lines one can identify the trend if candles are below or above the band
Indicator 3 == ADX-DI Trend Identifier
The indicator gives a multiplication of ADX and the DI+ and DI-values, colour coded for bullish or bearish momentum and shows general market direction and divergence in a simpler visual way than the normal ADX-DI lines, a threshold value cannot be edited. The indicator is plotted relative to the 200 ema and can be seen as a "buffer" against price reversal. The ADX is used to indicate market direction, the existence or nonexistence of a trend and market momentum. Market direction is determined by the levels of the +DI and -DI. The ADX indicator, which varies in value from zero to 100, is the primary momentum indicator, default value is kept at +40 and -40. If the ADX is lowering or rising the DI line plotted will be moving as directed with change in colour and background filling. The Line hovering below and above the "buffer" is changing the colour with rising as navy and falling as maroon with intermittent colour of red and lime which also shows reversal.
HOW TO use the indicator?
For SHORT ==If the candles are below the Band for Trend Recognition and ADX-DI Trend Identifier is lowering and if the SELL SIGNAL comes one can go short with stop-loss be the close above top band and with momentum be positive.
For LONG == If the candles are above the Band for Trend Recognition and ADX-DI Trend Identifier is growing and if the BUY SIGNAL comes one can go Long with stop-loss be the close below lower band and with momentum be negative.
CAUTION!! : There will be false buy / sell signals also, where user have to verify with the other two indicators, for confirmation.
TARGET in any call = If the trend is up and buy signal comes then target may be trailed till next signal or close below band and vice versa for sell side.
USER OPTIONS : Choice of turning on / off the three indicators.
VISUAL CHECKS - The user could manually validate the back test results on various assets they would like to use this strategy on before putting it live.
USAGE MARKETS : Index Trading / Equities and also well with Commodities and Currencies.
TIME FRAME : Timeframe maybe any and as the user likes, still it works well with 5 min for less signals.
SETTING THE ALERTS : - Buy and Sell Signal alerts are advisable.
HOW TO GET ACCESS
Please click on the link / email available in the signature or send me a private message to get access.
FEEDBACK
Please click on the link/email in the signature or send me a private message for suggestions/feedbacks.
DISCLAIMER.
I AM NOT A FINANCIAL ADVISOR. THESE IDEAS ARE NOT ADVICE AND ARE FOR EDUCATION PURPOSES ONLY. ALWAYS DO YOUR OWN RESEARCH!
Utmost Care is taken to implement the suggestions of users and also tried to keep the chart neat and clean.
Greetings!!
Drop a mail to edgineer@yahoo.com or Drop a personal message for access.
Questions, Help, Discussion -> Telegram: Telegram: @miteysh

Estrategia de Monitor - RSI/EMAThis indicator, competes the signals of two of the most important and reliable indicators for monitoring price trends, the Squeeze Monitor and the RSI.
For a better visualization of the relationship of the indicators with the price, the Squeeze Monitor is presented in colored bars that represent the trend of the indicator. The RSI is combined with the EMA of the RSI that supports its directionality.
As additional support for decision making, the ADX is also plotted, as an element to project the force of the next movement.
The indicator settings are presented in the configuration of the indicator. The following parameters can be adjusted there:
** Monitor Parameters **
Monitor Length Squeeze -> "Long. Monitor"
** ADX parameters **
ADX Longitug -> "Long. ADX"
ADX Smoother -> "Suavizador ADX"
ADX Variation Factor -> "Factor Var. ADX"
This parameter defines the minimum variation for the
ADX address highlighting
** RSI parameters **
RSI Length -> "Long. RSI"
RSI Smoothing -> "Suavizador RSI"
RSI EMA Length -> "Long. EMA del RSI"
Finally, the Script consolidates the information, based on the trends of the indicators, and changes the color of the candle body. The color code considers Green for the uptrend, Red for the Downtrend and Yellow in transition processes (not operable).

Kilted Strength Meter v2.0KILTED STRENGTH METER v2.0
Description: Uses the Average Directional Index (ADX) standard values however observes the following strategy, to assist with trade setups and providing confluence:
SETTINGS AND EXPLANATION
1. There is an entry line to identify a trend entering mode which is the setting "ADX Entry", for which a trade is being setup and preset at 20 as a good entry point default
2. There is an exit line to identify when the trend is ending which is the setting "ADX Exit", for which an existing trade should be reviewed for taking profit for when the bull(blue line) or bear(red line) crosses this line
3. When the signal line is below 20 (thick white line) then we are moving sideways and don't want to trade
4. When we cross the ADX entry Line we determine if it's an uptrend (using blue line also above ADX entry), or downtrend (using red above ADX entry). When this event occurs we paint a small white dot to signal a setup may be presenting for setup
TRADE STRATEGY SETUPS
1. The LARGE dots only appear when a BUY or SELL signals presents itself which is when the ADX is combined with the RSI indicator which is outlined below
2. The small dots only appear when a BUY or SELL presents a trade entry to be used with confirmation with other strategies, as a tool for confluence
BUY :
1. we have a small white dot with a large BLUE dot (ADX showing an uptrend and we have an overbought RSI reading which is exactly what we want, which is buyers stepping in pushing the RSI over the 70 level which is what we use for confluence)
SELL :
1. we have small white dot with a LARGE RED dot (ADX showing a down trend and we have an oversold RSI reading which is exactly what we want which is sellers stepping in pushing the RSI below the 30 level which is what we use for confluence)
ALERTS
- BUY AND SELL alerts are coded into the indicator so that you don't need to stare at charts and can receive an alert once the BUY and SELL dots are triggered.
- EXIT alerts are also code into the indicator so that you can be notified when a trend has run and is now seeing exhaustion and look to go in the opposite direction. Remember EVERYBODY talks about finding great entries and signals but don’t mention when is a good time to get out which should be part of all good strategies.

Market Regime# MARKET REGIME IDENTIFICATION & TRADING SYSTEM
## Complete User Guide
---
## 📋 TABLE OF CONTENTS
1. (#overview)
2. (#regimes)
3. (#indicator-usage)
4. (#entry-signals)
5. (#exit-signals)
6. (#regime-strategies)
7. (#confluence)
8. (#backtesting)
9. (#optimization)
10. (#examples)
---
## OVERVIEW
### What This System Does
This is a **complete market regime identification and trading system** that:
1. **Identifies 6 distinct market regimes** automatically
2. **Adapts trading tactics** to each regime
3. **Provides high-probability entry signals** with confluence scoring
4. **Shows optimal exit points** for each trade
5. **Can be backtested** to validate performance
### Two Components Provided
1. **Indicator** (`market_regime_indicator.pine`)
- Visual regime identification
- Entry/exit signals on chart
- Dynamic support/resistance
- Info tables with live data
- Use for manual trading
2. **Strategy** (`market_regime_strategy.pine`)
- Fully automated backtestable version
- Same logic as indicator
- Position sizing and risk management
- Performance metrics
- Use for backtesting and automation
---
## THE 6 MARKET REGIMES
### 1. 🟢 BULL TRENDING
**Characteristics:**
- Strong uptrend
- Price above SMA50 and SMA200
- ADX > 25 (strong trend)
- Higher highs and higher lows
- DI+ > DI- (bullish momentum)
**What It Means:**
- Market has clear upward direction
- Buyers in control
- Pullbacks are buying opportunities
- Strongest regime for long positions
**How to Trade:**
- ✅ **BUY dips to EMA20 or SMA20**
- ✅ Enter when RSI < 60 on pullback
- ✅ Hold through minor corrections
- ❌ Don't short against the trend
- ❌ Don't sell too early
**Expected Behavior:**
- Pullbacks are shallow (5-10%)
- Bounces are strong
- Support at moving averages holds
- Volume increases on rallies
---
### 2. 🔴 BEAR TRENDING
**Characteristics:**
- Strong downtrend
- Price below SMA50 and SMA200
- ADX > 25 (strong trend)
- Lower highs and lower lows
- DI- > DI+ (bearish momentum)
**What It Means:**
- Market has clear downward direction
- Sellers in control
- Rallies are selling opportunities
- Strongest regime for short positions
**How to Trade:**
- ✅ **SELL rallies to EMA20 or SMA20**
- ✅ Enter when RSI > 40 on bounce
- ✅ Hold through minor bounces
- ❌ Don't buy against the trend
- ❌ Don't cover shorts too early
**Expected Behavior:**
- Rallies are weak (5-10%)
- Selloffs are strong
- Resistance at moving averages holds
- Volume increases on declines
---
### 3. 🔵 BULL RANGING
**Characteristics:**
- Bullish bias but consolidating
- Price near or above SMA50
- ADX < 20 (weak trend)
- Trading in range
- Choppy price action
**What It Means:**
- Uptrend is pausing
- Accumulation phase
- Support and resistance zones clear
- Lower volatility
**How to Trade:**
- ✅ **BUY at support zone**
- ✅ Enter when RSI < 40
- ✅ Take profits at resistance
- ⚠️ Smaller position sizes
- ⚠️ Tighter stops
**Expected Behavior:**
- Range-bound oscillations
- Support bounces repeatedly
- Resistance rejections common
- Eventually breaks higher (usually)
---
### 4. 🟠 BEAR RANGING
**Characteristics:**
- Bearish bias but consolidating
- Price near or below SMA50
- ADX < 20 (weak trend)
- Trading in range
- Choppy price action
**What It Means:**
- Downtrend is pausing
- Distribution phase
- Support and resistance zones clear
- Lower volatility
**How to Trade:**
- ✅ **SELL at resistance zone**
- ✅ Enter when RSI > 60
- ✅ Take profits at support
- ⚠️ Smaller position sizes
- ⚠️ Tighter stops
**Expected Behavior:**
- Range-bound oscillations
- Resistance holds repeatedly
- Support bounces are weak
- Eventually breaks lower (usually)
---
### 5. ⚪ CONSOLIDATION
**Characteristics:**
- No clear direction
- Range compression
- Very low ADX (< 15 often)
- Price inside tight range
- Neutral sentiment
**What It Means:**
- Market is coiling
- Building energy for next move
- Indecision between buyers/sellers
- Calm before the storm
**How to Trade:**
- ✅ **WAIT for breakout direction**
- ✅ Enter on high-volume breakout
- ✅ Direction becomes clear
- ❌ Don't trade inside the range
- ❌ Avoid choppy scalping
**Expected Behavior:**
- Narrow range
- Low volume
- False breakouts possible
- Explosive move when it breaks
---
### 6. 🟣 CHAOS (High Volatility)
**Characteristics:**
- Extreme volatility
- No clear direction
- Erratic price swings
- ATR > 2x average
- Unpredictable
**What It Means:**
- Market panic or euphoria
- News-driven moves
- Emotion dominates logic
- Highest risk environment
**How to Trade:**
- ❌ **STAY OUT!**
- ❌ No positions
- ❌ Wait for stability
- ✅ Protect existing positions
- ✅ Reduce risk
**Expected Behavior:**
- Large intraday swings
- Gaps up/down
- Stop hunts
- Whipsaws
- Eventually calms down
---
## INDICATOR USAGE
### Visual Elements
#### 1. Background Colors
- **Light Green** = Bull Trending (go long)
- **Light Red** = Bear Trending (go short)
- **Light Teal** = Bull Ranging (buy dips)
- **Light Orange** = Bear Ranging (sell rallies)
- **Light Gray** = Consolidation (wait)
- **Purple** = Chaos (stay out!)
#### 2. Regime Labels
- Appear when regime changes
- Show new regime name
- Positioned at highs (bullish) or lows (bearish)
#### 3. Entry Signals
- **Green "LONG"** labels = Buy here
- **Red "SHORT"** labels = Sell here
- Number shows confluence score (X/5 signals)
- Hover for details (stop, target, RSI, etc.)
#### 4. Exit Signals
- **Orange "EXIT LONG"** = Close long position
- **Orange "EXIT SHORT"** = Close short position
- Shows exit reason in tooltip
#### 5. Support/Resistance Lines
- **Green line** = Dynamic support (buy zone)
- **Red line** = Dynamic resistance (sell zone)
- Adapts to regime automatically
#### 6. Moving Averages
- **Blue** = SMA 20 (short-term trend)
- **Orange** = SMA 50 (medium-term trend)
- **Purple** = SMA 200 (long-term trend)
### Information Tables
#### Top Right Table (Main Info)
Shows real-time market conditions:
- **Current Regime** - What regime we're in
- **Bias** - Long, Short, Breakout, or Stay Out
- **ADX** - Trend strength (>25 = strong)
- **Trend** - Strong, Moderate, or Weak
- **Volatility** - High or Normal
- **Vol Ratio** - Current vs average volatility
- **RSI** - Momentum (>70 overbought, <30 oversold)
- **vs SMA50/200** - Price position relative to MAs
- **Support/Resistance** - Exact price levels
- **Long/Short Signals** - Confluence scores (X/5)
#### Bottom Right Table (Regime Guide)
Quick reference for each regime:
- What action to take
- What strategy to use
- Color-coded for quick identification
---
## ENTRY SIGNALS EXPLAINED
### Confluence Scoring System (5 Factors)
Each entry signal is scored 0-5 based on how many factors align:
#### For LONG Entries:
1. ✅ **Regime Alignment** - In Bull Trending or Bull Ranging
2. ✅ **RSI Pullback** - RSI between 35-50 (not overbought)
3. ✅ **Near Support** - Price within 2% of dynamic support
4. ✅ **MACD Turning Up** - Momentum shifting bullish
5. ✅ **Volume Confirmation** - Above average volume
#### For SHORT Entries:
1. ✅ **Regime Alignment** - In Bear Trending or Bear Ranging
2. ✅ **RSI Rejection** - RSI between 50-65 (not oversold)
3. ✅ **Near Resistance** - Price within 2% of dynamic resistance
4. ✅ **MACD Turning Down** - Momentum shifting bearish
5. ✅ **Volume Confirmation** - Above average volume
### Confluence Requirements
**Minimum Confluence** (default = 2):
- 2/5 = Entry signal triggered
- 3/5 = Good signal
- 4/5 = Strong signal
- 5/5 = Excellent signal (rare)
**Higher confluence = Higher probability = Better trades**
### Specific Entry Patterns
#### 1. Bull Trending Entry
```
Requirements:
- Regime = Bull Trending
- Price pulls back to EMA20
- Close above EMA20 (bounce)
- Up candle (close > open)
- RSI < 60
- Confluence ≥ 2
```
#### 2. Bear Trending Entry
```
Requirements:
- Regime = Bear Trending
- Price rallies to EMA20
- Close below EMA20 (rejection)
- Down candle (close < open)
- RSI > 40
- Confluence ≥ 2
```
#### 3. Bull Ranging Entry
```
Requirements:
- Regime = Bull Ranging
- RSI < 40 (oversold)
- Price at or below support
- Up candle (reversal)
- Confluence ≥ 1 (more lenient)
```
#### 4. Bear Ranging Entry
```
Requirements:
- Regime = Bear Ranging
- RSI > 60 (overbought)
- Price at or above resistance
- Down candle (rejection)
- Confluence ≥ 1 (more lenient)
```
#### 5. Consolidation Breakout
```
Requirements:
- Regime = Consolidation
- Price breaks above/below range
- Volume > 1.5x average (explosive)
- Strong directional candle
```
---
## EXIT SIGNALS EXPLAINED
### Three Types of Exits
#### 1. Regime Change Exits (Automatic)
- **Long Exit**: Regime changes to Bear Trending or Chaos
- **Short Exit**: Regime changes to Bull Trending or Chaos
- **Reason**: Market character changed, strategy no longer valid
#### 2. Support/Resistance Break Exits
- **Long Exit**: Price breaks below support by 2%
- **Short Exit**: Price breaks above resistance by 2%
- **Reason**: Key level violated, trend may be reversing
#### 3. Momentum Exits
- **Long Exit**: RSI > 70 (overbought) AND down candle
- **Short Exit**: RSI < 30 (oversold) AND up candle
- **Reason**: Overextension, take profits
### Stop Loss & Take Profit
**Stop Loss** (Automatic in strategy):
- Placed at Entry - (ATR × 2)
- Adapts to volatility
- Protected from whipsaws
- Typically 2-4% for stocks, 5-10% for crypto
**Take Profit** (Automatic in strategy):
- Placed at Entry + (Stop Distance × R:R Ratio)
- Default 2.5:1 reward:risk
- Example: $2 risk = $5 reward target
- Allows winners to run
---
## TRADING EACH REGIME
### BULL TRENDING - Most Profitable Long Environment
**Strategy: Buy Every Dip**
**Entry Rules:**
1. Wait for pullback to EMA20 or SMA20
2. Look for RSI < 60
3. Enter when candle closes above MA
4. Confluence should be 2+
**Stop Loss:**
- Below the recent swing low
- Or 2 × ATR below entry
**Take Profit:**
- At previous high
- Or 2.5:1 R:R minimum
**Position Size:**
- Can use full size (2% risk)
- High win rate regime
**Example Trade:**
```
Price: $100, pulls back to $98 (EMA20)
Entry: $98.50 (close above EMA)
Stop: $96.50 (2 ATR)
Target: $103.50 (2.5:1)
Risk: $2, Reward: $5
```
---
### BEAR TRENDING - Most Profitable Short Environment
**Strategy: Sell Every Rally**
**Entry Rules:**
1. Wait for bounce to EMA20 or SMA20
2. Look for RSI > 40
3. Enter when candle closes below MA
4. Confluence should be 2+
**Stop Loss:**
- Above the recent swing high
- Or 2 × ATR above entry
**Take Profit:**
- At previous low
- Or 2.5:1 R:R minimum
**Position Size:**
- Can use full size (2% risk)
- High win rate regime
**Example Trade:**
```
Price: $100, rallies to $102 (EMA20)
Entry: $101.50 (close below EMA)
Stop: $103.50 (2 ATR)
Target: $96.50 (2.5:1)
Risk: $2, Reward: $5
```
---
### BULL RANGING - Buy Low, Sell High
**Strategy: Range Trading (Long Bias)**
**Entry Rules:**
1. Wait for price at support zone
2. Look for RSI < 40
3. Enter on reversal candle
4. Confluence should be 1-2+
**Stop Loss:**
- Below support zone
- Tighter than trending (1.5 ATR)
**Take Profit:**
- At resistance zone
- Don't hold through resistance
**Position Size:**
- Reduce to 1-1.5% risk
- Lower win rate than trending
**Example Trade:**
```
Range: $95-$105
Entry: $96 (at support, RSI 35)
Stop: $94 (below support)
Target: $104 (at resistance)
Risk: $2, Reward: $8 (4:1)
```
---
### BEAR RANGING - Sell High, Buy Low
**Strategy: Range Trading (Short Bias)**
**Entry Rules:**
1. Wait for price at resistance zone
2. Look for RSI > 60
3. Enter on rejection candle
4. Confluence should be 1-2+
**Stop Loss:**
- Above resistance zone
- Tighter than trending (1.5 ATR)
**Take Profit:**
- At support zone
- Don't hold through support
**Position Size:**
- Reduce to 1-1.5% risk
- Lower win rate than trending
**Example Trade:**
```
Range: $95-$105
Entry: $104 (at resistance, RSI 65)
Stop: $106 (above resistance)
Target: $96 (at support)
Risk: $2, Reward: $8 (4:1)
```
---
### CONSOLIDATION - Wait for Breakout
**Strategy: Breakout Trading**
**Entry Rules:**
1. Identify consolidation range
2. Wait for VOLUME SURGE (1.5x+ avg)
3. Enter on close outside range
4. Direction must be clear
**Stop Loss:**
- Opposite side of range
- Or 2 ATR
**Take Profit:**
- Measure range height, project it
- Example: $10 range = $10 move expected
**Position Size:**
- Reduce to 1% risk
- 50% false breakout rate
**Example Trade:**
```
Consolidation: $98-$102 (4-point range)
Breakout: $102.50 (high volume)
Entry: $103
Stop: $100 (back in range)
Target: $107 (4-point range projected)
Risk: $3, Reward: $4
```
---
### CHAOS - STAY OUT!
**Strategy: Preservation**
**What to Do:**
- ❌ NO new positions
- ✅ Close existing positions if near entry
- ✅ Tighten stops on profitable trades
- ✅ Reduce position sizes dramatically
- ✅ Wait for regime to stabilize
**Why It's Dangerous:**
- Stop hunts are common
- Whipsaws everywhere
- News-driven volatility
- No technical reliability
- Even "perfect" setups fail
**When Does It End:**
- Volatility ratio drops < 1.5
- ADX starts rising (direction appears)
- Price respects support/resistance again
- Usually 1-5 days
---
## CONFLUENCE SYSTEM
### How It Works
The system scores each potential entry on 5 factors. More factors aligning = higher probability.
### Confluence Requirements by Regime
**Trending Regimes** (strictest):
- Minimum 2/5 required
- 3/5 = Good
- 4-5/5 = Excellent
**Ranging Regimes** (moderate):
- Minimum 1-2/5 required
- 2/5 = Good
- 3+/5 = Excellent
**Consolidation** (breakout only):
- Volume is most critical
- Direction confirmation
- Less confluence needed
### Adjusting Minimum Confluence
**If too few signals:**
- Lower from 2 to 1
- More trades, lower quality
**If too many false signals:**
- Raise from 2 to 3
- Fewer trades, higher quality
**Recommendation:**
- Start at 2
- Adjust based on win rate
- Aim for 55-65% win rate
---
## STRATEGY BACKTESTING
### Loading the Strategy
1. Copy `market_regime_strategy.pine`
2. Open Pine Editor in TradingView
3. Paste and "Add to Chart"
4. Strategy Tester tab opens at bottom
### Initial Settings
```
Risk Per Trade: 2%
ATR Stop Multiplier: 2.0
Reward:Risk Ratio: 2.5
Trade Longs: ✓
Trade Shorts: ✓
Trade Trending Only: ✗ (test both)
Avoid Chaos: ✓
Minimum Confluence: 2
```
### What to Look For
**Good Results:**
- Win Rate: 50-60%
- Profit Factor: 1.8-2.5
- Net Profit: Positive
- Max Drawdown: <20%
- Consistent equity curve
**Warning Signs:**
- Win Rate: <45% (too many losses)
- Profit Factor: <1.5 (barely profitable)
- Max Drawdown: >30% (too risky)
- Erratic equity curve (unstable)
### Testing Different Regimes
**Test 1: Trending Only**
```
Trade Trending Only: ✓
Result: Higher win rate, fewer trades
```
**Test 2: All Regimes**
```
Trade Trending Only: ✗
Result: More trades, potentially lower win rate
```
**Test 3: Long Only**
```
Trade Longs: ✓
Trade Shorts: ✗
Result: Works in bull markets
```
**Test 4: Short Only**
```
Trade Longs: ✗
Trade Shorts: ✓
Result: Works in bear markets
```
---
## SETTINGS OPTIMIZATION
### Key Parameters to Adjust
#### 1. Risk Per Trade (Most Important)
- **0.5%** = Very conservative
- **1.0%** = Conservative (recommended for beginners)
- **2.0%** = Moderate (recommended)
- **3.0%** = Aggressive
- **5.0%** = Very aggressive (not recommended)
**Impact:** Higher risk = higher returns BUT bigger drawdowns
#### 2. Reward:Risk Ratio
- **2:1** = More wins needed, hit target faster
- **2.5:1** = Balanced (recommended)
- **3:1** = Fewer wins needed, hold longer
- **4:1** = Very patient, best in trending
**Impact:** Higher R:R = can have lower win rate
#### 3. Minimum Confluence
- **1** = More signals, lower quality
- **2** = Balanced (recommended)
- **3** = Fewer signals, higher quality
- **4** = Very selective
- **5** = Almost never triggers
**Impact:** Higher = fewer but better trades
#### 4. ADX Thresholds
- **Trending: 20-30** (default 25)
- Lower = detect trends earlier
- Higher = only strong trends
- **Ranging: 15-25** (default 20)
- Lower = identify ranging earlier
- Higher = only weak trends
#### 5. Trend Period (SMA)
- **20-50** = Short-term trends
- **50** = Medium-term (default, recommended)
- **100-200** = Long-term trends
**Impact:** Longer period = slower regime changes, more stable
### Optimization Workflow
**Step 1: Baseline**
- Use all default settings
- Test on 3+ years
- Record: Win Rate, PF, Drawdown
**Step 2: Risk Optimization**
- Test 1%, 1.5%, 2%, 2.5%
- Find best risk-adjusted return
- Balance profit vs drawdown
**Step 3: R:R Optimization**
- Test 2:1, 2.5:1, 3:1
- Check which maximizes profit factor
- Consider holding time
**Step 4: Confluence Optimization**
- Test 1, 2, 3
- Find sweet spot for win rate
- Aim for 55-65% win rate
**Step 5: Regime Filter**
- Test with/without trend filter
- Test with/without chaos filter
- Find what works for your asset
---
## REAL TRADING EXAMPLES
### Example 1: Bull Trending - SPY
**Setup:**
- Regime: BULL TRENDING
- Price pulls back from $450 to $445
- EMA20 at $444
- RSI drops to 45
- Confluence: 4/5
**Entry:**
- Price closes at $445.50 (above EMA20)
- LONG signal appears
- Enter at $445.50
**Risk Management:**
- Stop: $443 (2 ATR = $2.50)
- Target: $451.75 (2.5:1 = $6.25)
- Risk: $2.50 per share
- Position: 80 shares (2% of $10k = $200 risk)
**Outcome:**
- Price rallies to $452 in 3 days
- Target hit
- Profit: $6.50 × 80 = $520
- Return: 2.6 × risk (excellent)
---
### Example 2: Bear Ranging - AAPL
**Setup:**
- Regime: BEAR RANGING
- Range: $165-$175
- Price rallies to $174
- Resistance at $175
- RSI at 68
- Confluence: 3/5
**Entry:**
- Rejection candle at $174
- SHORT signal appears
- Enter at $173.50
**Risk Management:**
- Stop: $176 (above resistance)
- Target: $166 (support)
- Risk: $2.50
- Position: 80 shares
**Outcome:**
- Price drops to $167 in 2 days
- Target hit
- Profit: $6.50 × 80 = $520
- Return: 2.6 × risk
---
### Example 3: Consolidation Breakout - BTC
**Setup:**
- Regime: CONSOLIDATION
- Range: $28,000 - $30,000
- Compressed for 2 weeks
- Volume declining
**Breakout:**
- Price breaks $30,000
- Volume surges 200%
- Close at $30,500
- LONG signal
**Entry:**
- Enter at $30,500
**Risk Management:**
- Stop: $29,500 (back in range)
- Target: $32,000 (range height = $2k)
- Risk: $1,000
- Position: 0.2 BTC ($200 risk on $10k)
**Outcome:**
- Price runs to $33,000
- Target exceeded
- Profit: $2,500 × 0.2 = $500
- Return: 2.5 × risk
---
### Example 4: Avoiding Chaos - Tesla
**Setup:**
- Regime: BULL TRENDING
- LONG position from $240
- Elon tweets something crazy
- Regime changes to CHAOS
**Action:**
- EXIT signal appears
- Close position immediately
- Current price: $242 (small profit)
**Outcome:**
- Next 3 days: wild swings
- High $255, Low $230
- By staying out, avoided:
- Potential stop out
- Whipsaw losses
- Stress
**Result:**
- Small profit preserved
- Capital protected
- Re-enter when regime stabilizes
---
## ALERTS SETUP
### Available Alerts
1. **Bull Trending Regime** - Market goes bullish
2. **Bear Trending Regime** - Market goes bearish
3. **Chaos Regime** - High volatility, stay out
4. **Long Entry Signal** - Buy opportunity
5. **Short Entry Signal** - Sell opportunity
6. **Long Exit Signal** - Close long
7. **Short Exit Signal** - Close short
### How to Set Up
1. Click **⏰ (Alert)** icon in TradingView
2. Select **Condition**: Choose indicator + alert type
3. **Options**: Popup, Email, Webhook, etc.
4. **Message**: Customize notification
5. Click **Create**
### Recommended Alert Strategy
**For Active Traders:**
- Long Entry Signal
- Short Entry Signal
- Long Exit Signal
- Short Exit Signal
**For Position Traders:**
- Bull Trending Regime (enter longs)
- Bear Trending Regime (enter shorts)
- Chaos Regime (exit all)
**For Conservative:**
- Only regime change alerts
- Manually review entries
- More selective
---
## TIPS FOR SUCCESS
### 1. Start Small
- Paper trade first
- Then 0.5% risk
- Build to 1-2% over time
### 2. Follow the Regime
- Don't fight it
- Adapt your style
- Different tactics for each
### 3. Trust the Confluence
- 4-5/5 = Best trades
- 2-3/5 = Good trades
- 1/5 = Skip unless desperate
### 4. Respect Exits
- Don't hope and hold
- Cut losses quickly
- Take profits at targets
### 5. Avoid Chaos
- Seriously, just stay out
- Protect your capital
- Wait for clarity
### 6. Keep a Journal
- Record every trade
- Note regime and confluence
- Review weekly
- Learn patterns
### 7. Backtest Thoroughly
- 3+ years minimum
- Multiple market conditions
- Different assets
- Walk-forward test
### 8. Be Patient
- Best setups are rare
- 1-3 trades per week is normal
- Quality over quantity
- Compound over time
---
## COMMON QUESTIONS
**Q: How many trades per month should I expect?**
A: Depends on timeframe and settings. Daily chart: 5-15 trades/month. 4H chart: 15-30 trades/month.
**Q: What's a good win rate?**
A: 55-65% is excellent. 50-55% is good. Below 50% needs adjustment.
**Q: Should I trade all regimes?**
A: Beginners: Only trending. Intermediate: Trending + ranging. Advanced: All except chaos.
**Q: Can I use this on any timeframe?**
A: Best on Daily and 4H. Works on 1H with more noise. Not recommended <1H.
**Q: What if I'm in a trade and regime changes?**
A: Exit immediately (if using indicator) or let strategy handle it automatically.
**Q: How do I know if I'm over-optimizing?**
A: If results are perfect on one period but fail on another. Use walk-forward testing.
**Q: Should I always take 5/5 confluence trades?**
A: Yes, but they're rare (1-2/month). Don't wait only for these.
**Q: Can I combine this with other indicators?**
A: Yes, but keep it simple. RSI, MACD already included. Maybe add volume profile.
**Q: What assets work best?**
A: Liquid stocks, major crypto, futures. Avoid forex spot (use futures), penny stocks.
**Q: How long to hold positions?**
A: Trending: Days to weeks. Ranging: Hours to days. Breakout: Days. Let the regime guide you.
---
## FINAL THOUGHTS
This system gives you:
- ✅ Clear market context (regime)
- ✅ High-probability entries (confluence)
- ✅ Defined exits (automatic signals)
- ✅ Adaptable tactics (regime-specific)
- ✅ Backtestable results (strategy version)
**Success requires:**
- 📚 Understanding each regime
- 🎯 Following the signals
- 💪 Discipline to wait
- 🧠 Emotional control
- 📊 Proper risk management
**Start your journey:**
1. Load the indicator
2. Watch for 1 week (no trading)
3. Identify regime patterns
4. Paper trade for 1 month
5. Go live with small size
6. Scale up as you gain confidence
**Remember:** The market will always be here. There's no rush. Master one regime at a time, and you'll be profitable in all conditions!
Good luck! 🚀

MTC – Multi-Timeframe Trend Confirmator V2MTC – Multi-Timeframe Trend Confirmator V2
A comprehensive trend analysis indicator that systematically combines six technical indicators across three customizable timeframes, using a weighted scoring system to identify high-probability trend conditions.
ORIGINALITY AND CONCEPT
This indicator is original in its approach to multi-timeframe trend confirmation. Rather than relying on a single indicator or timeframe, it creates a composite score by evaluating six different technical conditions simultaneously across three timeframes. The scoring system weighs certain indicators more heavily based on their reliability in trend identification. The visual gauge provides an at-a-glance view of trend alignment across timeframes, making it easier to identify when multiple timeframes agree - a condition that typically produces stronger, more reliable trends.
HOW IT WORKS - DETAILED SCORING METHODOLOGY
The indicator evaluates six technical conditions on each timeframe. Each condition contributes to a composite score:
EMA 200 (Weight: 1 point)
Bullish: Price closes above EMA 200 (+1)
Bearish: Price closes below EMA 200 (-1)
Rationale: Long-term trend direction
SMA 50/200 Crossover (Weight: 1 point)
Bullish: SMA 50 above SMA 200 (+1)
Bearish: SMA 50 below SMA 200 (-1)
Rationale: Golden/Death cross confirmation
RSI 14 (Weight: 1 point)
Bullish: RSI above 55 (+1)
Bearish: RSI below 45 (-1)
Neutral: RSI between 45-55 (0)
Rationale: Momentum filter with buffer zone to avoid chop
MACD (12,26,9) (Weight: 1 point)
Bullish: MACD line above signal line (+1)
Bearish: MACD line below signal line (-1)
Rationale: Trend momentum confirmation
ADX 14 (Weight: 2 points - DOUBLE WEIGHTED)
Requires ADX above 25 to activate
Bullish: DI+ above DI- and ADX > 25 (+2)
Bearish: DI- above DI+ and ADX > 25 (-2)
Neutral: ADX below 25 (0)
Rationale: Trend strength filter - only counts when a strong trend exists. Double weighted because ADX is specifically designed to measure trend strength, making it more reliable than oscillators.
Supertrend (Factor: 3.0, ATR Period: 10) (Weight: 2 points - DOUBLE WEIGHTED)
Bullish: Direction indicator = -1 (+2)
Bearish: Direction indicator = +1 (-2)
Rationale: Dynamic support/resistance that adapts to volatility. Double weighted because Supertrend provides clear, objective trend signals with built-in stop-loss levels.
COMPOSITE SCORE CALCULATION:
Total possible score range: -10 to +10 points
Score interpretation:
Score > 2: UPTREND (majority of indicators bullish, especially weighted ones)
Score < -2: DOWNTREND (majority of indicators bearish, especially weighted ones)
Score between -2 and +2: NEUTRAL/RANGING (mixed signals or weak trend)
The threshold of +/- 2 was chosen because it requires more than just basic agreement - it typically means at least 3-4 indicators align, or that the heavily-weighted indicators (ADX, Supertrend) confirm the direction.
MULTI-TIMEFRAME LOGIC:
The indicator calculates the composite score independently for three timeframes:
Higher Timeframe (default: 4H) - Major trend direction
Mid Timeframe (default: 1H) - Intermediate trend
Lower Timeframe (default: 15min) - Entry timing
Main Trend Confirmation Rule:
The indicator only signals a confirmed trend when BOTH the higher timeframe AND mid timeframe scores agree (both > 2 for uptrend, or both < -2 for downtrend). This dual-timeframe confirmation significantly reduces false signals during choppy or ranging markets.
HOW TO USE IT
Setup:
Add indicator to chart
Customize timeframes based on your trading style:
Scalpers: 15min, 5min, 1min
Day traders: 4H, 1H, 15min (default)
Swing traders: Daily, 4H, 1H
Toggle individual indicators on/off based on your preference
Adjust Supertrend parameters if needed for your instrument's volatility
Reading the Gauge (Top Right Corner):
Each row shows one timeframe
Left column: Timeframe label
Middle column: Visual strength bars (10 bars = maximum score)
Green bars = Bullish score
Red bars = Bearish score
Yellow bars = Neutral/ranging
More filled bars = stronger trend
Right column: Numerical score
Trading Signals:
Entry Signals:
Long Entry: Wait for upward triangle arrow (appears when higher + mid TF both bullish)
Confirm gauge shows green bars on higher and mid timeframes
Lower timeframe should ideally turn green for entry timing
Chart background tints light green
Short Entry: Wait for downward triangle arrow (appears when higher + mid TF both bearish)
Confirm gauge shows red bars on higher and mid timeframes
Lower timeframe should ideally turn red for entry timing
Chart background tints light red
Position Management:
Stay in position while higher and mid timeframes remain aligned
Consider reducing position size when mid timeframe score weakens
Exit when higher timeframe trend reverses (daily label changes)
Avoiding False Signals:
Ignore signals when gauge shows mixed colors across timeframes
Avoid trading when scores are close to threshold (+/- 2 to +/- 4 range)
Best trades occur when all three timeframes align (all green or all red in gauge)
Use the numerical scores: higher absolute values (7-10) indicate stronger, more reliable trends
Practical Examples:
Example 1 - Strong Uptrend Entry:
Higher TF: +8 (strong green bars)
Mid TF: +6 (strong green bars)
Lower TF: +4 (moderate green bars)
Action: Look for long entries on lower timeframe pullbacks
Background is tinted green, upward arrow appears
Example 2 - Ranging Market (Avoid):
Higher TF: +3 (weak green)
Mid TF: -1 (weak red)
Lower TF: +2 (neutral yellow)
Action: Stay out, wait for alignment
Example 3 - Trend Reversal Warning:
Higher TF: +7 (still green)
Mid TF: -3 (turned red)
Lower TF: -5 (strong red)
Action: Consider exiting longs, prepare for potential higher TF reversal
Customization Options:
Timeframes: Adjust all three to match your trading horizon
Indicator Toggles: Disable indicators that don't suit your instrument:
Disable RSI for highly volatile crypto markets
Disable SMA crossover for range-bound instruments
Keep ADX and Supertrend enabled for trending markets
Visual Preferences:
Arrow size: 5 options from Tiny to Huge
Gauge size: Small/Medium/Large for different screen sizes
Toggle arrows on/off if you only want the gauge
Alert Setup:
Right-click chart, "Add Alert"
Condition: MTC v6 - UPTREND or DOWNTREND
Get notified when multi-timeframe confirmation occurs
Best Practices:
Use with Price Action: The indicator works best when combined with support/resistance levels, chart patterns, and volume analysis
Risk Management: Even with multi-timeframe confirmation, always use stop losses
Market Context: Works best in trending markets; less reliable in strong consolidation
Backtesting: Test the default settings on your specific instrument and timeframe before live trading
Patience: Wait for full multi-timeframe alignment rather than taking premature signals
Technical Notes:
All calculations use Pine Script's security function to fetch data from multiple timeframes
Prevents repainting by using confirmed bar data
Gauge updates in real-time on the last bar
Daily labels mark at the open of each new daily candle
Works on all instruments and timeframes
This indicator is ideal for traders who want objective, systematic trend identification without the complexity of analyzing multiple indicators manually across different timeframes.
-NATANTIA

ORION Trend Engine by Ali_KamberogluORION Trend Engine by Ali_Kamberoglu | Decode the DNA of a Trend: Adaptive Strength & Direction
Developer: Ali Kamberoğlu
Overview: Go Beyond the Limits of Standard ADX
The ORION Trend Engine (TE) is a complete command center designed to analyze not just the existence of a market trend, but also its strength, direction, acceleration, and potential within a single, integrated system. It was developed to solve the chronic problems of the classic ADX indicator, such as lag, noise, and difficulty in interpretation.
This tool combines two separate panels into one intelligent engine:
Trend Strength Panel: Shows when the market is entering a strong trend or moving sideways.
Directional Bias Oscillator Panel: Clearly visualizes which direction (Buy/Sell) is dominating the trend.
ORION TE provides an analytical framework not just to know if there is a trend, but to decide whether to enter it, when to stay in it, and when to exit.
The ORION Advantage: Why It's Different
1. The Smart Trend Engine (Adaptive KAMA Integration):
The standard ADX uses a slow-reacting average. ORION TE revolutionizes this by offering the option to use the Adaptive KAMA engine in the ADX calculation, which adapts to market conditions. What does this mean?
Faster Response: When a strong trend begins, KAMA speeds up, notifying you of the trend's start much earlier.
Noise Filter: When the market is choppy and indecisive, KAMA slows down, protecting you from countless false "trend start" signals.
2. The Directional Compass (Normalized DI Oscillator):
Interpreting DI+ and DI- lines can be complex. ORION TE solves this problem with the DI Oscillator:
Clear Signals: This oscillator shows the net dominance between Buyers (positive values) and Sellers (negative values).
ADX Filter: The oscillator only generates signals when there is significant trend strength in the market (when ADX is above a certain threshold). This completely eliminates meaningless crossovers in sideways markets.
Strength Indicator: The histogram bars change color based on the trend's strength. Bright colors (Lime/Red) indicate a strong trend, while dark colors (Green/Maroon) signify a weakening trend.
3. Multi-Stage Trend Analysis (Dynamic Levels):
Saying "there is a trend" is not enough. ORION TE analyzes the trend's strength across four different levels:
No Trend (Gray): No direction in the market.
Trend Potential (Yellow): A trend is starting to form, pay attention.
Strategic Trend (Blue): The main trend with sufficient strength for trading.
Strong & Peak Trends: Zones where the trend is at its strongest, but may also show signs of exhaustion.
High-Probability Trading Strategies:
Strongest BUY Signal (Trend Ignition):
The ADX line turns from Yellow to Blue (Strategic Trend Begins).
Simultaneously, the DI Oscillator histogram is in positive territory and crosses above its white signal line.
This is an A+ grade entry opportunity, confirming both trend strength and buyer momentum.
Strongest SELL Signal (Trend Ignition):
The ADX line turns Blue.
Simultaneously, the DI Oscillator histogram is in negative territory and crosses below its white signal line.
This is a strong downtrend initiation signal, as sellers take control.
Important Visual Notice
The Signal line (white) and some level lines in the indicator are designed for optimal visibility on dark-themed charts.
If you are using a light-themed (white) chart background, these white elements may not be visible. For the best experience, you have two options:
Recommended: Set your chart background to a dark color in TradingView's settings.
Alternative: Go into the indicator settings, and under "5. Visual Settings," change the color of the DI Oscillator (Signal) line and other white levels to a darker color that contrasts with your chart.
Disclaimer
This indicator is a professional analysis tool developed to assist in your trading decisions. No signal or analysis constitutes investment advice. Trading in financial markets involves high risk, and past performance is not a guarantee of future results. Please always apply your own risk management strategies.

Quant RSIQuant RSI MTF - Professional Multi-Timeframe RSI Analysis
A sophisticated RSI indicator built for serious traders who need more than basic overbought and oversold levels. This tool combines advanced filtering techniques with multi-timeframe analysis to give you a clearer picture of momentum across different time horizons.
What Makes This Different
Most RSI indicators use simple moving averages that lag behind price action. This version uses Laguerre filtering, which is a mathematical technique that reduces lag while maintaining smooth signals. The result is an RSI that responds faster to genuine momentum shifts without getting whipped around by noise.
The system monitors five different timeframes simultaneously, checking whether momentum is aligned or diverging across short-term, medium-term, and long-term perspectives. When all timeframes agree on direction, you have significantly higher probability setups. When they disagree, you know to be cautious.
Core Features
The indicator calculates three separate RSI values using different lookback periods - short, medium, and long term. Each one serves a specific purpose. The short-term catches quick reversals, the medium-term identifies swing trading opportunities, and the long-term keeps you aware of the bigger trend.
Dynamic threshold adjustment is built in based on ATR volatility measurements. During high volatility periods, the overbought and oversold levels automatically expand because extreme readings become more common. During low volatility, the thresholds tighten up. This prevents you from getting false signals just because market conditions changed.
Volume confirmation is integrated into every signal. The system analyzes volume delta to determine whether price movements are supported by actual buying or selling pressure. A divergence between RSI and volume often signals weak momentum that is likely to reverse.
Advanced divergence detection goes beyond basic hidden and regular divergences. The system calculates divergence strength as a percentage, so you know which setups have the most potential. A weak divergence barely worth noting gets scored low, while a major divergence with significant price-RSI separation scores high.
Signal Intelligence
Every potential signal gets assigned a confidence score from 0 to 100. This score factors in trend strength, momentum, volume confirmation, divergence presence, ADX readings, and timeframe alignment. A score above 70 means all the pieces are in place. Below 40 means something important is missing.
The indicator calculates ADX automatically to measure trend strength. Even if RSI shows oversold conditions, a weak ADX reading suggests the market is ranging and mean reversion might not work. Strong ADX with extreme RSI readings often produces the best setups.
Market condition classification tells you whether you are in a strong bull trend, bear trend, pullback, sideways chop, or volatility expansion phase. Each condition requires different trading approaches, and the indicator adapts its signals accordingly.
Volatility Analysis
Real-time volatility state monitoring shows you whether volatility is exploding, expanding, stable, or contracting. Contracting volatility often precedes big moves. Exploding volatility suggests you should reduce position size or stay out entirely.
The system compares current volatility to historical levels using percentile rankings. If current ATR is in the 90th percentile, you know volatility is unusually high even if you have not traded this asset before.
Volume profile approximation analyzes where volume is accumulating at different price levels. While not as detailed as true market profile software, it gives you insight into support and resistance zones based on actual trading activity.
What This Indicator Does Well
The Laguerre filtering genuinely reduces lag compared to standard RSI. You will notice signals forming 1-3 bars earlier than traditional RSI implementations, which can make a significant difference in fast-moving markets.
Multi-timeframe confluence is calculated automatically instead of forcing you to manually switch between charts. When all five timeframes align, the visual confirmation is immediate and the probability of success increases dramatically.
Dynamic threshold adjustment based on volatility is something most RSI indicators lack entirely. This prevents you from taking low-probability trades just because RSI hit 30 or 70 during unusual market conditions.
Volume integration with every signal helps filter out weak setups. RSI might show oversold, but if volume delta is negative and selling pressure continues, the indicator knows not to generate a buy signal.
Divergence strength calculation goes beyond just marking divergences with arrows. Knowing that a divergence has 75% strength versus 20% strength completely changes how you should trade it.
The ADX integration prevents you from trying to trade reversals in ranging markets where mean reversion strategies fail. ADX below 20 with extreme RSI readings typically results in continued chop rather than reversals.
What This Indicator Does Not Do Well
The multi-timeframe data requests can cause slight delays on lower-end computers or slow internet connections. If you are running multiple indicators simultaneously, you might notice brief calculation lags.
Divergence detection requires at least 10-15 bars of history to identify pivot points accurately. On brand new charts or immediately after timeframe changes, divergence signals may be absent for several bars.
The Laguerre filtering, while reducing lag, can occasionally produce false signals during extreme volatility spikes like news releases or market opens. The smoothing cannot completely eliminate noise during truly chaotic conditions.
Dynamic thresholds work well most of the time but can occasionally adapt too slowly during rapid volatility regime changes. If ATR suddenly doubles, it might take 5-10 bars for the thresholds to fully adjust.
The indicator uses significant processing power with five timeframe requests plus all the calculations for volatility, volume analysis, divergences, and signal scoring. On very low timeframes like 1-second or tick charts, this could cause performance issues.
There is no built-in backtesting functionality. You can see historical signals on the chart, but you cannot generate statistical performance reports without exporting data and analyzing it separately.
Best Use Cases
This indicator excels for scalpers and day traders who need fast, reliable RSI signals with proper context. The reduced lag from Laguerre filtering combined with volume confirmation catches reversals quickly enough to matter on 1-5 minute charts.
Swing traders benefit from the multi-timeframe alignment feature. Before entering a multi-day position, you can verify that momentum is aligned across your entry timeframe, swing timeframe, and position timeframe. This significantly improves win rates.
Range traders can use the dynamic thresholds and volatility analysis to identify when markets are coiling up for breakout moves. Contracting volatility with neutral RSI readings often precedes the best trending moves.
The divergence detection with strength calculations makes this valuable for reversal traders. Instead of taking every divergence, you can filter for only high-strength divergences above 60% for better risk-reward setups.
What This Is Not
This is not a standalone trading system. It provides momentum analysis and signal quality scoring, but you still need proper risk management, position sizing, and confluence with price action or other technical factors.
This is not a high-frequency trading tool. While the Laguerre filtering reduces lag, it is not designed for sub-second timeframes or algorithmic trading where microseconds matter.
This is not a volatility prediction system. It measures current and recent volatility states, but it cannot forecast whether volatility will expand or contract in the future beyond basic statistical tendencies.
This is not a replacement for understanding market structure. RSI divergences and extreme readings mean different things at major support and resistance versus in the middle of nowhere. You need context.
Technical Details Worth Knowing
The Laguerre filter uses a gamma parameter that you can adjust. Higher gamma values (0.8-0.9) produce smoother lines with more lag. Lower values (0.5-0.6) respond faster but with more noise. The default of 0.7 balances both reasonably well.
The three RSI lengths serve different purposes. The 5-period catches very short-term momentum for scalping. The 14-period is standard for swing trading. The 21-period keeps you aligned with longer-term trends. You can adjust these based on your trading timeframe.
ATR normalization divides current ATR by a 50-period moving average of ATR. This creates a volatility factor that adjusts thresholds dynamically. When volatility doubles, overbought might move from 70 to 85 automatically.
Volume delta is calculated as volume times the percentage where price closed within the bar's range. An up-close at the high gets full positive delta. A down-close at the low gets full negative delta. This approximates buying and selling pressure without tick data.
Signal strength scoring uses weighted factors. Trend direction gets 30% weight, momentum gets 20%, volume confirmation 15%, divergence presence 15%, ADX strength 10%, and timeframe alignment 10%. This creates a 0-100 composite score.
ADX calculation uses the standard Wilder smoothing method with directional movement indicators. The trend classification shows whether bulls or bears have control, while the strength rating (weak, moderate, strong, extreme) tells you how much conviction is behind the move.
Final Assessment
This is a well-designed RSI indicator that adds genuine value beyond what basic RSI provides. The Laguerre filtering works as advertised for lag reduction. The multi-timeframe analysis saves time and provides clarity. The dynamic thresholds adapt intelligently to changing volatility.
The signal scoring system is particularly useful because it prevents you from chasing low-quality setups. A 35% confidence score tells you immediately that something is wrong with the trade even if RSI looks tempting.
However, this is definitely not a beginner indicator. There are a lot of moving parts and the learning curve is real. You need to understand RSI basics, divergences, volume analysis, and volatility regimes to use this effectively. Someone new to trading would be overwhelmed.
For experienced traders who already understand momentum indicators and want more sophisticated analysis, this is legitimately valuable. The combination of features is not commonly found in free indicators, and the implementation quality is solid.
The main limitation is that it is still just an RSI indicator at its core. No amount of filtering, multi-timeframe analysis, or scoring can overcome the fundamental limitations of oscillator-based trading. You need confluence with price action, support and resistance, and proper market context.
If you trade primarily based on momentum and reversals, this indicator provides most of what you would need in one package. If you are a pure price action trader or trend follower, this probably would not change your approach significantly.
Overall, this is a 7.5 out of 10 indicator. It does what it claims to do well, adds meaningful improvements over basic RSI, and provides useful analysis tools. It is not revolutionary, but it is a solid professional-grade tool for the right type of trader.

SigmaKernel - AdaptiveSigmaKernel - Adaptive Self-Optimizing Multi-Factor Trading System
SigmaKernel - Adaptive is a self-learning algorithmic trading strategy that combines four distinct analytical dimensions—momentum, market structure, volume flow, and reversal patterns—within a machine-learning-inspired framework that continuously adjusts its own parameters based on realized trading performance. Unlike traditional fixed-parameter strategies that maintain static weightings regardless of market conditions or results, this system implements a feedback loop that tracks which signal types, directional biases, and market conditions produce profitable outcomes, then mathematically adjusts component weightings, minimum score thresholds, position sizing multipliers, and trade spacing requirements to optimize future performance.
The strategy is designed for futures traders operating on prop firm accounts or live capital, incorporating realistic execution mechanics including configurable entry modes (stop breakout orders, limit pullback entries, or market-on-open), commission structures calibrated to retail futures contracts ($0.62 per contract default), one-tick slippage modeling, and professional risk controls including trailing drawdown guards, daily loss limits, and weekly profit targets. The system features universal futures compatibility—it automatically detects and adapts to any futures contract by reading the instrument's tick size and point value directly from the chart, eliminating the need for manual configuration across different markets.
What Makes This Approach Different
Adaptive Weight Optimization System
The core differentiation is the adaptive learning architecture. The strategy maintains four independent scoring components: momentum analysis (using RSI multi-timeframe, MACD histogram, and DMI/ADX), market structure detection (breakout identification via pivot-based support/resistance and moving average positioning), volume flow analysis (Volume Price Trend indicator with standard deviation confirmation), and reversal pattern recognition (oversold/overbought conditions combined with structural levels).
Each component generates a directional score that is multiplied by its current weight. After every closed trade, the system performs a retrospective analysis on the last N trades (configurable Learning Period, default 15 trades) to calculate win rates for each signal type independently. For example, if momentum-driven trades won 65% of the time while reversal trades won only 35%, the adaptive algorithm increases the momentum weight and decreases the reversal weight proportionally. The adjustment formula is:
New_Weight = Current_Weight + (Component_Win_Rate - Average_Win_Rate) × Adaptation_Speed
This creates a self-correcting mechanism where successful signal generators receive more influence in future composite scores, while underperforming components are de-emphasized. The system separately tracks long versus short win rates and applies directional bias corrections—if shorts consistently outperform longs, the strategy applies a 10% reduction to bullish signals to prevent fighting the prevailing market character.
Dynamic Parameter Adjustment
Beyond component weightings, three critical strategy parameters self-adjust based on performance:
Minimum Signal Score: The threshold required to trigger a trade. If overall win rate falls below 45%, the system increments this threshold by 0.10 per adjustment cycle, making the strategy more selective. If win rate exceeds 60%, the threshold decreases to allow more opportunities. This prevents the strategy from overtrading during unfavorable conditions and capitalizes on high-probability environments.
Risk Multiplier: Controls position sizing aggression. When drawdown exceeds 5%, risk per trade reduces by 10% per cycle. When drawdown falls below 2%, risk increases by 5% per cycle. This implements the professional risk management principle of "bet small when losing, bet bigger when winning" algorithmically.
Bars Between Trades: Spacing filter to prevent overtrading. Base value (default 9 bars) multiplies by drawdown factor and losing streak factor. During drawdown or consecutive losses, spacing expands up to 2x to allow market conditions to change before re-entering.
All adaptation operates during live forward-testing or real trading—there is no in-sample optimization applied to historical data. The system learns solely from its own realized trades.
Universal Futures Compatibility
The strategy implements universal futures instrument detection that automatically adapts to any futures contract without requiring manual configuration. Instead of hardcoding specific contract specifications, the system reads three critical values directly from TradingView's symbol information:
Tick Size Detection: Uses `syminfo.mintick` to obtain the minimum price increment for the current instrument. This value varies widely across markets—ES trades in 0.25 ticks, crude oil (CL) in 0.01 ticks, gold (GC) in 0.10 ticks, and treasury futures (ZB) in increments of 1/32nds. The strategy adapts all entry buffer calculations and stop placement logic to the detected tick size.
Point Value Detection: Uses `syminfo.pointvalue` to determine the dollar value per full point of price movement. For ES, one point equals $50; for crude oil, one point equals $1,000; for gold, one point equals $100. This automatic detection ensures accurate P&L calculations and risk-per-contract measurements across all instruments.
Tick Value Calculation: Combines tick size and point value to compute dollar value per tick: Tick_Value = Tick_Size × Point_Value. This derived value drives all position sizing calculations, ensuring the risk management system correctly accounts for each instrument's economic characteristics.
This universal approach means the strategy functions identically on emini indices (ES, MES, NQ, MNQ), micro indices, energy contracts (CL, NG, RB), metals (GC, SI, HG), agricultural futures (ZC, ZS, ZW), treasury futures (ZB, ZN, ZF), currency futures (6E, 6J, 6B), and any other futures contract available on TradingView. No parameter adjustments or instrument-specific branches exist in the code—the adaptation happens automatically through symbol information queries.
Stop-Out Rate Monitoring System
The strategy includes an intelligent stop-out rate tracking system that monitors the percentage of your last 20 trades (or available trades if fewer than 20) that were stopped out. This metric appears in the dashboard's Performance section with color-coded guidance:
Green (<30% stop-out rate): Very few trades are being stopped out. This suggests either your stops are too loose (giving back profits on reversals) or you're in an exceptional trending market. Consider tightening your Stop Loss ATR multiplier to lock in profits more efficiently.
Orange (30-65% stop-out rate): Healthy range. Your stop placement is appropriately sized for current market conditions and the strategy's risk-reward profile. No adjustment needed.
Red (>65% stop-out rate): Too many trades are being stopped out prematurely. Your stops are likely too tight for the current volatility regime. Consider widening your Stop Loss ATR multiplier to give trades more room to develop.
Critical Design Philosophy: Unlike some systems that automatically adjust stops based on performance statistics, this strategy intentionally keeps stop-loss control in the user's hands. Automatic stop adjustment creates dangerous feedback loops—widening stops increases risk per contract, which forces position size reduction, which distorts performance metrics, leading to incorrect adaptations. Instead, the dashboard provides visibility into stop performance, empowering you to make informed manual adjustments when warranted. This preserves the integrity of the adaptive system while giving you the critical data needed for stop optimization.
Execution Kernel Architecture
The entry system offers three distinct execution modes to match trader preference and market character:
StopBreakout Mode: Places buy-stop orders above the prior bar's high (for longs) or sell-stop orders below the prior bar's low (for shorts), plus a 2-tick buffer. This ensures entries only occur when price confirms directional momentum by breaking recent structure. Ideal for trending and momentum-driven markets.
LimitPullback Mode: Places limit orders at a pullback price calculated as: Entry_Price = Close - (ATR × Pullback_Multiplier) for longs, or Close + (ATR × Pullback_Multiplier) for shorts. Default multiplier is 0.5 ATR. This waits for mean-reversion before entering in the signal direction, capturing better prices in volatile or oscillating markets.
MarketNextOpen Mode: Executes at market on the bar immediately following signal generation. This provides fastest execution but sacrifices the filtering effect of requiring price confirmation.
All pending entry orders include a configurable Time-To-Live (TTL, default 6 bars). If an order is not filled within the TTL period, it cancels automatically to prevent stale signals from executing in changed market conditions.
Professional Exit Management
The exit system implements a three-stage progression: initial stop loss, breakeven adjustment, and dynamic trailing stop.
Initial Stop Loss: Calculated as entry price ± (ATR × User_Stop_Multiplier × Volatility_Adjustment). Users have direct control via the Stop Loss ATR multiplier (default 1.25). The system then applies volatility regime adjustments: ×1.2 in high-volatility environments (stops automatically widen), ×0.8 in low volatility (stops tighten), ×1.0 in normal conditions. This ensures stops adapt to market character while maintaining user control over baseline risk tolerance.
Breakeven Trigger: When profit reaches a configurable multiple of initial risk (default 1.0R), the stop loss automatically moves to breakeven (entry price). This locks in zero-loss status once the trade demonstrates favorable movement.
Trailing Stop Activation: When profit reaches the Trail_Trigger_R multiple (default 1.2R), the system cancels the fixed stop and activates a dynamic trailing stop. The trail uses Step and Offset parameters defined in R-multiples. For example, with Trail_Offset_R = 1.0 and Trail_Step_R = 1.5, the stop trails 1.0R behind price and moves in 1.5R increments. This captures extended moves while protecting accumulated profit.
Additional failsafes include maximum time-in-trade (exits after N bars if specified) and end-of-session flatten (automatically closes all positions X minutes before session end to avoid overnight exposure).
Core Calculation Methodology
Signal Component Scoring
Momentum Component:
- Calculates 14-period DMI (Directional Movement Index) with ADX strength filter (trending when ADX > 25)
- Computes three RSI timeframes: fast (7-period), medium (14-period), slow (21-period)
- Analyzes MACD (12/26/9) histogram for directional acceleration
- Bullish momentum: uptrend (DI+ > DI- with ADX > 25) + MACD histogram rising above zero + RSI fast between 50-80 = +1.6 score
- Bearish momentum: downtrend (DI- > DI+ with ADX > 25) + MACD histogram falling below zero + RSI fast between 20-50 = -1.6 score
- Score multiplies by volatility adjustment factor: ×0.8 in high volatility (momentum less reliable), ×1.2 in low volatility (momentum more persistent)
Structure Component:
- Identifies swing highs and lows using 10-bar pivot lookback on both sides
- Maintains most recent swing high as dynamic resistance, most recent swing low as dynamic support
- Detects breakouts: bullish when close crosses above resistance with prior bar below; bearish when close crosses below support with prior bar above
- Breakout score: ±1.0 for confirmed break
- Moving average alignment: +0.5 when price > SMA20 > SMA50 (bullish structure); -0.5 when price < SMA20 < SMA50 (bearish structure)
- Total structure range: -1.5 to +1.5
Volume Component:
- Calculates Volume Price Trend: VPT = Σ [(Close - Close ) / Close × Volume]
- Compares VPT to its 10-period EMA as signal line (similar to MACD logic)
- Computes 20-period volume moving average and standard deviation
- High volume event: current volume > (volume_average + 1× std_dev)
- Bullish volume: VPT > VPT_signal AND high_volume = +1.0
- Bearish volume: VPT < VPT_signal AND high_volume = -1.0
- No score if volume is not elevated (filters out low-conviction moves)
Reversal Component:
- Identifies extreme RSI conditions: RSI slow < 30 (oversold) or > 70 (overbought)
- Requires structural confluence: price at or below support level for bullish reversal; at or above resistance for bearish reversal
- Requires momentum shift: RSI fast must be rising (for bull) or falling (for bear) to confirm reversal in progress
- Bullish reversal: RSI < 30 AND price ≤ support AND RSI rising = +1.0
- Bearish reversal: RSI > 70 AND price ≥ resistance AND RSI falling = -1.0
Composite Score Calculation
Final_Score = (Momentum × Weight_M) + (Structure × Weight_S) + (Volume × Weight_V) + (Reversal × Weight_R)
Initial weights: Momentum = 1.0, Structure = 1.2, Volume = 0.8, Reversal = 0.6
These weights adapt after each trade based on component-specific performance as described above.
The system also applies directional bias adjustment: if recent long trades have significantly lower win rate than shorts, bullish scores multiply by 0.9 to reduce aggressive long entries. Vice versa for underperforming shorts.
Position Sizing Algorithm
The position sizing calculation incorporates multiple confidence factors and automatically scales to any futures contract:
1. Base risk amount = Account_Size × Base_Risk_Percent × Adaptive_Risk_Multiplier
2. Stop distance in price units = ATR × User_Stop_Multiplier × Volatility_Regime_Multiplier × Entry_Buffer
3. Risk per contract = Stop_Distance × Dollar_Per_Point (automatically detected from instrument)
4. Raw position size = Risk_Amount / Risk_Per_Contract
Then applies confidence scaling:
- Signal confidence = min(|Weighted_Score| / Min_Score_Threshold, 2.0) — higher scores receive larger size, capped at 2×
- Direction confidence = Long_Win_Rate (for bulls) or Short_Win_Rate (for bears)
- Type confidence = Win_Rate of dominant signal type (momentum/structure/volume/reversal)
- Total confidence = (Signal_Confidence + Direction_Confidence + Type_Confidence) / 3
Adjusted size = Raw_Size × Total_Confidence × Losing_Streak_Reduction
Losing streak reduction = 0.5 if losing_streak ≥ 5, otherwise 1.0
Universal Maximum Position Calculation: Instead of hardcoded limits per instrument, the system calculates maximum position size as: Max_Contracts = Account_Size / 25000, clamped between 1 and 10 contracts. This means a $50,000 account allows up to 2 contracts, a $100,000 account allows up to 4 contracts, regardless of which futures contract is being traded. This universal approach maintains consistent risk exposure across different instruments while preventing overleveraging.
Final size is rounded to integer and bounded by the calculated maximum.
Session and Risk Management System
Timezone-Aware Session Control
The strategy implements timezone-correct session filtering. Users specify session start hour, end hour, and timezone from 12 supported zones (New York, Chicago, Los Angeles, London, Frankfurt, Moscow, Tokyo, Hong Kong, Shanghai, Singapore, Sydney, UTC). The system converts bar timestamps to the selected timezone before applying session logic.
For split sessions (e.g., Asian session 18:00-02:00), the logic correctly handles time wraparound. Weekend trading can be optionally disabled (default: disabled) to avoid low-liquidity weekend price action.
Multi-Layer Risk Controls
Daily Loss Limit: Strategy ceases all new entries when daily P&L reaches negative threshold (default $2,000). This prevents catastrophic drawdown days. Resets at timezone-corrected day boundary.
Weekly Profit Target: Strategy ceases trading when weekly profit reaches target (default $10,000). This implements the professional principle of "take the win and stop pushing luck." Resets on timezone-corrected Monday.
Maximum Daily Trades: Hard cap on entries per day (default 20) to prevent overtrading during volatile conditions when many signals may generate.
Trailing Drawdown Guard: Optional prop-firm-style trailing stop on account equity. When enabled, if equity drops below (Peak_Equity - Trailing_DD_Amount), all trading halts. This simulates the common prop firm rule where exceeding trailing drawdown results in account termination.
All limits display status in the real-time dashboard, showing "MAX LOSS HIT", "WEEKLY TARGET MET", or "ACTIVE" depending on current state.
How To Use This Strategy
Initial Setup
1. Apply the strategy to your desired futures chart (tested on 5-minute through daily timeframes)
2. The strategy will automatically detect your instrument's specifications—no manual configuration needed for different contracts
3. Configure your account size and risk parameters in the Core Settings section
4. Set your trading session hours and timezone to match your availability
5. Adjust the Stop Loss ATR multiplier based on your risk tolerance (0.8-1.2 for tighter stops, 1.5-2.5 for wider stops)
6. Select your preferred entry execution mode (recommend StopBreakout for beginners)
7. Enable adaptation (recommended) or disable for fixed-parameter operation
8. Review the strategy's Properties in the Strategy Tester settings and verify commission/slippage match your broker's actual costs
The universal futures detection means you can switch between ES, NQ, CL, GC, ZB, or any other futures contract without changing any strategy parameters—the system will automatically adapt its calculations to each instrument's unique specifications.
Dashboard Interpretation
The strategy displays a comprehensive real-time dashboard in the top-right corner showing:
Market State Section:
- Trend: Shows UPTREND/DOWNTREND/CONSOLIDATING/NEUTRAL based on ADX and DMI analysis
- ADX Value: Current trend strength (>25 = strong trend, <20 = consolidating)
- Momentum: BULL/BEAR/NEUTRAL classification with current momentum score
- Volatility: HIGH/LOW/NORMAL regime with ATR percentage of price
Volume Profile Section (Large dashboard only):
- VPT Flow: Directional bias from volume analysis
- Volume Status: HIGH/LOW/NORMAL with relative volume multiplier
Performance Section:
- Daily P&L: Current day's profit/loss with color coding
- Daily Trades: Number of completed trades today
- Weekly P&L: Current week's profit/loss
- Target %: Progress toward weekly profit target
- Stop-Out Rate: Percentage of last 20 trades (or available trades if <20) that were stopped out. Includes all stop types: initial stops, breakeven stops, trailing stops, timeout exits, and EOD flattens. Color coded with actionable guidance:
- Green (<30%): Shows "TIGHTEN" guidance. Very few stop-outs suggests stops may be too loose or exceptional market conditions. Consider reducing Stop Loss ATR multiplier.
- Orange (30-65%): Shows "OK" guidance. Healthy stop-out rate indicating appropriate stop placement for current conditions.
- Red (>65%): Shows "WIDEN" guidance. Too many premature stop-outs. Consider increasing Stop Loss ATR multiplier to give trades more room.
- Status: Overall trading status (ACTIVE/MAX LOSS HIT/WEEKLY TARGET MET/FILTERS ACTIVE)
Adaptive Engine Section:
- Min Score: Current minimum threshold for trade entry (higher = more selective)
- Risk Mult: Current position sizing multiplier (adjusts with performance)
- Bars BTW: Current minimum bars required between trades
- Drawdown: Current drawdown percentage from equity peak
- Weights: M/S/V/R showing current component weightings
Win Rates Section:
- Type: Win rates for Momentum, Structure, Volume, Reversal signal types
- Direction: Win rates for Long vs Short trades
Color coding shows green for >50% win rate, red for <50%
Session Info Section:
- Session Hours: Active trading window with timezone
- Weekend Trading: ENABLED/DISABLED status
- Session Status: ACTIVE/INACTIVE based on current time
Signal Generation and Entry
The strategy generates entries when the weighted composite score exceeds the adaptive minimum threshold (initial value configurable, typically 1.5 to 2.5). Entries display as layered triangle markers on the chart:
- Long Signal: Three green upward triangles below the entry bar
- Short Signal: Three red downward triangles above the entry bar
Triangle tooltip shows the signal score and dominant signal type (MOMENTUM/STRUCTURE/VOLUME/REVERSAL).
Position Management and Stop Optimization
Once entered, the strategy automatically manages the position through its three-stage exit system. Monitor the Stop-Out Rate metric in the dashboard to optimize your stop placement:
If Stop-Out Rate is Green (<30%): You're rarely being stopped out. This could mean:
- Your stops are too loose, allowing trades to give back too much profit on reversals
- You're in an exceptional trending market where tight stops would work better
- Action: Consider reducing your Stop Loss ATR multiplier by 0.1-0.2 to tighten stops and lock in profits more efficiently
If Stop-Out Rate is Orange (30-65%): Optimal range. Your stops are appropriately sized for the strategy's risk-reward profile and current market volatility. No adjustment needed.
If Stop-Out Rate is Red (>65%): You're being stopped out too frequently. This means:
- Your stops are too tight for current market volatility
- Trades need more room to develop before reaching profit targets
- Action: Increase your Stop Loss ATR multiplier by 0.1-0.3 to give trades more breathing room
Remember: The stop-out rate calculation includes all exit types (initial stops, breakeven stops, trailing stops, timeouts, EOD flattens). A trade that reaches breakeven and gets stopped out at entry price counts as a stop-out, even though it didn't lose money. This is intentional—it indicates the stop placement didn't allow the trade to develop into profit.
Optimization Workflow
For traders wanting to customize the strategy for their specific instrument and timeframe:
Week 1-2: Run with defaults, adaptation enabled
Allow the system to execute at least 30-50 trades (the Learning Period plus additional buffer). Monitor which session periods, signal types, and market conditions produce the best results. Observe your stop-out rate—if it's consistently red or green, plan to adjust Stop Loss ATR multiplier after the learning period. Do not adjust parameters yet—let the adaptive system establish baseline performance data.
Week 3-4: Analyze adaptation behavior and optimize stops
Review the dashboard's adaptive weights and win rates. If certain signal types consistently show <40% win rate, consider slightly reducing their base weight. If a particular entry mode produces better fill quality and win rate, switch to that mode. If you notice the minimum score threshold has climbed very high (>3.0), market conditions may not suit the strategy's logic—consider switching instruments or timeframes.
Based on your Stop-Out Rate observations:
- Consistently <30%: Reduce Stop Loss ATR multiplier by 0.2-0.3
- Consistently >65%: Increase Stop Loss ATR multiplier by 0.2-0.4
- Oscillating between zones: Leave stops at default and let volatility regime adjustments handle it
Ongoing: Fine-tune risk and execution
Adjust the following based on your risk tolerance and account type:
- Base Risk Per Trade: 0.5% for conservative, 0.75% for moderate, 1.0% for aggressive
- Stop Loss ATR Multiplier: 0.8-1.2 for tight stops (scalping), 1.5-2.5 for wide stops (swing trading)
- Bars Between Trades: Lower (5-7) for more opportunities, higher (12-20) for more selective
- Entry Mode: Experiment between modes to find best fit for current market character
- Session Hours: Narrow to specific high-performance session windows if certain hours consistently underperform
Never adjust: Do not manually modify the adaptive weights, minimum score, or risk multiplier after the system has begun learning. These parameters are self-optimizing and manual interference defeats the adaptive mechanism.
Parameter Descriptions and Optimization Guidelines
Adaptive Intelligence Group
Enable Self-Optimization (default: true): Master switch for the adaptive learning system. When enabled, component weights, minimum score, risk multiplier, and trade spacing adjust based on realized performance. Disable to run the strategy with fixed parameters (useful for comparing adaptive vs non-adaptive performance).
Learning Period (default: 15 trades): Number of most recent trades to analyze for performance calculations. Shorter values (10-12) adapt more quickly to recent conditions but may overreact to variance. Longer values (20-30) produce more stable adaptations but respond slower to regime changes. For volatile markets, use shorter periods. For stable trends, use longer periods.
Adaptation Speed (default: 0.25): Controls the magnitude of parameter adjustments per learning cycle. Lower values (0.05-0.15) make gradual, conservative changes. Higher values (0.35-0.50) make aggressive adjustments. Faster adaptation helps in rapidly changing markets but increases parameter instability. Start with default and increase only if you observe the system failing to adapt quickly enough to obvious performance patterns.
Performance Memory (default: 100 trades): Maximum number of historical trades stored for analysis. This array size does not affect learning (which uses only Learning Period trades) but provides data for future analytics features including stop-out rate tracking. Higher values consume more memory but provide richer historical dataset. Typical users should not need to modify this.
Core Settings Group
Account Size (default: $50,000): Starting capital for position sizing calculations. This should match your actual account size for accurate risk per trade. The strategy uses this value to calculate dollar risk amounts and determine maximum position size (1 contract per $25,000).
Weekly Profit Target (default: $10,000): When weekly P&L reaches this value, the strategy stops taking new trades for the remainder of the week. This implements a "quit while ahead" rule common in professional trading. Set to a realistic weekly goal—20% of account size per week ($10K on $50K) is very aggressive; 5-10% is more sustainable.
Max Daily Loss (default: $2,000): When daily P&L reaches this negative threshold, strategy stops all new entries for the day. This is your maximum acceptable daily loss. Professional traders typically set this at 2-4% of account size. A $2,000 loss on a $50,000 account = 4%.
Base Risk Per Trade % (default: 0.5%): Initial percentage of account to risk on each trade before adaptive multiplier and confidence scaling. 0.5% is conservative, 0.75% is moderate, 1.0-1.5% is aggressive. Remember that actual risk per trade = Base Risk × Adaptive Risk Multiplier × Confidence Factors, so the realized risk will vary.
Trade Filters Group
Base Minimum Signal Score (default: 1.5): Initial threshold that composite weighted score must exceed to generate a signal. Lower values (1.0-1.5) produce more trades with lower average quality. Higher values (2.0-3.0) produce fewer, higher-quality setups. This value adapts automatically when adaptive mode is enabled, but the base sets the starting point. For trending markets, lower values work well. For choppy markets, use higher values.
Base Bars Between Trades (default: 9): Minimum bars that must elapse after an entry before another signal can trigger. This prevents overtrading and allows previous trades time to develop. Lower values (3-6) suit scalping on lower timeframes. Higher values (15-30) suit swing trading on higher timeframes. This value also adapts based on drawdown and losing streaks.
Max Daily Trades (default: 20): Hard limit on total trades per day regardless of signal quality. This prevents runaway trading during extremely volatile days when many signals may generate. For 5-minute charts, 20 trades/day is reasonable. For 1-hour charts, 5-10 trades/day is more typical.
Session Group
Session Start Hour (default: 5): Hour (0-23 format) when trading is allowed to begin, in the timezone specified. For US futures trading in Chicago time, session typically starts at 5:00 or 6:00 PM (17:00 or 18:00) Sunday evening.
Session End Hour (default: 17): Hour when trading stops and no new entries are allowed. For US equity index futures, regular session ends at 4:00 PM (16:00) Central Time.
Allow Weekend Trading (default: false): Whether strategy can trade on Saturday/Sunday. Most futures have low volume on weekends; keeping this disabled is recommended unless you specifically trade Sunday evening open.
Session Timezone (default: America/Chicago): Timezone for session hour interpretation. Select your local timezone or the timezone of your instrument's primary exchange. This ensures session logic aligns with your intended trading hours.
Prop Guards Group
Trailing Drawdown Guard (default: false): Enables prop-firm-style trailing maximum drawdown. When enabled, if equity drops below (Peak Equity - Trailing DD Amount), all trading halts for the remainder of the backtest/live session. This simulates rules used by funded trader programs where exceeding trailing drawdown terminates the account.
Trailing DD Amount (default: $2,500): Dollar amount of drawdown allowed from equity peak. If your equity reaches $55,000, the trailing stop sets at $52,500. If equity then drops to $52,499, the guard triggers and trading ceases.
Execution Kernel Group
Entry Mode (default: StopBreakout):
- StopBreakout: Places stop orders above/below signal bar requiring price confirmation
- LimitPullback: Places limit orders at pullback prices seeking better fills
- MarketNextOpen: Executes immediately at market on next bar
Limit Offset (default: 0.5x ATR): For LimitPullback mode, how far below/above current price to place the limit order. Smaller values (0.3-0.5) seek minor pullbacks. Larger values (0.8-1.2) wait for deeper retracements but may miss trades.
Entry TTL (default: 6 bars, 0=off): Bars an entry order remains pending before cancelling. Shorter values (3-4) keep signals fresh. Longer values (8-12) allow more time for fills but risk executing stale signals. Set to 0 to disable TTL (orders remain active indefinitely until filled or opposite signal).
Exits Group
Stop Loss (default: 1.25x ATR): Base stop distance as a multiple of the 14-period ATR. This is your primary risk control parameter and directly impacts your stop-out rate. Lower values (0.8-1.0) create tighter stops that reduce risk per trade but may get stopped out prematurely in volatile conditions—expect stop-out rates above 65% (red zone). Higher values (1.5-2.5) give trades more room to breathe but increase risk per contract—expect stop-out rates below 30% (green zone). The system applies additional volatility regime adjustments on top of this base: ×1.2 in high volatility environments (stops widen automatically), ×0.8 in low volatility (stops tighten), ×1.0 in normal conditions. For scalping on lower timeframes, use 0.8-1.2. For swing trading on higher timeframes, use 1.5-2.5. Monitor the Stop-Out Rate metric in the dashboard and adjust this parameter to keep it in the healthy 30-65% orange zone.
Move to Breakeven at (default: 1.0R): When profit reaches this multiple of initial risk, stop moves to breakeven. 1.0R means after price moves in your favor by the distance you risked, you're protected at entry price. Lower values (0.5-0.8R) lock in breakeven faster. Higher values (1.5-2.0R) allow more room before protection.
Start Trailing at (default: 1.2R): When profit reaches this multiple, the fixed stop transitions to a dynamic trailing stop. This should be greater than the BE trigger. Values typically range 1.0-2.0R depending on how much profit you want secured before trailing activates.
Trail Offset (default: 1.0R): How far behind price the trailing stop follows. Tighter offsets (0.5-0.8R) protect profit more aggressively but may exit prematurely. Wider offsets (1.5-2.5R) allow more room for profit to run but risk giving back more on reversals.
Trail Step (default: 1.5R): How far price must move in profitable direction before the stop advances. Smaller steps (0.5-1.0R) move the stop more frequently, tightening protection continuously. Larger steps (2.0-3.0R) move the stop less often, giving trades more breathing room.
Max Bars In Trade (default: 0=off): Maximum bars allowed in a position before forced exit. This prevents trades from "going stale" during periods of no meaningful price action. For 5-minute charts, 50-100 bars (4-8 hours) is reasonable. For daily charts, 5-10 bars (1-2 weeks) is typical. Set to 0 to disable.
Flatten near Session End (default: true): Whether to automatically close all positions as session end approaches. Recommended to avoid carrying positions into off-hours with low liquidity.
Minutes before end (default: 5): How many minutes before session end to flatten. 5-15 minutes provides buffer for order execution before the session boundary.
Visual Effects Configuration Group
Dashboard Size (default: Normal): Controls information density in the dashboard. Small shows only critical metrics (excludes stop-out rate). Normal shows comprehensive data including stop-out rate. Large shows all available metrics including weights, session info, and volume analysis. Larger sizes consume more screen space but provide complete visibility.
Show Quantum Field (default: true): Displays animated grid pattern on the chart indicating market state. Disable if you prefer cleaner charts or experience performance issues on lower-end hardware.
Show Wick Pressure Lines (default: true): Draws dynamic lines from bars with extreme wicks, indicating potential support/resistance or liquidity absorption zones. Disable for simpler visualization.
Show Morphism Energy Beams (default: true): Displays directional beams showing momentum energy flow. Beams intensify during strong trends. Disable if you find this visually distracting.
Show Order Flow Clouds (default: true): Draws translucent boxes representing volume flow bullish/bearish bias. Disable for cleaner price action visibility.
Show Fractal Grid (default: true): Displays multi-timeframe support/resistance levels based on fractal price structure at 10/20/30/40/50 bar periods. Disable if you only want to see primary pivot levels.
Glow Intensity (default: 4): Controls the brightness and thickness of visual effects. Lower values (1-2) for subtle visualization. Higher values (7-10) for maximum visibility but potentially cluttered charts.
Color Theme (default: Cyber): Visual color scheme. Cyber uses cyan/magenta futuristic colors. Quantum uses aqua/purple. Matrix uses green/red terminal style. Aurora uses pastel pink/purple gradient. Choose based on personal preference and monitor calibration.
Show Watermark (default: true): Displays animated watermark at bottom of chart with creator credit and current P&L. Disable if you want completely clean charts or need screen space.
Performance Characteristics and Best Use Cases
Optimal Conditions
This strategy performs best in markets exhibiting:
Trending phases with periodic pullbacks: The combination of momentum and structure components excels when price establishes directional bias but provides retracement opportunities for entries. Markets with 60-70% trending bars and 30-40% consolidation produce the highest win rates.
Medium to high volatility: The ATR-based stop sizing and dynamic risk adjustment require sufficient price movement to generate meaningful profit relative to risk. Instruments with 2-4% daily ATR relative to price work well. Extremely low volatility (<1% daily ATR) generates too many scratch trades.
Clear volume patterns: The VPT volume component adds significant edge when volume expansions align with directional moves. Instruments and timeframes where volume data reflects actual transaction flow (versus tick volume proxies) perform better.
Regular session structure: Futures markets with defined opening and closing hours, consistent liquidity throughout the session, and clear overnight/day session separation allow the session controls and time-based failsafes to function optimally.
Sufficient liquidity for stop execution: The stop breakout entry mode requires that stop orders can fill without significant slippage. Highly liquid contracts work better than illiquid instruments where stop orders may face adverse fills.
Suboptimal Conditions
The strategy may struggle with:
Extreme chop with no directional persistence: When ADX remains below 15 for extended periods and price oscillates rapidly without establishing trends, the momentum component generates conflicting signals. Win rate typically drops below 40% in these conditions, triggering the adaptive system to increase minimum score thresholds until conditions improve. Stop-out rates may also spike into the red zone.
Gap-heavy instruments: Markets with frequent overnight gaps disrupt the continuous price assumptions underlying ATR stops and EMA-based structure analysis. Gaps can also cause stop orders to fill at prices far from intended levels, distorting stop-out rate metrics.
Very low timeframes with excessive noise: On 1-minute or tick charts, the signal components react to micro-structure noise rather than meaningful price swings. The strategy works best on 5-minute through daily timeframes where price movements reflect actual order flow shifts.
Extended low-volatility compression: During historically low volatility periods, profit targets become difficult to reach before mean-reversion occurs. The trail offset, even when set to minimum, may be too wide for the compressed price environment. Stop-out rates may drop to green zone indicating stops should be tightened.
Parabolic moves or climactic exhaustion: Vertical price advances or selloffs where price moves multiple ATRs in single bars can trigger momentum signals at exhaustion points. The structure and reversal components attempt to filter these, but extreme moves may override normal logic.
The adaptive learning system naturally reduces signal frequency and position sizing during unfavorable conditions. If you observe multiple consecutive days with zero trades and "FILTERS ACTIVE" status, this indicates the strategy has self-adjusted to avoid poor conditions rather than forcing trades.
Instrument Recommendations
Emini Index Futures (ES, MES, NQ, MNQ, YM, RTY): Excellent fit. High liquidity, clear volatility patterns, strong volume signals, defined session structure. These instruments have been extensively tested and the universal detection handles all contract specifications automatically.
Micro Index Futures (MES, MNQ, M2K, MYM): Excellent fit for smaller accounts. Same market characteristics as the standard eminis but with reduced contract sizes allowing proper risk management on accounts below $50,000.
Energy Futures (CL, NG, RB, HO): Good to mixed fit. Crude oil (CL) works well due to strong trends and reasonable volatility. Natural gas (NG) can be extremely volatile—consider reducing Base Risk to 0.3-0.4% and increasing Stop Loss ATR multiplier to 1.8-2.2 for NG. The strategy automatically detects the $10/tick value for CL and adjusts position sizing accordingly.
Metal Futures (GC, SI, HG, PL): Good fit. Gold (GC) and silver (SI) exhibit clear trending behavior and work well with the momentum/structure components. The strategy automatically handles the different point values ($100/point for gold, $5,000/point for silver).
Agricultural Futures (ZC, ZS, ZW, ZL): Good fit. Grain futures often trend strongly during seasonal periods. The strategy handles the unique tick sizes (1/4 cent increments) and point values ($50/point for corn/wheat, $60/point for soybeans) automatically.
Treasury Futures (ZB, ZN, ZF, ZT): Good fit for trending rates environments. The strategy automatically handles the fractional tick sizing (32nds for ZB/ZN, halves of 32nds for ZF/ZT) through the universal detection system.
Currency Futures (6E, 6J, 6B, 6A, 6C): Good fit. Major currency pairs exhibit smooth trending behavior. The strategy automatically detects point values which vary significantly ($12.50/tick for 6E, $12.50/tick for 6J, $6.25/tick for 6B).
Cryptocurrency Futures (BTC, ETH, MBT, MET): Mixed fit. These markets have extreme volatility requiring parameter adjustment. Increase Base Risk to 0.8-1.2% and Stop Loss ATR multiplier to 2.0-3.0 to account for wider stop distances. Enable 24-hour trading and weekend trading as these markets have no traditional sessions.
The universal futures compatibility means you can apply this strategy to any of these markets without code modification—simply open the chart of your desired contract and the strategy will automatically configure itself to that instrument's specifications.
Important Disclaimers and Realistic Expectations
This is a sophisticated trading strategy that combines multiple analytical methods within an adaptive framework designed for active traders who will monitor performance and market conditions. It is not a "set and forget" fully automated system, nor should it be treated as a guaranteed profit generator.
Backtesting Realism and Limitations
The strategy includes realistic trading costs and execution assumptions:
- Commission: $0.62 per contract per side (accurate for many retail futures brokers)
- Slippage: 1 tick per entry and exit (conservative estimate for liquid futures)
- Position sizing: Realistic risk percentages and maximum contract limits based on account size
- No repainting: All calculations use confirmed bar data only—signals do not change retroactively
However, backtesting cannot fully capture live trading reality:
- Order fill delays: In live trading, stop and limit orders may not fill instantly at the exact tick shown in backtest
- Volatile periods: During high volatility or low liquidity (news events, rollover days, pre-holidays), slippage may exceed the 1-tick assumption significantly
- Gap risk: The backtest assumes stops fill at stop price, but gaps can cause fills far beyond intended exit levels
- Psychological factors: Seeing actual capital at risk creates emotional pressures not present in backtesting, potentially leading to premature manual intervention
The strategy's backtest results should be viewed as best-case scenarios. Real trading will typically produce 10-30% lower returns than backtest due to the above factors.
Risk Warnings
All trading involves substantial risk of loss. The adaptive learning system can improve parameter selection over time, but it cannot predict future price movements or guarantee profitable performance. Past wins do not ensure future wins.
Losing streaks are inevitable. Even with a 60% win rate, you will encounter sequences of 5, 6, or more consecutive losses due to normal probability distributions. The strategy includes losing streak detection and automatic risk reduction, but you must have sufficient capital to survive these drawdowns.
Market regime changes can invalidate learned patterns. If the strategy learns from 50 trades during a trending regime, then the market shifts to a ranging regime, the adapted parameters may initially be misaligned with the new environment. The system will re-adapt, but this transition period may produce suboptimal results.
Prop firm traders: understand your specific rules. Every prop firm has different rules regarding maximum drawdown, daily loss limits, consistency requirements, and prohibited trading behaviors. While this strategy includes common prop guardrails, you must verify it complies with your specific firm's rules and adjust parameters accordingly.
Never risk capital you cannot afford to lose. This strategy can produce substantial drawdowns, especially during learning periods or market regime shifts. Only trade with speculative capital that, if lost, would not impact your financial stability.
Recommended Usage
Paper trade first: Run the strategy on a simulated account for at least 50 trades or 1 month before committing real capital. Observe how the adaptive system behaves, identify any patterns in losing trades, monitor your stop-out rate trends, and verify your understanding of the entry/exit mechanics.
Start with minimum position sizing: When transitioning to live trading, reduce the Base Risk parameter to 0.3-0.4% initially (vs 0.5-1.0% in testing) to reduce early impact while the system learns your live broker's execution characteristics.
Monitor daily, but do not micromanage: Check the dashboard daily to ensure the strategy is operating normally and risk controls have not triggered unexpectedly. Pay special attention to the Stop-Out Rate metric—if it remains in the red or green zones for multiple days, adjust your Stop Loss ATR multiplier accordingly. However, resist the urge to manually adjust adaptive weights or disable trades based on short-term performance. Allow the adaptive system at least 30 trades to establish patterns before making manual changes.
Combine with other analysis: While this strategy can operate standalone, professional traders typically use systematic strategies as one component of a broader approach. Consider using the strategy for trade execution while applying your own higher-timeframe analysis or fundamental view for trade filtering or sizing adjustments.
Keep a trading journal: Document each week's results, note market conditions (trending vs ranging, high vs low volatility), record stop-out rates and any Stop Loss ATR adjustments you made, and document any manual interventions. Over time, this journal will help you identify conditions where the strategy excels versus struggles, allowing you to selectively enable or disable trading during certain environments.
Technical Implementation Notes
All calculations execute on closed bars only (`calc_on_every_tick=false`) ensuring that signals and values do not repaint. Once a bar closes and a signal generates, that signal is permanent in the history.
The strategy uses fixed-quantity position sizing (`default_qty_type=strategy.fixed, default_qty_value=1`) with the actual contract quantity determined by the position sizing function and passed to the entry commands. This approach provides maximum control over risk allocation.
Order management uses Pine Script's native `strategy.entry()` and `strategy.exit()` functions with appropriate parameters for stops, limits, and trailing stops. All orders include explicit from_entry references to ensure they apply to the correct position.
The adaptive learning arrays (trade_returns, trade_directions, trade_types, trade_hours, trade_was_stopped) are maintained as circular buffers capped at PERFORMANCE_MEMORY size (default 100 trades). When a new trade closes, its data is added to the beginning of the array using `array.unshift()`, and the oldest trade is removed using `array.pop()` if capacity is exceeded. The stop-out tracking system analyzes the trade_was_stopped array to calculate the rolling percentage displayed in the dashboard.
Dashboard rendering occurs only on the confirmed bar (`barstate.isconfirmed`) to minimize computational overhead. The table is pre-created with sufficient rows for the selected dashboard size and cells are populated with current values each update.
Visual effects (fractal grid, wick pressure, morphism beams, order flow clouds, quantum field) recalculate on each bar for real-time chart updates. These are computationally intensive—if you experience chart lag, disable these visual components. The core strategy logic continues to function identically regardless of visual settings.
Timezone conversions use Pine Script's built-in timezone parameter on the `hour()`, `minute()`, and `dayofweek()` functions. This ensures session logic and daily/weekly resets occur at correct boundaries regardless of the chart's default timezone or the server's timezone.
The universal futures detection queries `syminfo.mintick` and `syminfo.pointvalue` on each strategy initialization to obtain the current instrument's specifications. These values remain constant throughout the strategy's execution on a given chart but automatically update when the strategy is applied to a different instrument.
The strategy has been tested on TradingView across timeframes from 5-minute through daily and across multiple futures instrument types including equity indices, energy, metals, agriculture, treasuries, and currencies. It functions identically on all instruments due to the percentage-based risk model and ATR-relative calculations which adapt automatically to price scale and volatility, combined with the universal futures detection system that handles contract-specific specifications.

Luxy Momentum, Trend, Bias and Breakout Indicators V7
TABLE OF CONTENTS
This is Version 7 (V7) - the latest and most optimized release. If you are using any older versions (V6, V5, V4, V3, etc.), it is highly recommended to replace them with V7.
Why This Indicator is Different
Who Should Use This
Core Components Overview
The UT Bot Trading System
Understanding the Market Bias Table
Candlestick Pattern Recognition
Visual Tools and Features
How to Use the Indicator
Performance and Optimization
FAQ
---
### CREDITS & ATTRIBUTION
This indicator implements proven trading concepts using entirely original code developed specifically for this project.
### CONCEPTUAL FOUNDATIONS
• UT Bot ATR Trailing System
- Original concept by @QuantNomad: (search "UT-Bot-Strategy"
- Our version is a complete reimplementation with significant enhancements:
- Volume-weighted momentum adjustment
- Composite stop loss from multiple S/R layers
- Multi-filter confirmation system (swing, %, 2-bar, ZLSMA)
- Full integration with multi-timeframe bias table
- Visual audit trail with freeze-on-touch
- NOTE: No code was copied - this is a complete reimplementation with enhancements.
• Standard Technical Indicators (Public Domain Formulas):
- Supertrend: ATR-based trend calculation with custom gradient fills
- MACD: Gerald Appel's formula with separation filters
- RSI: J. Welles Wilder's formula with pullback zone logic
- ADX/DMI: Custom trend strength formula inspired by Wilder's directional movement concept, reimplemented with volume weighting and efficiency metrics
- ZLSMA: Zero-lag formula enhanced with Hull MA and momentum prediction
### Custom Implementations
- Trend Strength: Inspired by Wilder's ADX concept but using volume-weighted pressure calculation and efficiency metrics (not traditional +DI/-DI smoothing)
- All code implementations are original
### ORIGINAL FEATURES (70%+ of codebase)
- Multi-Timeframe Bias Table with live updates
- Risk Management System (R-multiple TPs, freeze-on-touch)
- Opening Range Breakout tracker with session management
- Composite Stop Loss calculator using 6+ S/R layers
- Performance optimization system (caching, conditional calcs)
- VIX Fear Index integration
- Previous Day High/Low auto-detection
- Candlestick pattern recognition with interactive tooltips
- Smart label and visual management
- All UI/UX design and table architecture
### DEVELOPMENT PROCESS
**AI Assistance:** This indicator was developed over 2+ months with AI assistance (ChatGPT/Claude) used for:
- Writing Pine Script code based on design specifications
- Optimizing performance and fixing bugs
- Ensuring Pine Script v6 compliance
- Generating documentation
**Author's Role:** All trading concepts, system design, feature selection, integration logic, and strategic decisions are original work by the author. The AI was a coding tool, not the system designer.
**Transparency:** We believe in full disclosure - this project demonstrates how AI can be used as a powerful development tool while maintaining creative and strategic ownership.
---
1. WHY THIS INDICATOR IS DIFFERENT
Most traders use multiple separate indicators on their charts, leading to cluttered screens, conflicting signals, and analysis paralysis. The Suite solves this by integrating proven technical tools into a single, cohesive system.
Key Advantages:
All-in-One Design: Instead of loading 5-10 separate indicators, you get everything in one optimized script. This reduces chart clutter and improves TradingView performance.
Multi-Timeframe Bias Table: Unlike standard indicators that only show the current timeframe, the Bias Table aggregates trend signals across multiple timeframes simultaneously. See at a glance whether 1m, 5m, 15m, 1h are aligned bullish or bearish - no more switching between charts.
Smart Confirmations: The indicator doesn't just give signals - it shows you WHY. Every entry has multiple layers of confirmation (MA cross, MACD momentum, ADX strength, RSI pullback, volume, etc.) that you can toggle on/off.
Dynamic Stop Loss System: Instead of static ATR stops, the SL is calculated from multiple support/resistance layers: UT trailing line, Supertrend, VWAP, swing structure, and MA levels. This creates more intelligent, price-action-aware stops.
R-Multiple Take Profits: Built-in TP system calculates targets based on your initial risk (1R, 1.5R, 2R, 3R). Lines freeze when touched with visual checkmarks, giving you a clean audit trail of partial exits.
Educational Tooltips Everywhere: Every single input has detailed tooltips explaining what it does, typical values, and how it impacts trading. You're not guessing - you're learning as you configure.
Performance Optimized: Smart caching, conditional calculations, and modular design mean the indicator runs fast despite having 15+ features. Turn off what you don't use for even better performance.
No Repainting: All signals respect bar close. Alerts fire correctly. What you see in history is what you would have gotten in real-time.
What Makes It Unique:
Integrated UT Bot + Bias Table: No other indicator combines UT Bot's ATR trailing system with a live multi-timeframe dashboard. You get precision entries with macro trend context.
Candlestick Pattern Recognition with Interactive Tooltips: Patterns aren't just marked - hover over any emoji for a full explanation of what the pattern means and how to trade it.
Opening Range Breakout Tracker: Built-in ORB system for intraday traders with customizable session times and real-time status updates in the Bias Table.
Previous Day High/Low Auto-Detection: Automatically plots PDH/PDL on intraday charts with theme-aware colors. Updates daily without manual input.
Dynamic Row Labels in Bias Table: The table shows your actual settings (e.g., "EMA 10 > SMA 20") not generic labels. You know exactly what's being evaluated.
Modular Filter System: Instead of forcing a fixed methodology, the indicator lets you build your own strategy. Start with just UT Bot, add filters one at a time, test what works for your style.
---
2. WHO WHOULD USE THIS
Designed For:
Intermediate to Advanced Traders: You understand basic technical analysis (MAs, RSI, MACD) and want to combine multiple confirmations efficiently. This isn't a "one-click profit" system - it's a professional toolkit.
Multi-Timeframe Traders: If you trade one asset but check multiple timeframes for confirmation (e.g., enter on 5m after checking 15m and 1h alignment), the Bias Table will save you hours every week.
Trend Followers: The indicator excels at identifying and following trends using UT Bot, Supertrend, and MA systems. If you trade breakouts and pullbacks in trending markets, this is built for you.
Intraday and Swing Traders: Works equally well on 5m-1h charts (day trading) and 4h-D charts (swing trading). Scalpers can use it too with appropriate settings adjustments.
Discretionary Traders: This isn't a black-box system. You see all the components, understand the logic, and make final decisions. Perfect for traders who want tools, not automation.
Works Across All Markets:
Stocks (US, international)
Cryptocurrency (24/7 markets supported)
Forex pairs
Indices (SPY, QQQ, etc.)
Commodities
NOT Ideal For :
Complete Beginners: If you don't know what a moving average or RSI is, start with basics first. This indicator assumes foundational knowledge.
Algo Traders Seeking Black Box: This is discretionary. Signals require context and confirmation. Not suitable for blind automated execution.
Mean-Reversion Only Traders: The indicator is trend-following at its core. While VWAP bands support mean-reversion, the primary methodology is trend continuation.
---
3. CORE COMPONENTS OVERVIEW
The indicator combines these proven systems:
Trend Analysis:
Moving Averages: Four customizable MAs (Fast, Medium, Medium-Long, Long) with six types to choose from (EMA, SMA, WMA, VWMA, RMA, HMA). Mix and match for your style.
Supertrend: ATR-based trend indicator with unique gradient fill showing trend strength. One-sided ribbon visualization makes it easier to see momentum building or fading.
ZLSMA : Zero-lag linear-regression smoothed moving average. Reduces lag compared to traditional MAs while maintaining smooth curves.
Momentum & Filters:
MACD: Standard MACD with separation filter to avoid weak crossovers.
RSI: Pullback zone detection - only enter longs when RSI is in your defined "buy zone" and shorts in "sell zone".
ADX/DMI: Trend strength measurement with directional filter. Ensures you only trade when there's actual momentum.
Volume Filter: Relative volume confirmation - require above-average volume for entries.
Donchian Breakout: Optional channel breakout requirement.
Signal Systems:
UT Bot: The primary signal generator. ATR trailing stop that adapts to volatility and gives clear entry/exit points.
Base Signals: MA cross system with all the above filters applied. More conservative than UT Bot alone.
Market Bias Table: Multi-timeframe dashboard showing trend alignment across 7 timeframes plus macro bias (3-day, weekly, monthly, quarterly, VIX).
Candlestick Patterns: Six major reversal patterns auto-detected with interactive tooltips.
ORB Tracker: Opening range high/low with breakout status (intraday only).
PDH/PDL: Previous day levels plotted automatically on intraday charts.
VWAP + Bands : Session-anchored VWAP with up to three standard deviation band pairs.
---
4. THE UT BOT TRADING SYSTEM
The UT Bot is the heart of the indicator's signal generation. It's an advanced ATR trailing stop that adapts to market volatility.
Why UT Bot is Superior to Fixed Stops:
Traditional ATR stops use a fixed multiplier (e.g., "stop = entry - 2×ATR"). UT Bot is smarter:
It TRAILS the stop as price moves in your favor
It WIDENS during high volatility to avoid premature stops
It TIGHTENS during consolidation to lock in profits
It FLIPS when price breaks the trailing line, signaling reversals
Visual Elements You'll See:
Orange Trailing Line: The actual UT stop level that adapts bar-by-bar
Buy/Sell Labels: Aqua triangle (long) or orange triangle (short) when the line flips
ENTRY Line: Horizontal line at your entry price (optional, can be turned off)
Suggested Stop Loss: A composite SL calculated from multiple support/resistance layers:
- UT trailing line
- Supertrend level
- VWAP
- Swing structure (recent lows/highs)
- Long-term MA (200)
- ATR-based floor
Take Profit Lines: TP1, TP1.5, TP2, TP3 based on R-multiples. When price touches a TP, it's marked with a checkmark and the line freezes for audit trail purposes.
Status Messages: "SL Touched ❌" or "SL Frozen" when the trade leg completes.
How UT Bot Differs from Other ATR Systems:
Multiple Filters Available: You can require 2-bar confirmation, minimum % price change, swing structure alignment, or ZLSMA directional filter. Most UT implementations have none of these.
Smart SL Calculation: Instead of just using the UT line as your stop, the indicator suggests a better SL based on actual support/resistance. This prevents getting stopped out by wicks while keeping risk controlled.
Visual Audit Trail: All SL/TP lines freeze when touched with clear markers. You can review your trades weeks later and see exactly where entries, stops, and targets were.
Performance Options: "Draw UT visuals only on bar close" lets you reduce rendering load without affecting logic or alerts - critical for slower machines or 1m charts.
Trading Logic:
UT Bot flips direction (Buy or Sell signal appears)
Check Bias Table for multi-timeframe confirmation
Optional: Wait for Base signal or candlestick pattern
Enter at signal bar close or next bar open
Place stop at "Suggested Stop Loss" line
Scale out at TP levels (TP1, TP2, TP3)
Exit remaining position on opposite UT signal or stop hit
---
5. UNDERSTANDING THE MARKET BIAS TABLE
This is the indicator's unique multi-timeframe intelligence layer. Instead of looking at one chart at a time, the table aggregates signals across seven timeframes plus macro trend bias.
Why Multi-Timeframe Analysis Matters:
Professional traders check higher and lower timeframes for context:
Is the 1h uptrend aligning with my 5m entry?
Are all short-term timeframes bullish or just one?
Is the daily trend supportive or fighting me?
Doing this manually means opening multiple charts, checking each indicator, and making mental notes. The Bias Table does it automatically in one glance.
Table Structure:
Header Row:
On intraday charts: 1m, 5m, 15m, 30m, 1h, 2h, 4h (toggle which ones you want)
On daily+ charts: D, W, M (automatic)
Green dot next to title = live updating
Headline Rows - Macro Bias:
These show broad market direction over longer periods:
3 Day Bias: Trend over last 3 trading sessions (uses 1h data)
Weekly Bias: Trend over last 5 trading sessions (uses 4h data)
Monthly Bias: Trend over last 30 daily bars
Quarterly Bias: Trend over last 13 weekly bars
VIX Fear Index: Market regime based on VIX level - bullish when low, bearish when high
Opening Range Breakout: Status of price vs. session open range (intraday only)
These rows show text: "BULLISH", "BEARISH", or "NEUTRAL"
Indicator Rows - Technical Signals:
These evaluate your configured indicators across all active timeframes:
Fast MA > Medium MA (shows your actual MA settings, e.g., "EMA 10 > SMA 20")
Price > Long MA (e.g., "Price > SMA 200")
Price > VWAP
MACD > Signal
Supertrend (up/down/neutral)
ZLSMA Rising
RSI In Zone
ADX ≥ Minimum
These rows show emojis: GREEB (bullish), RED (bearish), GRAY/YELLOW (neutral/NA)
AVG Column:
Shows percentage of active timeframes that are bullish for that row. This is the KEY metric:
AVG > 70% = strong multi-timeframe bullish alignment
AVG 40-60% = mixed/choppy, no clear trend
AVG < 30% = strong multi-timeframe bearish alignment
How to Use the Table:
For a long trade:
Check AVG column - want to see > 60% ideally
Check headline bias rows - want to see BULLISH, not BEARISH
Check VIX row - bullish market regime preferred
Check ORB row (intraday) - want ABOVE for longs
Scan indicator rows - more green = better confirmation
For a short trade:
Check AVG column - want to see < 40% ideally
Check headline bias rows - want to see BEARISH, not BULLISH
Check VIX row - bearish market regime preferred
Check ORB row (intraday) - want BELOW for shorts
Scan indicator rows - more red = better confirmation
When AVG is 40-60%:
Market is choppy, mixed signals. Either stay out or reduce position size significantly. These are low-probability environments.
Unique Features:
Dynamic Labels: Row names show your actual settings (e.g., "EMA 10 > SMA 20" not generic "Fast > Slow"). You know exactly what's being evaluated.
Customizable Rows: Turn off rows you don't care about. Only show what matters to your strategy.
Customizable Timeframes: On intraday charts, disable 1m or 4h if you don't trade them. Reduces calculation load by 20-40%.
Automatic HTF Handling: On Daily/Weekly/Monthly charts, the table automatically switches to D/W/M columns. No configuration needed.
Performance Smart: "Hide BIAS table on 1D or above" option completely skips all table calculations on higher timeframes if you only trade intraday.
---
6. CANDLESTICK PATTERN RECOGNITION
The indicator automatically detects six major reversal patterns and marks them with emojis at the relevant bars.
Why These Six Patterns:
These are the most statistically significant reversal patterns according to trading literature:
High win rate when appearing at support/resistance
Clear visual structure (not subjective)
Work across all timeframes and assets
Studied extensively by institutions
The Patterns:
Bullish Patterns (appear at bottoms):
Bullish Engulfing: Green candle completely engulfs prior red candle's body. Strong reversal signal.
Hammer: Small body with long lower wick (at least 2× body size). Shows rejection of lower prices by buyers.
Morning Star: Three-candle pattern (large red → small indecision → large green). Very strong bottom reversal.
Bearish Patterns (appear at tops):
Bearish Engulfing: Red candle completely engulfs prior green candle's body. Strong reversal signal.
Shooting Star: Small body with long upper wick (at least 2× body size). Shows rejection of higher prices by sellers.
Evening Star: Three-candle pattern (large green → small indecision → large red). Very strong top reversal.
Interactive Tooltips:
Unlike most pattern indicators that just draw shapes, this one is educational:
Hover your mouse over any pattern emoji
A tooltip appears explaining: what the pattern is, what it means, when it's most reliable, and how to trade it
No need to memorize - learn as you trade
Noise Filter:
"Min candle body % to filter noise" setting prevents false signals:
Patterns require minimum body size relative to price
Filters out tiny candles that don't represent real buying/selling pressure
Adjust based on asset volatility (higher % for crypto, lower for low-volatility stocks)
How to Trade Patterns:
Patterns are NOT standalone entry signals. Use them as:
Confirmation: UT Bot gives signal + pattern appears = stronger entry
Reversal Warning: In a trade, opposite pattern appears = consider tightening stop or taking profit
Support/Resistance Validation: Pattern at key level (PDH, VWAP, MA 200) = level is being respected
Best combined with:
UT Bot or Base signal in same direction
Bias Table alignment (AVG > 60% or < 40%)
Appearance at obvious support/resistance
---
7. VISUAL TOOLS AND FEATURES
VWAP (Volume Weighted Average Price):
Session-anchored VWAP with standard deviation bands. Shows institutional "fair value" for the trading session.
Anchor Options: Session, Day, Week, Month, Quarter, Year. Choose based on your trading timeframe.
Bands: Up to three pairs (X1, X2, X3) showing statistical deviation. Price at outer bands often reverses.
Auto-Hide on HTF: VWAP hides on Daily/Weekly/Monthly charts automatically unless you enable anchored mode.
Use VWAP as:
Directional bias (above = bullish, below = bearish)
Mean reversion levels (outer bands)
Support/resistance (the VWAP line itself)
Previous Day High/Low:
Automatically plots yesterday's high and low on intraday charts:
Updates at start of each new trading day
Theme-aware colors (dark text for light charts, light text for dark charts)
Hidden automatically on Daily/Weekly/Monthly charts
These levels are critical for intraday traders - institutions watch them closely as support/resistance.
Opening Range Breakout (ORB):
Tracks the high/low of the first 5, 15, 30, or 60 minutes of the trading session:
Customizable session times (preset for NYSE, LSE, TSE, or custom)
Shows current breakout status in Bias Table row (ABOVE, BELOW, INSIDE, BUILDING)
Intraday only - auto-disabled on Daily+ charts
ORB is a classic day trading strategy - breakout above opening range often leads to continuation.
Extra Labels:
Change from Open %: Shows how far price has moved from session open (intraday) or daily open (HTF). Green if positive, red if negative.
ADX Badge: Small label at bottom of last bar showing current ADX value. Green when above your minimum threshold, red when below.
RSI Badge: Small label at top of last bar showing current RSI value with zone status (buy zone, sell zone, or neutral).
These labels provide quick at-a-glance confirmation without needing separate indicator windows.
---
8. HOW TO USE THE INDICATOR
Step 1: Add to Chart
Load the indicator on your chosen asset and timeframe
First time: Everything is enabled by default - the chart will look busy
Don't panic - you'll turn off what you don't need
Step 2: Start Simple
Turn OFF everything except:
UT Bot labels (keep these ON)
Bias Table (keep this ON)
Moving Averages (Fast and Medium only)
Suggested Stop Loss and Take Profits
Hide everything else initially. Get comfortable with the basic UT Bot + Bias Table workflow first.
Step 3: Learn the Core Workflow
UT Bot gives a Buy or Sell signal
Check Bias Table AVG column - do you have multi-timeframe alignment?
If yes, enter the trade
Place stop at Suggested Stop Loss line
Scale out at TP levels
Exit on opposite UT signal
Trade this simple system for a week. Get a feel for signal frequency and win rate with your settings.
Step 4: Add Filters Gradually
If you're getting too many losing signals (whipsaws in choppy markets), add filters one at a time:
Try: "Require 2-Bar Trend Confirmation" - wait for 2 bars to confirm direction
Try: ADX filter with minimum threshold - only trade when trend strength is sufficient
Try: RSI pullback filter - only enter on pullbacks, not chasing
Try: Volume filter - require above-average volume
Add one filter, test for a week, evaluate. Repeat.
Step 5: Enable Advanced Features (Optional)
Once you're profitable with the core system, add:
Supertrend for additional trend confirmation
Candlestick patterns for reversal warnings
VWAP for institutional anchor reference
ORB for intraday breakout context
ZLSMA for low-lag trend following
Step 6: Optimize Settings
Every setting has a detailed tooltip explaining what it does and typical values. Hover over any input to read:
What the parameter controls
How it impacts trading
Suggested ranges for scalping, day trading, and swing trading
Start with defaults, then adjust based on your results and style.
Step 7: Set Up Alerts
Right-click chart → Add Alert → Condition: "Luxy Momentum v6" → Choose:
"UT Bot — Buy" for long entries
"UT Bot — Sell" for short entries
"Base Long/Short" for filtered MA cross signals
Optionally enable "Send real-time alert() on UT flip" in settings for immediate notifications.
Common Workflow Variations:
Conservative Trader:
UT signal + Base signal + Candlestick pattern + Bias AVG > 70%
Enter only at major support/resistance
Wider UT sensitivity, multiple filters
Aggressive Trader:
UT signal + Bias AVG > 60%
Enter immediately, no waiting
Tighter UT sensitivity, minimal filters
Swing Trader:
Focus on Daily/Weekly Bias alignment
Ignore intraday noise
Use ORB and PDH/PDL less (or not at all)
Wider stops, patient approach
---
9. PERFORMANCE AND OPTIMIZATION
The indicator is optimized for speed, but with 15+ features running simultaneously, chart load time can add up. Here's how to keep it fast:
Biggest Performance Gains:
Disable Unused Timeframes: In "Time Frames" settings, turn OFF any timeframe you don't actively trade. Each disabled TF saves 10-15% calculation time. If you only day trade 5m, 15m, 1h, disable 1m, 2h, 4h.
Hide Bias Table on Daily+: If you only trade intraday, enable "Hide BIAS table on 1D or above". This skips ALL table calculations on higher timeframes.
Draw UT Visuals Only on Bar Close: Reduces intrabar rendering of SL/TP/Entry lines. Has ZERO impact on logic or alerts - purely visual optimization.
Additional Optimizations:
Turn off VWAP bands if you don't use them
Disable candlestick patterns if you don't trade them
Turn off Supertrend fill if you find it distracting (keep the line)
Reduce "Limit to 10 bars" for SL/TP lines to minimize line objects
Performance Features Built-In:
Smart Caching: Higher timeframe data (3-day bias, weekly bias, etc.) updates once per day, not every bar
Conditional Calculations: Volume filter only calculates when enabled. Swing filter only runs when enabled. Nothing computes if turned off.
Modular Design: Every component is independent. Turn off what you don't need without breaking other features.
Typical Load Times:
5m chart, all features ON, 7 timeframes: ~2-3 seconds
5m chart, core features only, 3 timeframes: ~1 second
1m chart, all features: ~4-5 seconds (many bars to calculate)
If loading takes longer, you likely have too many indicators on the chart total (not just this one).
---
10. FAQ
Q: How is this different from standard UT Bot indicators?
A: Standard UT Bot (originally by @QuantNomad) is just the ATR trailing line and flip signals. This implementation adds:
- Volume weighting and momentum adjustment to the trailing calculation
- Multiple confirmation filters (swing, %, 2-bar, ZLSMA)
- Smart composite stop loss system from multiple S/R layers
- R-multiple take profit system with freeze-on-touch
- Integration with multi-timeframe Bias Table
- Visual audit trail with checkmarks
Q: Can I use this for automated trading?
A: The indicator is designed for discretionary trading. While it has clear signals and alerts, it's not a mechanical system. Context and judgment are required.
Q: Does it repaint?
A: No. All signals respect bar close. UT Bot logic runs intrabar but signals only trigger on confirmed bars. Alerts fire correctly with no lookahead.
Q: Do I need to use all the features?
A: Absolutely not. The indicator is modular. Many profitable traders use just UT Bot + Bias Table + Moving Averages. Start simple, add complexity only if needed.
Q: How do I know which settings to use?
A: Every single input has a detailed tooltip. Hover over any setting to see:
What it does
How it affects trading
Typical values for scalping, day trading, swing trading
Start with defaults, adjust gradually based on results.
Q: Can I use this on crypto 24/7 markets?
A: Yes. ORB will not work (no defined session), but everything else functions normally. Use "Day" anchor for VWAP instead of "Session".
Q: The Bias Table is blank or not showing.
A: Check:
"Show Table" is ON
Table position isn't overlapping another indicator's table (change position)
At least one row is enabled
"Hide BIAS table on 1D or above" is OFF (if on Daily+ chart)
Q: Why are candlestick patterns not appearing?
A: Patterns are relatively rare by design - they only appear at genuine reversal points. Check:
Pattern toggles are ON
"Min candle body %" isn't too high (try 0.05-0.10)
You're looking at a chart with actual reversals (not strong trending market)
Q: UT Bot is too sensitive/not sensitive enough.
A: Adjust "Sensitivity (Key×ATR)". Lower number = tighter stop, more signals. Higher number = wider stop, fewer signals. Read the tooltip for guidance.
Q: Can I get alerts for the Bias Table?
A: The Bias Table is a dashboard for visual analysis, not a signal generator. Set alerts on UT Bot or Base signals, then manually check Bias Table for confirmation.
Q: Does this work on stocks with low volume?
A: Yes, but turn OFF the volume filter. Low volume stocks will never meet relative volume requirements.
Q: How often should I check the Bias Table?
A: Before every entry. It takes 2 seconds to glance at the AVG column and headline rows. This one check can save you from fighting the trend.
Q: What if UT signal and Base signal disagree?
A: UT Bot is more aggressive (ATR trailing). Base signals are more conservative (MA cross + filters). If they disagree, either:
Wait for both to align (safest)
Take the UT signal but with smaller size (aggressive)
Skip the trade (conservative)
There's no "right" answer - depends on your risk tolerance.
---
FINAL NOTES
The indicator gives you an edge. How you use that edge determines results.
For questions, feedback, or support, comment on the indicator page or message the author.
Happy Trading!

RSI Cloud v1.0 [PriceBlance] RSI Cloud v1.0 — Ichimoku-style Cloud on RSI(14), not on price.
Recalibrated baselines: EMA9 (Tenkan) for speed, WMA45 (Kijun) for stability.
Plus ADX-on-RSI to grade strength so you know when momentum persists or fades.
1. Introduction
RSI Cloud v1.0 applies an Ichimoku Cloud directly on RSI(14) to reveal momentum regimes earlier and cleaner than price-based views. We replaced Tenkan with EMA9 (faster, more responsive) and Kijun with WMA45 (slower, more stable) to fit a bounded oscillator (0–100). Forward spans (+26) and a lagging line (−26) provide a clear framework for trend bias and transitions.
To qualify signals, the indicator adds ADX computed on RSI—highlighting whether strength is weak, strong, or very strong, so you can decide when to follow, fade, or stand aside.
2. Core Mapping (Hook + Bullets)
At a glance: Ichimoku on RSI(14) with recalibrated baselines for a bounded oscillator.
Source: RSI(14)
Tenkan → EMA9(RSI) (fast, responsive)
Kijun → WMA45(RSI) (slow, stable)
Span A: classic Ichimoku midline, displaced +26
Span B: classic Ichimoku baseline, displaced +26
Lagging line: RSI shifted −26
3. Key Benefits (Why traders care)
Momentum regimes on RSI: position vs. Cloud = bull / bear / transition at a glance.
Cleaner confirmations: EMA9/WMA45 pairing cuts noise vs. raw 30/70 flips.
Earlier warnings: Cloud breaks on RSI often lead price-based confirmations.
4. ADX on RSI (Enhanced Strength Normalization)
Grade strength inside the RSI domain using ADX from ΔRSI:
ADX ≤ 20 → Weak (transparency = 60)
ADX ≤ 40 → Strong (transparency = 15)
ADX > 40 → Very strong (transparency = 0)
Use these tiers to decide when to trust, fade, or ignore a signal.
5. How to Read (Quick rules)
Bias / Regime
Bullish: RSI above Cloud and RSI > WMA45
Bearish: RSI below Cloud and RSI < WMA45
Neutral / Transition: all other cases
6. Settings (Copy & use)
RSI Length: 14 (default)
Tenkan: EMA9 on RSI · Kijun: WMA45 on RSI
Displacement: +26 (Span A/B) · −26 (Lagging)
Theme: PriceBlance Dark/Light
Visibility toggles: Cloud, Baselines, Lagging, labels/panel, Overbought/Oversold, Divergence, ADX-on-RSI (via transparency coloring)
7. Credits & License
Author/Brand: PriceBlance
Version: v1.0 (Free)
Watermark: PriceBlance • RSI Cloud v1.0
Disclaimer: Educational content; not financial advice.
8. CTA
If this helps, please ⭐ Star and Follow for updates & new tools.
Feedback is welcome—comment what you’d like added next (alerts, presets, visuals).

Pro Momentum Table + Trade Alerts📊 Indicator Name: Pro Momentum Table – ADX + DI + ATR + Astro Timing
🧠 Concept:
This indicator is designed for professional scalpers and intraday traders who want to capture only strong momentum waves — not noise. It combines trend strength, volatility, directional movement, momentum oscillation, vega divergence, and astrological timing into a single compact table on your chart.
⚙️ Components Explained:
Metric Description
ADX (Average Directional Index) Measures the strength of the trend. Values above 20 indicate that a meaningful move is starting.
+DI / -DI (Directional Indicators) Show whether buyers (+DI) or sellers (-DI) are dominating. Increasing +DI with ADX rising = bullish momentum. Increasing -DI with ADX rising = bearish momentum.
ATR (Average True Range) Shows volatility and expected range. Used for setting realistic stop-loss and multi-level targets (1×, 1.5×, 2×, 2.5× ATR).
Price Displays the current price level for quick reference.
CMO (Chande Momentum Oscillator) Measures short-term momentum direction and strength. Helps identify overbought/oversold conditions in trend continuation.
Vega Divergence Shows a synthetic reading of volatility pressure — "Bullish" when volatility expansion supports upward moves, "Bearish" for downward pressure, and "Neutral" otherwise.
Astro Remark Suggests ideal time windows based on planetary cycles for scalping entries. “Bullish Window” often aligns with high-probability long trades; “Bearish Window” favors shorts.
Trade Signal The core momentum condition: “Bullish Momentum” if ADX > 20 and +DI rising, “Bearish Momentum” if ADX > 20 and -DI rising, else “No Clear Momentum.”
📈 How to Use:
Wait for ADX > 20 – This confirms that the market is entering a strong momentum phase.
Check DI direction:
✅ +DI rising: Buyers gaining strength → look for long setups.
✅ -DI rising: Sellers gaining strength → look for short setups.
Use ATR to plan exits:
🎯 TP1 = Entry ± 1 × ATR
🎯 TP2 = Entry ± 1.5 × ATR
🎯 TP3 = Entry ± 2 × ATR
🎯 TP4 = Entry ± 2.5 × ATR
CMO & Vega Divergence: Confirm momentum direction and volatility expansion before committing.
Astro Remark: Align your scalping activity with the planetary support window for higher probability trades.
🪙 Pro Tips for Scalpers:
Only trade when ADX > 20 and DI is consistently rising. Ignore signals in choppy or sideways phases.
Avoid trades if Vega is neutral and CMO is flat – these usually indicate fake breakouts.
If targets aren’t hit within expected ATR-based time, treat the move as false and exit early.
Combine with 9 EMA and 20 EMA (hidden) for wave structure confirmation without cluttering the chart.
💡 Summary:
This indicator acts as a real-time trade decision dashboard. It removes clutter from the chart and delivers everything a professional scalper needs — strength, direction, volatility, momentum, timing, and actionable trade bias — all in one elegant table.

MC3 Pro Ultra e10Al-Brooks style MC3/Thrust signals with smart gating: EMA, Wilder ADX/DI, Consolidation, BO+FT, Z-score, Volume, RSI div, HTF EMA, Structure, OR/Blackout, Smart Cooldown. Non-repainting.
Full Description (for the main page)
MC3 Pro Ultra — Invite-Only (Al Brooks–inspired)
A high-discipline entry tool for 3-bar micro-channels (MC3) and optional 1-bar thrusts (MC1). Signals are filtered by a layered “gate” system: EMA side/slope/distance, Wilder ADX/DI, Consolidation (Box, BB<KC, Efficiency Ratio), Breakout+Follow-Through (BO+FT), TR Z-score expansion, Volume (mild/strict), true RSI divergence, HTF EMA (side/slope/strict), Market Structure (HH/HL vs LH/LL with optional BOS), Liquidity sweep guard, Open Range gate, Blackout windows (news) and Smart Cooldown v2.
Everything is non-repainting (evaluated on bar close or using closed higher-TF values).
What it does
MC3 (3-bar micro-channel) & Thrust (MC1) entries in both directions.
Auto regime: dynamically tightens thresholds in chop and relaxes them in trend.
BO+FT confirm: bar-3 must close beyond prior H/L by X points and near the extreme; optional follow-through (no immediate pullback).
Z-Score (TR): requires statistical range expansion (any bar inside the MC3).
EMA filter: side rule (All 3 / Any 2 / Last), slope, and max ATR distance.
Wilder ADX/DI: strength/rend bias; optional DI dominance.
Consolidation filter: Box+ATR (with break confirmation), Squeeze (BB<KC), or ER (Efficiency Ratio).
Volume gate: mild (above SMA×mult) or strict (3-bar rising).
True RSI divergence: pivot-based; blocks when divergence contradicts direction.
HTF EMA (non-repainting): side/slope/strict from a higher timeframe using closed bars.
Market Structure: longs only in HH/HL, shorts only in LH/LL; optional fresh BOS.
Liquidity Sweep guard: block-against or require-with sweep.
Open Range gate: require OR breakout before entries (optional).
Blackout windows: disable signals during macro/news windows.
Smart Cooldown v2: EMA-stretch + clustering penalty to avoid over-trading.
Retest mode (visual): after a signal, watch for a pullback to prev H/L or an EMA±ATR band.
Panel & Debug: status panel (regime, ADX, HTF, CONS, Z/TR, score, gates) + debug reasons for blocked signals.
R overlay: draws entry/stop/targets and an approximate position size.
Non-repainting: uses barstate.isconfirmed and closed HTF values. Signals print on bar close.
Presets
NQ A+ (2m/5m) – fast trend bias. BO+FT & Z-score on, Volume mild, DI dominance on, HTF strict.
NQ Pullback-safe (5m) – more conservative, higher min score & BO/Z thresholds.
ES 5m – balanced default.
(You can also use Custom and tweak only 2–3 knobs at a time.)
Suggested markets/timeframes: CME index futures (NQ/ES), 2m/5m/15m. Works on FX/indices/crypto with sensible retuning.
How to read signals
Green/Red arrows mark confirmed MC3 or Thrust entries (printed after bar closes).
Label shows S=Score and THR if the thrust override triggered.
Panel (top-right) shows: Regime (TREND/CHOP), ADX (prev closed bar optional), HTF (side/slope), Consolidation mode, OR status, current Z/TR vs threshold, Score≥, and quick Gates (✓/✗) for long/short.
Debug (optional, last bar): concatenated reasons why a signal did not pass (e.g., ).
Retest mode places “RT” markers when price pulls back to the chosen retest source.
Key inputs (high-level)
Definition: MC3 (color / close-to-close / micro-channel HL / combo), optional Thrust override.
EMA: side rule, slope, max ATR distance (with soft scoring).
ADX/DI: Wilder ADX len/threshold, optional DI dominance.
Consolidation: Box+ATR (with min breaks & confirm), Squeeze (BB<KC), ER.
BO+FT: min points beyond prior H/L, close% near extreme, “no-pullback” option.
Z-Score: TR Z-score length & min threshold.
Volume: mild (SMA×mult) or strict (3-bar rising).
RSI divergence: pivot L/R, max lookback age.
HTF: timeframe/length, rule (Side only / Slope only / Strict).
Structure gate: pivot L/R, optional BOS with max age.
Sweep guard: Off / BlockAgainst / RequireWith.
Open Range: session window + “require breakout” toggle.
Blackout: one or two session windows (e.g., FOMC/CPI).
Smart Cooldown v2: base cooldown, EMA-stretch bonus, cluster penalty.
Alerts
Comes with alertconditions for Bull/Bear signals.
Optional JSON payload (direction, score, preset, regime, price, est. R, symbol, timeframe) for webhook-based managers (auto-filtering or auto-sizing).
How to set: Add alert on this indicator → choose condition “Bull MC3/Thrust” or “Bear MC3/Thrust” → Once-per-bar-close → webhook (optional).
Best practices
In trend: keep Auto regime ON; you can slightly lower min score / Z / BO.
In chop: raise min score (+1~2), use Volume strict + DI dominance, increase Z and close% thresholds, optionally require OR breakout.
Retest entries: enable “Retest mode” to get better fills (prev H/L or EMA band).
HTF Strict + Structure gate will materially improve selectivity (fewer trades, higher quality).
Avoid trading during Blackout windows (macro releases, roll).
Respect Smart Cooldown to prevent clustering and revenge trades.
Disclaimers
This is not financial advice. Backtest/forward-test before risking capital.
No indicator guarantees win rate or profits; use stops and position sizing.
Invite-Only access at the author’s discretion. Redistribution is prohibited.
Credits
Inspired by Al Brooks methodology (micro-channels, breakouts, trend vs chop context) and classic Wilder ADX/DI.
Momentum_EMABand📢 Reposting Notice
I am reposting this script because my earlier submission was hidden due to description requirements under TradingView’s House Rules. This updated version fully explains the originality, the reason for combining these indicators, and how they work together. Follow me for future updates and refinements.
🆕 Momentum EMA Band, Rule-Based System
Momentum EMA Band is not just a mashup — it is a purpose-built trading tool for intraday traders and scalpers that integrates three complementary technical concepts into a single rules-based breakout & retest framework.
Originality comes from the specific sequence and interaction of these three filters:
Supertrend → Sets directional bias.
EMA Band breakout with retest logic → Times precise entries.
ADX filter → Confirms momentum strength and avoids noise.
This system is designed to filter out weak setups and false breakouts that standalone indicators often fail to avoid.
🔧 How the Indicator Works — Combined Logic
1️⃣ EMA Price Band — Dynamic Zone Visualization
Plots upper & lower EMA bands (default: 9-period EMA).
Green Band → Price above upper EMA = bullish momentum
Red Band → Price below lower EMA = bearish pressure
Yellow Band → Price within band = neutral zone
Acts as a consolidation zone and breakout trigger level.
2️⃣ Supertrend Overlay — Reliable Trend Confirmation
ATR-based Supertrend adapts to volatility:
Green Line = Uptrend bias
Red Line = Downtrend bias
Ensures trades align with the prevailing trend.
3️⃣ ADX-Based No-Trade Zone — Choppy Market Filter
Manual ADX calculation (default: length 14).
If ADX < threshold (default: 20) and price is inside EMA Band → gray background marks low-momentum zones.
🧩 Why This Mashup Works
Supertrend confirms trend direction.
EMA Band breakout & retest validates the breakout’s strength.
ADX ensures the market has enough trend momentum.
When all align, entries are higher probability and whipsaws are reduced.
📈 Example Trade Walkthrough
Scenario: 5-minute chart, ADX threshold = 20.
Supertrend turns green → trend bias is bullish.
Price consolidates inside the yellow EMA Band.
ADX rises above 20 → trend momentum confirmed.
Price closes above the green EMA Band after retesting the band as support.
Entry triggered on candle close, stop below band, target based on risk-reward.
Exit when Supertrend flips red or ADX momentum drops.
This sequence prevents premature entries, keeps trades aligned with trend, and avoids ranging markets.
🎯 Key Features
✅ Multi-layered confirmation for precision trading
✅ Built-in no-trade zone filter
✅ Fully customizable parameters
✅ Clean visuals for quick decision-making
⚠ Disclaimer: This is Version 1. Educational purposes only. Always use with risk management.

UngliMulti-Indicator Confluence System
This is a **multi-indicator confluence trading signal system** called "Ungli" that combines RSI, ADX, and MACD to identify high-probability momentum opportunities when used alongside chart pattern and trend line breakouts.
## Core Concept
The script identifies moments when multiple technical indicators align to suggest potential price momentum moves, specifically looking for oversold and overbought conditions with momentum confirmation. Use green and red highlights along with chart patterns and trend line breakouts that signal a breakout for confluence for a likely momentum move.
## Technical Indicators Used
**RSI (Relative Strength Index)**
- Default 14-period RSI
- Oversold threshold: < 40
- Overbought threshold: > 60
**ADX (Average Directional Index)**
- Default 14-period ADX with DI+ and DI-
- Threshold: 21
- Looks for ADX below threshold but ticking upward (momentum building)
**MACD (Moving Average Convergence Divergence)**
- Fast: 12, Slow: 26, Signal: 9
- Uses MACD line direction as trend filter
## Signal Logic
**Green Background (Bullish Momentum Signal):**
- RSI > 60 (overbought)
- ADX < 21 AND rising
- MACD line trending upward
**Red Background (Bearish Momentum Signal):**
- RSI < 40 (oversold)
- ADX < 21 AND rising
- MACD line trending downward
## Key Strategy Elements
1. **Confluence Approach**: Requires all three indicators to align, reducing false signals
2. **Momentum Filter**: ADX must be building (rising) even if low, indicating emerging trend strength
3. **Trend Confirmation**: MACD direction must match the expected move
4. **Visual Simplicity**: Clean background highlighting without chart clutter
5. **Pattern Integration**: Designed to work with chart patterns and breakout strategies
## Use Case
This indicator is designed for swing trading and breakout strategies, identifying moments when oversold/overbought conditions coincide with building momentum in the expected direction. The ADX filter helps avoid choppy, trendless markets. Best used in conjunction with:
- Support/resistance breakouts
- Chart pattern breakouts (triangles, flags, channels)
- Trend line breaks
- Key level violations
The background highlights serve as confluence confirmation when combined with your chart analysis and breakout setups.