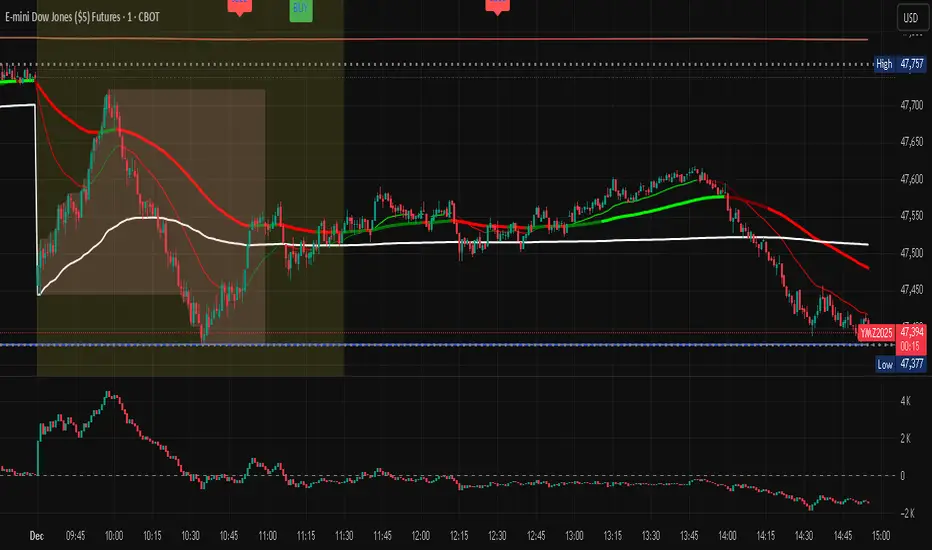
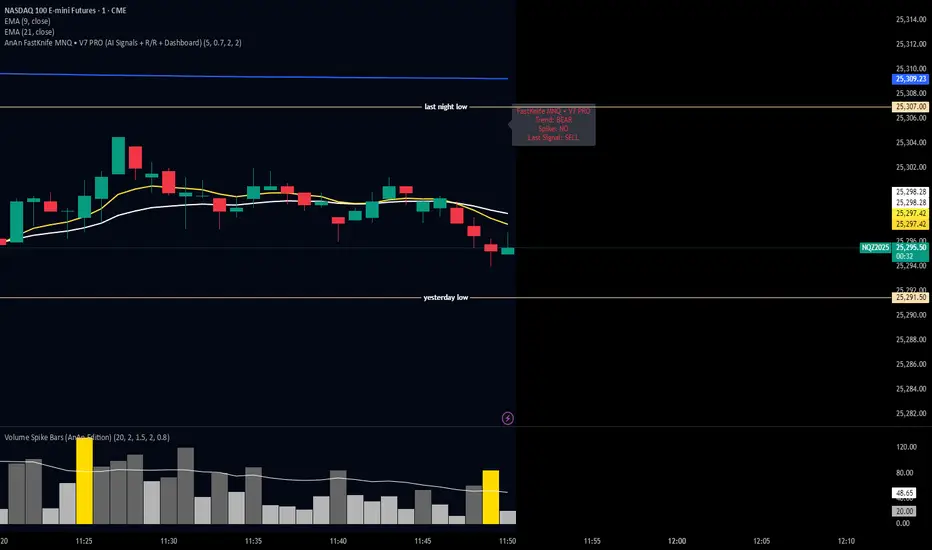
MBAND 200 4H BTC/USDT - By MGS-TradingMBAND 200 4H BTC/USDT with RSI and Volume by MGS-Trading: A Neural Network-Inspired Indicator
Introduction:
The MBAND 200 4H BTC/USDT with RSI and Volume represents a groundbreaking achievement in the integration of artificial intelligence (AI) into cryptocurrency market analysis. Developed by MGS-Trading, this indicator is the culmination of extensive research and development efforts aimed at leveraging AI's power to enhance trading strategies. By synthesizing neural network concepts with traditional technical analysis, the MBAND indicator offers a dynamic, multi-dimensional view of the market, providing traders with unparalleled insights and actionable signals.
Innovative Approach:
Our journey to create the MBAND indicator began with a simple question: How can we mimic the decision-making prowess of a neural network in a trading indicator? The answer lay in the weighted aggregation of Exponential Moving Averages (EMAs) from multiple timeframes, each serving as a unique input akin to a neuron in a neural network. These weights are not arbitrary; they were painstakingly optimized through backtesting across various market conditions to ensure they reflect the significance of each timeframe’s contribution to overall market dynamics.
Core Features:
Neural Network-Inspired Weights: The heart of the MBAND indicator lies in its AI-inspired weighting system, which treats each timeframe’s EMA as an input node in a neural network. This allows the indicator to process complex market data in a nuanced and sophisticated manner, leading to more refined and informed trading signals.
Multi-Timeframe EMA Analysis: By analyzing EMAs from 15 minutes to 3 days, the MBAND indicator captures a comprehensive snapshot of market trends, enabling traders to make informed decisions based on a broad spectrum of data.
RSI and Volume Integration: The inclusion of the Relative Strength Index (RSI) and volume data adds layers of confirmation to the signals generated by the EMA bands. This multi-indicator approach helps in identifying high-probability setups, reinforcing the neural network’s concept of leveraging multiple data points for decision-making.
Usage Guidelines:
Signal Interpretation: The MBAND bands provide a visual representation of the market’s momentum and direction. A price moving above the upper band signals strength and potential continuation of an uptrend, while a move below the lower band suggests weakness and a possible downtrend.
Overbought/Oversold Conditions: The RSI component identifies when the asset is potentially overbought (>70) or oversold (<30). Traders should watch for these conditions near the MBAND levels for potential reversal opportunities.
Volume Confirmation: An increase in volume accompanying a price move towards or beyond an MBAND level serves as confirmation of the strength behind the move. This can indicate whether a breakout is likely to sustain or if a reversal has substantial backing.
Strategic Entry and Exit Points: Combine the MBAND readings with RSI and volume indicators to pinpoint strategic entry and exit points. For example, consider entering a long position when the price is near the lower MBAND, RSI indicates oversold conditions, and there is a notable volume increase.
About MGS-Trading:
At MGS-Trading, we are passionate about harnessing the transformative power of AI to revolutionize cryptocurrency trading. Our indicators and tools are designed to provide traders with advanced analytics and insights, drawing on the latest AI techniques and methodologies. The MBAND 200 4H BTC/USDT with RSI and Volume indicator is a prime example of our commitment to innovation, offering traders a sophisticated, AI-enhanced tool for navigating the complexities of the cryptocurrency markets.
Disclaimer:
The MBAND indicator is provided for informational purposes only and does not constitute investment advice. Trading cryptocurrencies involves significant risk and can result in the loss of your investment. We recommend conducting your own research and consulting with a qualified financial advisor before making any trading decisions.
Cari dalam skrip untuk "ai"
MomentumBreak AI SwiftEdgeMomentumbreak AI SwiftEdge
Overview
This indicator combines two powerful concepts: Pivot Trendlines by HoanGhetti and the Squeeze Momentum Oscillator by AlgoAlpha. The goal of this mashup is to provide traders with a tool that identifies key trendline breakouts while simultaneously gauging market momentum through a dynamic gradient overlay. By integrating these two elements, the indicator offers a unique perspective on price action, helping traders spot high-probability breakout opportunities that align with momentum shifts.
How It Works
Pivot Trendlines:
The indicator uses HoanGhetti's Pivot Trendlines to identify pivot highs and lows based on user-defined settings (Pivot Length and Pivot Type).
Trendlines are drawn between these pivots, and breakouts are detected when the price crosses above (bullish) or below (bearish) the trendline.
Breakouts are visually highlighted with gradient boxes and an "AI: BREAK ⚡" label for clarity.
Squeeze Momentum Oscillator:
The Squeeze Momentum Oscillator calculates market momentum using a combination of volatility and price movement.
A dynamic midline (price_mid) is plotted, with its color indicating squeeze conditions (yellow for hypersqueeze, orange for normal squeeze, gray otherwise).
A gradient overlay is added above or below the midline to reflect momentum:
Green gradient for bullish momentum (vf > 0), placed below candles in an uptrend (close > price_mid) or above in a downtrend (close < price_mid).
Red gradient for bearish momentum (vf < 0), placed above candles in an uptrend or below in a downtrend.
The gradient's intensity increases as the price moves further from the midline, visually emphasizing momentum strength.
Breakout Confirmation:
Breakout signals are only generated when the momentum aligns with the breakout direction:
Bullish breakouts require bullish momentum (vf > 0).
Bearish breakouts require bearish momentum (vf < 0).
This alignment ensures that breakouts are more reliable and reduces false signals.
Default Settings
Pivot Length: 20 (determines the lookback period for identifying pivot points)
Pivot Type: Normal (can be set to "Fast" for more frequent pivots)
Repainting: True (trendlines may repaint as new pivots form; can be disabled)
Target Levels: False (optional horizontal levels at pivot points; can be enabled)
Extend: None (trendline extension; options: none, right, left, both)
Trendline Style: Dotted (options: dotted, dashed, solid)
Underlying Momentum Oscillator Length: 10
Swing Momentum Oscillator Length: 20
Squeeze Calculation Period: 14
Squeeze Smoothing Length: 7
Squeeze Detection Length: 14
Hyper Squeeze Detection Length: 5
Usage
This indicator is ideal for traders who want to combine trendline breakouts with momentum analysis:
Trendline Breakouts: Look for gradient boxes and "AI: BREAK ⚡" labels to identify confirmed breakouts. Bullish breakouts are marked with green boxes, and bearish breakouts with red boxes.
Momentum Confirmation: The gradient overlay (green for bullish, red for bearish) helps confirm the strength of the trend. Stronger gradients (less transparent) indicate stronger momentum.
Midline Crosses: Small triangles below (bullish) or above (bearish) candles indicate when the price crosses the dynamic midline, providing additional entry/exit signals.
Why This Combination?
The integration of Pivot Trendlines and Squeeze Momentum Oscillator creates a synergy that enhances trade decision-making:
Pivot Trendlines identify key structural levels in the market, making breakouts significant events.
The Squeeze Momentum Oscillator adds a momentum filter, ensuring that breakouts are supported by underlying market strength.
Together, they provide a more holistic view of price action, filtering out low-probability breakouts and highlighting opportunities where trendline breaks align with strong momentum.
Notes
This indicator does not use request.security() or barmerge.lookahead_on, so there is no risk of lookahead bias.
The script is designed to provide clear visual cues without making unrealistic claims about performance. It is intended as a tool for analysis, not a guaranteed trading system.
1-AI Volume Supertrend - Strategy🤖 AI Volume Indicator — Description for Publishing
Description:
The AI Volume Indicator leverages enhanced logic to analyze market volume with a focus on uncovering hidden accumulation, distribution, and momentum shifts. Unlike basic volume bars, this indicator applies adaptive algorithms or pattern recognition (AI-inspired) to highlight significant volume events that may precede price movements.
SuperTrend AI Oscillator StrategySuperTrend AI Oscillator Strategy
Overview
This strategy is a trend-following approach that combines the SuperTrend indicator with oscillator-based filtering.
By identifying market trends while utilizing oscillator-based momentum analysis, it aims to improve entry precision.
Additionally, it incorporates a trailing stop to strengthen risk management while maximizing profits.
This strategy can be applied to various markets, including Forex, Crypto, and Stocks, as well as different timeframes. However, its effectiveness varies depending on market conditions, so thorough testing is required.
Features
1️⃣ Trend Identification Using SuperTrend
The SuperTrend indicator (a volatility-adjusted trend indicator based on ATR) is used to determine trend direction.
A long entry is considered when SuperTrend turns bullish.
A short entry is considered when SuperTrend turns bearish.
The goal is to capture clear trend reversals and avoid unnecessary trades in ranging markets.
2️⃣ Entry Filtering with an Oscillator
The Super Oscillator is used to filter entry signals.
If the oscillator exceeds 50, it strengthens long entries (indicating strong bullish momentum).
If the oscillator drops below 50, it strengthens short entries (indicating strong bearish momentum).
This filter helps reduce trades in uncertain market conditions and improves entry accuracy.
3️⃣ Risk Management with a Trailing Stop
Instead of a fixed stop loss, a SuperTrend-based trailing stop is implemented.
The stop level adjusts automatically based on market volatility.
This allows profits to run while managing downside risk effectively.
4️⃣ Adjustable Risk-Reward Ratio
The default risk-reward ratio is set at 1:2.
Example: A 1% stop loss corresponds to a 2% take profit target.
The ratio can be customized according to the trader’s risk tolerance.
5️⃣ Clear Trade Signals & Visual Support
Green "BUY" labels indicate long entry signals.
Red "SELL" labels indicate short entry signals.
The Super Oscillator is plotted in a separate subwindow to visually assess trend strength.
A real-time trailing stop is displayed to support exit strategies.
These visual aids make it easier to identify entry and exit points.
Trading Parameters & Considerations
Initial Account Balance: Default is $7,000 (adjustable).
Base Currency: USD
Order Size: 10,000 USD
Pyramiding: 1
Trading Fees: $0.94 per trade
Long Position Margin: 50%
Short Position Margin: 50%
Total Trades (M5 Timeframe): 1,032
Visual Aids for Clarity
This strategy includes clear visual trade signals to enhance decision-making:
Green "BUY" labels for long entries
Red "SELL" labels for short entries
Super Oscillator plotted in a subwindow with a 50 midline
Dynamic trailing stop displayed for real-time trend tracking
These visual aids allow traders to quickly identify trade setups and manage positions with greater confidence.
Summary
The SuperTrend AI Oscillator Strategy is developed based on indicators from Black Cat and LuxAlgo.
By integrating high-precision trend analysis with AI-based oscillator filtering, it provides a strong risk-managed trading approach.
Important Notes
This strategy does not guarantee profits—performance varies based on market conditions.
Past performance does not guarantee future results. Markets are constantly changing.
Always test extensively with backtesting and demo trading before using it in live markets.
Risk management, position sizing, and market conditions should always be considered when trading.
Conclusion
This strategy combines trend analysis with momentum filtering, enhancing risk management in trading.
By following market trends carefully, making precise entries, and using trailing stops, it seeks to reduce risk while maximizing potential profits.
Before using this strategy, be sure to test it thoroughly via backtesting and demo trading, and adjust the settings to match your trading style.
Machine Learning Moving Average [LuxAlgo]The Machine Learning Moving Average (MLMA) is a responsive moving average making use of the weighting function obtained Gaussian Process Regression method. Characteristic such as responsiveness and smoothness can be adjusted by the user from the settings.
The moving average also includes bands, used to highlight possible reversals.
🔶 USAGE
The Machine Learning Moving Average smooths out noisy variations from the price, directly estimating the underlying trend in the price.
A higher "Window" setting will return a longer-term moving average while increasing the "Forecast" setting will affect the responsiveness and smoothness of the moving average, with higher positive values returning a more responsive moving average and negative values returning a smoother but less responsive moving average.
Do note that an excessively high "Forecast" setting will result in overshoots, with the moving average having a poor fit with the price.
The moving average color is determined according to the estimated trend direction based on the bands described below, shifting to blue (default) in an uptrend and fushia (default) in downtrends.
The upper and lower extremities represent the range within which price movements likely fluctuate.
Signals are generated when the price crosses above or below the band extremities, with turning points being highlighted by colored circles on the chart.
🔶 SETTINGS
Window: Calculation period of the moving average. Higher values yield a smoother average, emphasizing long-term trends and filtering out short-term fluctuations.
Forecast: Sets the projection horizon for Gaussian Process Regression. Higher values create a more responsive moving average but will result in more overshoots, potentially worsening the fit with the price. Negative values will result in a smoother moving average.
Sigma: Controls the standard deviation of the Gaussian kernel, influencing weight distribution. Higher Sigma values return a longer-term moving average.
Multiplicative Factor: Adjusts the upper and lower extremity bounds, with higher values widening the bands and lowering the amount of returned turning points.
🔶 RELATED SCRIPTS
Machine-Learning-Gaussian-Process-Regression
SuperTrend-AI-Clustering
Multi-TF AI SuperTrend with ADX - Strategy [PresentTrading]
## █ Introduction and How it is Different
The trading strategy in question is an enhanced version of the SuperTrend indicator, combined with AI elements and an ADX filter. It's a multi-timeframe strategy that incorporates two SuperTrends from different timeframes and utilizes a k-nearest neighbors (KNN) algorithm for trend prediction. It's different from traditional SuperTrend indicators because of its AI-based predictive capabilities and the addition of the ADX filter for trend strength.
BTC 8hr Performance
ETH 8hr Performance
## █ Strategy, How it Works: Detailed Explanation (Revised)
### Multi-Timeframe Approach
The strategy leverages the power of multiple timeframes by incorporating two SuperTrend indicators, each calculated on a different timeframe. This multi-timeframe approach provides a holistic view of the market's trend. For example, a 8-hour timeframe might capture the medium-term trend, while a daily timeframe could capture the longer-term trend. When both SuperTrends align, the strategy confirms a more robust trend.
### K-Nearest Neighbors (KNN)
The KNN algorithm is used to classify the direction of the trend based on historical SuperTrend values. It uses weighted voting of the 'k' nearest data points. For each point, it looks at its 'k' closest neighbors and takes a weighted average of their labels to predict the current label. The KNN algorithm is applied separately to each timeframe's SuperTrend data.
### SuperTrend Indicators
Two SuperTrend indicators are used, each from a different timeframe. They are calculated using different moving averages and ATR lengths as per user settings. The SuperTrend values are then smoothed to make them suitable for KNN-based prediction.
### ADX and DMI Filters
The ADX filter is used to eliminate weak trends. Only when the ADX is above 20 and the directional movement index (DMI) confirms the trend direction, does the strategy signal a buy or sell.
### Combining Elements
A trade signal is generated only when both SuperTrends and the ADX filter confirm the trend direction. This multi-timeframe, multi-indicator approach reduces false positives and increases the robustness of the strategy.
By considering multiple timeframes and using machine learning for trend classification, the strategy aims to provide more accurate and reliable trade signals.
BTC 8hr Performance (Zoom-in)
## █ Trade Direction
The strategy allows users to specify the trade direction as 'Long', 'Short', or 'Both'. This is useful for traders who have a specific market bias. For instance, in a bullish market, one might choose to only take 'Long' trades.
## █ Usage
Parameters: Adjust the number of neighbors, data points, and moving averages according to the asset and market conditions.
Trade Direction: Choose your preferred trading direction based on your market outlook.
ADX Filter: Optionally, enable the ADX filter to avoid trading in a sideways market.
Risk Management: Use the trailing stop-loss feature to manage risks.
## █ Default Settings
Neighbors (K): 3
Data points for KNN: 12
SuperTrend Length: 10 and 5 for the two different SuperTrends
ATR Multiplier: 3.0 for both
ADX Length: 21
ADX Time Frame: 240
Default trading direction: Both
By customizing these settings, traders can tailor the strategy to fit various trading styles and assets.
Double AI Super Trend Trading - Strategy [PresentTrading]█ Introduction and How It is Different
The Double AI Super Trend Trading Strategy is a cutting-edge approach that leverages the power of not one, but two AI algorithms, in tandem with the SuperTrend technical indicator. The strategy aims to provide traders with enhanced precision in market entry and exit points. It is designed to adapt to market conditions dynamically, offering the flexibility to trade in both bullish and bearish markets.
*The KNN part is mainly referred from @Zeiierman.
BTCUSD 8hr performance
ETHUSD 8hr performance
█ Strategy, How It Works: Detailed Explanation
1. SuperTrend Calculation
The SuperTrend is a popular indicator that captures market trends through a combination of the Volume-Weighted Moving Average (VWMA) and the Average True Range (ATR). This strategy utilizes two sets of SuperTrend calculations with varying lengths and factors to capture both short-term and long-term market trends.
2. KNN Algorithm
The strategy employs k-Nearest Neighbors (KNN) algorithms, which are supervised machine learning models. Two sets of KNN algorithms are used, each focused on different lengths of historical data and number of neighbors. The KNN algorithms classify the current SuperTrend data point as bullish or bearish based on the weighted sum of the labels of the k closest historical data points.
3. Signal Generation
Based on the KNN classifications and the SuperTrend indicator, the strategy generates signals for the start of a new trend and the continuation of an existing trend.
4. Trading Logic
The strategy uses these signals to enter long or short positions. It also incorporates dynamic trailing stops for exit conditions.
Local picture
█ Trade Direction
The strategy allows traders to specify their trading direction: long, short, or both. This enables the strategy to be versatile and adapt to various market conditions.
█ Usage
ToolTips: Comprehensive tooltips are provided for each parameter to guide the user through the customization process.
Inputs: Traders can customize numerous parameters including the number of neighbors in KNN, ATR multiplier, and types of moving averages.
Plotting: The strategy also provides visual cues on the chart to indicate bullish or bearish trends.
Order Execution: Based on the generated signals, the strategy will execute buy or sell orders automatically.
█ Default Settings
The default settings are configured to offer a balanced approach suitable for most scenarios:
Initial Capital: $10,000
Default Quantity Type: 10% of equity
Commission: 0.1%
Slippage: 1
Currency: USD
These settings can be modified to suit various trading styles and asset classes.
Helacator Ai ThetaHelacator Ai Theta is a state-of-the-art advanced script. It helps the trader find the possibility of a trend reversal in the market. By finding that point at which the three black crows pattern combines with the three white soldiers pattern, it is the most cherished pattern in technical analysis for its signal of strong bullish or bearish momentum. Therefore, it is a very strong predictive tool in the ability of shifting markets.
Key Highlights: Three White Soldiers and Three Black Crows Patterns
The script identifies these candlestick formations that consist of three consecutive candles, either bullish (Three White Soldiers) or bearish (Three Black Crows). These patterns help the trader identify possible trend reversal points as they provide an early signal of a change in the market direction. It is with great care that the script is written to evaluate the position and relationship between the candlesticks for maintaining the accuracy of pattern recognition. Moving Averages for Trend Filtering:
Two important ones used are moving averages for filtering any signals not in accordance with the general trend. The length of these MAs is variable, allowing the traders to be in a position to adapt the script for use under different market conditions. The moving averages ensure that signals are only taken in the direction that supports the general market flow, so it leads to more reliability within the signals. The MAs are not plotted on the chart for the sake of clarity, but they still perform a crucial function in signal filtering and can be displayed optionally for a more detailed investigation. Cooldown filter to reduce over-trading
This is part of what is implemented in the script to prevent generation of consecutive signals too quickly. All this helps to reduce market noise and not overtrade—only when market conditions are at their best. The cooldown period can be set to be adjusted according to the trader's preference, making the script more versatile in its use. Practical Considerations: Educational Purpose: This script is for educational purposes only and should be part of a comprehensive trading approach. Proper risk management techniques should be observed while at the same time taking into consideration prevailing market conditions before making any trading decision.
No Guaranteed Results: The script is aimed at bringing signal accuracy into improvement to align with the broader market trend and reducing noise, but past performance cannot guarantee future success. Traders should use this script within their broad trading approach. Clean and Simple Chart Display: The primary goal of this script is to have a clear and simple display on the chart. The signals are prominently marked with "BUY" and "SELL," and the color of the bars has changed according to the last signal, thus traders can easily read the output. Community and Open Source Open Source Contribution: This script is open for contribution by the TradingView community. Any suggestions regarding improvements are highly welcomed. Candlestick patterns, moving averages, and the combination of the cooldown filter are presented in such a way as to give traders something special, and any modifications or extra touch by the community is appreciated. Attribution and Transparency: The script is based on standard technical analysis principles and for all parts inspired by or derivated from other available open-source scripts, credit is given where it is due. In this way, transparency ensures that the script adheres to TradingView's standards and promotes a collaborative community environment.
Support & Resistance AI (K means/median) [ThinkLogicAI]█ OVERVIEW
K-means is a clustering algorithm commonly used in machine learning to group data points into distinct clusters based on their similarities. While K-means is not typically used directly for identifying support and resistance levels in financial markets, it can serve as a tool in a broader analysis approach.
Support and resistance levels are price levels in financial markets where the price tends to react or reverse. Support is a level where the price tends to stop falling and might start to rise, while resistance is a level where the price tends to stop rising and might start to fall. Traders and analysts often look for these levels as they can provide insights into potential price movements and trading opportunities.
█ BACKGROUND
The K-means algorithm has been around since the late 1950s, making it more than six decades old. The algorithm was introduced by Stuart Lloyd in his 1957 research paper "Least squares quantization in PCM" for telecommunications applications. However, it wasn't widely known or recognized until James MacQueen's 1967 paper "Some Methods for Classification and Analysis of Multivariate Observations," where he formalized the algorithm and referred to it as the "K-means" clustering method.
So, while K-means has been around for a considerable amount of time, it continues to be a widely used and influential algorithm in the fields of machine learning, data analysis, and pattern recognition due to its simplicity and effectiveness in clustering tasks.
█ COMPARE AND CONTRAST SUPPORT AND RESISTANCE METHODS
1) K-means Approach:
Cluster Formation: After applying the K-means algorithm to historical price change data and visualizing the resulting clusters, traders can identify distinct regions on the price chart where clusters are formed. Each cluster represents a group of similar price change patterns.
Cluster Analysis: Analyze the clusters to identify areas where clusters tend to form. These areas might correspond to regions of price behavior that repeat over time and could be indicative of support and resistance levels.
Potential Support and Resistance Levels: Based on the identified areas of cluster formation, traders can consider these regions as potential support and resistance levels. A cluster forming at a specific price level could suggest that this level has been historically significant, causing similar price behavior in the past.
Cluster Standard Deviation: In addition to looking at the means (centroids) of the clusters, traders can also calculate the standard deviation of price changes within each cluster. Standard deviation is a measure of the dispersion or volatility of data points around the mean. A higher standard deviation indicates greater price volatility within a cluster.
Low Standard Deviation: If a cluster has a low standard deviation, it suggests that prices within that cluster are relatively stable and less likely to exhibit sudden and large price movements. Traders might consider placing tighter stop-loss orders for trades within these clusters.
High Standard Deviation: Conversely, if a cluster has a high standard deviation, it indicates greater price volatility within that cluster. Traders might opt for wider stop-loss orders to allow for potential price fluctuations without getting stopped out prematurely.
Cluster Density: Each data point is assigned to a cluster so a cluster that is more dense will act more like gravity and
2) Traditional Approach:
Trendlines: Draw trendlines connecting significant highs or lows on a price chart to identify potential support and resistance levels.
Chart Patterns: Identify chart patterns like double tops, double bottoms, head and shoulders, and triangles that often indicate potential reversal points.
Moving Averages: Use moving averages to identify levels where the price might find support or resistance based on the average price over a specific period.
Psychological Levels: Identify round numbers or levels that traders often pay attention to, which can act as support and resistance.
Previous Highs and Lows: Identify significant previous price highs and lows that might act as support or resistance.
The key difference lies in the approach and the foundation of these methods. Traditional methods are based on well-established principles of technical analysis and market psychology, while the K-means approach involves clustering price behavior without necessarily incorporating market sentiment or specific price patterns.
It's important to note that while the K-means approach might provide an interesting way to analyze price data, it should be used cautiously and in conjunction with other traditional methods. Financial markets are influenced by a wide range of factors beyond just price behavior, and the effectiveness of any method for identifying support and resistance levels should be thoroughly tested and validated. Additionally, developments in trading strategies and analysis techniques could have occurred since my last update.
█ K MEANS ALGORITHM
The algorithm for K means is as follows:
Initialize cluster centers
assign data to clusters based on minimum distance
calculate cluster center by taking the average or median of the clusters
repeat steps 1-3 until cluster centers stop moving
█ LIMITATIONS OF K MEANS
There are 3 main limitations of this algorithm:
Sensitive to Initializations: K-means is sensitive to the initial placement of centroids. Different initializations can lead to different cluster assignments and final results.
Assumption of Equal Sizes and Variances: K-means assumes that clusters have roughly equal sizes and spherical shapes. This may not hold true for all types of data. It can struggle with identifying clusters with uneven densities, sizes, or shapes.
Impact of Outliers: K-means is sensitive to outliers, as a single outlier can significantly affect the position of cluster centroids. Outliers can lead to the creation of spurious clusters or distortion of the true cluster structure.
█ LIMITATIONS IN APPLICATION OF K MEANS IN TRADING
Trading data often exhibits characteristics that can pose challenges when applying indicators and analysis techniques. Here's how the limitations of outliers, varying scales, and unequal variance can impact the use of indicators in trading:
Outliers are data points that significantly deviate from the rest of the dataset. In trading, outliers can represent extreme price movements caused by rare events, news, or market anomalies. Outliers can have a significant impact on trading indicators and analyses:
Indicator Distortion: Outliers can skew the calculations of indicators, leading to misleading signals. For instance, a single extreme price spike could cause indicators like moving averages or RSI (Relative Strength Index) to give false signals.
Risk Management: Outliers can lead to overly aggressive trading decisions if not properly accounted for. Ignoring outliers might result in unexpected losses or missed opportunities to adjust trading strategies.
Different Scales: Trading data often includes multiple indicators with varying units and scales. For example, prices are typically in dollars, volume in units traded, and oscillators have their own scale. Mixing indicators with different scales can complicate analysis:
Normalization: Indicators on different scales need to be normalized or standardized to ensure they contribute equally to the analysis. Failure to do so can lead to one indicator dominating the analysis due to its larger magnitude.
Comparability: Without normalization, it's challenging to directly compare the significance of indicators. Some indicators might have a larger numerical range and could overshadow others.
Unequal Variance: Unequal variance in trading data refers to the fact that some indicators might exhibit higher volatility than others. This can impact the interpretation of signals and the performance of trading strategies:
Volatility Adjustment: When combining indicators with varying volatility, it's essential to adjust for their relative volatilities. Failure to do so might lead to overemphasizing or underestimating the importance of certain indicators in the trading strategy.
Risk Assessment: Unequal variance can impact risk assessment. Indicators with higher volatility might lead to riskier trading decisions if not properly taken into account.
█ APPLICATION OF THIS INDICATOR
This indicator can be used in 2 ways:
1) Make a directional trade:
If a trader thinks price will go higher or lower and price is within a cluster zone, The trader can take a position and place a stop on the 1 sd band around the cluster. As one can see below, the trader can go long the green arrow and place a stop on the one standard deviation mark for that cluster below it at the red arrow. using this we can calculate a risk to reward ratio.
Calculating risk to reward: targeting a risk reward ratio of 2:1, the trader could clearly make that given that the next resistance area above that in the orange cluster exceeds this risk reward ratio.
2) Take a reversal Trade:
We can use cluster centers (support and resistance levels) to go in the opposite direction that price is currently moving in hopes of price forming a pivot and reversing off this level.
Similar to the directional trade, we can use the standard deviation of the cluster to place a stop just in case we are wrong.
In this example below we can see that shorting on the red arrow and placing a stop at the one standard deviation above this cluster would give us a profitable trade with minimal risk.
Using the cluster density table in the upper right informs the trader just how dense the cluster is. Higher density clusters will give a higher likelihood of a pivot forming at these levels and price being rejected and switching direction with a larger move.
█ FEATURES & SETTINGS
General Settings:
Number of clusters: The user can select from 3 to five clusters. A good rule of thumb is that if you are trading intraday, less is more (Think 3 rather than 5). For daily 4 to 5 clusters is good.
Cluster Method: To get around the outlier limitation of k means clustering, The median was added. This gives the user the ability to choose either k means or k median clustering. K means is the preferred method if the user things there are no large outliers, and if there appears to be large outliers or it is assumed there are then K medians is preferred.
Bars back To train on: This will be the amount of bars to include in the clustering. This number is important so that the user includes bars that are recent but not so far back that they are out of the scope of where price can be. For example the last 2 years we have been in a range on the sp500 so 505 days in this setting would be more relevant than say looking back 5 years ago because price would have to move far to get there.
Show SD Bands: Select this to show the 1 standard deviation bands around the support and resistance level or unselect this to just show the support and resistance level by itself.
Features:
Besides the support and resistance levels and standard deviation bands, this indicator gives a table in the upper right hand corner to show the density of each cluster (support and resistance level) and is color coded to the cluster line on the chart. Higher density clusters mean price has been there previously more than lower density clusters and could mean a higher likelihood of a reversal when price reaches these areas.
█ WORKS CITED
Victor Sim, "Using K-means Clustering to Create Support and Resistance", 2020, towardsdatascience.com
Chris Piech, "K means", stanford.edu
█ ACKNOLWEDGMENTS
@jdehorty- Thanks for the publish template. It made organizing my thoughts and work alot easier.
TCG AI ToolsIntroduction:
This script is a result of an AI recommended created trading strategy that is design to offer new traders’ easy access to trend information and oversold/overbought conditions. Here we have combined commonly used indicators into a single unique visualization that quickly identifies trend changes and both RSI and Bollinger Band based overbought and oversold conditions, and allows all three indicators to be used simultaneously while taking up limited space on the chart.
The value in combining these three indicators is found in the harmony and clarity they are able to provide new traders. Trend changes can be difficult to identify based solely on candlestick analysis, therefore using the moving averages allows the trader to simplify the process of establishing bullish or bearish trends. Once a trend is established it can be very attractive for new traders to establish entries at the wrong time. For this reason, it is useful to include two different overbought and oversold indicators. The Bollinger Bands are included as one of the methods for establishing extreme prices that often result in reversals, and the relative strength index is similarly utilized as a second means to warn traders of extreme conditions.
Using the Indicator
1. MA10 MA20 Trend Indicator
The large red/green horizontal bar located at the 0 line on the X axis is the trend direction indicator. This visualization compares the 10 and 20 period moving averages to establish trend. When the MA10 is above the MA20 the trend is considered bullish and supportive of long positions and indicates such by changing the color of the horizontal bar to green. When the MA10 is below MA20 the trend is considered bearish and indicates such by changing the color of the horizontal bar to red. Color changes occur at the moment of a MA crossover/under.
2. Relative Strength Index.
The vertical red and green bars that make up the background of the panel indicate conditions wherein the RSI is considered overbought or oversold. When the vertical bar is red it indicates that RSI is below 30 suggesting that current conditions are oversold and supportive of long entries. When the vertical bar is green it suggests that the current conditions are overbought and are supportive of short entries.
3. Bollinger Band Extremes
Within the horizontal red/green bar there are red and green arrows. These arrows represent periods where the price is exceeding the upper or lower Bollinger bands and indicate overbought/oversold conditions. When a green arrow appears, it indicates that the price has crossed below the lower BB and is supportive of long entries. If a red arrow appears it indicates that the price has crossed above the upper Bollinger band and conditions are supportive of short entries.
Universal Moving Average Convergence DivergenceI changed MACD formula to divergence of (MA26/MA12 - 1).
And its make it more useful.
Cuz:
1) comparability with all other coins with different prices.
2) fix small numbers in low price coines like shiba
3) making a good indicator like RSI to use it for optimization and ML/AI projects as a variable
Most important thing about this indicator is that its Universal
Now you can compare the UMACD of Shiba with Bitcoin without any problem in matamatics space.No need to use virtuality and its important in Optimization problems that we rediuse the problem from a picture to a number(A plot to a list of numbers)
If we don't care about exagrated pumps and dumps, we can say to it Normalized-MACD too. Cuz in normal situations its MAX ≈ 0.1 and MIN ≈ -0.1
AI-123's BTC vs Gold (Lag Correlation)
DISCLAIMER
I made this indicator with the help of ChatGPT and using what I have learned so far from The Pine Script Mastery Course, LOTS of edits based on what I have learned so far had to be made as well as additions and modifications to my liking thanks to what I have learned so far. I am aware this already exists but I have done my best to make a first ever script/indicator while learning how to properly publish as well, so please bear that in mind.
Overview
This indicator analyzes the correlation between Bitcoin (BTC) and Gold (XAUUSD), with a customizable lag applied to the Gold price, providing insight into the macro relationship between these two assets.
It is designed for traders and investors who want to track how Bitcoin and Gold move in relation to each other, particularly when Gold is lagged by a specific number of days.
Key Features:
BTC and Gold (Lagged) Price Overlay: Display Bitcoin (BTC) and Gold (XAUUSD) prices on the chart, with an adjustable lag applied to the Gold price.
Rolling Correlation Calculation: Measures the correlation between Bitcoin and lagged Gold prices over a customizable lookback period.
Adjustable Lag: The number of days that Gold is lagged relative to Bitcoin is fully customizable (default: 20 days).
Customizable Correlation Length: Allows you to choose the lookback period for the correlation (default: 50 days), providing flexibility for short-term or long-term analysis.
Normalized Plotting: Prices of Bitcoin and Gold are normalized for better visual alignment with the correlation values. BTC is divided by 1000, and Gold by 100.
Correlation Scaling: The correlation value is amplified by 10 for better visual clarity and comparison with price data.
Zero Line: Horizontal line representing a correlation of 0, making it easier to identify positive or negative correlation shifts.
Maximum Correlation Lines: Horizontal lines at +10 and -10 values for extreme correlation scenarios.
Input Settings:
Gold Symbol: Customize the Gold ticker (default: OANDA:XAUUSD).
Bitcoin Symbol: Customize the Bitcoin ticker (default: BINANCE:BTCUSDT).
Lag (in trading days): Adjust the number of trading days to lag the Gold price relative to Bitcoin (default: 20).
Correlation Length (days): Set the number of days over which the rolling correlation is calculated (default: 50).
How to Use:
Price Comparison: The BTC (Spot) and Lagged Gold plots give you a side-by-side visual comparison of the two assets, normalized for clarity.
Correlation Line: The correlation line helps you gauge the strength and direction of the relationship between BTC and lagged Gold. Positive values indicate a strong positive correlation, while negative values indicate a negative correlation.
Visual Analysis: Watch how the correlation shifts with changes in lag and correlation length to identify potential market dynamics between Bitcoin and Gold.
Potential Applications:
Macro Trading: Track how Bitcoin and Gold behave in relation to each other during periods of economic uncertainty or inflation.
Sentiment Analysis: Use the correlation data to understand the sentiment between digital and traditional assets.
Strategic Timing: Identify potential opportunities where Bitcoin and Gold show a strong correlation or diverge based on the lag adjustment.
Understanding Macro Trends/Correlations.
Disclaimer:
This indicator is for informational purposes only. The correlation between Bitcoin and Gold does not guarantee future performance, and users should conduct their own research and use risk management strategies when making trading decisions.
Notes: This script uses historical data, so results may vary across different timeframes.
Customization options allow users to adjust the lag and correlation length to better fit their trading strategy.
Future Enhancements: Additional Correlation Line: A second correlation line for different lengths of lag or different assets.
Color-Coding of Correlation: Future updates may include color-coded correlation strength, visually indicating positive or negative correlation more effectively.
Enhanced Order Flow Pressure GaugeShort Description:
Estimates bullish/bearish pressure by analyzing each candle’s close position within its range, then weighting that by volume. Detects potential trend shifts and provides real-time signals.
Full Description:
1. Purpose
The Enhanced Order Flow Pressure Gauge (OFPG+) is designed to approximate buy vs. sell pressure within each bar, even if you don’t have full Level II / order flow data. By measuring the candle’s close relative to its high-low range and multiplying by volume, OFPG+ provides insights into which side of the market (bulls or bears) is more aggressive in a given interval.
2. Key Components
Pressure Score (Histogram):
Raw measure of each bar’s close position (rangePos) minus midpoint, multiplied by volume. If the bar closes near its high with decent volume, the score is positive (bullish). Conversely, a close near its low yields a negative (bearish) reading.
Cumulative Pressure:
Sum of all pressure readings over time (similar to cumulative delta), reflecting the overall market bias.
Pressure Delta:
The change in cumulative pressure from one bar to the next, plotted as a line. Rising values suggest increasing bullish momentum, while falling values show growing bearish influence.
3. Visual Cues & Signals
Histogram (Pressure Profile): A color-coded bar for each candle, indicating net bullish (blue) or bearish (gray) intrabar pressure.
Pressure Delta Line: Plotted over the histogram. Turns bullish (blue) when net buy pressure is increasing, or bearish (gray) when net selling accelerates.
Background Highlights:
Turns lightly blue if the smoothed pressure line exceeds the positive threshold, or lightly gray if it goes below the negative threshold.
Bullish / Bearish Signals:
Bullish Signal occurs when the smoothed pressure line crosses above the positive threshold, combined with a positive Delta.
Bearish Signal occurs when the smoothed pressure line crosses below the negative threshold, combined with a negative Delta.
Confirmed Signals:
After a bullish/bearish signal, OFPG+ checks the highest or lowest smoothed pressure values over a user-defined number of bars (signalLookback) to confirm momentum.
Plotshapes (diamond icons) appear on the chart to mark these confirmed reversals.
4. Usage Scenarios
Trend-Following / Momentum: Watch for transitions from negative to positive net pressure or vice versa. Helps identify potential turning points.
Reversal Confirmation: The threshold-based signals plus the “confirmed” checks can help filter choppy conditions.
Volume-Weighted Insights: By factoring in volume, strong closes near the highs or lows are weighted more heavily, capturing sentiment shifts.
5. Inputs & Parameters
Smoothing Length (length): The EMA period for smoothing the raw pressure score.
Volume Weight (volWeight): Scales the volume impact on pressure calculations.
Pressure Threshold (threshold): Defines when pressure is considered significantly bullish or bearish.
Signal Lookback (signalLookback): Number of bars to confirm momentum after a signal.
6. Alerts
Bullish Signal & Confirmed Bullish
Bearish Signal & Confirmed Bearish
These alerts can notify you in real-time about potential shifts in the market’s buying or selling pressure.
7. Disclaimer
This script provides an approximation of order flow by analyzing candle structure and volume. It does not represent actual exchange-level order data.
Past performance is not necessarily indicative of future results. Always conduct thorough analysis and use proper risk management.
Not financial advice. Use at your own discretion.
AI indicatorThis script is a trading indicator designed for future trading signals on the TradingView platform. It uses a combination of the Relative Strength Index (RSI) and a Simple Moving Average (SMA) to generate buy and sell signals. Here's a breakdown of its components and logic:
1. Inputs
The script includes configurable inputs to make it adaptable for different market conditions:
RSI Length: Determines the number of periods for calculating RSI. Default is 14.
RSI Overbought Level: Signals when RSI is above this level (default 70), indicating potential overbought conditions.
RSI Oversold Level: Signals when RSI is below this level (default 30), indicating potential oversold conditions.
Moving Average Length: Defines the SMA length used to confirm price trends (default 50).
2. Indicators Used
RSI (Relative Strength Index):
Measures the speed and change of price movements.
A value above 70 typically indicates overbought conditions.
A value below 30 typically indicates oversold conditions.
SMA (Simple Moving Average):
Used to smooth price data and identify trends.
Price above the SMA suggests an uptrend, while price below suggests a downtrend.
3. Buy and Sell Signal Logic
Buy Condition:
The RSI value is below the oversold level (e.g., 30), indicating the market might be undervalued.
The current price is above the SMA, confirming an uptrend.
Sell Condition:
The RSI value is above the overbought level (e.g., 70), indicating the market might be overvalued.
The current price is below the SMA, confirming a downtrend.
These conditions ensure that trades align with market trends, reducing false signals.
4. Visual Features
Buy Signals: Displayed as green labels (plotshape) below the price bars when the buy condition is met.
Sell Signals: Displayed as red labels (plotshape) above the price bars when the sell condition is met.
Moving Average Line: A blue line (plot) added to the chart to visualize the SMA trend.
5. How It Works
When the buy condition is true (RSI < 30 and price > SMA), a green label appears below the corresponding price bar.
When the sell condition is true (RSI > 70 and price < SMA), a red label appears above the corresponding price bar.
The blue SMA line helps to visualize the overall trend and acts as confirmation for signals.
6. Advantages
Combines Momentum and Trend Analysis:
RSI identifies overbought/oversold conditions.
SMA confirms whether the market is trending up or down.
Simple Yet Effective:
Reduces noise by using well-established indicators.
Easy to interpret for beginners and experienced traders alike.
Customizable:
Parameters like RSI length, oversold/overbought levels, and SMA length can be adjusted to fit different assets or timeframes.
7. Limitations
Lagging Indicator: SMA is a lagging indicator, so it may not capture rapid market reversals quickly.
Not Foolproof: No trading indicator can guarantee 100% accuracy. False signals can occur in choppy or sideways markets.
Needs Volume Confirmation: The script does not consider trading volume, which could enhance signal reliability.
8. How to Use It
Copy the script into TradingView's Pine Editor.
Save and add it to your chart.
Adjust the RSI and SMA parameters to suit your preferred asset and timeframe.
Look for buy signals (green labels) in uptrends and sell signals (red labels) in downtrends.
Dynamic ALMA with signalsEnhanced ALMA with Signals
This TradingView indicator is designed to enhance your trading strategy by utilizing the Arnaud Legoux Moving Average (ALMA), a unique moving average that provides smoother price action while minimizing lag. The script not only plots the ALMA line but also dynamically adjusts its parameters based on market volatility to adapt to different trading conditions. Additionally, it highlights potential bounce points off the line, as well as breakout points, giving traders clear signals for potential support, resistance levels, and breakouts.
Key Features:
Dynamic ALMA Line with Glow Effect:
The core of this indicator is the ALMA line, which is dynamically adjusted to market volatility, providing more accurate signals in varying conditions. The line adapts to both trending and consolidating markets by adjusting its sensitivity in real time. A glow effect is created by plotting the ALMA line multiple times with increasing transparency, making it visually distinct.
Bounce Detection Signals with Volatility Filter:
The script detects and labels potential support and resistance bounces based on the crossover and crossunder of the price with the ALMA line, further filtered by a volatility condition. This helps in filtering out false signals during low-volatility conditions, making the signals more reliable.
Visual Enhancements:
Custom glow effects and labels for bounce detection enhance chart readability and help traders quickly identify key levels.
Inputs:
Base Window Size: Sets the number of bars used in calculating the ALMA, allowing traders to adjust the sensitivity of the moving average. This parameter is dynamically adjusted based on current market volatility.
Offset: Determines the position of the ALMA curve. Higher values move the curve further away from the price. This value remains constant for stability.
Sigma: Controls the smoothness of the ALMA curve; a higher sigma results in a smoother curve. This value also remains constant.
ATR Period and Threshold Multiplier: Used to calculate the Average True Range (ATR) for the volatility filter, which determines whether the market conditions are sufficiently volatile to consider bounce signals.
How It Works:
Dynamic ALMA Calculation:
The script calculates the ALMA (Arnaud Legoux Moving Average) using the ta.alma function, dynamically adjusting the window size based on market volatility measured by the ATR (Average True Range). This ensures that the ALMA line remains responsive in high-volatility environments and smooth in low-volatility conditions.
Glow Effect:
To create a glow effect around the ALMA line, the script plots the ALMA multiple times with varying degrees of transparency. This visual enhancement helps the ALMA line stand out on the chart.
Bounce Detection with Volatility Filter:
The script uses two conditions to detect potential bounces:
Support Bounce: Detected when the low of the bar crosses above the ALMA line (ta.crossover(low, alma)) and the close is above the ALMA, while the volatility filter confirms sufficient market activity. This suggests potential support at the ALMA line.
Resistance Bounce: Detected when the high of the bar crosses below the ALMA line (ta.crossunder(high, alma)) and the close is below the ALMA, while the volatility filter confirms sufficient market activity. This indicates potential resistance at the ALMA line.
Labeling Bounce Points:
When a bounce is detected, the script labels it on the chart:
Support Bounces (S): Labeled with a blue "S" below the bar where a support bounce is detected.
Resistance Bounces (R): Labeled with a white "R" above the bar where a resistance bounce is detected.
Usage:
This enhanced indicator helps traders visualize key support and resistance levels more effectively by dynamically adjusting the ALMA moving average to market conditions. By detecting and labeling potential bounce points and filtering these signals based on volatility, traders can better identify entry and exit points in their trading strategy. The dynamic adjustments and visual enhancements make it easier to spot critical levels quickly and adapt to changing market conditions.
Customize the inputs to fit your trading style, and use this enhanced ALMA indicator to gain a more refined understanding of market trends, potential reversals, and breakouts.
AI-Bank-Nifty Tech AnalysisThis code is a TradingView indicator that analyzes the Bank Nifty index of the Indian stock market. It uses various inputs to customize the indicator's appearance and analysis, such as enabling analysis based on the chart's timeframe, detecting bullish and bearish engulfing candles, and setting the table position and style.
The code imports an external script called BankNifty_CSM, which likely contains functions that calculate technical indicators such as the RSI, MACD, VWAP, and more. The code then defines several table cell colors and other styling parameters.
Next, the code defines a table to display the technical analysis of eight bank stocks in the Bank Nifty index. It then defines a function called get_BankComponent_Details that takes a stock symbol as input, requests the stock's OHLCV data, and calculates several technical indicators using the imported CSM_BankNifty functions.
The code also defines two functions called get_EngulfingBullish_Detection and get_EngulfingBearish_Detection to detect bullish and bearish engulfing candles.
Finally, the code calculates the technical analysis for each bank stock using the get_BankComponent_Details function and displays the results in the table. If the engulfing input is enabled, the code also checks for bullish and bearish engulfing candles and displays buy/sell signals accordingly.
The FRAMA stands for "Fractal Adaptive Moving Average," which is a type of moving average that adjusts its smoothing factor based on the fractal dimension of the price data. The fractal dimension reflects self-similarity at different scales. The FRAMA uses this property to adapt to the scale of price movements, capturing short-term and long-term trends while minimizing lag. The FRAMA was developed by John F. Ehlers and is commonly used by traders and analysts in technical analysis to identify trends and generate buy and sell signals. I tried to create this indicator in Pine.
In this context, "RS" stands for "Relative Strength," which is a technical indicator that compares the performance of a particular stock or market sector against a benchmark index.
The "Alligator" is a technical analysis tool that consists of three smoothed moving averages. Introduced by Bill Williams in his book "Trading Chaos," the three lines are called the Jaw, Teeth, and Lips of the Alligator. The Alligator indicator helps traders identify the trend direction and its strength, as well as potential entry and exit points. When the three lines are intertwined or close to each other, it indicates a range-bound market, while a divergence between them indicates a trending market. The position of the price in relation to the Alligator lines can also provide signals, such as a buy signal when the price crosses above the Alligator lines and a sell signal when the price crosses below them.
In addition to these, we have several other commonly used technical indicators, such as MACD, RSI, MFI (Money Flow Index), VWAP, EMA, and Supertrend. I used all the built-in functions for these indicators from TradingView. Thanks to the developer of this TradingView Indicator.
I also created a BankNifty Components Table and checked it on the dashboard.
AI-EngulfingCandleThis script is the combination of RSI and Engulfing Pattern
How it works
1. when RSI > 70 and form the bullish engulfing pattern . it gives sell signal
2. when RSI < 30 and form the bearish engulfing pattern . it gives buy signal
settings:
basic setting for RSI has been enabled in the script to set the levels accordingly to your trades
AiTrend Pattern Matrix for kNN Forecasting (AiBitcoinTrend)The AiTrend Pattern Matrix for kNN Forecasting (AiBitcoinTrend) is a cutting-edge indicator that combines advanced mathematical modeling, AI-driven analytics, and segment-based pattern recognition to forecast price movements with precision. This tool is designed to provide traders with deep insights into market dynamics by leveraging multivariate pattern detection and sophisticated predictive algorithms.
👽 Core Features
Segment-Based Pattern Recognition
At its heart, the indicator divides price data into discrete segments, capturing key elements like candle bodies, high-low ranges, and wicks. These segments are normalized using ATR-based volatility adjustments to ensure robustness across varying market conditions.
AI-Powered k-Nearest Neighbors (kNN) Prediction
The predictive engine uses the kNN algorithm to identify the closest historical patterns in a multivariate dictionary. By calculating the distance between current and historical segments, the algorithm determines the most likely outcomes, weighting predictions based on either proximity (distance) or averages.
Dynamic Dictionary of Historical Patterns
The indicator maintains a rolling dictionary of historical patterns, storing multivariate data for:
Candle body ranges, High-low ranges, Wick highs and lows.
This dynamic approach ensures the model adapts continuously to evolving market conditions.
Volatility-Normalized Forecasting
Using ATR bands, the indicator normalizes patterns, reducing noise and enhancing the reliability of predictions in high-volatility environments.
AI-Driven Trend Detection
The indicator not only predicts price levels but also identifies market regimes by comparing current conditions to historically significant highs, lows, and midpoints. This allows for clear visualizations of trend shifts and momentum changes.
👽 Deep Dive into the Core Mathematics
👾 Segment-Based Multivariate Pattern Analysis
The indicator analyzes price data by dividing each bar into distinct segments, isolating key components such as:
Body Ranges: Differences between the open and close prices.
High-Low Ranges: Capturing the full volatility of a bar.
Wick Extremes: Quantifying deviations beyond the body, both above and below.
Each segment contributes uniquely to the predictive model, ensuring a rich, multidimensional understanding of price action. These segments are stored in a rolling dictionary of patterns, enabling the indicator to reference historical behavior dynamically.
👾 Volatility Normalization Using ATR
To ensure robustness across varying market conditions, the indicator normalizes patterns using Average True Range (ATR). This process scales each component to account for the prevailing market volatility, allowing the algorithm to compare patterns on a level playing field regardless of differing price scales or fluctuations.
👾 k-Nearest Neighbors (kNN) Algorithm
The AI core employs the kNN algorithm, a machine-learning technique that evaluates the similarity between the current pattern and a library of historical patterns.
Euclidean Distance Calculation:
The indicator computes the multivariate distance across four distinct dimensions: body range, high-low range, wick low, and wick high. This ensures a comprehensive and precise comparison between patterns.
Weighting Schemes: The contribution of each pattern to the forecast is either weighted by its proximity (distance) or averaged, based on user settings.
👾 Prediction Horizon and Refinement
The indicator forecasts future price movements (Y_hat) by predicting logarithmic changes in the price and projecting them forward using exponential scaling. This forecast is smoothed using a user-defined EMA filter to reduce noise and enhance actionable clarity.
👽 AI-Driven Pattern Recognition
Dynamic Dictionary of Patterns: The indicator maintains a rolling dictionary of N multivariate patterns, continuously updated to reflect the latest market data. This ensures it adapts seamlessly to changing market conditions.
Nearest Neighbor Matching: At each bar, the algorithm identifies the most similar historical pattern. The prediction is based on the aggregated outcomes of the closest neighbors, providing confidence levels and directional bias.
Multivariate Synthesis: By combining multiple dimensions of price action into a unified prediction, the indicator achieves a level of depth and accuracy unattainable by single-variable models.
Visual Outputs
Forecast Line (Y_hat_line):
A smoothed projection of the expected price trend, based on the weighted contribution of similar historical patterns.
Trend Regime Bands:
Dynamic high, low, and midlines highlight the current market regime, providing actionable insights into momentum and range.
Historical Pattern Matching:
The nearest historical pattern is displayed, allowing traders to visualize similarities
👽 Applications
Trend Identification:
Detect and follow emerging trends early using dynamic trend regime analysis.
Reversal Signals:
Anticipate market reversals with high-confidence predictions based on historically similar scenarios.
Range and Momentum Trading:
Leverage multivariate analysis to understand price ranges and momentum, making it suitable for both breakout and mean-reversion strategies.
Disclaimer: This information is for entertainment purposes only and does not constitute financial advice. Please consult with a qualified financial advisor before making any investment decisions.
RSI Phi PhiSống để cho đi.
Phương pháp của sư phụ
Sống trong đời sống cần có một tấm lòng
Để làm gì, em biết không?
Để gió cuốn đi
Để gió cuốn đi
Gió cuốn đi cho mây qua dòng sông
Ngày vừa lên hay đêm xuống mênh mông
Ôi trái tim đang bay theo thời gian
Làm chiếc bóng đi rao lời dối gian
Những khi chiều tới, cần có một tiếng cười
Để ngậm ngùi theo lá bay
Rồi nước cuốn trôi
Rồi nước cuốn trôi
Hãy nghiêng đời xuống, nhìn suốt một mối tình
Chỉ lặng nhìn không nói năng
Để buốt trái tim
Để buốt trái tim
Trong trái tim con chim đau nằm yên
Ngủ dài lâu mang theo vết thương sâu
Một sớm mai, chim bay đi triền miên
Và tiếng hót tan trong trời gió lên
Hãy yêu ngày tới dù quá mệt kiếp người
Còn cuộc đời, ta cứ vui
Dù vắng bóng ai
Dù vắng bóng ai
Dù vắng bóng ai
Dù vắng bóng ai
Dù vắng bóng ai
Linear Regression Channel Screener [Daveatt]Hello traders
First and foremost, I want to extend a huge thank you to @LonesomeTheBlue for his exceptional Linear Regression Channel indicator that served as the foundation for this screener.
Original work can be found here:
Overview
This project demonstrates how to transform any open-source indicator into a powerful multi-asset screener.
The principles shown here can be applied to virtually any indicator you find interesting.
How to Transform an Indicator into a Screener
Step 1: Identify the Core Logic
First, identify the main calculations of the indicator.
In our case, it's the Linear Regression
Channel calculation:
get_channel(src, len) =>
mid = math.sum(src, len) / len
slope = ta.linreg(src, len, 0) - ta.linreg(src, len, 1)
intercept = mid - slope * math.floor(len / 2) + (1 - len % 2) / 2 * slope
endy = intercept + slope * (len - 1)
dev = 0.0
for x = 0 to len - 1 by 1
dev := dev + math.pow(src - (slope * (len - x) + intercept), 2)
dev
dev := math.sqrt(dev / len)
Step 2: Use request.security()
Pass the function to request.security() to analyze multiple assets:
= request.security(sym, timeframe.period, get_channel(src, len))
Step 3: Scale to Multiple Assets
PineScript allows up to 40 request.security() calls, letting you monitor up to 40 assets simultaneously.
Features of This Screener
The screener provides real-time trend detection for each monitored asset, giving you instant insights into market movements.
It displays each asset's position relative to its middle regression line, helping you understand price momentum.
The data is presented in a clean, organized table with color-coded trends for easy interpretation.
At its core, the screener performs trend detection based on regression slope calculations, clearly indicating whether an asset is in a bullish or bearish trend.
Each asset's price is tracked relative to its middle regression line, providing additional context about trend strength.
The color-coded visual feedback makes it easy to spot changes at a glance.
Built-in alerts notify you instantly when any asset experiences a trend change, ensuring you never miss important market moves.
Customization Tips
You can easily expand the screener by adding more symbols to the symbols array, adapting it to your watchlist.
The regression parameters can be adjusted to match your preferred trading timeframes and sensitivity.
The alert system is already configured to notify you of trend changes, but you can customize the alert messages and conditions to your needs.
Limitations
While powerful, the screener is bound by PineScript's limitation of 40 security calls, capping the maximum number of monitored assets.
Using AI to Help With Conversion
An interesting tip:
You can use AI tools to help convert single-asset indicators to screeners.
Simply provide the original code and ask for assistance in transforming it into a screener format. While the AI output might need some syntax adjustments, it can handle much of the heavy lifting in the conversion process.
Prompt (example) : " Please make a pinescript version 5 screener out of this indicator below or in attachment to scan 20 instruments "
I prefer Claude AI (Opus model) over ChatGPT for pinescript.
Conclusion
This screener transformation technique opens up endless possibilities for market analysis.
By following these steps, you can convert any indicator into a powerful multi-asset scanner, enhancing your trading toolkit significantly.
Remember: The power of a screener lies not just in monitoring multiple assets, but in applying consistent analysis across your entire watchlist in real-time.
Feel free to fork and modify this screener for your own needs.
Happy trading! 🚀📈
Daveatt
PCA-Risk IndicatorOBJECTIVE:
The objective of this indicator is to synthesize, via PCA (Principal Component Analysis), several of the most used indicators with in order to simplify the reading of any asset on any timeframe.
It is based on my Bitcoin Risk Long Term indicator, and is the evolution of another indicator that I have not published 'Average Risk Indicator'.
The idea of this indicator is to use statistics, in this case the PCA, to reduce the number of dimensions (indicator) to aggregate them in some synthetic indicators (PCX)
I invite you to dig deeper into the PCA, but that is to try to keep as much information as possible from the raw data. The signal minus the noise.
I realized this indicator a year ago, but I publish it now because I do not see the interest to keep it private.
USAGE:
Unlike the Bitcoin Risk Long Term indicator, it does not make sense to change or disable the input indicators unless you use the 'Average Indicator' function. Because each input is weighted to generate the outputs, the PCX.
I extracted several courses (Bitcoin, Gold, S&P, CAC40) on several timeframes (W, D, 4h, 1h) of Trading view and use the Excel generated for the data on which I played the PCA analysis.
The results:
explained_variance_ratio: 0.55540809 / 0.13021972 / 0.07303142 / 0.03760925
explained_variance: 11.6639671 / 2.73470717 / 1.53371209 / 0.7898212
Interpretation:
Simply put, 55% of the information contained in each indicator can be represented with PC1, +13% with PC2, +7% with PC3, +3% with PC4.
What is important to understand is that PC1, which serves as a thermometer in a way, gives a simple indication of over-buying or over-selling area better than any other indicator.
PC2, difficult to interpret, is more reactive because precedes PC1, but can give false signals.
PC3 and PC4 do not seem relevant to me.
The way I use it is to take PC1 for Risk indicator, and display PC2 with 'Area'. When PC2 turns around and PC1 arrives on extremes, it can be good points to act.
NOTES :
- It is surprising that a simple average of all the indicators gives a fairly relevant result
- With Average indicator as Risk indicator, you can combine the indicators of your choice and see the predictive power with the staining of bars.
- You can add alerts on the levels of your choice on the Risk Indicator
- If you have any idea of adding an indicator, modification, criticism, bug found: share them, it’s appreciated!
---- FR ----
OBJECTIF :
L'objectif de cet indicateur est de synthétiser, via l'ACP (Analyse en Composantes Principales), plusieurs indicateurs parmi les plus utilisés avec afin de simplifier la lecture de n'importe quel actif sur n'importe quel timeframe.
Il est inspiré de mon indicateur 'Bitcoin Risk Long Term indicator', et est l'évolution d'un autre indicateur que je n'ai pas publié 'Average Risk Indicator'.
L'idée de cet indicateur est d'utiliser les statistiques, en l'occurence l'ACP, pour réduire le nombre de dimensions (indicateur) pour les agréger dans quelques indicateurs synthétiques (PCX)
Je vous invite à creuser l'ACP, mais c'est chercher à conserver un maximum d'informations à partir de la donnée brute. Le signal moins le bruit.
J'ai réalisé cet indicateur il y a un an, mais je le publie maintenant car je ne vois pas l'intérêt de le garder privé.
UTILISATION :
Contrairement à 'Bitcoin Risk Long Term indicator', il ne fait pas sens de modifier ou désactiver les indicateurs inputs, sauf si vous utiliser la fonction 'Average Indicator'. Car chaque input est pondéré pour générer les outputs, les PCX.
J'ai extrait plusieurs cours (Bitcoin, Gold, S&P, CAC40) sur plusieurs timeframes (W, D, 4h, 1h) de Trading view et utiliser les Excel généré pour la data sur laquelle j'ai joué l'analyse ACP.
Les résultats :
explained_variance_ratio : 0.55540809 / 0.13021972 / 0.07303142 / 0.03760925
explained_variance : 11.6639671 / 2.73470717 / 1.53371209 / 0.7898212
Interprétation :
Pour faire simple, 55% de l'information contenu dans chaque indicateur peut être représenté avec PC1, +13% avec PC2, +7% avec PC3, +3% avec PC4.
Ce qui faut y comprendre c'est que le PC1, qui sert de thermomètre en quelque sorte, donne une indication simple de zone de sur-achat ou sur-vente mieux que n'importe quel autre indicateur.
PC2, difficile à interpréter, est plus réactif car précède PC1, mais peut donner des faux signaux.
PC3 et PC4 ne me semble pas pertinent.
La manière dont je m'en sert c'est de prendre PC1 pour Risk indicator, et d'afficher PC2 avec 'Region'. Lorsque PC2 se retourne et que PC1 arrive sur des extrêmes, cela peut être des bons points pour agir.
NOTES :
- Il est étonnant de constater qu'une simple moyenne de tous les indicateurs donne un résultat assez pertinent
- Avec Average indicator comme Risk indicator, vous pouvez combiner les indicateurs de vos choix et voir la force prédictive avec la coloration des bars.
- Vous pouvez ajouter des alertes sur les niveaux de votre choix sur le Risk Indicator
- Si vous avez la moindre idée d'ajout d'indicateur, modification, critique, bug trouvé : partagez-les, c'est apprécié !
Endpointed SSA of Price [Loxx]The Endpointed SSA of Price: A Comprehensive Tool for Market Analysis and Decision-Making
The financial markets present sophisticated challenges for traders and investors as they navigate the complexities of market behavior. To effectively interpret and capitalize on these complexities, it is crucial to employ powerful analytical tools that can reveal hidden patterns and trends. One such tool is the Endpointed SSA of Price, which combines the strengths of Caterpillar Singular Spectrum Analysis, a sophisticated time series decomposition method, with insights from the fields of economics, artificial intelligence, and machine learning.
The Endpointed SSA of Price has its roots in the interdisciplinary fusion of mathematical techniques, economic understanding, and advancements in artificial intelligence. This unique combination allows for a versatile and reliable tool that can aid traders and investors in making informed decisions based on comprehensive market analysis.
The Endpointed SSA of Price is not only valuable for experienced traders but also serves as a useful resource for those new to the financial markets. By providing a deeper understanding of market forces, this innovative indicator equips users with the knowledge and confidence to better assess risks and opportunities in their financial pursuits.
█ Exploring Caterpillar SSA: Applications in AI, Machine Learning, and Finance
Caterpillar SSA (Singular Spectrum Analysis) is a non-parametric method for time series analysis and signal processing. It is based on a combination of principles from classical time series analysis, multivariate statistics, and the theory of random processes. The method was initially developed in the early 1990s by a group of Russian mathematicians, including Golyandina, Nekrutkin, and Zhigljavsky.
Background Information:
SSA is an advanced technique for decomposing time series data into a sum of interpretable components, such as trend, seasonality, and noise. This decomposition allows for a better understanding of the underlying structure of the data and facilitates forecasting, smoothing, and anomaly detection. Caterpillar SSA is a particular implementation of SSA that has proven to be computationally efficient and effective for handling large datasets.
Uses in AI and Machine Learning:
In recent years, Caterpillar SSA has found applications in various fields of artificial intelligence (AI) and machine learning. Some of these applications include:
1. Feature extraction: Caterpillar SSA can be used to extract meaningful features from time series data, which can then serve as inputs for machine learning models. These features can help improve the performance of various models, such as regression, classification, and clustering algorithms.
2. Dimensionality reduction: Caterpillar SSA can be employed as a dimensionality reduction technique, similar to Principal Component Analysis (PCA). It helps identify the most significant components of a high-dimensional dataset, reducing the computational complexity and mitigating the "curse of dimensionality" in machine learning tasks.
3. Anomaly detection: The decomposition of a time series into interpretable components through Caterpillar SSA can help in identifying unusual patterns or outliers in the data. Machine learning models trained on these decomposed components can detect anomalies more effectively, as the noise component is separated from the signal.
4. Forecasting: Caterpillar SSA has been used in combination with machine learning techniques, such as neural networks, to improve forecasting accuracy. By decomposing a time series into its underlying components, machine learning models can better capture the trends and seasonality in the data, resulting in more accurate predictions.
Application in Financial Markets and Economics:
Caterpillar SSA has been employed in various domains within financial markets and economics. Some notable applications include:
1. Stock price analysis: Caterpillar SSA can be used to analyze and forecast stock prices by decomposing them into trend, seasonal, and noise components. This decomposition can help traders and investors better understand market dynamics, detect potential turning points, and make more informed decisions.
2. Economic indicators: Caterpillar SSA has been used to analyze and forecast economic indicators, such as GDP, inflation, and unemployment rates. By decomposing these time series, researchers can better understand the underlying factors driving economic fluctuations and develop more accurate forecasting models.
3. Portfolio optimization: By applying Caterpillar SSA to financial time series data, portfolio managers can better understand the relationships between different assets and make more informed decisions regarding asset allocation and risk management.
Application in the Indicator:
In the given indicator, Caterpillar SSA is applied to a financial time series (price data) to smooth the series and detect significant trends or turning points. The method is used to decompose the price data into a set number of components, which are then combined to generate a smoothed signal. This signal can help traders and investors identify potential entry and exit points for their trades.
The indicator applies the Caterpillar SSA method by first constructing the trajectory matrix using the price data, then computing the singular value decomposition (SVD) of the matrix, and finally reconstructing the time series using a selected number of components. The reconstructed series serves as a smoothed version of the original price data, highlighting significant trends and turning points. The indicator can be customized by adjusting the lag, number of computations, and number of components used in the reconstruction process. By fine-tuning these parameters, traders and investors can optimize the indicator to better match their specific trading style and risk tolerance.
Caterpillar SSA is versatile and can be applied to various types of financial instruments, such as stocks, bonds, commodities, and currencies. It can also be combined with other technical analysis tools or indicators to create a comprehensive trading system. For example, a trader might use Caterpillar SSA to identify the primary trend in a market and then employ additional indicators, such as moving averages or RSI, to confirm the trend and generate trading signals.
In summary, Caterpillar SSA is a powerful time series analysis technique that has found applications in AI and machine learning, as well as financial markets and economics. By decomposing a time series into interpretable components, Caterpillar SSA enables better understanding of the underlying structure of the data, facilitating forecasting, smoothing, and anomaly detection. In the context of financial trading, the technique is used to analyze price data, detect significant trends or turning points, and inform trading decisions.
█ Input Parameters
This indicator takes several inputs that affect its signal output. These inputs can be classified into three categories: Basic Settings, UI Options, and Computation Parameters.
Source: This input represents the source of price data, which is typically the closing price of an asset. The user can select other price data, such as opening price, high price, or low price. The selected price data is then utilized in the Caterpillar SSA calculation process.
Lag: The lag input determines the window size used for the time series decomposition. A higher lag value implies that the SSA algorithm will consider a longer range of historical data when extracting the underlying trend and components. This parameter is crucial, as it directly impacts the resulting smoothed series and the quality of extracted components.
Number of Computations: This input, denoted as 'ncomp,' specifies the number of eigencomponents to be considered in the reconstruction of the time series. A smaller value results in a smoother output signal, while a higher value retains more details in the series, potentially capturing short-term fluctuations.
SSA Period Normalization: This input is used to normalize the SSA period, which adjusts the significance of each eigencomponent to the overall signal. It helps in making the algorithm adaptive to different timeframes and market conditions.
Number of Bars: This input specifies the number of bars to be processed by the algorithm. It controls the range of data used for calculations and directly affects the computation time and the output signal.
Number of Bars to Render: This input sets the number of bars to be plotted on the chart. A higher value slows down the computation but provides a more comprehensive view of the indicator's performance over a longer period. This value controls how far back the indicator is rendered.
Color bars: This boolean input determines whether the bars should be colored according to the signal's direction. If set to true, the bars are colored using the defined colors, which visually indicate the trend direction.
Show signals: This boolean input controls the display of buy and sell signals on the chart. If set to true, the indicator plots shapes (triangles) to represent long and short trade signals.
Static Computation Parameters:
The indicator also includes several internal parameters that affect the Caterpillar SSA algorithm, such as Maxncomp, MaxLag, and MaxArrayLength. These parameters set the maximum allowed values for the number of computations, the lag, and the array length, ensuring that the calculations remain within reasonable limits and do not consume excessive computational resources.
█ A Note on Endpionted, Non-repainting Indicators
An endpointed indicator is one that does not recalculate or repaint its past values based on new incoming data. In other words, the indicator's previous signals remain the same even as new price data is added. This is an important feature because it ensures that the signals generated by the indicator are reliable and accurate, even after the fact.
When an indicator is non-repainting or endpointed, it means that the trader can have confidence in the signals being generated, knowing that they will not change as new data comes in. This allows traders to make informed decisions based on historical signals, without the fear of the signals being invalidated in the future.
In the case of the Endpointed SSA of Price, this non-repainting property is particularly valuable because it allows traders to identify trend changes and reversals with a high degree of accuracy, which can be used to inform trading decisions. This can be especially important in volatile markets where quick decisions need to be made.
CyberCandle SwiftEdgeCyberCandle SwiftEdge
Overview
CyberCandle SwiftEdge is a cutting-edge, AI-inspired trading indicator designed for traders seeking precision and clarity in trend-following and swing trading. Powered by SwiftEdge, it combines Heikin Ashi candles, a gradient-colored Exponential Moving Average (EMA), and a Relative Strength Index (RSI) to deliver clear buy and sell signals. Featuring glowing visuals, dynamic signal icons, and a customizable RSI dashboard in the top-right corner, this script offers a futuristic interface for identifying high-probability trade setups on various timeframes (e.g., 1H, 4H).
What It Does
CyberCandle SwiftEdge integrates three powerful components to generate actionable trading signals:
Heikin Ashi Candles: Smooths price action to highlight trends, reducing market noise and making reversals easier to spot.
Gradient EMA: A 100-period EMA with dynamic color transitions (blue/cyan for uptrends, red/pink for downtrends) to confirm market direction.
RSI Dashboard: A neon-lit display showing RSI levels, indicating overbought (>70), oversold (<30), or neutral (30-70) conditions.
Buy and sell signals are marked with prominent, glowing icons (triangles and arrows) based on trend direction, momentum, and specific Heikin Ashi patterns. The script’s customizable parameters allow traders to tailor the strategy to their preferences, balancing signal frequency and precision.
How It Works
The strategy leverages the synergy of Heikin Ashi, EMA, and RSI to filter trades and highlight opportunities:
Trend Direction: The price must be above the EMA for buy signals (bullish trend) or below for sell signals (bearish trend). The EMA’s gradient color shifts based on its slope, visually reinforcing trend strength.
Momentum Confirmation: RSI must exceed a user-defined threshold (default: 50) for buy signals or fall below it for sell signals, ensuring momentum supports the trade.
Candle Patterns: Buy signals require a green Heikin Ashi candle (close > open), with the two prior candles having minimal upper wicks (≤5% of candle body) and being red (indicating a retracement). Sell signals require a red candle, minimal lower wicks, and two prior green candles.
RSI Dashboard: Positioned in the top-right corner, it features a glowing circle (red for overbought, green for oversold, blue for neutral), the current RSI value, and a status indicator (triangle for extremes, square for neutral). This provides instant momentum insights without cluttering the chart.
By combining Heikin Ashi’s trend clarity, EMA’s directional filter, and RSI’s momentum validation, CyberCandle SwiftEdge minimizes false signals and highlights trades with strong potential. Its vibrant, AI-like visuals make it easy to interpret at a glance.
How to Use It
Add to Chart: In TradingView, search for "CyberCandle SwiftEdge" and add it to your chart. Set the chart to Heikin Ashi candles for optimal compatibility.
Interpret Signals:
Buy Signal: Large green triangles and arrows appear below candles when the price is above the EMA, RSI is above the buy threshold (default: 50), and conditions for a bullish retracement are met. Consider entering a long position with a 1:2 risk/reward ratio.
Sell Signal: Large red triangles and arrows appear above candles when the price is below the EMA, RSI is below the sell threshold (default: 50), and conditions for a bearish retracement are met. Consider entering a short position.
RSI Dashboard: Monitor the top-right dashboard. A red circle (RSI > 70) suggests caution for buys, a green circle (RSI < 30) indicates potential buying opportunities, and a blue circle (RSI 30-70) signals neutrality.
Customize Parameters: Open the indicator’s settings to adjust:
EMA Length (default: 100): Increase (e.g., 200) for longer-term trends or decrease (e.g., 50) for shorter-term sensitivity.
RSI Length (default: 14): Adjust for more (e.g., 7) or less (e.g., 21) responsive momentum signals.
RSI Buy/Sell Thresholds (default: 50): Set higher (e.g., 55) for buys or lower (e.g., 45) for sells to require stronger momentum.
Wick Tolerance (default: 0.05): Increase (e.g., 0.1) to allow larger wicks, generating more signals, or decrease (e.g., 0.02) for stricter conditions.
Require Retracement (default: true): Disable to remove the two-candle retracement requirement, increasing signal frequency.
Trading: Use signals in conjunction with the RSI dashboard and market context. For example, avoid buy signals if the RSI dashboard is red (overbought). Always apply proper risk management, such as setting stop-losses based on recent lows/highs.
What Makes It Original
CyberCandle SwiftEdge stands out due to its futuristic, AI-inspired visual design and user-friendly customization:
Neon Aesthetics: Glowing Heikin Ashi candles, gradient EMA, and dynamic signal icons (triangles and arrows) with RSI-driven transparency create a high-tech, immersive experience.
RSI Dashboard: A compact, top-right display with a neon circle, RSI value, and adaptive status indicator (triangle/square) provides instant momentum insights without cluttering the chart.
Customizability: Users can fine-tune EMA length, RSI parameters, wick tolerance, and retracement requirements via TradingView’s settings, balancing signal frequency and precision.
Integrated Approach: The synergy of Heikin Ashi’s trend clarity, EMA’s directional strength, and RSI’s momentum validation offers a cohesive strategy that reduces false signals.
Why This Combination?
The script combines Heikin Ashi, EMA, and RSI for a complementary effect:
Heikin Ashi smooths price fluctuations, making it ideal for identifying sustained trends and retracements, which are critical for the strategy’s signal logic.
EMA provides a reliable trend filter, ensuring signals align with the broader market direction. Its gradient color enhances visual trend recognition.
RSI adds momentum context, confirming that signals occur during favorable conditions (e.g., RSI > 50 for buys). The dashboard makes RSI intuitive, even for non-technical users.
Together, these components create a balanced system that captures trend reversals after retracements, validated by momentum, with a visually engaging interface that simplifies decision-making.
Tips
Best used on volatile assets (e.g., BTC/USD, EUR/USD) and higher timeframes (1H, 4H) for clearer trends.
Experiment with parameters in the settings to match your trading style (e.g., increase wick tolerance for more signals).
Combine with other analysis (e.g., support/resistance) for higher-confidence trades.
Note
This indicator is for informational purposes and does not guarantee profits. Always backtest and use proper risk management before trading.