TrendPilot AI v2 — Adaptive Trend Day Trading StrategyOverview
TrendPilot AI v2 is a structured, rules-based day trading strategy that identifies and follows market momentum using a sophisticated blend of technical indicators. Optimized for 15-minute and higher timeframes on high market cap cryptocurrencies (AAVE, SOL, ETH, BCH, BTC) to minimize manipulation risks, it adapts to changing market conditions with dynamic risk management and controlled re-entry logic to maximize trend participation while minimizing noise.
Core Logic
Multiple EMA Trend Confirmation — Uses three Exponential Moving Averages (fast, medium, slow) to detect robust bullish, bearish, or neutral trends, ensuring trades align with the prevailing market direction.
ADX Momentum Filter — Employs an ADX-based filter to confirm strong trends, avoiding entries in choppy or low-momentum markets.
Smart Entry Filter — Optional ATR-based buffer (period 14, multiplier 1.5) around the fast EMA prevents entries at overextended prices, enhancing trade precision.
Flexible Exit System — Offers multiple exit options: fixed take-profit (default 1.7 offset), trend-reversal exits, or ATR-based trailing stops (period 14, multiplier 2.0), with secure modes requiring candle closes for confirmation to gain Max Profit.
Controlled Re-Entry Logic — Allows re-entries after take-profit or price-based stop-loss with configurable wait periods (default 6 bars), max attempts (default 2), and EMA touch requirements (fast, medium, or slow).
State-Aware Risk Management — Tracks trend states and recent exits to adapt entries, with daily trade limits (default 5 long/short) and loss cooldowns (default 2 stop-losses) for disciplined trading.
How to Use & Configuration
Markets & Timeframes
Works with high market cap cryptocurrencies (AAVE, SOL, ETH, BCH, BTC).
Optimized for intraday charts (15m–4h) but adaptable to higher timeframes (e.g., 1h, 4h).
Trade Direction Settings
Dual Trades — Trades both long and short, quickly re-aligning after trend reversals.
Long Only — Ignores bearish signals, ideal for bullish markets or strong uptrends.
Short Only — Ignores bullish signals, suited for bearish markets or downtrends.
Risk Management Settings
Stop Loss Types
Trend Reversal — Closes positions when an opposite trend signal is confirmed (default).
Fixed Offset — Static stop at 3.5 offset from entry price (adjustable).
ATR Based — Dynamic trailing stop using ATR (period 14, multiplier 2.0), adjusting to market volatility.
Secure SL Mode — Optional setting to trigger price-based stops only on candle closes, reducing false exits.
Maximum recommended risk per trade is 5–10% of account equity.
Trade size is configurable (default 20 units) to match individual risk appetite.
Take Profit Options
Fixed Offset — Predefined target at 1.7 offset from entry (adjustable, e.g., 2.5 for SOL).
Secure TP Mode — Exits only when a candle closes beyond the target, ensuring reliable profit capture.
Trend Reversal — Exits on opposite trend signals when fixed TP is disabled, ideal for riding longer trends.
Trade Management Controls
Smart Entry Filter — Optional ATR-based buffer (period 14, multiplier 1.5) prevents chasing overextended prices.
Max Re-Entries — Limits continuation trades per trend cycle (default 2).
Daily Trade Limits — Caps long/short trades per day (default 5 each) for disciplined trading.
Daily Loss Cooldown — Pauses trading after a set number of stop-losses (default 2) per day.
Max Bars in Trade — Closes positions after a set duration (default 1440 bars) to prevent stale trades.
Configuration Steps
Apply the strategy to your chosen symbol (e.g., AAVE/USDT, SOL/USDT) and timeframe (15m or higher).
Select Trade Direction mode (Dual, Long Only, or Short Only).
Set Stop Loss (Trend Reversal, Fixed Offset, or ATR Based) and Take Profit (fixed or trend-reversal).
Adjust Smart Entry Filter, Max Re-Entries, Daily Limits, and Loss Cooldown as needed.
Test across multiple market conditions using the performance panel (top-right, showing Total Trades, Wins, Losses, Win Rate).
Enables automated trading via webhook integration with platforms like Binance Futures.
Set up alerts for long/short entries (🟢 Long, 🔴 Short) and exits (🎯 Max TP, 🛑 Max SL, 🚨 Force Exit).
Backtesting Guidance
Use realistic commission (default 0.01%) and slippage (default 2 ticks) matching your broker and instrument.
Validate performance over long historical periods (e.g., 3–6 months) to ensure >100 trades across different market regimes.
Avoid curve-fitting by testing on multiple high market cap coins (AAVE, SOL, ETH, BCH, BTC) and avoiding over-optimization.
EMA and ATR parameters are set to balanced, industry-standard values for realistic backtesting.
Best Practices, Defaults & Disclaimer
Best Practices
Use consistent and conservative position sizing (default 20 units).
Match commission and slippage to your broker’s actual rates.
Enable secure TP/SL modes for entries and exits to reduce false signals.
Test across different symbols, timeframes, and market phases before live trading.
Keep parameters simple to avoid overfitting.
Default Settings (Recommended Starting Point)
Initial Capital: $10,000
Order Size: Fixed, 20 units
Commission: 0.01%
Slippage: 2 ticks
Take Profit Offset: 1.7 (adjustable, e.g., 2.5 for SOL)
Stop Loss Type: Trend Reversal (default), Fixed Offset (3.5), or ATR Based (period 14, multiplier 2.0)
Smart Entry Filter: ATR period 14, multiplier 1.5 (optional)
Max Re-Entries: 2 per trend cycle
Daily Trade Limits: 5 long, 5 short
Daily Loss Cooldown: 2 stop-losses
Max Bars in Trade: 1440 bars
Subscription Information
TrendPilot AI v2 is an invite-only strategy, accessible only to approved subscribers.
Benefits include full access to all features, priority support, and regular updates.
Access is limited to ensure a high-quality user experience.
Compliance Status
No functional warnings in the script.
The script uses closed candle logic, ensuring no repainting or lookahead issues.
Designed for realistic backtesting with a $10,000 account and sustainable risk (≤5–10% per trade).
Disclaimer
This strategy is intended for educational and analytical purposes only. Trading involves substantial risk, and past performance does not guarantee future results. You are solely responsible for your own trading decisions and risk management.
Developed by: TrendPilotAI Team
For questions, setup guidance, or enhancement suggestions, contact TrendPilotAI Team via TradingView.
Cari dalam skrip untuk "ai"

BBMA OA - AI GPT-5This indicator is an AI-assisted implementation of the BBMA OA (Bollinger Bands + Moving Average) trading strategy, originally introduced by Malaysian trader Oma Ally. The code was generated and optimized using the GPT-5 AI model to ensure clean Pine Script v6 structure and compatibility.
The system combines Bollinger Bands (20, 2) with EMA50, EMA200, and MA5/10 High-Low to identify the four main BBMA OA patterns:
Extreme
Market Hilang Volume (MHV)
Candle Arah Kukuh (CSAK)
Re-entry (RRE, REE, REM)
Features:
Multi Time Frame confirmation for higher accuracy
Automatic signal detection with visual markers
Trend ribbon and candle coloring
Optimized Pine Script v6, free from errors/warnings
⚠ This is an adaptation of Oma Ally’s concept for educational purposes, not an official version. Past performance does not guarantee future results.
ZoneShift+StochZ+LRO + AI Breakout Bands [Combined]This composite Pine Script brings together four powerful trend and momentum tools into a single, easy-to-read overlay:
ZoneShift
Computes a dynamic “zone” around price via an EMA/HMA midpoint ± average high-low range.
Flags flips when price closes convincingly above or below that zone, coloring candles and drawing the zone lines in bullish or bearish hues.
Stochastic Z-Score
Converts your chosen price series into a statistical Z-score, then runs a Stochastic oscillator on it and HMA-smooths the result.
Marks momentum flips in extreme over-sold (below –2) or over-bought (above +2) territory.
Linear Regression Oscillator (LRO)
Builds a bar-indexed linear regression, normalizes it to standard deviations, and shows area-style up/down coloring.
Highlights local reversals when the oscillator crosses its own look-back values, and optionally plots LRO-colored candles on price.
AI Breakout Bands (Kalman + KNN)
Applies a Kalman filter to price, smooths it further with a KNN-weighted average, then measures mean-absolute-error bands around that smoothed line.
Colors the Kalman trend line and bands for bullish/bearish breaks, giving you a data-driven channel to trade.
Composite Signals & Alerts
Whenever the ZoneShift flip, Stoch Z-Score flip, and LRO reversal all agree and price breaks the AI bands in the same direction, the script plots a clear ▲ (bull) or ▼ (bear) on the chart and fires an alert. This triple-confirmation approach helps you zero in on high-probability reversal points, filtering out noise and combining trend, momentum, and statistical breakout criteria into one unified signal.

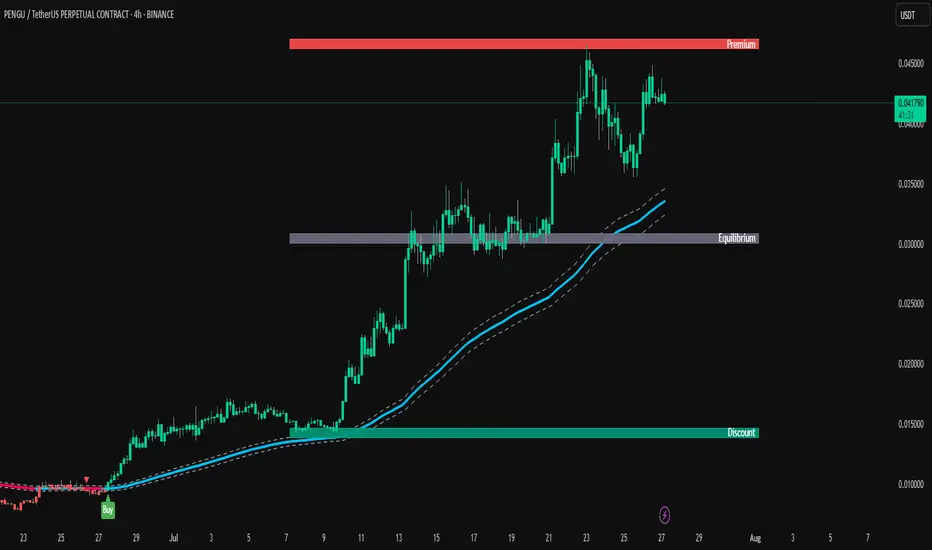
TrendPilot AI v2 — Smart ATR Indicator with ZonesTrendPilot AI v2 is a smart price-action and ATR-based trading system designed for swing and position traders. It combines trend-following logic with adaptive price zones to help users identify high-probability Buy and Sell opportunities — along with intelligent re-entry points, weak signal detection, and visual structure zones.
🔧 Core Features:
✅ ATR-based Buy/Sell signals with confirmation logic
✅ Dynamic 99 EMA Channel for trend context
✅ Re-entry triangles for stacking or retracing setups
✅ 150 EMA Weak Signal Detection for early trend warnings
✅ 🧭 Price Action Zones (Premium, Equilibrium, Discount)
✅ Visual alerts via triangles, labels, and color-coded logic
✅ Designed for 15m, 1H, and 4H charts — also useful on Daily
🧠 How It Works (Logic Breakdown)
1️⃣ Trend Direction — EMA Channel Logic
A 99 EMA Channel determines the dominant market bias.
If price is above the channel → trend is Bullish → Buy signals are valid
If price is below the channel → trend is Bearish → Sell signals are valid
2️⃣ Buy/Sell Signals — ATR Trailing Logic
The system uses custom ATR trailing logic to detect when price momentum shifts.
When a breakout aligns with trend direction, a Buy or Sell label appears.
These are designed to capture the main trend leg or reversal zone.
3️⃣ Re-Entry Signals — Triangle Visual Cues
During a confirmed trend, if price retraces to the EMA channel, a small triangle is shown:
🔼 Green triangle: Buy re-entry during bullish trend
🔽 Red triangle: Sell re-entry during bearish trend
These are not new signals but continuation cues for advanced traders.
4️⃣ Weak Signal Detection — 150 EMA Logic
A secondary 150 EMA helps detect possible trend exhaustion.
If price dips below 150 EMA during a bullish run, an orange triangle appears (⚠️ caution).
If price rises above 150 EMA during a bearish run, a blue triangle appears.
This signals potential weakening of the active trend.
5️⃣ Price Zones — Premium, Equilibrium, Discount
TrendPilot AI v2 draws 3 smart price zones based on ATR & market structure:
🟥 Premium Zone (Top) → Overbought area, caution for long trades
🟨 Equilibrium Zone (Middle) → Fair value, consolidation possible
🟩 Discount Zone (Bottom) → Oversold, better long entries
These zones help filter signals and avoid entries in risky areas.
Example: Avoid Buy signals inside Premium zone.
🧪 Suggested Use:
✅ Timeframes: 15m / 1H / 4H / 1D
✅ Combine signals with zone analysis for optimal entries
✅ Use re-entry triangles to add or confirm during pullbacks
✅ Use weak signal warnings to tighten stops or manage risk
✅ Works best in trending environments or breakout markets
⚠️ Note for Users:
This script is not repainting. All signals are plotted with stable logic.
Past performance does not guarantee future results — always backtest first.
Script does not contain financial advice — use at your own discretion.
Auto Intelligence Selective Moving Average(AI/MA)# 🤖 Auto Intelligence Moving Average Strategy (AI/MA)
**AI/MA** is a state-adaptive moving average crossover strategy designed to **maximize returns from golden cross / death cross logic** by intelligently switching between different MA types and parameters based on market conditions.
---
## 🎯 Objective
To build a moving average crossover strategy that:
- **Adapts dynamically** to market regimes (trend vs range, rising vs falling)
- **Switches intelligently** between SMA, EMA, RMA, and HMA
- **Maximizes cumulative return** under realistic backtesting
---
## 🧪 materials amd methods
- **MA Types Considered**: SMA, EMA, RMA, HMA
- **Parameter Ranges**: Periods from 5 to 40
- **Market Conditions Classification**:
- Based on the slope of a central SMA(20) line
- And the relative position of price to the central line
- Resulting in 4 regimes: A (Bull), B (Pullback), C (Rebound), D (Bear)
- **Optimization Dataset**:
- **Bybit BTCUSDT.P**
- **1-hour candles**
- **2024 full-year**
- **Search Process**:
- **Random search**: 200 parameter combinations
- Evaluated by:
- `Cumulative PnL`
- `Sharpe Ratio`
- `Max Drawdown`
- `R² of linear regression on cumulative PnL`
- **Implementation**:
- Optimization performed in **Python (Pandas + Matplotlib + Optuna-like logic)**
- Final parameters ported to **Pine Script (v5)** for TradingView backtesting
---
## 📈 Performance Highlights (on optimization set)
| Timeframe | Return (%) | Notes |
|-----------|------------|----------------------------|
| 6H | +1731% | Strongest performance |
| 1D | +1691% | Excellent trend capture |
| 12H | +1438% | Balance of trend/range |
| 5min | +27.3% | Even survives scalping |
| 1min | +9.34% | Robust against noise |
- Leverage: 100x
- Position size: 100%
- Fees: 0.055%
- Margin calls: **none** 🎯
---
## 🛠 Technology Stack
- `Python` for data handling and optimization
- `Pine Script v5` for implementation and visualization
- Fully state-aware strategy, modular and extendable
---
## ✨ Final Words
This strategy is **not curve-fitted**, **not over-parameterized**, and has been validated across multiple timeframes. If you're a fan of dynamic, intelligent technical systems, feel free to use and expand it.
💡 The future of simple-yet-smart trading begins here.

Machine Learning Moving Average [LuxAlgo]The Machine Learning Moving Average (MLMA) is a responsive moving average making use of the weighting function obtained Gaussian Process Regression method. Characteristic such as responsiveness and smoothness can be adjusted by the user from the settings.
The moving average also includes bands, used to highlight possible reversals.
🔶 USAGE
The Machine Learning Moving Average smooths out noisy variations from the price, directly estimating the underlying trend in the price.
A higher "Window" setting will return a longer-term moving average while increasing the "Forecast" setting will affect the responsiveness and smoothness of the moving average, with higher positive values returning a more responsive moving average and negative values returning a smoother but less responsive moving average.
Do note that an excessively high "Forecast" setting will result in overshoots, with the moving average having a poor fit with the price.
The moving average color is determined according to the estimated trend direction based on the bands described below, shifting to blue (default) in an uptrend and fushia (default) in downtrends.
The upper and lower extremities represent the range within which price movements likely fluctuate.
Signals are generated when the price crosses above or below the band extremities, with turning points being highlighted by colored circles on the chart.
🔶 SETTINGS
Window: Calculation period of the moving average. Higher values yield a smoother average, emphasizing long-term trends and filtering out short-term fluctuations.
Forecast: Sets the projection horizon for Gaussian Process Regression. Higher values create a more responsive moving average but will result in more overshoots, potentially worsening the fit with the price. Negative values will result in a smoother moving average.
Sigma: Controls the standard deviation of the Gaussian kernel, influencing weight distribution. Higher Sigma values return a longer-term moving average.
Multiplicative Factor: Adjusts the upper and lower extremity bounds, with higher values widening the bands and lowering the amount of returned turning points.
🔶 RELATED SCRIPTS
Machine-Learning-Gaussian-Process-Regression
SuperTrend-AI-Clustering

Ocs Ai TraderThis script perform predictive analytics from a virtual trader perspective!
It acts as an AI Trade Assistant that helps you decide the optimal times to buy or sell securities, providing you with precise target prices and stop-loss level to optimise your gains and manage risk effectively.
System Components
The trading system is built on 4 fundamental layers :
Time series Processing layer
Signal Processing layer
Machine Learning
Virtual Trade Emulator
Time series Processing layer
This is first component responsible for handling and processing real-time and historical time series data.
In this layer Signals are extracted from
averages such as : volume price mean, adaptive moving average
Estimates such as : relative strength stochastics estimates on supertrend
Signal Processing layer
This second layer processes signals from previous layer using sensitivity filter comprising of an Probability Distribution Confidence Filter
The main purpose here is to predict the trend of the underlying, by converging price, volume signals and deltas over a dominant cycle as dimensions and generate signals of action.
Key terms
Dominant cycle is a time cycle that has a greater influence on the overall behaviour of a system than other cycles.
The system uses Ehlers method to calculate Dominant Cycle/ Period.
Dominant cycle is used to determine the influencing period for the underlying.
Once the dominant cycle/ period is identified, it is treated as a dynamic length for considering further calculations
Predictive Adaptive Filter to generate Signals and define Targets and Stops
An adaptive filter is a system with a linear filter that has a transfer function controlled by variable parameters and a means to adjust those parameters according to an optimisation algorithm. Because of the complexity of the optimisation algorithms, almost all adaptive filters are digital filters. Thus Helping us classify our intent either long side or short side
The indicator use Adaptive Least mean square algorithm, for convergence of the filtered signals into a category of intents, (either buy or sell)
Machine Learning
The third layer of the System performs classifications using KNN K-Nearest Neighbour is one of the simplest Machine Learning algorithms based on Supervised Learning technique.
K-NN algorithm assumes the similarity between the new case/data and available cases and put the new case into the category that is most similar to the available categories.
K-NN algorithm stores all the available data and classifies a new data point based on the similarity. This means when new data appears then it can be easily classified into a well suite category by using K- NN algorithm. K-NN algorithm can be used for Regression as well as for Classification but mostly it is used for the Classification problems.
Virtual Trade Emulator
In this last and fourth layer a trade assistant is coded using trade emulation techniques and the Lines and Labels for Buy / Sell Signals, Targets and Stop are forecasted!
How to use
The system generates Buy and Sell alerts and plots it on charts
Buy signal
Buy signal constitutes of three targets {namely T1, T2, T3} and one stop level
Sell signal
Sell signal constitutes of three targets {namely T1, T2, T3} and one stop level
What Securities will it work upon ?
Volume Informations must be present for the applied security
The indicator works on every liquid security : stocks, future, forex, crypto, options, commodities
What TimeFrames To Use ?
You can use any Timeframe, The indicator is Adaptive in Nature,
I personally use timeframes such as : 1m, 5m 10m, 15m, ..... 1D, 1W
This Script Uses Tradingview Premium features for working on lower timeframes
In case if you are not a Tradingview premium subscriber you should tell the script that after applying on chart, this can be done by going to settings and unchecking "Is your Tradingview Subscription Premium or Above " Option
How To Get Access ?
You will need to privately message me for access mentioning you want access to "Ocs Ai Trader" Use comment box only for constructive comments. Thanks !

IsAlgo - AI Trend Strategy► Overview:
The AI Trend Strategy employs a combination of technical indicators to guide trading decisions across various markets and timeframes. It uses a custom Super Trend indicator and an Exponential Moving Average (EMA) to analyze market trends and executes trades based on specific candlestick patterns. This strategy includes options for setting stop losses, take profit levels, and features an alert system for trade notifications.
► Description:
This strategy focuses on identifying the optimal "entry candle," which signals either a potential correction within the ongoing trend or the emergence of a new trend. The entry criteria for this candle are highly customizable, allowing traders to specify dimensions such as the candle's minimum and maximum size and body ratio. Additional settings include whether this candle should be the highest or lowest compared to recent candles and if a confirmation candle is necessary to validate the entry.
The Super Trend indicator is central to the strategy’s operation, dictating the direction of trades by identifying bullish or bearish trends. Traders have the option to configure trades to align with the direction of the trend identified by this indicator, or alternatively, to take positions counter to the trend for potential reversal strategies. This flexibility can be crucial during varying market conditions.
Additionally, the strategy incorporates an EMA alongside the Super Trend indicator to further analyze trend directions. This combined approach aims to reduce the occurrence of false signals and improve the strategy's overall trend analysis.
The learning algorithm is a standout feature of the AI Trend Strategy. After accumulating data from a predefined number of trades (e.g., after the first 100 trades), the algorithm begins to analyze past performances to identify patterns in wins and losses. It considers variables such as the distance from the current price to the trend line, the range between the highest and lowest prices during the trend, and the duration of the trend. This data informs the algorithm's predictions for future trades, aiming to improve accuracy and reduce losses by adapting to the evolving market conditions.
► Examples of Trade Execution:
1. In an Uptrend: The strategy might detect a suitable entry candle during a correction phase, which aligns with the continuing uptrend for a potential long trade.
2. In a Downtrend: Alternatively, the strategy might identify an entry candle at the end of a downtrend, suggesting a potential reversal or correction where a long trade could be initiated.
3. In an Uptrend: The strategy may also spot an entry candle at the end of an uptrend and execute a short trade, anticipating a reversal or significant pullback.
4. In a Downtrend: The strategy might find a suitable entry candle during a correction phase, indicating a continuation of the downtrend for a potential short trade.
These examples illustrate how the strategy identifies potential trading opportunities based on trend behavior and candlestick patterns.
► Features and Settings:
⚙︎ Trend: Utilizes a custom Super Trend indicator to identify the direction of the market trend. Users can configure the strategy to execute trades in alignment with this trend, take positions contrary to the trend, or completely ignore the trend information for their trading decisions.
⚙︎ Moving average: Employs an Exponential Moving Average (EMA) to further confirm the trend direction indicated by the Super Trend indicator. This setting can be used in conjunction with the Super Trend or disabled if preferred.
⚙︎ Entry candle: Defines the criteria for the candle that triggers a trade. Users can customize aspects such as the candle's size, body, and its relative position to previous candles to ensure it meets specific trading requirements before initiating a trade.
⚙︎ Learning algorithm: This component uses historical trade data to refine the strategy. It assesses various aspects of past trades, such as price trends and market conditions, to make more informed trading decisions in the future.
⚙︎ Trading session: Users can define specific trading hours during which the strategy should operate, allowing trades to be executed only during preferred market periods.
⚙︎ Trading days: This option enables users to specify which days the strategy should be active, providing the flexibility to avoid trading on certain days of the week if desired.
⚙︎ Backtesting: Enables a period during which the strategy can be tested over a selected start and end date, with an option to deactivate this feature if not needed.
⚙︎ Trades: Detailed configuration options include the direction of trades (long, short, or both), position sizing (fixed or percentage-based), the maximum number of open trades, and limitations on the number of trades per day or based on trend changes.
⚙︎ Trades Exit: Offers various strategies for exiting trades, such as setting limits on profits or losses, specifying the duration a trade should remain open, or closing trades based on trend reversal signals.
⚙︎ Stop loss: Various methods for setting stop losses are available, including fixed pips, based on Average True Range (ATR), or utilizing the highest or lowest price points within a designated number of previous candles. Another option allows for closing the trade after a specific number of candles moving in the opposite direction.
⚙︎ Break even: This feature adjusts the stop loss to a break-even point under certain conditions, such as reaching predefined profit levels, to protect gains.
⚙︎ Trailing stop: The trailing stop feature adjusts the stop loss as the trade moves into profit, aiming to secure gains while potentially capturing further upside.
⚙︎ Take profit: Up to three take profit levels can be established using various methods, such as a fixed amount of pips, risk-to-reward ratios based on the stop loss, ATR, or after a set number of candles that move in the direction of the trade.
⚙︎ Alerts: Includes a comprehensive alert system that informs the user of all significant actions taken by the strategy, such as trade openings and closings. It supports placeholders for dynamic values like take profit levels, stop loss prices, and more.
⚙︎ Dashboard: Provides a visual display of detailed information about ongoing and past trades on the chart, helping users monitor the strategy’s performance and make informed decisions.
► Backtesting Details:
Timeframe: 15-minute BTCUSD chart.
Initial Balance: $10,000.
Order Size: 4% of equity per trade.
Commission: 0.01%.
Slippage: 5 ticks.
Risk Management: Strategic stop loss settings are applied based on the most extreme price points within the last 18 candles.

Trend Sentinel BarrierEveryone in the market wants to take profits from the trend. It is easy to think but hard to execute. In fact, some callbacks or rebounds may cause you to close the position out of fear and let you miss bigger profits.
Indicator: Trend Sentinel Barri er solves this problem for you! It use AI algorithm to help you seize profits.
It is a trend indicator, using AI algorithm to calculate the cumulative trading volume of bulls and bears, identify trend direction and opportunities, and calculate short-term average cost in combination with changes of turnover ratio in multi-period trends, so as to grasp the profit from the trend more effectively without being cheated.
💠Usage:
Signal: "BUY" means bullish trend, "SELL" means bearish trend.
Support and resistance range: "red area" represents strong support or resistance for long-term fluctuation costs, and "blue area" represents moderate support of resistance for short-term fluctuation costs.
🎈Tip I:
When the BUY and SELL signal appear, it means that the direction of the trend will change, and the color of the candles will also change. Don't care about the color of the candles, let's just focus on the price, support and resistance.
🎈Tip II:
Take the BUY signal as an example. When the signal appears and you hold long position, you need to pay attention to the blue and red support range. If the price returns to this range but there is no SELL signal, you can consider holding the long position for a while.
If the price pump with long candles, and then pulls back to the range, you need to be vigilant. You can consider taking the profit when the price breakthrough the support range, or wait for the SELL signal.
🎈Advanced tip I:
In most cases, the trend market is not smooth, there will be a lot of callbacks or rebounds, but because of this, we have many opportunities to do swing trading.
Continuing to take the BUY signal as an example, when this signal appears, every time the price falls back to the blue or red support area, you can consider adding positions. There are two ways to deal with these newly added positions.
One is to do swing trading. You can consider taking profits near the previous high when the price rises. The advantage of this operation is that you can get more profits in the same trend market.
The second is to continue to hold it as the bottom position until the general trend is completely over, and then close the position after obtaining huge profits.
🎈Advanced tip II:
When using advanced tips I, you can consider adding some momentum indicators to assist you in judging whether pullbacks or rebounds have failed, so as to increase your position. Similarly, the momentum indicator can also help you find a take-profit point for newly added positions
For details, please refer to the momentum indicator: KD Momentum Matrix
*The signals in the indicators are for reference only and not intended as investment advice. Past performance of a strategy is not indicative of future earnings results.
Update-
Optimize the alarm function. If you need to monitor the "Buy" or "Sell" signal, when creating an alarm, set the condition bar to:
Trend Sentinel Barrier --> "Buy" or "Sell" --> Crossing Up --> value --> 1

Multi-TF AI SuperTrend with ADX - Strategy [PresentTrading]
## █ Introduction and How it is Different
The trading strategy in question is an enhanced version of the SuperTrend indicator, combined with AI elements and an ADX filter. It's a multi-timeframe strategy that incorporates two SuperTrends from different timeframes and utilizes a k-nearest neighbors (KNN) algorithm for trend prediction. It's different from traditional SuperTrend indicators because of its AI-based predictive capabilities and the addition of the ADX filter for trend strength.
BTC 8hr Performance
ETH 8hr Performance
## █ Strategy, How it Works: Detailed Explanation (Revised)
### Multi-Timeframe Approach
The strategy leverages the power of multiple timeframes by incorporating two SuperTrend indicators, each calculated on a different timeframe. This multi-timeframe approach provides a holistic view of the market's trend. For example, a 8-hour timeframe might capture the medium-term trend, while a daily timeframe could capture the longer-term trend. When both SuperTrends align, the strategy confirms a more robust trend.
### K-Nearest Neighbors (KNN)
The KNN algorithm is used to classify the direction of the trend based on historical SuperTrend values. It uses weighted voting of the 'k' nearest data points. For each point, it looks at its 'k' closest neighbors and takes a weighted average of their labels to predict the current label. The KNN algorithm is applied separately to each timeframe's SuperTrend data.
### SuperTrend Indicators
Two SuperTrend indicators are used, each from a different timeframe. They are calculated using different moving averages and ATR lengths as per user settings. The SuperTrend values are then smoothed to make them suitable for KNN-based prediction.
### ADX and DMI Filters
The ADX filter is used to eliminate weak trends. Only when the ADX is above 20 and the directional movement index (DMI) confirms the trend direction, does the strategy signal a buy or sell.
### Combining Elements
A trade signal is generated only when both SuperTrends and the ADX filter confirm the trend direction. This multi-timeframe, multi-indicator approach reduces false positives and increases the robustness of the strategy.
By considering multiple timeframes and using machine learning for trend classification, the strategy aims to provide more accurate and reliable trade signals.
BTC 8hr Performance (Zoom-in)
## █ Trade Direction
The strategy allows users to specify the trade direction as 'Long', 'Short', or 'Both'. This is useful for traders who have a specific market bias. For instance, in a bullish market, one might choose to only take 'Long' trades.
## █ Usage
Parameters: Adjust the number of neighbors, data points, and moving averages according to the asset and market conditions.
Trade Direction: Choose your preferred trading direction based on your market outlook.
ADX Filter: Optionally, enable the ADX filter to avoid trading in a sideways market.
Risk Management: Use the trailing stop-loss feature to manage risks.
## █ Default Settings
Neighbors (K): 3
Data points for KNN: 12
SuperTrend Length: 10 and 5 for the two different SuperTrends
ATR Multiplier: 3.0 for both
ADX Length: 21
ADX Time Frame: 240
Default trading direction: Both
By customizing these settings, traders can tailor the strategy to fit various trading styles and assets.

Double AI Super Trend Trading - Strategy [PresentTrading]█ Introduction and How It is Different
The Double AI Super Trend Trading Strategy is a cutting-edge approach that leverages the power of not one, but two AI algorithms, in tandem with the SuperTrend technical indicator. The strategy aims to provide traders with enhanced precision in market entry and exit points. It is designed to adapt to market conditions dynamically, offering the flexibility to trade in both bullish and bearish markets.
*The KNN part is mainly referred from @Zeiierman.
BTCUSD 8hr performance
ETHUSD 8hr performance
█ Strategy, How It Works: Detailed Explanation
1. SuperTrend Calculation
The SuperTrend is a popular indicator that captures market trends through a combination of the Volume-Weighted Moving Average (VWMA) and the Average True Range (ATR). This strategy utilizes two sets of SuperTrend calculations with varying lengths and factors to capture both short-term and long-term market trends.
2. KNN Algorithm
The strategy employs k-Nearest Neighbors (KNN) algorithms, which are supervised machine learning models. Two sets of KNN algorithms are used, each focused on different lengths of historical data and number of neighbors. The KNN algorithms classify the current SuperTrend data point as bullish or bearish based on the weighted sum of the labels of the k closest historical data points.
3. Signal Generation
Based on the KNN classifications and the SuperTrend indicator, the strategy generates signals for the start of a new trend and the continuation of an existing trend.
4. Trading Logic
The strategy uses these signals to enter long or short positions. It also incorporates dynamic trailing stops for exit conditions.
Local picture
█ Trade Direction
The strategy allows traders to specify their trading direction: long, short, or both. This enables the strategy to be versatile and adapt to various market conditions.
█ Usage
ToolTips: Comprehensive tooltips are provided for each parameter to guide the user through the customization process.
Inputs: Traders can customize numerous parameters including the number of neighbors in KNN, ATR multiplier, and types of moving averages.
Plotting: The strategy also provides visual cues on the chart to indicate bullish or bearish trends.
Order Execution: Based on the generated signals, the strategy will execute buy or sell orders automatically.
█ Default Settings
The default settings are configured to offer a balanced approach suitable for most scenarios:
Initial Capital: $10,000
Default Quantity Type: 10% of equity
Commission: 0.1%
Slippage: 1
Currency: USD
These settings can be modified to suit various trading styles and asset classes.

Broadview Algorithmic StudioWelcome! This is the writeup for the Broadview Algorithmic Studio.
There are many unique features in this script.
- Broadview Underpriced & Overpriced
- Broadview Blackout Bollinger Bands
- Trailing Take Profit Suite
- Algorithmic Weights
- VSA Score
- Pip Change Log
- Activation Panel
- Weight Scanner
There are 116 primary inputs that allow users to algorithmically output unique DCA signal-sets. There are 85 inputs that allow users to control individual lengths, levels, thresholds, and multiplicative weights of the script. You will not find any other script with this many inputs, properly strung together for you to produce unlimited strategies for any market. The entire premise for the Broadview Algorithmic Studio is for users to be able to have extensive-cutting-edge features that allow them to produce more strategies, having control over every element that outputs a signal set. The number of unique strategies you can output with this script is VAST, and each continues to follow a safe DCA methodology.
This script is ready for use with 3Commas, interactive brokers, and other means of automation. It provides detailed information on Base Orders and Safety Orders, giving the number, cumulative spending, position average, and remaining balance for each SO in the series. Using this script we will explore the depths of strategic volume scaling, and the algorithms we use to determine spending.
Let me first start by saying the number of safe DCA-friendly signal-sets this script can output is absolutely staggering.
Let's limit the scope just to the Broadview Underpriced & Overpriced and Broadview Dominance indicators.
Each band of the Dominance Suite can be controlled individually with unique lengths, levels, and weights. This means the Dominance Suite can establish Bearish or Bullish dominance, in any market condition, and give it a unique overloading weight. The Broadview Underpriced & Overpriced indicator finally gives us the ability to establish these "market conditions" first with cycles. Of all the cycles this indicator establishes, the two primary are Underpriced & Overpriced. We determine this using a composite Overbought & Oversold with an Exponential Moving Average. So the script can now know, what cycle it is in, who is dominant during that cycle, and exactly how much weight in volume scaling the order should have.
Brand new is the ability for indicators of this level to be able to talk together in a single script. The Broadview Underpriced & Overpriced indicator and the Broadview Dominance indicator can inform one another across multiple vectors, create a unique market snapshot, and give that snapshot a unique weight every bar. The unique weight is compiled in the volume scaling math, thus giving us an automated-strategic-safe and quite efficient volume scaling for every order. In our coming updates we will explore this synergy to its very deepest layers. These indicators can be laced together in many ways, called vectors.
Only in the Algorithmic Studio do we explore these depths and yield those findings, features, and inputs to the user.
Let me take a quick break to explain another area-of-opportunity for our research and development.
The VSA Score is something we've tried before, but until the creation of the Broadview Blackout Bollinger Bands Auto Indicator it was not possible. The concept we want to explore is "Positional Honing". Over time we want users and the script itself to be able to understand the difference between a script-config that produces a high number of Hits, from a configuration that produces a high number of "Misses". The Volume Scaling Accuracy Score uses the BBB Auto Indicator as a heavily reliable, non-repainting, method of determining what the very-best signals for increased volume-scaling are.
Increased volume scaling is denoted by the near-white highlighter line running vertically. This line will either fall inside the BBB Auto Indicator bands (which are hidden), or, they will fall below and outside the BBB Auto bands. If increased spending happens inside the bands it's a "Miss". If increased spending happens below and outside the bands, it's a Hit. Oftentimes misses are actually pretty good spots for extra spending, which helps lower your position average, but Hits are always better. The Hits that the BBB Auto Indicator provides are extremely good.
Let's talk about the Trailing Take Profit Suite. This suite allows us to set a trailing take profit which is a feature that lets one maximize their profits. If the trailing take profit is engaged, then when the regular take profit is hit, it will trigger, denoted in red vertical lines, and the trailing take profit will look for a specified rate of change before it actually takes profit. This usually helps traders in those times when their regular take profit was set too low, allowing them to maximize their profits with a Trailing Take Profit.
For the moment, let's think about our scores. In the dashboard you'll notice a score beginning the Pip Change Log, the VSA Score, and the Activation Panel.
These scores use a new kind of logistic correlation formula where 4 digits are given to activation, rather than 1. This is to allow room for a future concept in AI we call "Deadzones" or you can think of it as impedance. This is not a bias in logistic regression. It's an entirely different concept. A neuron, which a perceptron attempts to mimic, has a bias.. but it also has a sort of electrical resistance. This is because a neuron is individually-alive entity. So a perceptron, as it were, would need to have both a bias and a natural resistance, or deadzone.
It is a lot of fun to watch the scores and how they react during playback. They tend to smooth trends but are also quite quick to correct to accuracy. In the future we will add the deadzones and biases to the scores. This should help both users and the script produce better signal sets. The Pip Change Log is an indicator that measures Rate of Change in Pips. This is one that I am particularly excited to study, as I am a huge fan of ROC. The Activation Panel shows these scores for 4 primary indicators: On Balance Volume, Relative Strength Index, Average Directional Index, and Average True Range.
Having the Pip Change Log, VSA Score, and Activation Panel up on the dashboard with their logistic correlation scores allows traders to study markets and setups quite intimately. The weight scanner at the bottom allows users to track the cumulative applied multiplicative weights during playback. The massive number of inputs, connected vectors of indicators, input-weights, lengths, levels, and thresholds sets up all the algorithmic infrastructure for powerusers to explore every idea and strategy output they could imagine. Also with the connected vector infrastructure we can deepen our indicators in a way where, "How they talk to each other.", comes first in every development conversation.
The Algorithmic Studio is for the Power-user.
These are not basic equations coming together to determine spending. This is a massive multi-layered-perceptron with everything from Trailing-Take-Profits to strategic-automatic algorithmic downscaling. The Broadview Algorithmic Studio gives a home to the poweruser who wants access to everything in a trading and investing AI, right up until the backpropagation. The Broadview Algorithmic Studio, gives users the ability to sit in the chair of the would-be AI.
Thank you.

Intelligent Supertrend (AI) - Buy or Sell SignalIntroduction
This indicator uses machine learning (Artificial Intelligence) to solve a real human problem.
The artificial intelligence that operates this Supertrend was created by an algorithm that tests every single combination of input values across the entire chart history of an instrument for maximum profitability in real-time.
The Supertrend is one of the most popular indicators on the planet, yet no one really knows what input values work best in combination with each other. A reason for this is because not one set of input values is always going to be the best on every instrument, time-frame, and at any given point in time.
The "Intelligent Supertrend" solves this problem by constantly adapting the input values to match the most profitable combination so that no matter what happens, this Supertrend will be the most profitable.
Indicator Utility
The Intelligent Supertrend does not change what has already been plotted and does not repaint in any way which means that it is fully functional for trading in real-time.
Ultimately, there are no limiting factors within the range of combinations that have been programmed. The Supertrend will operate normally but will change input values according to what is currently the most profitable strategy.
Input Values
While a normal Supertrend would include two user-defined input values, the Intelligent Supertrend automates the input values according to what is currently the most profitable combination.
Additional Tools
The Optimised Supertrend is a tool that can be used to visual what input values the Supertrend AI is currently using. Additional tools to back-test this indicator will be added to this product soon.
For more information on how this indicator works, view the documentation here:
www.kenzing.com
For more information on the Supertrend view these fun facts:
www.marketcalls.in

Elite Federal Reserve AIThe Elite Federal Reserve AI indicator provides an analytical framework focused on monitoring economic and market conditions that influence Federal Reserve policy decisions. The indicator examines key relationships and rate-of-change metrics across multiple proxies for monetary policy drivers.
The indicator tracks and analyzes:
• Yield curve dynamics through rate-of-change measurements in short and intermediate-term Treasury yields
• Inflation expectations via TIPS breakeven rate momentum
• Dollar strength and its rate of change over specified periods
• Financial market stress indicators including volatility and sector performance metrics
• Breadth measures through small capitalization stock performance
The indicator calculates momentum and rate-of-change values across these variables to identify shifts in the economic and financial conditions that serve as primary inputs to Federal Reserve decision-making. By monitoring the velocity of change in these key relationships, the indicator provides insight into the changing balance between inflationary pressures, growth expectations, financial stability concerns, and currency dynamics.
This approach focuses on the observable market-based indicators that reflect the underlying economic conditions the Federal Reserve considers in its policy formulation, enabling users to assess the prevailing policy environment through the lens of these critical market relationships and their momentum characteristics.

Elite Correlation Matrix AIThe Elite Correlation Matrix AI indicator provides comprehensive real-time correlation analysis across multiple asset classes, displaying the interrelationships between equities, bonds, commodities, currencies, and volatility instruments.
The indicator calculates and displays correlation coefficients between a predefined set of major market indices and instruments, including:
• Major equity indices (SPY, QQQ, IWM)
• Long-term Treasury bonds (TLT)
• Gold (GLD)
• Crude oil (USO)
• Volatility (VIX)
• US Dollar Index (DXY)
• Bitcoin (BTCUSD)
Key features include:
• Rolling correlation calculations across user-defined periods to identify both short-term and longer-term relationships
• Visual correlation heat map showing the strength and direction of relationships between all tracked instruments
• Detection of correlation breakdowns, which often precede significant market regime shifts
• Dashboard display providing summary metrics of prevailing correlation patterns
The indicator enables users to monitor the current state of market relationships and identify when traditional correlations begin to break down, which frequently serves as an early warning of impending changes in market behavior. By tracking the degree of connectedness between different asset classes, the indicator provides insight into the current risk environment and the potential for diversification effectiveness.
This analysis is particularly valuable for understanding periods of market stress when asset relationships deviate from their normal patterns, as well as identifying environments where traditional correlations hold and where they are undergoing structural changes.

Elite Commodities AIThe Elite Commodities AI indicator provides a comprehensive analytical framework designed specifically for commodities trading. It combines multiple technical components to assess price action within the unique characteristics of commodity markets.
The indicator incorporates the following key elements:
Multi-timeframe RSI analysis across the primary timeframe, 4-hour, and daily periods
Multiple exponential moving averages (fast, slow, and trend) to establish directional context
Volume rate analysis measuring current volume relative to recent average volume
Bollinger Band width analysis to identify periods of volatility contraction
True Range volatility expressed as a percentage of price
The indicator evaluates the interaction between momentum, trend structure, volume participation, and volatility dynamics, which are particularly significant in commodities markets due to their sensitivity to changes in supply-demand fundamentals and large institutional order flow.
By combining these analytical components, the indicator provides a layered assessment of price behavior that captures the interplay between trend development, momentum characteristics, participation levels, and volatility compression—key factors that drive commodity market movements.
This approach enables traders to identify significant price action within the context of prevailing market structure, making it suitable for analyzing both directional trends and consolidation periods that are common in commodity price behavior.2.2s

Elite Bond Market AIDescription:
The Elite Bond Market AI indicator provides a comprehensive analytical framework specifically designed for bond market price action. The indicator combines multiple technical components including multi-timeframe RSI analysis, moving average relationships, volume dynamics, and volatility measurements to identify significant price behavior within the unique characteristics of bond market trading.
The indicator incorporates:
Multi-timeframe RSI evaluation across primary, 4-hour, and daily timeframes
Fast, slow, and trend exponential moving averages for directional context
Volume rate analysis relative to recent average volume
Bollinger Band width measurement for volatility contraction assessment
True Range volatility normalized as a percentage of price
This combination provides a layered analytical approach that captures the interplay between momentum, trend structure, participation levels, and volatility compression—key factors in bond market price discovery and directional moves.

MagiMagi (AI Trend & SMC)exclusively for Bond Team
・50EMA貫きの形を条件に売買シグナル点灯
・AIトレンドを導入しトレンドの方向性を背景色の変化で可視化
・大口のオーダーブロック表示
・ダウ理論における高安を自動水平線にて表示


💰 Aymed55 AI v2 – Para Akışı + RSI + MACD + Alarm→ Para çıkışı + momentum kırılması = SAT ⚠️
📌 What Does This Indicator Do? — Short Summary
The Borsacı AI v2 indicator is designed to detect real money flow in the market.
Its core purpose is simple:
👉 Follow where the money is going — enter early, exit early.
It combines Volume + RSI + MACD to generate highly reliable buy/sell signals.
1) Detects Strong Money Inflow
A BUY condition begins when:
Volume is above 2× the 20-period volume average
Price is moving upward
Volume strength (volume deviation) is positive
→ This means big players are buying.
2) Detects Strong Money Outflow
A SELL condition begins when:
Volume is above 2× the average
Price is falling
→ Means big players are selling.
3) BUY Signal (🚀 AL)
A buy signal is triggered only when ALL of these align:
✔ Strong money inflow
✔ RSI below 70 (not overbought)
✔ MACD bullish crossover (momentum turning up)
→ Result: “Smart money is buying and momentum is shifting upward.”
4) SELL Signal (⚠️ SAT)
A sell signal triggers when:
✔ Money outflow
✔ MACD bearish crossover
→ Result: “Money is leaving and downward momentum is starting.”
5) Background Coloring
Green background = BUY conditions active
Red background = SELL conditions active
6) Alerts Included
TradingView alerts are generated for:
🚀 Buy Signal
⚠️ Sell Signal
🔎 In Summary
This indicator answers one question:
“Where is the money flowing, and when is momentum confirming it?”
It gives early and reliable entry/exit points using a clean, powerful trio:
👉 Volume + RSI + MACD
If you want, I can also write a full English description for TradingView’s description box or a marketing-style product description.

Precision AI Trading ProPrecision AI Trading Pro — TradingView Indicator
EN / 中文雙語說明(No promo, high-level logic, originality stated)
What it does |用途
EN
Trend-aligned entries on 5m/15m (and higher) using multi-layer confirmations. It emphasizes confirmation over prediction, then derives adaptive TP/SL from volatility and recent structure.
中文
在 5/15 分鐘(與更高時框)進行趨勢對齊進場,重確認、不猜轉折;並依波動與近期結構自適應計算 TP/SL。
Why it’s original & useful |原創性與價值
EN
This script implements a custom 11-filter confluence engine and a volatility-aware exit model. Filters are designed to complement each other: HTF context narrows bias, LTF structure checks timing, momentum/volume validate strength, and regime gates avoid chop. Exits use ATR- and swing-based distances with caps to keep results realistic.
中文
本腳本自研 11 重共振濾網 與 隨波動調整的出場模型:HTF 提供方向偏好,LTF 結構掌握時點;動能/量能驗證有效性;型態/趨勢強度門檻過濾震盪;出場以 ATR 與擺動區間計算距離並設上限,使績效更貼近實際。
How it works (high-level) |高層級運作
EN
HTF alignment: EMA(3/8/21) + RSI/MACD on a higher timeframe (confirmed bars only) sets directional bias.
LTF structure: Requires local EMA(3/8/21) alignment, Structure Breakout (recent swing ± ATR buffer), and optional Pullback to EMA8/21.
Regime checks: ADX gate and EMA band width filter out low-trend conditions; Volume confirms pressure.
Risk layer: Peak Guard (overheat/new-high/surge) blocks extended entries.
Trendline/EMA200: Optionally require EMA200 or TL breakout with ATR tolerance.
Exits: SL = max(ATR×k, swing buffer, % floor); TP = min(R×SL, ATR/% caps).
No look-ahead: HTF uses confirmed bars; pivots only annotate context, not used as entry triggers.
中文
HTF 共振:高階時框 EMA(3/8/21)+RSI/MACD(僅採用確認棒)決定方向偏好。
LTF 結構:要求本階 EMA(3/8/21) 一致、結構突破(近期高低點 ± ATR 緩衝),並可選 回踩 EMA8/21。
市況門檻:ADX 閘 與 EMA 帶寬 排除低趨勢環境;量能 驗證推進力。
風險層:Peak Guard(過熱/創高/急漲)避免追價。
趨勢線/EMA200:可選擇要求 EMA200 或趨勢線突破(含 ATR 容忍帶)。
出場:SL = max(ATR×k, 擺動緩衝, % 下限);TP = min(R×SL, ATR/% 上限)。
避免前視:HTF 僅用確認棒;樞紐點僅作標註,不作入場條件。
Filters (11) |濾網(11 項)
HTF Trend / Bright Zone (RSI) / LTF EMA(3/8/21) / MACD / Volume / ADX Gate / Structure Breakout / Pullback to EMA / EMA Band Width / Peak Guard / Trendline or EMA200 Confirmation
(高階趨勢/RSI 亮區/本階 EMA 結構/MACD/量能/ADX 閘/結構突破/回踩 EMA/EMA 窄帶/高位防護/趨勢線或 EMA200 確認)
User can define required passes (default 7).|可自訂需通過的濾網數(預設 7)。
Features |功能
Multi-market presets (Crypto / Gold / US Futures / Forex)|多市場預設
Adaptive TP/SL with labels (dynamic R:R)|自適應 TP/SL(含標註)
Risk-based star rating (0★–5★)|風險星級評分
Signal modes: Conservative / Balanced / Aggressive|訊號模式:保守/平衡/積極
Peak Guard toggle|高位防護可切換
How to use |使用方式
Pick market preset; start with 5m/15m.
Set required filters (default 7) and enable HTF confirmed bars.
Tune TP/SL and risk per symbol/timeframe; use star rating as visual guidance.
In choppy markets, raise ADX min and EMA-band threshold; in trend, relax them slightly.
選擇市場預設(建議 5/15 分鐘起)。
設定需通過的濾網數(預設 7),並啟用 HTF 確認棒。
依商品/時框微調 TP/SL 與風險;以星級作視覺參考。
震盪市提高 ADX 與帶寬門檻;趨勢市可適度放寬。
Notes |注意
Backtest behavior depends on bar resolution and fill rules; intrabar path may differ from live fills.
Educational use only; not financial advice.
No ads/links/contacts.
Changelog |版本紀錄(示例,請用「Update」維護)
2025-09-05: Reversal v2.1 scoring & 2-step confirmation; TL rejection/OB-touch trigger (optional); EMA8 recapture via close; Peak Guard integrated; BTC/ETH/SOL presets refined; alerts expanded; label params cleaned.
2025-08-28: Fixed decimal bug; tuned presets for four markets; kept auto RR/SL logic.
Jarvis Bitcoin Predictor – Advanced AI-Powered TrendJarvis Bitcoin Predictor is an invite-only indicator designed to help traders anticipate market moves with precision.
It combines advanced momentum tracking, volatility analysis, and adaptive trend filters to highlight high-probability trading opportunities.
🔹 Core Features:
- AI-inspired algorithm for Bitcoin price prediction
- Early detection of bullish and bearish trend reversals
- Dynamic support & resistance zones
- Clear buy/sell signal markers
- Built-in alerts to never miss an opportunity
Optimized for Bitcoin, but compatible with other crypto pairs
🔹 How it works (general explanation):
The indicator uses a mix of momentum calculations, volatility filters, and adaptive trend detection to generate signals.
When several market conditions align, Jarvis provides clear entry/exit signals designed to improve decision-making and timing.
🔹 How to use it:
1- Add Jarvis Bitcoin Predictor to your chart.
2- Follow the green signals/zones for bullish opportunities.
3- Follow the red signals/zones for bearish opportunities.
4- Combine with proper risk management and your own strategy.
This tool was built to give traders clarity and confidence in the fast-paced crypto market.
⚠️ Important:
This script is invite-only. To request access, please contact the author directly.

AURA AI - Multi-Layer Signal System# AURA AI - Multi-Layer Signal System
## Originality and Value Proposition
This indicator implements a proprietary multi-layer signal filtering system designed specifically for educational trading analysis. The core value lies in three advanced algorithmic features developed to address common issues in market analysis:
1. **Adaptive Signal Spacing Algorithm**: Dynamically adjusts signal frequency based on real-time volatility calculations using custom ATR multipliers (0.7x to 1.8x)
2. **Hierarchical Signal Filtering**: Three-tier priority system with conflict prevention, cooldown periods, and cross-validation
3. **Progressive Educational Framework**: Contextual learning system with market concept explanations
## Technical Implementation
The system processes market data through multiple validation layers:
- **Primary Signals**: Multi-condition convergence requiring simultaneous confirmation from trend detection, directional strength analysis, momentum indicators, volume validation, and positioning filters
- **Trend Signals**: Direction-following analysis with moving average crossover confirmation and momentum validation
- **Reversal Signals**: Counter-trend opportunity detection with strict distance requirements and timeout filtering
## Algorithm Components and Processing
- **Adaptive Trend Detection**: Custom trailing stop methodology with configurable sensitivity parameters
- **Directional Strength Analysis**: Smoothed momentum indicators with threshold validation
- **Volume-Weighted Confirmation**: Market participation analysis using comparative volume metrics
- **Multi-Timeframe Validation**: Higher timeframe directional bias with hysteresis algorithms for stable detection
- **Custom Filtering Engine**: Proprietary noise reduction and signal prioritization algorithms
## Educational Framework Design
The indicator includes a comprehensive learning system addressing the gap between technical analysis tools and trader education:
- **Progressive Complexity**: Simplified interface for beginners transitioning to professional-grade controls
- **Contextual Explanations**: Real-time tooltips explaining market conditions and signal rationale
- **Risk Management Integration**: Built-in safeguards teaching proper trading practices
- **Signal Classification**: Clear categorization helping users understand different opportunity types
## Justification for Closed-Source Protection
This indicator warrants protection due to:
1. **Proprietary Filtering Algorithms**: Custom-developed signal prioritization and conflict resolution logic
2. **Adaptive Volatility System**: Original methodology for dynamic parameter adjustment
3. **Educational Integration**: Comprehensive learning framework with contextual market education
4. **Risk-Aware Design**: Built-in overtrading prevention and educational safeguards
The combination of these elements creates a unified analytical and educational system that goes beyond standard indicator combinations.
## Configuration and Usage
**Educational Mode**: Simplified interface focusing on high-probability setups with learning tooltips
**Professional Mode**: Full parameter control for experienced traders with advanced filtering options
Key settings include signal type selection, volatility adaptation parameters, multi-timeframe analysis, and day-of-week filtering for backtesting optimization.
## Market Application and Limitations
This system is designed for educational analysis across multiple markets and timeframes. The adaptive algorithms adjust to different volatility environments, though users should understand that no analytical tool can predict future market movements.
The indicator serves as an educational tool to help traders understand market dynamics while providing structured signal analysis. Proper risk management, position sizing, and market knowledge remain essential for successful trading.
## Important Disclosures
- This indicator provides educational analysis tools, not trading advice
- Past signal performance does not guarantee future results
- No claims are made regarding win rates or profitability
- Users must implement proper risk management practices
- Market conditions can change, affecting any analytical system's relevance
