Multiple Moving Averages Alerts ScriptAlerts script that has triggers on multiple moving average crossovers so that profit is maximised, it also has an optional control moving average, enabled by default, that when active will stop trading when the price (first ma) is below the control moving average.
Source code is open so that others can use and modify
Click Below for Backtesting version:
Disclaimers, not an expert, not intended to be financial advise.
Biffy
Cari dalam skrip untuk "alert"
[ALERTS]Super-Trend & SL/TP V3This simple script analyzes the trend in real time...
Alerts, SL, TP, bla, bla, bla...


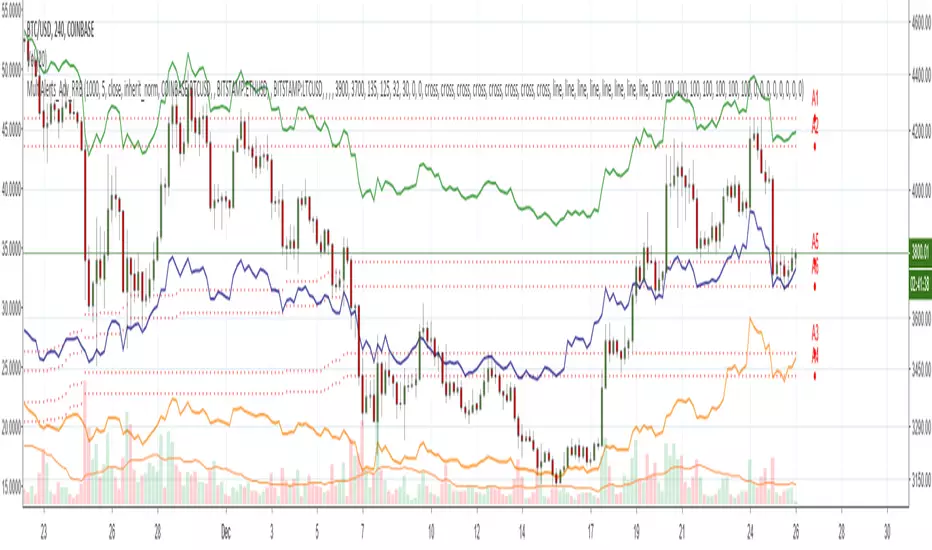
Zindarra Multi Alerts Advanced (8 Symbols, 8 Levels) by RRBZindarra Multi Alerts Advanced by RRB by RagingRocketBull 2018
Version 1.0
This indicator lets you configure multiple alert levels for several assets. Zindarra Multi Alerts Advanced supports 8 symbols with 8 custom alert levels.
You can have an M:M relationship betweeen symbols and levels, for example:
- 4 symbols each boxed by 2 alerts above/below the price
- 3 symbols with 1 alert each
- 2 symbols, 1st with 2 alerts, 2nd - with 6 alerts
- 1 symbol with 8 alerts etc
There are several versions: Simple, Pro, Advanced and Ultimate. This is the Advanced version. The Differences are listed below.
- Simple: 10 Alert Levels, 1 plot mode, alert type: cross, no colors/triggered alerts
- Pro: 9 Alert Levels, 2 plot modes: plot/price line, alert type: cross, +change/swap colors, +hide/disable triggered alerts, 2 penetration modes (close, high/low), trigger on confirmed close
- Advanced: 8 Symbols/Tickers, 8 Alert Levels, +alert types: cross up/cross down, no color change. Display sources as lines/candles, normalize, scale/shift independently
- Ultimate: 5 Symbols/Tickers, 8 Alert Levels, +alert types: volume/price %/abs change, volume/ema/time cross
Features:
- 8 custom symbols, symbols:levels = M:M
- 8 custom alert levels with labels. For each alert there must be a corresponding non-empty symbol (can be a duplicate)
- alert types: cross/cross up/cross down
- normalize symbols (and alert levels) to 100% to compare,
- scale and shift each symbol (and alert levels) to position on a chart independently
- 1 alert levels plot mode: plot
- 2 symbol types: line/candles
- colorize symbol candles
- high/low or close level penetration modes
- show/hide levels/labels
- keep or auto disable triggered alerts
- trigger alerts only after a confirmed close
You will see all symbols on a single chart at the same time with their corresponding alert levels. From this chart you can manage all alerts configured for multiple assets.
Although TradingView has 2 percentage scale modes (Percent, Indexed to 100), somehow they still fail to be usefull when comparing multiple assets.
This indicator lets you normalize all symbols to 100% making a direct single scale comparison between assets with vastly different price levels possible.
All alert levels will be normalized as well.
TradingView does not let you move the plots attached to left scale. When scaled they all remain stuck in the center and can't be moved vertically or relative to each other.
This indicator lets you position all symbols independently using individual scale and shift settings. For example, you can:
- split your screen in 3 horiz areas and have a symbol in each of them without overlapping or
- have several partially overlapping assets with different scale each or
- have all assets fully overlapping and normalized to the same 100% scale
You have to manually create an alert in Manage Alerts Panel and configure it to use with this indicator.
Free accounts are limited to only 1 alert slot and this indicator will take it (any existing alerts must be disabled/stopped).
Once the alert is configured, the indicator can be removed from chart to free a slot for another indicator, but you won't see the alert levels.
Usage:
1. attach indicator to a chart
2. define alert levels in UI settings
3. in TradingView's Manage Alerts panel on the right:
- for free accounts: disable/stop all existing alerts, you are limited to 1 alert slot only. Otherwise you won't be able to save.
- create a new Alert:
- select 'Multi Alerts' indicator name in the Condition dropdown box, leave Level 1 and Multi Alerts Cross as default options
- select 'Once Per Bar' or 'Once Per Minute' instead of 'Only Once' to trigger the alert multiple times
5. click Save. Your 9 alerts are enabled now.
Change Settings:
1. change levels/settings in UI. Any changes will also reset already triggered levels visibility.
2. in Manage Alerts panel:
- open/edit the alert you created
- select new instance of 'Multi Alerts' indicator name in the Condition dropdown box (appears at the bottom)
- check the Condition dropdown again - a single instance should remain selected.
3. click Save. Your alert settings are updated.
Notes on using alerts:
- attaching this indicator to a chart and configuring alert levels will not automatically enable the alerts - you have to manually create/configure a new alert in the Alerts Panel
- removing this indicator from chart will not disable the alerts, you have to manually disable the alert you created in the Alerts Panel
- your alert in the Alerts Panel uses another instance (copy) of indicator/settings. Any changes won't affect the alert. You have to manually update the alert every time you change any settings in the indicator.
- recompiling and attaching your own version of indicator will require creating a new Alert (delete the old one).
- alerts are designed to work in realtime. In replay mode you will see triggered alert levels hiding/changing colors but there will be no system alert messages. It's best to test the indicator in realtime on M1 (1 min) chart
- you will only see 1 system alert per bar/60 sec when multiple alert levels are crossed with a single bar or across several symbols at the same time. However all of these levels will hide in the indicator as expected.
- you can only see the alert levels when the indicator is attached to chart, they are not shown by the system alert.
- For source=high/low a directional level penetration is used automatically (crossunder/low and crossover/high). For source=close a standard bidirectional cross is used unless another alert type is specified.
- normalization breaks/distorts alert levels and symbol price - this is normal and is expected. To view the real price of alert levels uncheck normalize - the first 8 outputs are alert levels. Unnormalized levels are straight lines.
- you will see alerts from all symbols in the system alert message box of the current symbol - a bit confusing, but there's no workaround, you can't have a customized alert message for each symbol/level
- many tickers as arguments can stretch/break TradingView's Create New Alert dialog but it's still possible to push all required buttons and Save.
- duplicate symbols will be displayed by default. You can manually hide duplicates using show/hide flags.
- empty tickers (and corresponding alerts) are essentially disabled
1. uses plot*, cross*, barssince, highest, security, alertcondition
Zindarra Multi Alerts by RRBZindarra Multi Alerts by RRB by RagingRocketBull 2018
Version 1.0
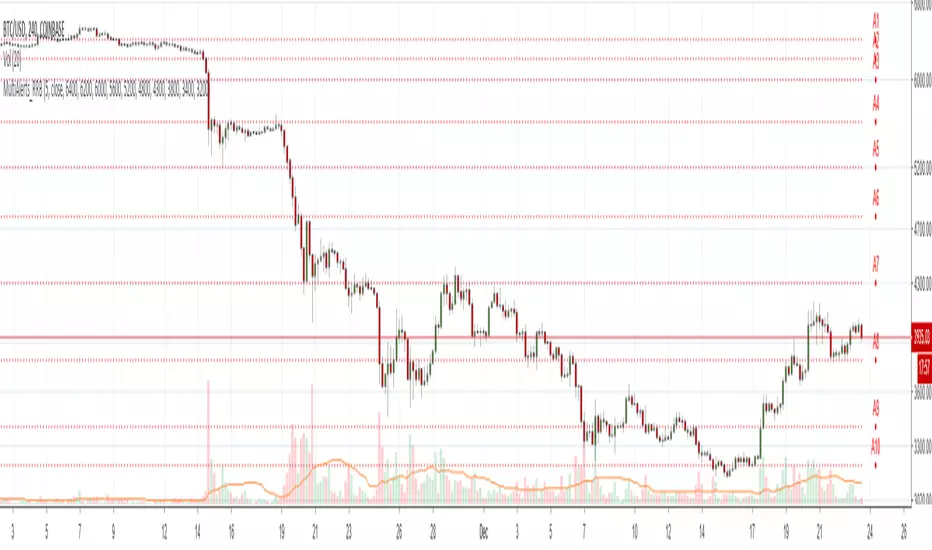
This indicator lets you configure multiple alert levels for an asset. Zindarra Multi Alerts supports 10 custom alert levels.
You have to manually create an alert in Manage Alerts Panel and configure it to use with this indicator.
Free accounts are limited to only 1 alert slot and this indicator will take it (any existing alerts must be disabled/stopped).
Once the alert is configured, the indicator can be removed from chart to free a slot for another indicator, but you won't see the alert levels.
This is the Zindarra Multi Alerts Simple version. You can't auto disable already triggered alerts in this indicator. All alerts will remain active.
If you want to be able to hide/disable/change color of the triggered alert levels use the Zindarra Multi Alerts Pro version.
Features:
- 10 custom alert levels with labels
- set open/high/low/close source point for level penetration
- show/hide levels/labels
Usage:
1. attach indicator to a chart
2. define alert levels in UI settings
3. in TradingView's Manage Alerts panel on the right:
- for free accounts: disable/stop all existing alerts, you are limited to 1 alert slot only. Otherwise you won't be able to save.
- create a new Alert:
- select 'Multi Alerts' indicator name in the Condition dropdown box, leave Level 1 and Multi Alerts Cross as default options
- select 'Once Per Bar' or 'Once Per Minute' instead of 'Only Once' to trigger the alert multiple times
5. click Save. Your 9 alerts are enabled now.
Change Settings:
1. change levels/settings in UI
2. in Manage Alerts panel:
- open/edit the alert you created
- select new instance of 'Multi Alerts' indicator name in the Condition dropdown box (appears at the bottom)
- check the Condition dropdown again - a single instance should remain selected.
3. click Save. Your alert settings are updated.
Notes on using alerts:
- attaching this indicator to a chart and configuring alert levels will not automatically enable the alerts - you have to manually create/configure a new alert in the Alerts Panel
- removing this indicator from chart will not disable the alerts, you have to manually disable the alert you created in the Alerts Panel
- your alert in the Alerts Panel uses another instance (copy) of indicator/settings. Any changes won't affect the alert. You have to manually update the alert every time you change any settings in the indicator.
- recompiling and attaching your own version of indicator will require creating a new Alert (delete the old one).
- alerts are designed to work in realtime. In replay mode you will see only the alert levels but there will be no system alert messages. It's best to test the indicator in realtime on M1 (1 min) chart
- you will only see 1 system alert per bar/60 sec when multiple alert levels are crossed with a single bar.
- you can only see the alert levels when the indicator is attached to chart, they are not shown by the system alert.
- a standard bidirectional cross is used for all penetration sources
1. uses plot*, cross*, alertcondition
Zindarra Multi Alerts Pro (9 Levels) by RRBZindarra Multi Alerts Pro by RRB by RagingRocketBull 2018
Version 1.0
This indicator lets you configure multiple alert levels for an asset. Zindarra Multi Alerts Pro supports 9 custom alert levels.
You have to manually create an alert in Manage Alerts Panel and configure it to use with this indicator.
Free accounts are limited to only 1 alert slot and this indicator will take it (any existing alerts must be disabled/stopped).
Once the alert is configured, the indicator can be removed from chart to free a slot for another indicator, but you won't see the alert levels.
If you want 10 alert levels and don't need colors and Pro features - use Multi Alerts Simple version instead.
Features:
- 9 custom alert levels with labels
- 2 plot modes: plot and price line
- high/low or close level penetration modes
- show/hide levels/labels
- change color based on level position above/below price
- keep or auto disable triggered alerts
- trigger alerts only after a confirmed close
- swap level colors
Usage:
1. attach indicator to a chart
2. define alert levels in UI settings
3. in TradingView's Manage Alerts panel on the right:
- for free accounts: disable/stop all existing alerts, you are limited to 1 alert slot only. Otherwise you won't be able to save.
- create a new Alert:
- select 'Multi Alerts' indicator name in the Condition dropdown box, leave Level 1 and Multi Alerts Cross as default options
- select 'Once Per Bar' or 'Once Per Minute' instead of 'Only Once' to trigger the alert multiple times
5. click Save. Your 9 alerts are enabled now.
Change Settings:
1. change levels/settings in UI. Any changes will also reset already triggered level colors/visibility.
2. in Manage Alerts panel:
- open/edit the alert you created
- select new instance of 'Multi Alerts' indicator name in the Condition dropdown box (appears at the bottom)
- check the Condition dropdown again - a single instance should remain selected.
3. click Save. Your alert settings are updated.
Notes on using alerts:
- attaching this indicator to a chart and configuring alert levels will not automatically enable the alerts - you have to manually create/configure a new alert in the Alerts Panel
- removing this indicator from chart will not disable the alerts, you have to manually disable the alert you created in the Alerts Panel
- your alert in the Alerts Panel uses another instance (copy) of indicator/settings. Any changes won't affect the alert. You have to manually update the alert every time you change any settings in the indicator.
- recompiling and attaching your own version of indicator will require creating a new Alert (delete the old one).
- alerts are designed to work in realtime. In replay mode you will see triggered alert levels hiding/changing colors but there will be no system alert messages. It's best to test the indicator in realtime on M1 (1 min) chart
- you will only see 1 system alert per bar/60 sec when multiple alert levels are crossed with a single bar. However all of these levels will hide/change color in the indicator as expected.
- plot modes: price line - changes color of the whole level, style is not configurable; plot - changes color of a level's segment after each cross, configurable style
- you can only see the alert levels when the indicator is attached to chart, they are not shown by the system alert.
- For source=high/low a directional level penetration is used automatically (crossunder/low and crossover/high). For source=close a standard bidirectional cross is used. Colors always change above/below close.
1. uses plot*, cross*, alertcondition

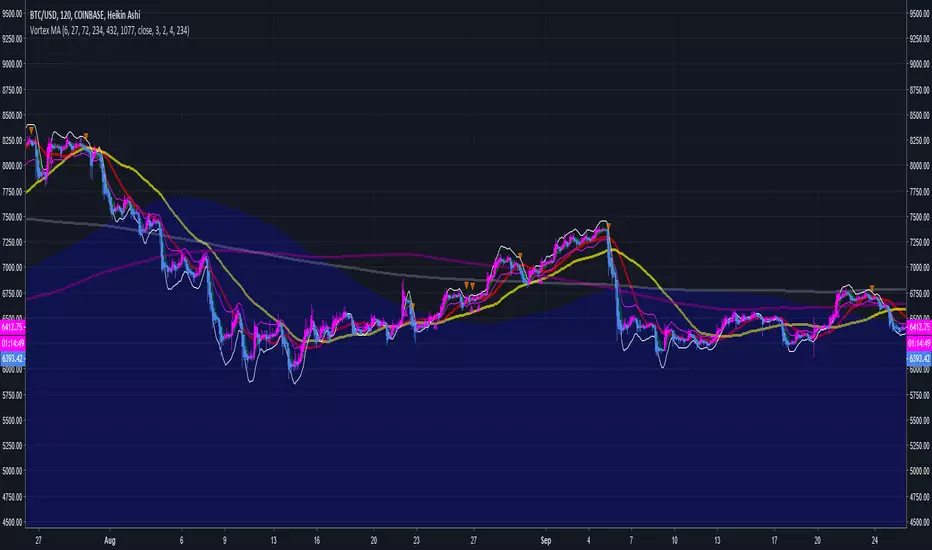
Time-based Alerts for Trading Windows🌟 Time-based Alerts for Trading Windows 🌐📈
This is a re-uploaded script as the previous one got hidden.
This Time-based Alerts for Trading Windows script is a highly customizable and reliable tool designed to assist traders in managing automated strategies or manually monitoring specific market conditions. Inspired by CrossTrade's Time-based Alert, this script is tailored for those who rely on precise time windows to trigger actions, such as sending webhook signals or managing Expert Advisors (EAs).
Whether you are a scalper, day trader, or algorithmic trader, this script empowers you to stay on top of your trades with fully customizable time-based alerts.
🛠️ Customizable Time Alerts
This indicator allows you to create up to 12 unique time windows by specifying the exact hour and minute for each alert. Each time window corresponds to an individual alert condition, making it perfect for managing trades during specific market sessions or key time periods.
For example:
Alert 1 can be set at 9:30 AM (market open).
Alert 2 can be set at 3:55 PM (just before market close).
Each alert can be toggled on or off in the indicator settings, allowing you to manage alerts without having to reconfigure your script.
You can adjust the colours to fit any colour scheme you like!
🕒 Odd and Even Time Alerts
The script comes with three built-in alert type categories:
Odd Alerts (marked with a green triangle on the chart): These correspond to odd-numbered inputs like Alert 1, Alert 3, Alert 5, and so on.
Even Alerts (marked with a red triangle on the chart): These correspond to even-numbered inputs like Alert 2, Alert 4, Alert 6, and so on.
You can also customize all 12 alerts individually to include a custom alert message
These alerts serve as a convenient way to differentiate between multiple trading strategies or market conditions. You can customize alert messages for odd and even alerts directly from TradingView’s alert panel.
🔗 Webhook Integration for Automation
This script is fully compatible with webhook-based automation. By configuring your alerts in TradingView, you can send signals to trading bots, EAs, or any third-party system. For example, you can:
Turn off an EA at a specific time (e.g., 3:55 PM EST).
Send buy/sell signals to your bot during predefined trading windows.
Simply use TradingView’s alert message editor to format webhook payloads for your automation system.
🌐 Timezone Flexibility
Trading happens across multiple time zones, and this script accounts for that. You can toggle between:
Eastern Time (New York): Ideal for most US-based markets.
Central Time (Exchange): Useful for futures and commodities traders.
This ensures your alerts are always in sync with your preferred time zone, eliminating confusion.
🎨 Visual Indicators
The script plots visual markers directly on your chart to indicate active alerts:
Up Facing Triangles: Represent odd-numbered alerts, providing a quick reference for these time windows.
Down Facing Triangles: Represent even-numbered alerts, helping you track different strategies or conditions.
These visual markers make it easy to see when alerts are triggered, even at a glance.
📈 Practical Use Case
Let’s say you’re trading the USTEC index on a 1-minute chart. You want to:
Turn off your trading bot at 16:55 EST to avoid after-market volatility.
Trigger a re-entry signal at 17:30 EST to capture moves during the Asian session.
Visually monitor these actions on your chart for easy reference.
This script makes it possible with precision alerts and webhook integration. Simply configure the time windows in the settings and set up your alerts in TradingView.
🚨 How to Set Up Alerts
Enable or Disable Alerts: Use the script’s settings to toggle specific alerts on or off as needed.
Set Custom Time Windows: Define the hour and minute for each alert in the settings panel.
Create Alerts in TradingView:
Go to the TradingView alert panel.
Select the condition (e.g., "Odd Time-based Alert (Green)" or "Even Time-based Alert (Red)").
Customize the alert message for webhook integration or personal notification.
Choose the trigger type: Once Per Bar or Once Per Bar Close to keep the alert active.
Integrate with Webhooks: Use the alert message field to format payloads for automation systems like MT4, MT5, or third-party bots.
📋 Key Notes
Alerts can trigger indefinitely if set to "Once Per Bar" or "Once Per Bar Close".
Always ensure the expiration date is set far in the future to avoid unexpected alert deactivation.
Test webhook messages and alert configurations thoroughly before using them in live trading.
This script is a powerful addition to your trading toolbox, offering precision, flexibility, and automation capabilities. Whether you’re turning off an EA, managing trades during market sessions, or automating strategies via webhooks, this script is here to support you.
Start using the Time-based Alerts for Trading Windows today and trade with confidence! 🚀✨

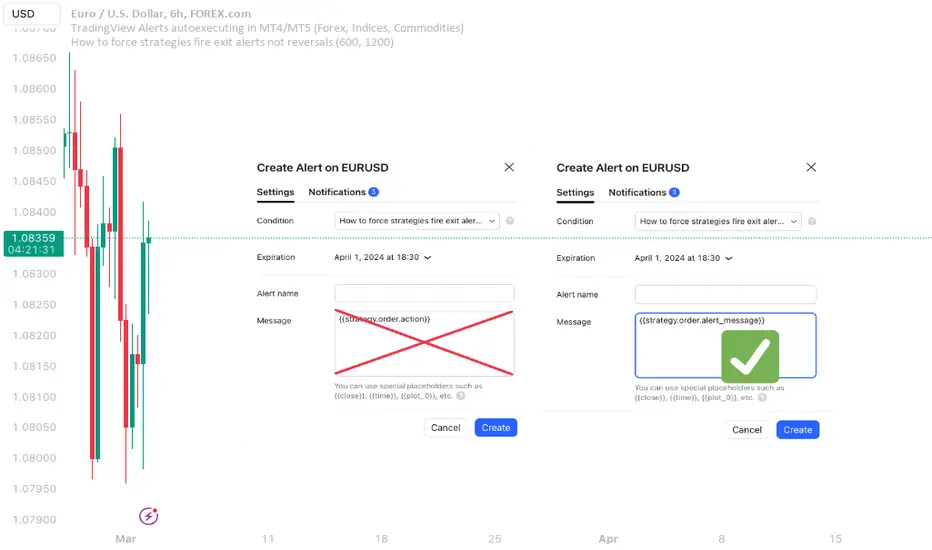
How to force strategies fire exit alerts not reversalsPineScript has gone a long way, from very simple and little-capable scripting language to a robust coding platform with reliable execution endpoints. However, this one small intuitivity glitch is still there and is likely to stay, because it is traditionally justified and quite intuitive for significant group of traders. I'm sharing this workaround in response to frequent inquiries about it.
What's the glitch? When setting alerts on strategies to be synchronized with TradingView's Strategy Tester events, using simple alert messages such as "buy" or "sell" based on entry direction seems straightforward by inserting {{strategy.order.action}} into the Create Alert's "Message" field. Because "buy" or "sell" are exactly the strings produced by {{strategy.order.action}} placeholder. However, complications arise when attempting to EXIT positions without reversing, whether triggered by price levels like Stop Loss or Take Profit, or logical conditions to close trades. Those bricks fall apart, because on such events {{strategy.order.action}} sends the same "sell" for exiting buy positions and "buy" for exiting sell positions, instead of something more differentiating like "closebuy" or "closesell". As a result reversal trades are opened, instead of simply closing the open ones.
This convention harkens back to traditional stock market practices, where traders either bought shares to enter positions or sold them to exit. However, modern trading encompasses diverse instruments like CFDs, indices, and Forex, alongside advanced features such as Stop Loss, reshaping the landscape. Despite these advancements, the traditional nomenclature persists.
And is poised to stay on TradingView as well, so we need a workaround to get a simple strategy going. Luckily it is here and is called alert_message . It is a parameter, which needs to be added into each strategy.entry() / strategy.exit() / strategy.close() function call - each call, which causes Strategy Tester to produce entry or exit orders. As in this example script:
line 12: strategy.entry(... alert_message ="buy")
line 14: strategy.entry(... alert_message ="sell")
line 19: strategy.exit(... alert_message ="closebuy")
line 20: strategy.exit(... alert_message ="closesell")
line 24: strategy.close(... alert_message ="closebuy")
line 26: strategy.close(... alert_message ="closesell")
These alert messages are compatible with the Alerts Syntax of TradingConnector - a tool facilitating auto-execution of TradingView alerts in MetaTrader 4 or 5. Yes, simple alert messages like "buy" / "sell" / "closebuy" / "closesell" suffice to carry the execution of simple strategy, without complex JSON files with multiple ids and such. Other parameters can be added (actually plenty), but they are only option and that's not a part of this story :)
Last thing left to do is to replace "Message" in Create Alert popup with {{strategy.order.alert_message}} . This placeholder transmits the string defined in the PineScript alert_message= parameter, as outlined in this publication. With this workaround, executing closing alerts becomes seamless within PineScript strategies on TradingView.
Disclaimer: this content is purely educational, especially please don't pay attention to backtest results on any timeframe/ticker.
[VTaL] Vertical Time Alert Lines - By BlueJayBird🦾 USE
- Vertical lines drawn ON TOP of chart at selected key times of the day, week, month, year.
- You can use it at any symbol (as far as I know).
- Programmatic alerts available.
- Lines from lower time-frames are selectively NOT visible at higher time-frames. Example: At 1h time-frame, vertical lines from 1h and 4h intervals are not visible. Drawing them is considered not really useful.
🎭 MAIN FEATURES
- Available targeted times: 3m, 15m, 1h, 4h, 1D, 1W, 1M, 1Y.
- Offset available for all lines. Example: 1 offset for 4h moves lines from 4AM to 8AM.
- Programmatic alerts for all lines. Example: If alert is enabled for 15m lines, every time those lines are reached, alert will trigger.
- Available drawing themes: Custom, Light, Dark.
💻 NOTES ON CODE
- Vertical lines are drawn using a custom function, which uses line.new() built-in function.
- Alerts are triggered using ta.cross() built-in function. Alert is triggered when close price crosses a given time value from the line.get_x1() built-in function.
- I've added, where necessary, several comments to the code for understanding what's going on. If you have additional questions, you may ask them in the comment section of the publication.
- 3m lines are not really useful in day-trading, they were added for debugging purposes mainly. Useful for learning how to use alerts, though.
👉🏼 NOTES ON ALERTS
- When setting up an alert, the targeted line must be enabled/visible.
- Every time any alert is enabled or disabled, you must create AGAIN the alert from the "Alerts" panel (remember, alerts run in the back-end).
- Alerts contain really useful information. If you have any idea for adding some other data, tell in the comment section. 💡
⚠️ KNOWN ISSUES
- None. Let me know please if you find any.
--------------------------------------------
~ Comment , Follow and Boost ~ 🚀

5 MAs w. alerts [LucF]Is this gazillionth MA indicator worth an addition to the already crowded field of contenders? I say yes! This one shows up to 5 MAs and 6 different marker conditions that can be used to create alerts, among many other goodies.
Features
MAs can be darkened when they are falling.
MAs from another time frame can be displayed, with the option of smoothing them.
Markers can be filtered to Longs or Shorts only.
EMAs can be selected for either all or the two shortest MAs.
The background can be colored using any of the marker states except no. 3.
Markers are:
1. On crosses between any two user-defined MAs,
2. When price is above or below an MA,
3. On Quick Flips (a specific setup involving a cross, multiple MA states and increasing volume, when available),
4. When the difference between two MAs is within a % of its high/low historic values,
5. When an MA has been rising/falling for n bars,
6. When the difference between two MAs is greater than a multiple of ATR.
Some markers use similar visual cues, so distinguishing them will be a challenge if they are used concurrently.
Alerts
Alerts can be created on any combination of alerts. Only non-consecutive instances of markers 5 and 6 will trigger the alert condition. Make sure you are on the interval you want the alert to run at. Using the “Once Per Bar Close” trigger condition is usually the best option.
When an alert is created in TradingView, a snapshot of the indicator’s settings is saved with the alert, which then takes on a life of its own. That is why even though there is only one alert to choose from when you bring up the alert creation dialog box and choose “5 MAs”, that alert can be triggered from any number of conditions. You select those conditions by activating the markers you want the alert to trigger on before creating the alert. If you have selected multiple conditions, then it can be a good idea to record a reminder in the alert’s message field. When the alert triggers, you will need the indicator on the chart to figure out which one of your conditions triggered the alert, as there is currently no way to dynamically change the alert’s message field from within the script.
Background settings will not trigger alerts; only marker configurations.
Notes
MAs are just… averages. Trader lure would have them act as support and resistance levels. I’m not sure about that, and not the only one thinking along these lines. Adam Grimes has studied moving averages in quite a bit of detail. His numbers point to no evidence indicating they act as support/resistance, and to specific MA lengths not being more meaningful than others. His point of view is debated by some—not by me. Mean reversion does not entail that price stops when it reaches its MA; rather, it makes sense to me that price would often more or less oscillate around its MA, which entails the MA does not act as support/resistance. Aren’t the best mean reversion opportunities when price is furthest away from its MA? If so, it should be more profitable to identify these areas, which some of this indicator’s markers try to do.
I think MAs can be much more powerful when thought of as instruments we can use to situate price events in contexts of various resolutions, from the instantaneous to the big picture. Accordingly, I use the relative positions and slopes of MAs in both discretionary and automated trading; but never their purported ability to support/resist.
Regardless of how you use MAs, I hope you will find this indicator useful.
Biased References
The Art and Science of Technical Analysis: Market Structure, Price Action, and Trading Strategies, Adam Grimes, 2012.
Does the 200 day moving average “work”?
Moving averages: digging deeper

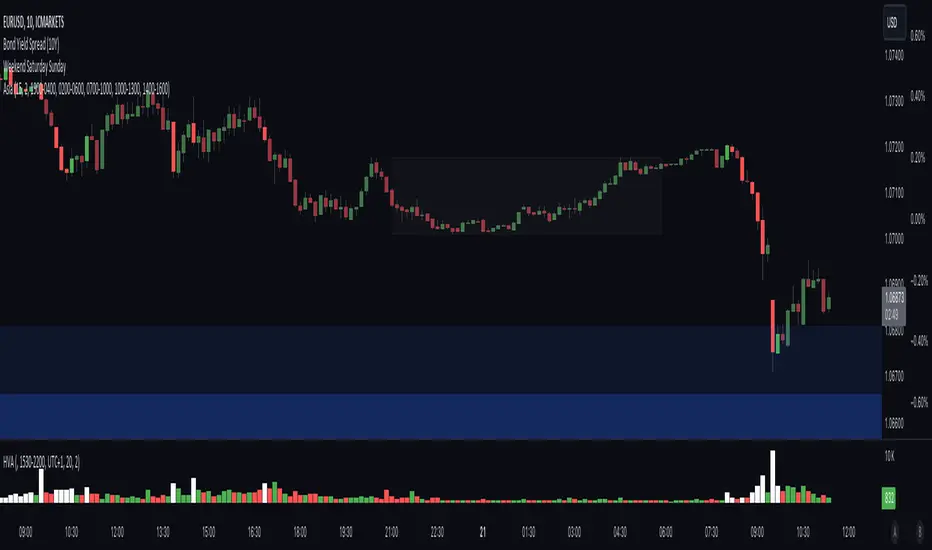
High Volume AlertThe High Volume Alert Script is developed for all traders focusing on volume analysis in their trading strategies, providing alerts for unusually high trading volumes during specified trading sessions.
Functionality:
Volume Moving Average Calculation:
Average Volume = Moving Average(Volume) = Sum of last the x last candles Volume
Where n is the user-defined period for the moving average calculation (denoted as movingaverageinput in the script. This moving average serves as the baseline to compare current volume levels against historical averages.
High Volume Detection:
HighVolume = CurrentVolume >= (MA(Volume) x HighVolumeRatio)
Here, HighVolumeRatio is a user-defined multiplier that sets the threshold for what is considered high volume. If the current volume exceeds this threshold (the product of the moving average of volume and the HighVolumeRatio ), the script identifies this as a high-volume event.
Session Filtering:
The script further refines these alerts by ensuring they only trigger during the specified trading session, enhancing relevance for traders interested in specific market hours. This session is defined by the sess and timezone parameters.
Visualisation and Alerts:
If high volume is detected (HighVolume = True), the script colors the volume bar with the highVolumeColor . If the option is selected, it also changes the color of the candlestick to either highVolumeCandleColorUp (for bullish candles) or highVolumeCandleColorDown (for bearish candles), depending on the price movement within the high-volume period. An alert is generated through the alertcondition function when high volume is detected during the specified session, notifying the trader of potentially significant market activity.
Application in Trading:
This indicator serves traders who prioritize volume as a leading indicator of potential price movement. High trading volumes may indicate the presence of significant market activity, often associated with events like news releases, market openings, or large trades, which can precede price movements.
Originality and Practicality:
This script is self-developed, aiming to fill the gap in automatic ratio adjusted volume alerts within the TradingView environment.
Conclusion:
The High Volume Alert Script is an essential tool for traders who integrate volume analysis into their strategy, offering tailored alerts and visual cues for high volume periods.
Compliance and Limitations:
The script complies with TradingView scripting standards, ensuring no lookahead bias and maintaining real-time data integrity. However, its utility depends on the availability on volume data, and please be aware that forex pairs never offer real volume data, this tool is best used with a exchange traded symbol.
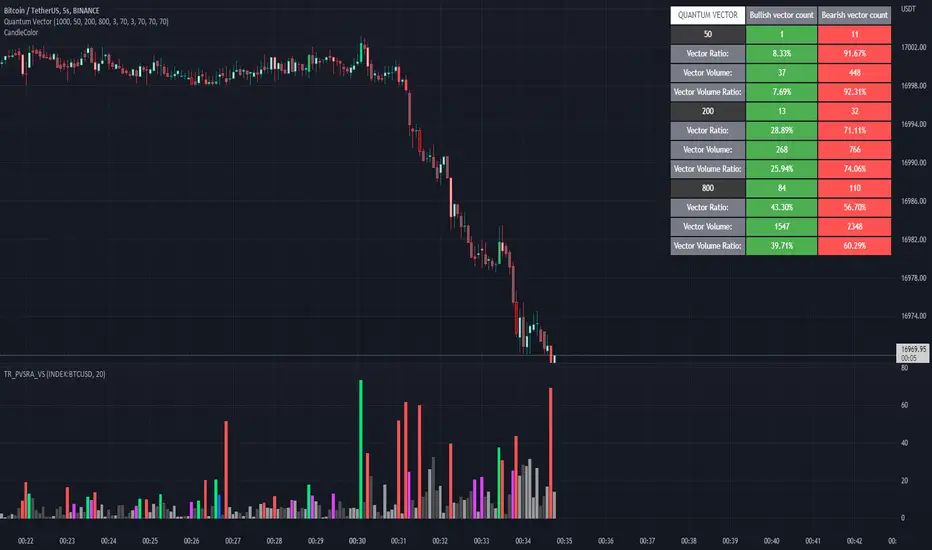
Quantum Vector AlertsIts the part 2 of Multiple Indicators 50EMA Cross Alerts.
Its more suitable for the seconds chart. Beside, you can use it in higher timeframe.
The input bars length is the sample size that the code will use to trigger all alert. 20 mean 20 bar after the current candle.
When you activate volume alert you can select an amount of volume that when volume cross it you will be notified. The volume of every bar is displayed in the screener below volume.
In the section percentage vector counting the script do the sum of the red vector and green vector and give a ratio. In bullish vector count percentage for alert, you can select the percentage difference that you want to receive an alert. If your sample have 3 red vectors and 7 green vectors you will receive an alert saying that there is an imbalance of 70% showing more green vectors.
You can select a variant of percentage vector. The variant will do a summation of volume. If 1 vector candle is the size of the 3 other vector, they will have the same ponderation.
Normal alert counting count the number of vectors in the bars length. You can count the red and green candle only or add the blue and violet.
Bullish vector count will show a notification when the number of green candle will appear on the chart in the selected length. The same process is valid for bearish vector count. For example, if you want 3 bullish candle in 20 bar. You select bars length 20 and bullish vector count 3.
These alerts are suitable to the hybrid system. Thanks to our teacher Trader Reality and to all the member that contribute to this great discord community.
(2) Two AlertsCurrent Trading View free plan allows only ONE active alert.
This simple indicator Allows to trigger this ONE and ONLY alert when price reaches Higher, or Lower price level.
You can set levels and turn alerts for them on/off in settings, or by just drag-n-dropping Horizontal lines on the chart.
To set the only alert you need to create new alert, and change it's following parameters :
condition : 2alerts
Any alert function() call
Feel free to modify it on your needs.
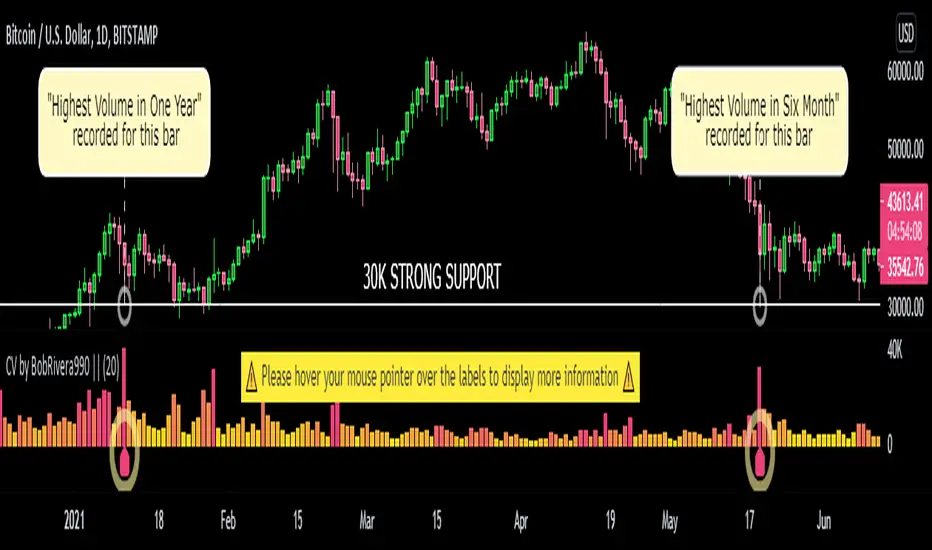
Volume Records + AlertContents
Overall Introduction
Settings menu parameters
Usage
How to use alerts
Limits
Overall Introduction
This indicator is a "volume analysis" tool for confirming the direction and strength of price trend and spotting trend reversals. This tool consists of two parts:
1- The colored graph is a custom volume oscillator which shows the relative changes in volume.
The darkening of the color of the bars is a sign of increasing volume.
2- Triangular labels that show trading volume records over different time periods based on the absolute values of the volume.
By creating an alert, you can be notified of new trading volume records. These records are:
Highest / lowest volume in one year,
Highest / lowest volume in six month
Highest / lowest volume in three month
Highest / lowest volume in one month
Highest / lowest volume in one week
Settings menu parameters
{Short Length} =>
The fast volume MA of the Volume Oscillator.
{Long Length} =>
The slow volume MA of the Volume Oscillator.
{Visual Parameters} =>
Parameters to personalize the appearance of the indicator.
{Alert Conditions Part 01: Highest Records ⏰ } =>
Parameters to customize the alert.
{Alert Conditions Part 02: Lowest Records ⏰ } =>
Parameters to customize the alert.
Usage
This indicator is a "volume analysis" tool for confirming the direction and strength of price trend and spotting trend reversals.
What Is Volume Analysis?
Volume analysis involves examining relative or absolute changes in an asset's trading volume in order to make inferences about future price movements.
A significant price increase along with a significant volume increase, for example, could be a credible sign of a continued bullish trend or a bullish reversal.
The gradual darkening of the bars is a sign of the strength of the trend.
Volume can be an indicator of market strength, as rising markets on increasing volume are typically viewed as strong and healthy.
How to use alerts
Note that by creating an alert, an instance of the indicator, with all your settings, will be activated on the site's server and alerts will be triggered by it.
After that, changing the indicator settings on the chart will no longer affect the alert.
Open the settings window and select the alert conditions as you wish
Click the Create Alert button (or press the A key while holding down the ALT key)
In the Condition section, select the name of the indicator.
Make the rest of the settings as you wish.
Finally, click on the Create button.
It's finished. After a few moments, your alert will be added to the Alerts menu.
Limits
The labels are displayed after the bars close.
Labels are displayed for the last 10,000 bars.

Outside the Bollinger Bands Alerting Indicator Overview
The Outside the Bollinger Bands Alerting Indicator is a comprehensive technical analysis tool that combines multiple proven
indicators into a single, powerful system designed to identify high-probability reversal patterns at Bollinger Band extremes. This
indicator goes beyond simple band touches to detect sophisticated pattern formations that often signal strong directional moves.
Key Features & Capabilities
🎯 Advanced Pattern Recognition
Bollinger Band Breakout Patterns
- Detects "pierce-and-reject" formations where price breaks through a Bollinger Band but immediately reverses back inside
- Identifies failed breakouts that often lead to strong moves in the opposite direction
- Combines multiple confirmation signals: engulfing candle patterns, MACD momentum, and ATR volatility filters
- Visual alerts with symbols positioned below (bullish) or above (bearish) candles
Tweezer Top & Bottom Patterns
- Identifies consecutive candles with nearly identical highs (tweezer tops) or lows (tweezer bottoms)
- Requires at least one candle to breach the respective Bollinger Band
- Confirms reversal with directional close requirements
- Customizable tolerance settings for pattern sensitivity
- Visual alerts with ❙❙ symbols for easy identification
📊 Multi-Indicator Integration
Bollinger Bands Indicator
- Dual-band configuration with outer (2.0 std dev) and inner (1.5 std dev) bands that can be adjusted to suit your own parameters
- Configurable MA types: SMA, EMA, SMMA (RMA), WMA, VWMA
- Customizable length, source, and offset parameters
- Color-coded band fills for visual clarity
Moving Average Suite
- EMA 9, 21, 50, and 200 (individually toggleable)
- Special "SMA 3 High" for help visualizing and detecting Bollinger Band break-outs
- Dynamic color coding based on price relationship
Optional Ichimoku Cloud overlay
- Complete Ichimoku implementation with customizable periods
- Dynamic cloud coloring based on trend direction
- Toggleable overlay that doesn't interfere with other indicators
🚨 Comprehensive Alert System
Real-Time JSON Alerts
- Sends structured data on every confirmed bar close
- Includes all indicator values: BB levels, EMAs, MACD, RSI
- Contains signal states and crossover conditions
- Perfect for automated trading systems and webhooks
{"timestamp":1753118700000,"symbol":"ETHUSD","timeframe":"5","price":3773.3,"bollinger_bands":{"upper":3826.95,"basis":3788.32,"lower":3749.68},"emas":{"ema_9":3780.45,"ema_21":3788.92,"ema_50":3800.79,"ema_200":3787.74,"sma_3_high":3789.45},"macd":{"macd":-10.1932,"signal":-11.3266,"histogram":1.1334},"rsi":{"rsi":40.5,"rsi_ma":39.32,"level":"neutral"}}
Specific Alert Conditions
- MACD histogram state changes (rising to falling, falling to rising)
- RSI overbought/oversold crossovers
- All pattern detections (BB Bounce, Tweezer patterns)
- Bollinger Band breakout alerts
🎨 Visual Elements
Pattern Identification
- ♻ symbols for Bollinger Band breakout patterns (green for bullish, red for bearish)
- ❙❙ symbols for tweezer patterns (green below for bottoms, red above for tops)
- Color-coded band fills for trend visualization
Chart Overlay Options
- All moving averages with distinct colors
- Bollinger Bands with inner and outer boundaries
- Optional Ichimoku cloud with trend-based coloring
Trading Applications
Reversal Trading
- Identify high-probability reversal points at extreme price levels
- Use failed breakout patterns for entry signals
- Combine multiple timeframes for enhanced accuracy
Trend Analysis
- Monitor moving average relationships for trend direction
- Use Ichimoku cloud for trend strength assessment
- Track momentum with MACD and RSI integration
Risk Management
- ATR-based volatility filtering reduces false signals
- Multiple confirmation requirements improve signal quality
- Real-time alerts enable prompt decision making
Suggested Use
- Use on multiple timeframes for confluence
- Combine with support/resistance levels for enhanced accuracy
- Set up alerts for hands-free monitoring
- Customize settings based on market volatility and trading style
- Consider volume confirmation for stronger signals

Impactful pattern and candles pattern AlertThe Alertion indicator!
impactful pattern:
pattern that happen near the zone or in the zone at lower timeframe and give us entry and stop limit price.
It is helpful for price action traders and those who want to decrease their risk.
There are 3 IP patterns:
Quasimodo
Head and shoulder
whipsaw engulfing
These patterns may occur near the zone or may not occur but by them, you can decrease your trading risk for example you can
trade with half lot before IP pattern and enter with other half after pattern.
how to use?
for example:
you find zone at 1h timeframe for short position
when price enter to your zone
you run this indicator and choose your lower timeframe, for example 15m and click on short position.
Then make the alert by right-click on your chart and choose the add alert and at condition box choose the impactful pattern and then click on create
now wait for message :)
Candles pattern:
like reversal bar, key reversal bar, exhaustion bar, pin bar, two-bar reversal, tree-bar reversal, inside bar, outside bar
these occur when the trend turn, so it is usable when the price enter to your zone or near your zone.
This pattern can decrease your risk.
Inside bar and outside bar:
if this pattern engulf up, it is bullish pattern and if engulf down, it is bearish pattern.
what does this indicator do?
this indicator is for making alert
it helps you to decrease your risk and failure.
You optimize it to alert you when IP pattern happen or candle pattern happen or inside bar or outside bar engulfing or all of them.
For IP pattern, it will message you entry and stop limit price.
It works at 2 different timeframes, so you can make alert for example in 1h TF for candles pattern and 15m TF for IP pattern.
Indicator will alert you for candles pattern at your chart timeframe and for IP pattern at timeframe you've chosen when you run the indicator, and it is changeable
in setting.
setting options
TIMEFRAME
IP: select the timeframe for IP patterns it means when IP pattern happen at that timeframe the indicator will alert you
example = your TF is 1h, you found the supply zone and want to trade, note that IP pattern happen in lower TF, so you select 15m TF or TF lower than 1h.
Short position: select it if you want to make short position.
BUFFERING
indicator send you entry and stop limit price
you can change it by amount of percent
it is your strategy to change your entry and stop loss or not
example= in head and shoulder pattern at short position, the stop limit is high price of head in pattern
so the indicator will message you the exact price but if you want to put
your stop limit 5 percent upper than exact price you can enter 5 in front of stop loss
or you want to enter 5 percent lower than exact high price of shoulder, you can optimize it.
ALERTION
you choose what alert you want
IP alert or candle alert or inside and outside bar alert
type your text for alert
you can write additional text for your message
ADVANCE
IP alert frequency option:
1. Once per bar : indicator will alert you for IP pattern once at your chat timeframe bar, and you should wait til next bar for next alert.
2. Once per bar close : alert you when your chart timeframe bar closed and next alert will happen when next bar is closed.
3. All: alert you all the times IP pattern happen
pivot left and right bars: lower will find smaller pattern
at the END:
this indicator is not strategy
it is part of your strategy that help you to increase your winning rate.
It is helpful for scalping and candle patterns finding.
After you make an alert, you can delete the indicator or change your timeframe or make another alert, your previous alert won’t change.
Thank you all.

Custom Volume - Periodic Peaks & Troughs + AlertThis script is a custom volume indicator with additional features.
But why is this useful?
The minimum and maximum volumes, in different time periods, are displayed by labels below the bars. I call them "Peaks" and "Troughs".
Hover your mouse cursor over the labels to see more details.
These parameters are widely used in technical analysis.
If traders want to confirm a reversal on a level of support–or floor–they look for high buying volume. Conversely, if traders are looking to confirm a break in the level of support, they look for low volume from buyers.
If traders want to confirm a reversal on a level of resistance–or ceiling– they look for high selling volume. Conversely, if traders are looking to confirm a break in the level of resistance, they look for high volume from buyers.
For example, take a look at the chart.
Settings menu parameters
{Dialog Box} =>
Parameter to show / hide the dialog box.
{Visual Parameters} =>
Parameters to personalize the appearance of the indicator.
{ Alert Conditions Part 01: Peaks ⏰ "} =>
Parameters to customize the alert.
{ Alert Conditions Part 02: Troughs ⏰ "} =>
Parameters to customize the alert.
{Volume MA} =>
Moving average settings
How to use alerts
Note that by creating an alert, an instance of the indicator, with all your settings, will be activated on the site's server and alerts will be triggered by it.
After that, changing the indicator settings on the chart will no longer affect the alert.
Open the settings window and select the alert conditions as you wish
Click the Create Alert button (or press the A key while holding down the ALT key)
In the Condition section, select the name of the indicator.
Make the rest of the settings as you wish.
Finally, click on the Create button.
It's finished. After a few moments, your alert will be added to the Alerts menu.
Limits
The labels are displayed after the bars close.
Labels are displayed for the last 10,000 bars.
References: Investopedia
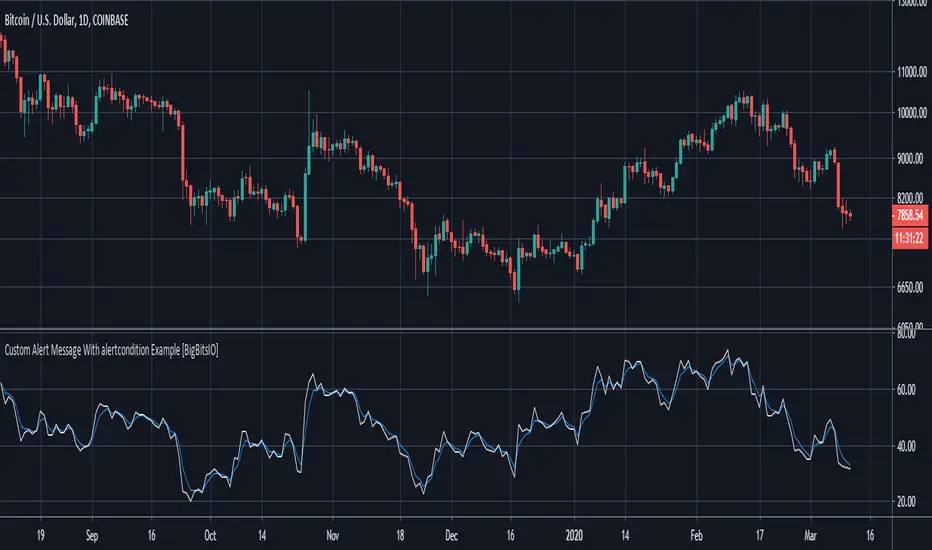
Custom Alert Message With alertcondition Example [BigBitsIO]This was a follower suggested script. This script shows an example of how to create a custom alert message using the alertcondition() function in pine.
Features:
- Well documented code with links to documentation for specific functions.
- Two alertconditions in a different order than the plots they reference to show the importance of plot IDs.
In order to actually get an alert with this script, you must create an alert through TradingView and reference this indicator and then reference the specific alert condition you want that alert to use.
For more information, contact me on social media or check YouTube for the associated video.
*** DISCLAIMER: For educational and entertainment purposes only. Nothing in this content should be interpreted as financial advice or a recommendation to buy or sell any sort of security or investment including all types of crypto. DYOR, TYOB. ***
TradingView Alerts (Expo)█ Overview
The TradingView inbuilt alert feature inspires this alert tool.
TradingView Alerts (Expo) enables traders to set alerts on any indicator on TradingView, both public, protected, and invite-only scripts (if you are granted access). In this way, traders can set the alerts they want for any indicator they have access to. This feature is highly needed since many indicators on TradingView do not have the particular alert the trader looks for, this alert tool solves that problem and lets everyone create the alert they need. Many predefined conditions are included, such as "crossings," "turning up/down," "entering a channel," and much more.
█ TradingView alerts
TradingView alerts are a popular and convenient way of getting an immediate notification when the asset meets your set alert criteria. It helps traders to stay updated on the assets and timeframe they follow.
█ Alert table
Keep track of the average amount of alerts that have been triggered per day, per month, and per week. It helps traders to understand how frequently they can expect an alert to trigger.
█ Predefined alerts types
Crossing
The Crossing alert is triggered when the source input crosses (up or down) from the selected price or value.
Crossing Down / Crossing Up
The Crossing Down alert is triggered when the source input crosses down from the selected price or value.
The Crossing Up alert is triggered when the source input crosses up from the selected price or value.
Greater Than / Less Than
The Greater Than alert is triggered when the source input reaches the selected value or price.
The Less Than alert is triggered when the source input reaches the selected value or price.
Entering Channel / Exiting Channel
The Entering Channel alert is triggered when the source input enters the selected channel value.
The Exiting Channel alert is triggered when the source input exits the selected channel value.
Notice that this alert only works if you have selected "Channels."
Inside Channel / Outside Channel
The Inside Channel alert is triggered when the source input is within the selected Upper and Lower Channel boundaries.
The Outside Channel alert is triggered when the source input is outside the selected Upper and Lower Channel boundaries.
Notice that this alert only works if you have selected "Channels."
Moving Up / Moving Down
This alert is the same as "crossing up/down" within x-bars.
The Moving Up alert is triggered when the source input increases by a certain value within x-bars.
The Moving Down alert is triggered when the source input decreases by a certain value within x-bars.
Notice that you have to set the Number of Bars parameter!
The calculation starts from the last formed candlestick.
Moving Up % / Moving Down %
The Moving Up % alert is triggered when the source input increases by a certain percentage value within x-bars.
The Moving Down % alert is triggered when the source input decreases by a certain percentage value within x-bars.
Notice that you have to set the Number of Bars parameter!
The calculation starts from the last formed candlestick.
Turning Up / Turning Down
The Turning Up alert is triggered when the source input turns up.
The Turning Down alert is triggered when the source input turns down.
-----------------
Disclaimer
The information contained in my Scripts/Indicators/Ideas/Algos/Systems does not constitute financial advice or a solicitation to buy or sell any securities of any type. I will not accept liability for any loss or damage, including without limitation any loss of profit, which may arise directly or indirectly from the use of or reliance on such information.
All investments involve risk, and the past performance of a security, industry, sector, market, financial product, trading strategy, backtest, or individual's trading does not guarantee future results or returns. Investors are fully responsible for any investment decisions they make. Such decisions should be based solely on an evaluation of their financial circumstances, investment objectives, risk tolerance, and liquidity needs.
My Scripts/Indicators/Ideas/Algos/Systems are only for educational purposes!
QQE Cross Indicator Alert v2.0 by JustUncleLThis version of the indicator makes a distinction between the types of QQE cross alerts on the chart and now only recommends the Thresh Hold channel exit crosses for BUY/SELL alerts, the other two types of crosses are still there to provide pre-warning of pending BUY/SELL alerts. Also only the BUY/SELL alerts are filtered by Moving Average Filter and/or the new Directional filter (default). The default settings in this version have also been changed, particularly the Moving Averages, to indicate trend changes quicker.
Indicator Project Description:
*** This is a trend following indicator alert that uses fast QQE crosses with Moving Averages for trend direction filtering. QQE or Qualitative Quantitative Estimation is based on the relative strength index, but uses a smoothing technique as an additional transformation. Three crosses can be selected (all selected by default):
RSI signal crossing ZERO (XZERO)
RSI signal crossing Fast RSIatr line (XQQE)
RSI signal exiting the RSI Threshhold Channel (BUY/SELL)
The (BUY/SELL) alerts can be optionally filtered by the Moving Average Combo:
For BUY alert the Close must be above the fast MA and
fast MA (EMA8) > medium MA (EMA20) > slow MA (SMA50).
For SELL alert the Close must be below the fast MA and
fast MA (EMA8) < medium MA (EMA20) < slow MA (SMA50).
and/or Directional filter (default filter):
For BUY alert the Close must be above the slow MA (SMA50) and the directional MA (EMA20) must be green.
For SELL alert the Close must be below the slow MA (SMA50) and the directional MA (EMA20) must be red.
The XZERO and XQQE are not included in the filtering, they are used to indicate pending BUY/SELL alerts, particularly the XZERO.
Note: I have found the XQQE cross can also be quite good alert for BUY/SELL as well, particularly in direction of current trend. The XZERO I have found to be totally unreliable for BUY/SELL alerts.
This indicator should work on any currency pair, most chart timeframes and expiry in 3 to 6 candles for binary option trading. For hourly or longer charts expiry can be longer for binary options, or if available use standard forex trading techniques
Some Hints for using this indicator:
Avoid taking trades in non-trending market, this is normally indicated by a near Horizontal SMA50 line.
Avoid trading when all the moving averages are close together.
When trading 1min and 5min charts, expiry should set to 1-3 candles.
Avoid trading when market choppy, this is normally indicated by the fast EMA8 crossing the EMA20 back and forwards quickly.
High probability trades tend to occur when you get a XQQE followed by a XZERO and then BUY/SELL in the same direction of trend.
Don't trade near nor directly on any major market news (sometime better no trade day).
Please practise this system in DEMO first, before committing any real money. Be patient the more you practise the better and more confident you will be.
I hope you enjoy this indicator, it has proven very effective for me.

Traders Dynamic Index Indicator Alert v0.1 by JustUncleLThis is a trend trading indicator+alert utilising the Traders Dynamic Index (TDI), Price Action Channel (PAC) and Heikin Ashi candles.
About 6months ago I came across the use of TDI in "E.A.S.Y. Method" that I found in forexfactory forums: www.forexfactory.com
and I was able to set up a chart based on the specifications by using Kurbelklaus scripts. However, I found that the alerts were being generated one or two bars too late, so at that time I was not successful using it with Binary Options. A few months later I found a variation of the method in the forecfactory forums which is able to generate the alerts a bit earlier, so this indicator is a modification of that early detection version.
The indicator can optionally use Heikin Ashi candles only for all it's calculation. I would recommend viewing the chart with Heikin Ashi candles, these smooth out the trends and makes trends very clear.
I found that this method it works good with most currency pairs or commodities and with 5min+ timeframe charts. I would suggest expiry of 2 to 6 candles.
ALERT GENERATION:
=================
The TDI (Traders Dynamic Index)
---------------------------------------------
Volatility Band VB(34), color: Blue, buffer: UpZone, DnZone
Relative Strength Index RSI(13)
RSI PRICE LINE (2), color: Green, buffer: mab
RSI TRADE SIGNAL LINE (7), color: Red, buffer: mbb
MARKET BASE LINE MID VB(34), color: Orange, buffer: mid
Indicator SignalLevels:
-------------------------------
RSI_OversoldLevel : 22 (normally: 32)
RSI_OverboughtLevel : 78 (normally: 68)
Alert Conditions:
-----------------------
Strong Buy : yellow
Medium Buy : aqua
Weak Buy : blue
Strong Sell : fuchsia
Medium Sell : purple
Weak Sell : black
Hints on How to use:
----------------------------
- When a Medium or Strong alert is generated and MACD histogram colour matches the direction
of the alert (optional auto filter), then place trade in direction of alert candle and MACD.
- I use the multi-Hull MA's for overall trend direction confirmation.
- Best positions normally occur near the MACD(5,15,1) Histogram crossing the zero line.
- The optional coloured Dots along the bottom of the indicator represent the first alert
of this type that was generated in this sequence.
- It is advisable to trade in the direction of the main trend as indicated the HULL MA red cloud:
if red cloud underneath PAC then BULLISH trend, if red cloud above PAC then BEARISH trend.
- Selecting the HeiKin Ashi candles does affect the MACD and MA caculations, so if you select
normal candles the result chart will change. You can still Optionally select to use Heikin Ashi
for calculations.
- When using the Heikin Ashi candles, a good buy entry is indicated by long top wick and no bottom wick
for bull (green) candles and good sell entry is indicated by long bottom wick and no top wick for
bear (red) candles.
- When the MACD histogram is flat and close to zero line,
this indicates a ranging market, do NOT trade when this occurs.
- When the PAC channel on the main chart is spread apart widely, this is an indication
of extreme volatility and choppy chart, do NOT try to trade during these periods.
A choppy chart is also indicated by Heikin Ashi candles with long wicks on both sides
of the candles.
- You can specify what strength level Alerts are generated (default 2):
Level (1) means only generate Strong Alerts only.
Level (2) means generate Strong and Medium Alerts.
Level (3) means generate Strong, Medium and Weak Alerts.

FOMO Alert (Miu)This indicator won't plot anything to the chart.
Please follow steps below to set your alarms based on price range variation:
1) Add indicator to the chart
2) Go to settings
3) Choose timeframe which will be used to calculate bars
4) Choose how many bars which will be used to calculate max and min range
5) Choose max and min range variation (%) to trigger alerts
5) Choose up to 6 different symbols to get alert notification
6) Once all is set go back to the chart and click on 3 dots to set alert in this indicator, rename your alert and confirm
7) You can remove indicator after alert is set and it'll keep working as expected
What does this indicator do?
This indicator will generate alerts based on following conditions:
- If min and max prices reach the range (%) from amount of bars on timeframe set for any symbol checked it will trigger an alert.
- If next set of bars reaches higher range than before it will trigger an alert with new data
- If next set of bars doesn't reach higher range than before it will not trigger alerts, even if they are above the range set (this is to prevent the alert to keep triggering with high frequency)
Once condition is met it will send an alert with the following information:
- Symbol name (e.g: BTC, ETH, LTC)
- Range achieved (e.g: 3,03%)
- Current symbol price and current bar direction (e.g: 63,477.1 ▲)
This script will request lowest and highest prices through request.security() built-in function from all different symbols within the range set. It also requests symbols' price (close) and amount of digits (mintick) for each symbol to send alerts with correct value.
This script was developed with main purpose to send alerts when there are strong price movements and I decided to share with community so anyone can set different parameters for different purposes.
Feel free to give feedbacks on comments section below.
Enjoy!

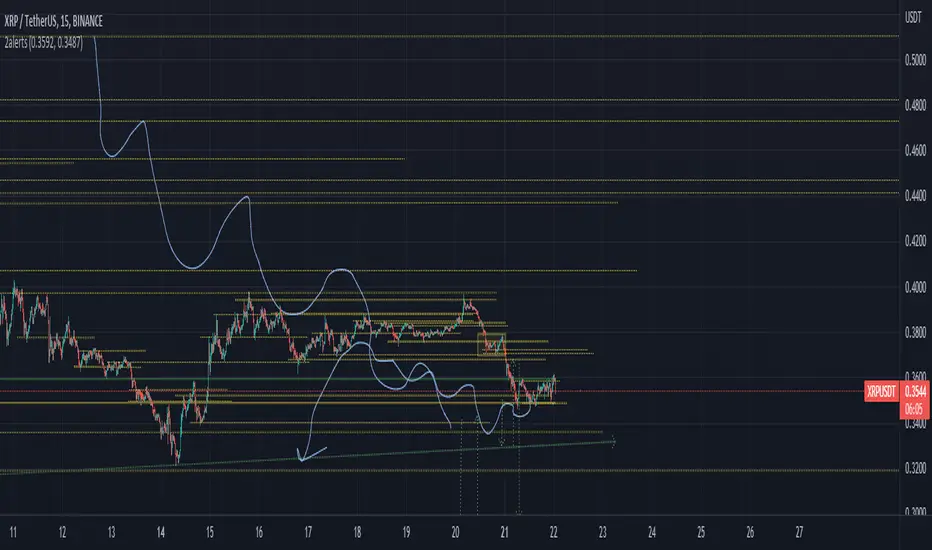
Crossover Alerts for Yesterday O/H/L/C , Today Vwap [Zero54]This is a very simple script/indicator that trigger alerts every time the script triggers the following conditions.
1) Script crosses yesterday's (previous day's) high
2) Script crosses yesterday's (previous day's) low
3) Script crosses yesterday's (previous day's) open
4) Script crosses yesterday's (previous day's) close
5) Script crosses today's vwap.
I developed this to keep track of the scripts I follow and I find it useful. Hope you will find it useful too.
Steps to use:
1) Open the ticker for which you want to set the alerts.
2) Add this indicator to the chart.
3) Right Click on the text and set choose "Add Alert"
4) After you have done with setting up the alert, feel free to remove the indicator from the chart. It is not necessary for the indicator to be added in the chart in order for it to work.
5) Repeat 1-4 for all the scripts for which you want to set the alerts.
Be advised: During market open, if you have set alerts for multiple scripts, a tsunami of alerts may be triggered.
If you like this alert indicator, please like/boost it. Feel free to re-use this code however you may wish to. Cheers!
