SPX Open vs SMA AlertThis indicator is specifically designed to identify the first market-relevant candle of the S&P 500 (SPX) after the market opens. The opening price of the trading day is compared to a customizable simple moving average (SMA) period. A visual marker and an alert are triggered when the opening price is above the SMA. Perfect for traders seeking early market trends or integrating automated trading strategies.
Features:
Market Open: The indicator uses the New York market open time (09:30 ET), accounting for time zones and daylight saving time changes.
Flexible Time Offset: Users can set a time offset to trigger alerts after the market opens.
Customizable SMA: The SMA period is adjustable, with a default value of 10.
Visual Representation: A step-line SMA is plotted directly on the chart with subtle transparency and clean markers.
Alert Functionality: Alerts are triggered when conditions are met (opening price > SMA).
Usage:
This indicator is ideal for identifying relevant trading signals early in the session.
Alerts can also serve as triggers for automated trading, e.g., in conjunction with the Trading Automation Toolbox.
Supports both intraday and daily charts.
Alarm Settings:
Select the appropriate symbol (e.g., SPX) and the alert condition "SPX Open > SMA10".
Trigger Settings:
Choose "Once Per Bar Close" to ensure the condition is evaluated at the end of each candle.
If you prefer to evaluate the condition immediately when it becomes true, choose "Once Per Minute".
Duration:
Set the alarm to "Open-ended" if you want it to remain active indefinitely.
Alternatively, set a specific expiration date for the alarm.
Cari dalam skrip untuk "alert"

Cumulative Volume Delta Custom AlertDescription
This script calculates and visualizes the Cumulative Volume Delta (CVD) on multiple timeframes, enabling traders to monitor volume-based price action dynamics. The CVD is calculated based on up and down volume approximations and displayed as a candle plot, with color-coded alerts when significant changes occur.
Key Features:
Multi-Timeframe Analysis: The script uses a customizable anchor period and a lower timeframe for scanning, allowing it to capture more granular volume movements.
Volume-Based Trend Detection: Plots CVD candles with color indicators (teal for increasing volume delta, red for decreasing), helping traders to visually track volume trends.
Dynamic Alerts for Volume Shifts:
Triggers an alert when there is a significant (over 25%) change in CVD between consecutive periods.
The alert marker color adapts based on the current CVD value:
Blue when the current CVD is positive.
Yellow when the current CVD is negative.
Markers are placed above bars for volume increases and below for volume decreases, simplifying visual analysis.
Customizable Background Highlight: Adds a background highlight to emphasize significant CVD changes.
Use Cases:
Momentum Detection: Traders can use alerts on large volume delta changes to identify potential trend reversals or continuation points.
Volume-Driven Analysis: CVD helps distinguish buy and sell pressure across different timeframes, ideal for volume-based strategies.
How to Use
Add the script to your TradingView chart.
Configure the anchor and lower timeframes in the input settings.
Set up alerts to receive notifications when a 25% change in CVD occurs, with color-coded markers for easy identification.

ICT Setup 01 [TradingFinder] FVG + Liquidity Sweeps/Hunt Alerts🔵 Introduction
The ICT (Inner Circle Trader) style of trading involves analyzing the behavior of market participants and market makers to identify areas where fake buy and sell activities occur. This trading style helps retail traders align with market maker behavior and avoid falling into market traps.
A key aspect of the ICT strategy is focusing on liquidity hunts. This involves searching for trading opportunities in areas of the market with low liquidity or where other traders have little activity. The ICT method leverages market inefficiencies and weaknesses, allowing traders to profit from small price movements that might go unnoticed by others.
In "ICT Setup 01," our focus is on these liquidity areas and stop hunts that form in Fair Value Gaps (FVGs). Trading within FVGs, combined with confirmations from "Hunts" and "Sweeps," can enhance trader performance.
🔵 How to Use
The presence of Fair Value Gaps (FVGs) in the market indicates rapid, powerful movements likely caused by the influx of smart money. When the price returns to these levels, a market reaction is expected.
Combining this with the complex and deceptive behavior of smart money—such as "Liquidity Sweeps" and "Stop Hunts"—forms an ICT-based price action setup that we expect to perform well.
Components of "ICT Setup 01" :
● Fair Value Gap (FVG)
● Premium and Discount
● Hunts / Sweeps
Whenever the price returns to an FVG area and reacts in such a way that only the wicks of the candles remain in the area and the candle bodies are outside the FVG, the first condition for creating the setup is met.
If subsequent candles hunt the wick that has penetrated the deepest into the FVG, a buy or sell signal is issued. In the format where hunting is based on Sweeps, penetrations that extend even outside the area are considered signals, provided they do not form a body within the area.
Additionally, a refining system exists for cases where a candle body forms in the area, optimizing the proximal levels of the FVG.
Bullish Setup :
Bearish Setup :
🔵 Features and Settings of "ICT Setup 01"
You can Find out more in Setting :
● FVG Detector Multiplier Factor
● FVG Validity Period
● Level in Low-Risk Zone
● Issuing Signals Method
● Number of Signals Allowed from a Zone
● Signal after Hunts/Sweeps
● How Many Hunts/Sweeps
● Show or Hide
● Alert Sender
FVG Detector Multiplier Factor :
This feature allows you to determine the size of the moves forming the FVGs based on the ATR (Average True Range). The default value is 1 to identify the majority of setups. You can increase this value according to the symbol and market you are trading in to achieve better results.
FVG Validity Period :
This shows the validity period of an FVG based on the number of candles. By default, an FVG area is valid for up to 15 candles. However, you can increase or decrease this period.
Level in Low-Risk Zone :
This feature helps reduce your risk. The method works by identifying the entire length of the three candles forming the FVG and dividing it into two equal areas. The upper area is "Premium," and the lower area is "Discount." To reduce risk, it is better for "Demand FVG" to be in the "Discount" and "Supply FVG" in the "Premium." This feature is off by default.
Issuing Signals Method :
This feature allows you to specify whether the hunt should occur only within the FVG area or if the wicks can extend outside the area.
If set to "Hunts," only signals where the wicks are within the area are issued, and the area loses its validity if the wicks extend outside.
In "Sweeps" mode, wicks can extend outside the area as long as they do not form a body within the area.
Number of Signals Allowed from a Zone :
This feature allows you to specify how many valid signals can be issued from one area.
Signal after Hunts/Sweeps :
In markets or symbols with a tendency for frequent stop hunts, this feature allows you to specify how many hunts should occur before you receive a signal to avoid receiving potentially failed signals.
How Many Hunts/Sweeps :
Enter the number of hunts you want to set for the "Signal after Hunts/Sweeps" feature here.
Show or Hide :
The number of setups formed may be very large, and displaying all of them on the chart can be distracting and messy. By default, only the last setup is displayed, but if you want to see all setups, you can turn on the relevant options.
Alert Sender :
You cannot constantly monitor multiple charts to identify trading opportunities. Using the alert sending feature can save time and improve performance.
Alerts Name : Customize the alert name to your preference.
Message Frequency : Determines the frequency of alert messages. Options include 'All' (triggers every time the function is called), 'Once Per Bar' (triggers only on the first call within the bar), and 'Once Per Bar Close' (triggers only on the final script execution of the real-time bar upon closure). The default is 'Once per Bar.'
Show Alert Time by Time Zone : Configure the alert messages to reflect any chosen time zone. For instance, input 'UTC+1' for London time. The default is 'UTC.'
By configuring these settings, traders can effectively utilize ICT setups to improve their trading strategies and outcomes.

Change Analysis and AlertsThe "Change Analysis and Alerts" script in Pine Script allows you to analyze and visualize the percentage change of different values on a chart. It calculates the true change based on the closing prices and provides options to input custom values for comparison. The script also includes an alert feature that triggers when the true change exceeds a specified threshold.
Examples:
Analyzing True Change:
Show the true change between consecutive candle closes as a histogram.
Set a threshold for the true change and receive an alert when it surpasses the specified value.
Comparing Custom Values:
Input custom values to analyze the percentage change between different price levels (e.g., high-low, open-close).
Highlight the value with the highest change in each period.
Visualize the changes as columns on the chart for easy comparison.
By using the "Change Analysis and Alerts" script, traders and analysts can gain insights into the magnitude of price changes and receive alerts when significant changes occur.
Please note that this description and examples are provided for illustrative purposes and can be customized based on your specific needs and preferences.
If you need further assistance, feel free to ask.

TSI + DivergencesTrue Strength Indicator (TSI) + Divergences + Alerts + Lookback periods.
This version of the True Strength Indicator adds the following 3 additional features to the stock TSI by Tradingview:
- Optional divergence lines drawn directly onto the oscillator.
- Configurable alerts to notify you when divergences occur.
- Configurable lookback periods to fine tune the divergences drawn in order to suit different trading styles and timeframes.
This indicator adds additional features onto the stock TSI by Tradingview, whose core calculations remain unchanged. Namely the configurable option to automatically, quickly and clearly draw divergence lines onto the oscillator for you as they occur, with minimal delay. It also has the addition of unique alerts, so you can be notified when divergences occur without spending all day watching the charts. Furthermore, this version of the TSI comes with configurable lookback periods, which can be configured in order to adjust the sensitivity of the divergences, in order to suit shorter or higher timeframe trading approaches.
The True Strength Indicator
Tradingview describes the True Strength Indicator as follows:
“The True Strength Index (TSI) is a momentum oscillator that ranges between limits of -100 and +100 and has a base value of 0. Momentum is positive when the oscillator is positive (pointing to a bullish market bias) and vice versa. It was developed by William Blau and consists of 2 lines: the index line and an exponential moving average of the TSI, called the signal line. Traders may look for any of the following 5 types of conditions: overbought, oversold, centerline crossover, divergence and signal line crossover. The indicator is often used in combination with other signals..”
What are divergences?
Divergence is when the price of an asset is moving in the opposite direction of a technical indicator, such as an oscillator, or is moving contrary to other data. Divergence warns that the current price trend may be weakening, and in some cases may lead to the price changing direction.
There are 4 main types of divergence, which are split into 2 categories;
regular divergences and hidden divergences. Regular divergences indicate possible trend reversals, and hidden divergences indicate possible trend continuation.
Regular bullish divergence: An indication of a potential trend reversal, from the current downtrend, to an uptrend.
Regular bearish divergence: An indication of a potential trend reversal, from the current uptrend, to a downtrend.
Hidden bullish divergence: An indication of a potential uptrend continuation.
Hidden bearish divergence: An indication of a potential downtrend continuation.
Setting alerts.
With this indicator you can set alerts to notify you when any/all of the above types of divergences occur, on any chart timeframe you choose.
Configurable lookback values.
You can adjust the default lookback values to suit your prefered trading style and timeframe. If you like to trade a shorter time frame, lowering the default lookback values will make the divergences drawn more sensitive to short term price action.
How do traders use divergences in their trading?
A divergence is considered a leading indicator in technical analysis, meaning it has the ability to indicate a potential price move in the short term future.
Hidden bullish and hidden bearish divergences, which indicate a potential continuation of the current trend are sometimes considered a good place for traders to begin, since trend continuation occurs more frequently than reversals, or trend changes.
When trading regular bullish divergences and regular bearish divergences, which are indications of a trend reversal, the probability of it doing so may increase when these occur at a strong support or resistance level. A common mistake new traders make is to get into a regular divergence trade too early, assuming it will immediately reverse, but these can continue to form for some time before the trend eventually changes, by using forms of support or resistance as an added confluence, such as when price reaches a moving average, the success rate when trading these patterns may increase.
Typically, traders will manually draw lines across the swing highs and swing lows of both the price chart and the oscillator to see whether they appear to present a divergence, this indicator will draw them for you, quickly and clearly, and can notify you when they occur.
Disclaimer : This script includes code from the stock TSI by Tradingview as well as the RSI divergence indicator.

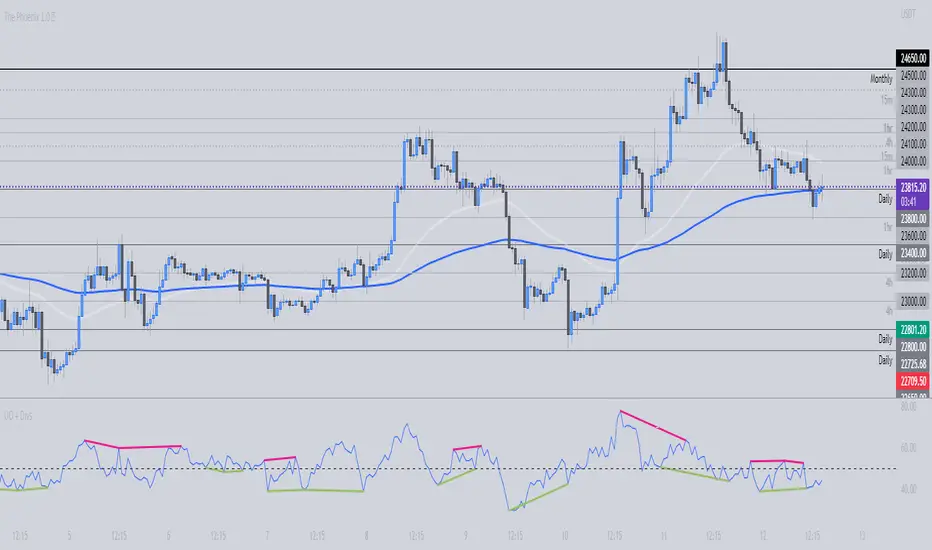
Ultimate Oscillator + DivergencesUltimate Oscillator (UO) + Divergences + Alerts + Lookback periods.
This version of the Ultimate Oscillator adds the following 3 additional features to the stock UO by Tradingview:
- Optional divergence lines drawn directly onto the oscillator.
- Configurable alerts to notify you when divergences occur.
- Configurable lookback periods to fine tune the divergences drawn in order to suit different trading styles and timeframes.
This indicator adds additional features onto the stock Ultimate Oscillator by Tradingview, whose core calculations remain unchanged. Namely the configurable option to automatically, quickly and clearly draw divergence lines onto the oscillator for you as they occur, with minimal delay. It also has the addition of unique alerts, so you can be notified when divergences occur without spending all day watching the charts. Furthermore, this version of the Ultimate Oscillator comes with configurable lookback periods, which can be configured in order to adjust the sensitivity of the divergences, in order to suit shorter or higher timeframe trading approaches.
The Ultimate Oscillator
Tradingview describes the Ultimate Oscillator as follows:
“The Ultimate Oscillator indicator (UO) indicator is a technical analysis tool used to measure momentum across three varying timeframes. The problem with many momentum oscillators is that after a rapid advance or decline in price, they can form false divergence trading signals. For example, after a rapid rise in price, a bearish divergence signal may present itself, however price continues to rise. The ultimate Oscillator attempts to correct this by using multiple timeframes in its calculation as opposed to just one timeframe which is what is used in most other momentum oscillators.”
More information on the history, use cases and calculations of the Ultimate Oscillator can be found here: www.tradingview.com
What are divergences?
Divergence is when the price of an asset is moving in the opposite direction of a technical indicator, such as an oscillator, or is moving contrary to other data. Divergence warns that the current price trend may be weakening, and in some cases may lead to the price changing direction.
There are 4 main types of divergence, which are split into 2 categories;
regular divergences and hidden divergences . Regular divergences indicate possible trend reversals, and hidden divergences indicate possible trend continuation.
Regular bullish divergence: An indication of a potential trend reversal, from the current downtrend, to an uptrend.
Regular bearish divergence: An indication of a potential trend reversal, from the current uptrend, to a downtrend.
Hidden bullish divergence: An indication of a potential uptrend continuation.
Hidden bearish divergence: An indication of a potential downtrend continuation.
Setting alerts.
With this indicator you can set alerts to notify you when any/all of the above types of divergences occur, on any chart timeframe you choose.
Configurable lookback values.
You can adjust the default lookback values to suit your prefered trading style and timeframe. If you like to trade a shorter time frame, lowering the default lookback values will make the divergences drawn more sensitive to short term price action.
How do traders use divergences in their trading?
A divergence is considered a leading indicator in technical analysis, meaning it has the ability to indicate a potential price move in the short term future.
Hidden bullish and hidden bearish divergences, which indicate a potential continuation of the current trend are sometimes considered a good place for traders to begin, since trend continuation occurs more frequently than reversals, or trend changes.
When trading regular bullish divergences and regular bearish divergences, which are indications of a trend reversal, the probability of it doing so may increase when these occur at a strong support or resistance level. A common mistake new traders make is to get into a regular divergence trade too early, assuming it will immediately reverse, but these can continue to form for some time before the trend eventually changes, by using forms of support or resistance as an added confluence, such as when price reaches a moving average, the success rate when trading these patterns may increase.
Typically, traders will manually draw lines across the swing highs and swing lows of both the price chart and the oscillator to see whether they appear to present a divergence, this indicator will draw them for you, quickly and clearly, and can notify you when they occur.
Disclaimer : This script includes code from the stock UO by Tradingview as well as the RSI divergence indicator.
Moon Launch Alerts Template [Indicator]I created this indicator/study script because i ran into the issue that the same Alerts would fire multiple times. For example it would trigger a Long signal when already being in a Long. I guess there would be no issue with a very basic strategy but with a larger script and many variables, it seemed to create complications.
This is resolved by a TradingLine oscillator and only when it switches to a new and different position from previous, will it trigger an Alert.
If you are in a Long and it signals Long again, then this is seen as a "Continuation Long" in the Alerts settings. You can use this condition to add to your existing position (Optional). Continuation signals are plotted as bright green/red dots.
You will notice there's an option to uncheck "Trade Shorts" and "Trade Exits" signals.
Lets say you choose not to trade Short and Exits, then your Long would only Exit once a Short signal is detected.
This could prove useful for Back-testing purposes.
This quick example script uses the EMA 10, EMA 200, emaPlus1Atr and emaMinus1Atr.
To use in your script, you will need to modify and add your own BUY/SELL/EXIT signals in the box where it says:
//// INPUT YOUR BUY/SELL/EXIT SIGNALS HERE: ////
//////////////////////////////////////////////////
Hope someone will find this useful, or even just as an additional visual confirmation for your own trading strategy and script.

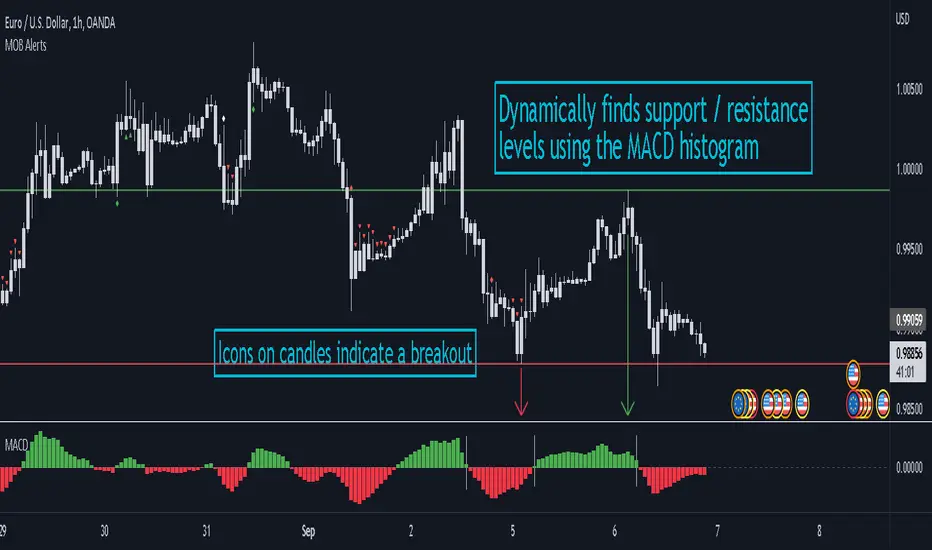
MACD Objective Breakouts + AlertsFinds the most recent support and resistance level as confirmed by the MACD . These level are detected dynamically and the lines will be updated as new levels form.
Alerts can be toggled on or off in the settings but will not work if the alert is not added to your chart. Alerts can be added by selecting the "Alert" button on TradingView then selecting "MOB Alerts" as the condition
Alerts will trigger when price closes above or below the indicated levels.
Please let me know if you find any bugs!
Argo I (alerts for 3commas single bots)This script lets users create BUY/SELL alerts for 3commas single bots in a simple way, based on a built in set of indicators that can be tweaked to work together or separately through the study settings. Indicators include Bollinger Bands, Williams %R, RSI, EMA, SMA , Market Cipher, Inverse Fisher Transform.
If the user choses to create both BUY and SELL signals from the study settings, the alert created will send both BUY and SELL signals for the selected pair. Note the script will only send alerts for the pair selected in the study settings, not for the current chart (if different).
How to use:
- Add the script to the current chart
- Open the study settings , insert bot details. Pairs MUST be in capital letters or 3commas will not recognize them.
- Still in the study settings, tweak the deal start/close conditions from various indicators until happy. The study will plot the entry / exit points below the current chart (1 = buy, 2 = sell)
- Ideally, test the settings with a backtesting script. The present script is compatible with the Trading Parrot's backtester.
- When happy, right click on the "..." next to the study name, then "Add alert'".
- Under "Condition", on the second line, chose "Any alert () function call". Add the webhook from 3commas, give it a name, and "create".
Happy tweaking!

MA Proximity Alert SystemThis script enables you to get an alert when the price gets in close proximity to moving average of your choice.
►Proximity is a true range multiplied by the number of your choice
►It is designed to be used as a one-use alert. If you enable it to give you one alert per bar close, it is possible to limit the spam by number of periods for which price must be outta proximity range
►Calculations T3, EMA, SMA for true range channel
►EMA and SMA for moving average
I circled the areas where I find the reaction somewhat interesting. Although, I think there are more areas when alert would be useful in the chart.
Have a great trade!

$ SuPeR-RePaNoCHa $ [Alerts]Script for automatic trading (Alerts). This is the second part of the previous RePanoCHa script but with Take Profit.
It Use 6 indicators + volume:
-JURIK MOVING AVERAGE
-RANGE FILTER (DONOVAN WALL)
-ADX (ORIGINAL VERSION)
-PARABOLIC SAR
-RSI + VOLUME WEIGHTED (LAZYBEAR)
-MACD
-VOLUME
To close the position you can choose between Take Profit only, Trailing Stop only or both at the same time.
Example of bot syntax: (alerts once per bar)
LONG | e=BINANCEFUTURES a=ACCOUNT s=BTCUSDT c=order | delay=1 | e=BINANCEFUTURES a=ACCOUNT s=BTCUSDT c=position b=short t=market ro=1 | delay=1 | e=BINANCEFUTURES a=ACCOUNT s=BTCUSDT b=long q=100% t=market | delay=1 | e=BINANCEFUTURES a=ACCOUNT s=BTCUSDT c=position b=long p=0.7% q=50% t=post ro=1
SHORT | e=BINANCEFUTURES a=ACCOUNT s=BTCUSDT c=order | delay=1 | e=BINANCEFUTURES a=ACCOUNT s=BTCUSDT c=position b=long t=market ro=1 | delay=1 | e=BINANCEFUTURES a=ACCOUNT s=BTCUSDT b=short q=100% t=market | delay=1 | e=BINANCEFUTURES a=ACCOUNT s=BTCUSDT c=position b=short p=-0.7% q=50% t=post ro=1
LONG TP | e=BINANCEFUTURES a=ACCOUNT s=BTCUSDT c=position q=50% t=market ro=1 (if you set the TP from entry this alert is not necessary)
SHORT TP | e=BINANCEFUTURES a=ACCOUNT s=BTCUSDT c=position q=50% t=market ro=1 (if you set the TP from entry this alert is not necessary)
LONG TS | e=BINANCEFUTURES a=ACCOUNT s=BTCUSDT c=position q=10% t=market // (alerts once per minute)
SHORT TS | e=BINANCEFUTURES a=ACCOUNT s=BTCUSDT c=position q=10% t=market // (alerts once per minute)
XLONG/STOP-LOSS | e=BINANCEFUTURES a=ACCOUNT s=BTCUSDT c=order | delay=1 | e=BINANCEFUTURES a=ACCOUNT s=BTCUSDT c=position b=long t=market ro=1
XSHORT/STOP-LOSS | e=BINANCEFUTURES a=ACCOUNT s=BTCUSDT c=order | delay=1 | e=BINANCEFUTURES a=ACCOUNT s=BTCUSDT c=position b=short t=market ro=1

Rhaps SMAEMA Combo v1.1There's many versions of this sort of thing around the Tradingview library, but i guess we all like things to our own specifications.
So this is my take on the SMA and EMA version combined.
Bunch of SMA's & EMA's, with labels, and G&D Cross Labels and Alerts.
These values can of course be changed to any you may prefer.
Rhapsodyy's Combo SMAEMA's v1.1
SMA's with Painted Labels : 10/30/50/80/200
EMA's with Painted Labels : 21/50/89/200/377
50SMA / 200SMA Golden & Death Crosses on Current Timeframe & Alerts
Daily 50SMA / 200SMA Golden & Death Crosses overlayed onto Current Timeframe & Alerts
50EMA / 200EMA Golden & Death Crosses on Current Timeframe & Alerts
Daily 50EMA / 200EMA Golden & Death Crosses overlayed onto Current Timeframe & Alerts

QuantNomad - Ultimate Pivot Points AlertsCreated a universal script for pivot points alerts.
In the script, you can choose one of 4 pivot point types: Traditional, Fibonacci, Woodie, and Camarilla.
You are able to create separate alerts for every level or create one for price crossing any level.
For separate levels, you can choose: "Cross", "Crossover" and "Crossunder".
You can also choose to show/hide:
Historical Levels
Levels Values
Current Levels - Levels calculated on the current period, on close of the period they will become valid levels for next periods. These levels do not participate in alerts calculations.
Because of some TradingView limitations, alerts won't be fired for the first bar of the session.
In the script used new v4 plotting features, so will be able to plot levels and labels nicely. Unfortunately, there is a limit on the number of consecutive lines you can plot on the plot (around 50), so historical lines in the past will disappear after 6-7 periods.
And remember:
Past performance does not guarantee future results.
Chaikin MF% (CMFP) w. Alerts, Bells & Whistles [LucF]This is Chaikin’s Money Flow indicator on a 0-100 scale with buy/sell signals, alerts and other bells & whistles.
It includes:
- a fast EMA (16 periods by default),
- a slow MA (64 periods by default),
- histograms,
- 3 different sorts of crosses,
- big swings identification,
- buy/sell signals on CMFP crossing back from outside user-defined levels,
- buy/sell signals on the slow MA pivots above/below user-defined levels,
- alerts on big swings and buy/sells.
This indicator started with @LazyBear code (VAPI) at:
@cI8DH then changed the scale to 0-100, which I find very useful:
I then added the rest.
The chart above shows both clean and busy versions of the indicator.
Note that the default length is 10 rather than the commonly used 20. I use CMFP in conjunction with VFI and like the fact that it is faster than VFI. The default inputs show the way I normally use this indicator, with the slow MA shown in histogram mode. I find it gives good context to the signal line. Crosses between the two are often useful.
The buy/sell signals aren’t the main attraction of this indicator, and nothing to write home about. Like the big swing markers, I think it’s more realistic to view them as pointers to potentially interesting areas on charts. Their nature makes them more suited to identifying reversals. They certainly aren’t reliable enough to turn this study into a strategy and I normally don’t use them. The levels pre-defined for the buy/sell signals on CMFP are most useful on short intervals. The buy/sell signals on the slow MA pivots work on a more complete range of intervals. Optimization for your specific instruments and intervals will improve their reliability.
As usual when defining alerts, be sure you already have defined proper inputs and that you are on the intended interval, as they will be used when triggering alerts.

MG - Fibonacci Alerts - 1.2Updated version of:
The main change with this version, is that the indicator is now always overlayed and the user has to specify where they want the alerts to be displayed on the chart. (New 'Alert Base' and 'Alert Amplitude' properties define where this is shown in the chart and how large the alert spikes are). It also now includes optional bull and sell markers
This update therefore allows us to:
- Show the Fibonacci Levels being used by the indicator
- Plot buy and sell signals at the correct points on the price chart
- Trigger alerts when price reaches a Fibonacci level (without displaying this on the chart, the indicator can't be overlayed on the main chart)
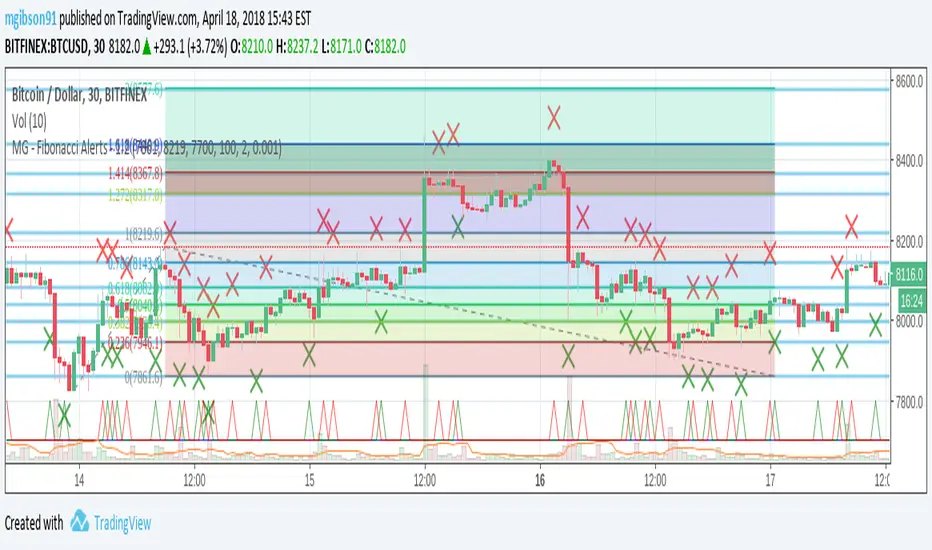
MG - Fibonacci Level AlertsThis script allows a user to get alerts when the price goes within a certain percentage threshold of a Fibonacci level.
If connected with AutoView, it could allow an easy way to do automated range trading between Fibonacci levels. Although I plan to do this myself, I haven't used it for this purpose yet so please be cautious and verify with live results beforehand before using it for any automation.
NOTE: The image shown of the indicator is not fully correct as the close price is used. In many cases in the example image, the candle close price DID come within the alert threshold but closed outside the threshold
Usage:
1. User performs a Fibonacci retracement / extension analysis to identify a sensible high and low point. (Currently, this script is geared towards dip pullbacks during a bull market with the ability to toggle rise pullbacks in a bear market in the pipeline)
2. User enters the high and low points into this indicator
3. User can then set alerts on the buy and sell signals which should provide alerts at excellent entry / exit points.
4. Set the alerts to once per bar (not per close). In this indicator, we want to catch things as soon as they happen.
NOTE: Should use in conjunction with another indicator for maximum results.
I personally use this indicator ()
TODO
- Add negative alert levels
- Allow user to specify direction of Fib retracement as the levels are different in bull and bear markets
All feedback is welcome

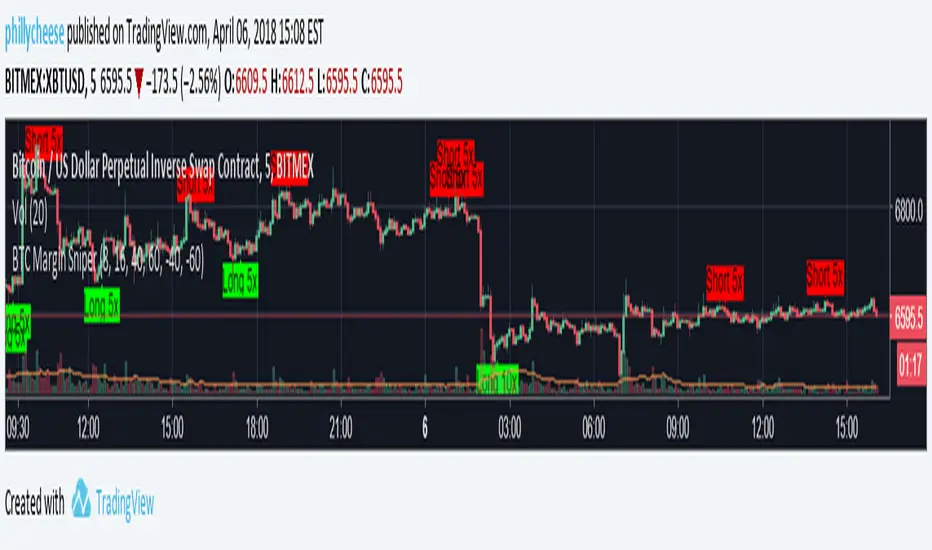
BTC Margin Sniper w/ AlertsMargin Sniper uses 2 levels for overbought and oversold to overlay possible trades on the chart. You can adjust its sensitivity by either increasing or decreasing the overbought and oversold threshold numbers. It must meet one of these levels and the short-term trend has to change direction for it to create the alert and entry on the overlay.
Increasing the overbought input makes the trigger more precise, but it may not trigger as often. Decreasing the oversold input will do the same for that trigger.
You can adjust the alerts and the overlaid position suggestions to match your preferred leverage amount.
To set an alert, click "add alert", then select this script. Choose one of the oversold or overbought alerts and enter your message.
I primarily use this on BitMEX with BTC, but you can use it with other exchanges and coins. You may have to adjust the inputs depending on the coin and the timeframe you use. Do not blindly follow this to make purchases. This is just an alert system to notify you of possible trades.
UCS Squeeze Momentum Overlay with AlertsAll credit to the great ucsgears. His original indicator is on this page:
I just remixed the visuals and added alerts when price is released from the squeeze. I find it works well on lower timeframes for Forex and Bitcoin. Suggestions for other instruments and timeframes are welcome! When adding alerts use 'On Condition' to get the fastest alerts.
Best used in conjunction with the USC_SQZ_Opt Ooscillator from this page:
Possibly useful tip: the squeeze code here is great for identifying ranging markets, and can be used with other indicators to stop alerts firing in choppy markets.

Matt's Multi-Timeframe MACD Direction AlertThe indicator monitors the direction of the Moving Average Convergence Divergence (MACD) lines on four specific timeframes: 1-hour, 15-minute, 5-minute, and 1-minute.
It only generates a signal when the MACD in all four timeframes is trending in the same direction (either all are bullish, or all are bearish). This alignment suggests a strong, synchronized market momentum from short-term scalping views up to immediate-term swing views.
Key Features:
Multi-Timeframe Confirmation: Uses TradingView's request.security() function to fetch data from different timeframes (1h, 15m, 5m, 1m), preventing the need to manually switch charts.
Visual Dashboard: A dashboard table is displayed on your chart, providing an immediate visual status (Bullish/Bearish/Neutral) for each of the four timeframes.
On-Chart Signals: The indicator plots visual shapes (green triangles for bullish alignment, red triangles for bearish alignment) directly on the sub-chart when the condition is met.
Custom Alert Integration: It includes a built-in alertcondition() function, allowing traders to set up real-time, hands-free notifications whenever a synchronized trading opportunity arises.
This tool helps filter out noise and potential false signals that might appear on a single timeframe, focusing instead on robust signals confirmed by a consensus of time perspectives.

BHUVANA Fib 50–61.8 • Turn Alerts when FIB directions change
Detects step-up / step-down on both Fib 50 & 61.8 (your “stairs” logic).
Triggers BUY/SELL on that slope change (optionally also requires price to be above/below the line).Spot volatility compression around the 50%–61.8% Fibonacci mid-band of the current swing, then trade the first expansion with clean, rules-based entries and auto SL references.
Swing mapping: Finds the active high/low over a user-defined lookback and computes Fib 50% and Fib 61.8%.
Squeeze detection: Measures the distance between 50% and 61.8%. If the band width is ≤ (ATR × multiplier), the zone is flagged as a Squeeze.
Breakout entries (on close):
Long when price crosses up through 50% while squeezed.
Short when price crosses down through 61.8% while squeezed.
Risk framework: Auto-plots stop lines from the signal bar:
Long SL = swing low; Short SL = swing high.
Visuals: Fib lines (50/61.8) + optional yellow zone highlight during squeeze.
Signals evaluate on bar close (no forward-looking data).
Works well on XAUUSD / US30 intraday (5–15m) during London/NY sessions.
Add your own alertcondition() lines if you want push alerts on Long/Short entries.

Strat 3-Bar (Outside Bar) AlertThis indicator automatically detects and alerts you when a Strat 3-Bar (Outside Bar) forms on any chart or timeframe.
An Outside Bar (3) occurs when both sides of the previous candle’s range are taken out — the high breaks above the prior bar’s high AND the low breaks below its low. It signals expansion in price discovery and potential reversals or continuations.
📈 How to Use:
1. Add this script to your chart.
2. Look for red “3” labels or triangles above outside bars.
3. To get alerts, click the TradingView alert icon (⏰):
• Condition → Strat 3-Bar (Outside Bar) Alert
• Option → “Outside Bar (3) Detected”
• Choose “Once per bar close.”
💡 Pro Tips:
- Use with Strat Assist for visual context.
- Combine with timeframe continuity for directional bias.
- Great on 15-min, 1H, and Daily charts.
---
👩🏽💻 Shared with love by Yolanda
Inspired by community discussions with Jalen (ChatGPT)
Let’s keep building each other up and mastering The Strat together! 💛
TheStrat, outsidebar, 3bar, priceaction, tradingstrategy, alert, reversal, continuation, stratassist, strat, technicalanalysis, pinev6, smartmoney

EMA Cloud + AlertsThe only EMA indicator you'll ever need.
- Flexible EMAs: Customize EMA lengths (e.g., 9, 21) to match your trading style.
- Dynamic Cloud: Auto-shades bullish (green) or bearish (red) clouds between EMAs for clear trend signals.
- Trend Change Alerts: Auto-alerts that signal when a trend change (EMA crossover) happens on the timeframe you're currently viewing.
- Timeframe Lock: Lock EMAs to a specific timeframe (e.g., 5m on a 1m chart) for consistent analysis.
- Personalized Design: Adjust EMA colors, thickness, and cloud transparency for optimal visibility.
A friendly reminder that no tool or indicator guarantees success. Integrate this into a robust trading plan.

Bollinger ALTswap Alert v1.0 (MA28 Rotation ALT↔BTC)Inspired by: Bollinger Awesome Alert R1 by JustUncleL
What is it?
BBALTSWAP overlays Bollinger Bands (20, 2), a 3-EMA, and a Rotation MA (default 28), then gives state-change alerts to rotate between ALT ↔ BTC on any ALT/BTC chart.
Core rotation rule
• Rotate → ALT when close > Bollinger middle and close > MA28.
• Rotate → BTC when close < Bollinger middle and close < MA28.
• Otherwise: Wait (no rotation).
Labels only print when the state changes (to avoid spam). You can also compute the rotation on a higher timeframe (default 4h) while viewing a lower one (e.g., 1h).
Optional extras
• Breakout arrows (scalping-style) when 3-EMA crosses the Bollinger middle with an Awesome Oscillator direction filter.
• Bollinger Squeeze coloring (relative width) to highlight expansion/contraction.
• Min bars between labels to throttle how often rotation labels appear.
Inputs (highlights)
• Use EMA for Bollinger / Rotation MA
• Bollinger length & multiplier
• AO fast/slow lengths
• Higher-timeframe selector for rotation (default 240 = 4h)
• Show breakout arrows / show “Wait” / min bars between labels
How to use (simple playbook)
1. Chart: open your ALT/BTC pair (e.g., ETHBTC).
2. Direction: leave rotation HTF at 4h for steadier signals.
3. Execution: take rotations on bar close; manage entries on your lower TF (1h/15m) if desired.
4. Override check (optional): when BTCUSDT is in a fresh breakout, prefer BTC even if ALT flashes briefly.
Alerts
Add two alerts, Once per bar close:
• “Rotate to ALT (state change)”
• “Rotate to BTC (state change)”
Notes
• Works on any ALT/BTC pair.
• The breakout arrows are optional and independent from the rotation signals.
• This tool is educational; not financial advice.
