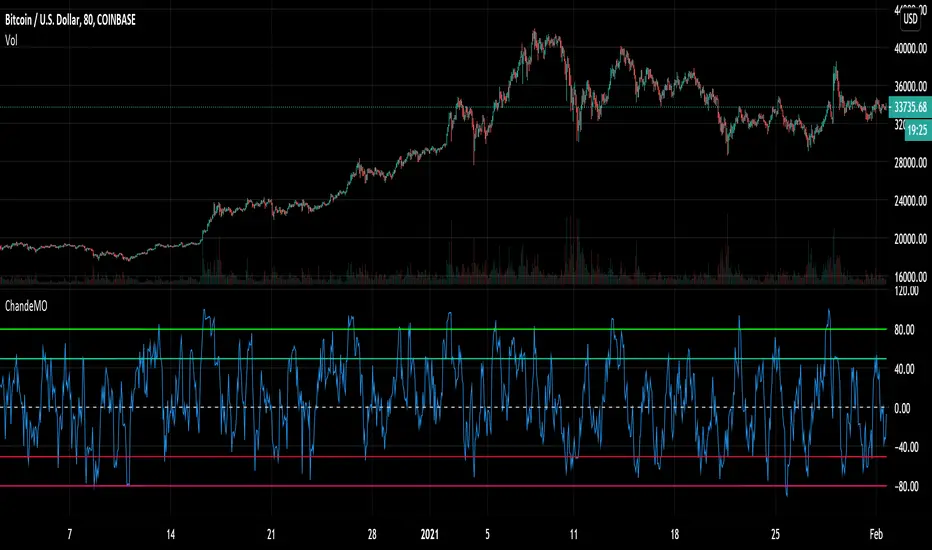
Chande Momentum Oscillator - Alerts and RegionsIt seemed weird to me that the default Chande didn't have overbought and oversold regions, despite them being described for Chande Momentum and working very well. So I added the lines and alert conditions. I've used this to very good results in my day trading.
My strategy involved 4 timeframes of candlestick, each with 4 timeframes of Chande overlaid. Candlesticks are 5 min, 20 min, 80 min, 320 min and Chandes are x1, x2, x4 and x8 of the relevant time zone. Give it a shot. Use the 5 min Chande as Buy and Sell signal with the other timeframes for trend confirmation. You may get a lot of extra alerts with this setup, but it's almost impossible to really miss an opportunity if you use it right. It will take up all your free time though, as a warning. Using this strat made me go crazy.
Use the chande crossing over the lines as the signal, not just being in the region, as that will make you buy early.
Cari dalam skrip untuk "alert"
Modified Smoothed Heiken AshiThis code is based on Smoothed HA candle which will work on all chart types
condition for BUY:
1. When close crosses Smoothed HA
2.Close should be in side upper band
3.BBW must be greater than the average
vice versa for sell
this code takes data from HA chart so that it can be applied on all chart type.
Bollinger band and Bollinger band width conditions added for removal of unwanted signals
Alert added so that you can apply alert and check it in real time performance
thanks to The Secret Mindset You tube channel from where I got the idea to convert this into a pine script indicator
smooth HA taken from "Smoothed Heiken Ashi Candles v1" at //@jackvmk

Williams Fractals with Alerts by MrTuanDoanCustom William Fractals for alerts and educational purpose.
Added custom alerts for Williams Fractals.
Also added filter to show less fractals on chart.
The simple idea how I use fractals in Binary Option is to determine temporary resistance and support.
Simple strategy:
- Mark Resistance/Support on higher time frame (e.g. 5M)
- Set an alert for new fractal
- Whenever a new fractal that appears close to your marked Resistance/Support, go to lower time frame (e.g. 1M)
- Wait for rejection at the level that lower than new down fractal (or higher than new up fractal).
- Enter with the same expiry of lower time frame.
Good luck and happy trading. :-)

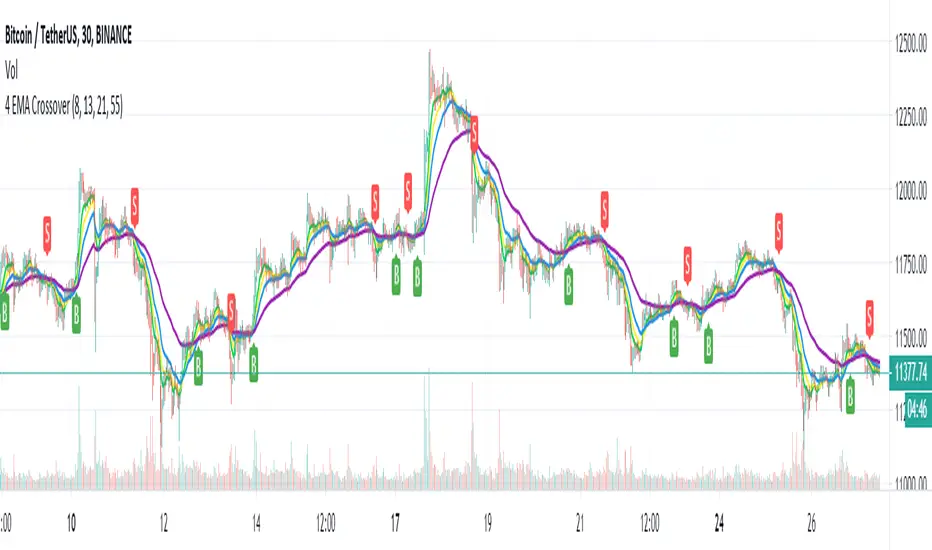
4 EMA Crossover w/alerts4 EMA crossover visualized (buy/sell) w/ alerts.
Personally I use 8, 13, 21 & 55 for LTF's and 21, 55, 100 & 200 for HTF's
[A618] Vortex Indicator Alert Screener [Noise Filtered]This Indicator helps you get alerts from Vortex Indicator if a trend is Established.
One of my followers asked me to do this: @Kiran_05
How this is made ?
1. Vortex Crossovers are taken into consideration in a noise filtered manner
2. Noise filtering is done by trend establishment due to Ehlers 2 pole ButterWorth Filter and EMA50 Crosses
How to use it ?
1. Can be used as a screener on the Script to generate the screened Securities from a Watchlist of Securities
2. Wait for a Candle break above of the generate green signal to get into trade, and vice versa
Credits :
@CheatCountry
For Ehlers 2 Pole Butterworth Filter V2
Hope this Helps

Ehler Stochastic Cyber Cycle Signals/AlertsThis script works based on @everget's version of Ehler Stochastic Cyber Cycle. Unlike @everget's work, my adaptation prints only crossovers into the chart that occur above or below the overbought/oversold zone.
You can find @everget's script with all related documentation here
I didn't change the calculation, I only reinvented how it is presented on the chart and added alerts.

QQE signalsConverted the QQE oscillator to in-chart long and short signals with built in alerts. This is multi-timeframe and quite robust.

Growing or Waning Patterns [Alerts]Example how to color patterns of 3 bodies growing or waning by percentage with or without trend. Also included option for alert triggers. The yellow triangles on the chart denote where the alert triggers will fire.
• Choose Pattern Of Filter: shows bodies growing or waning or both.
• Sample Lengths Of AvgBar: number of recent bars to use for average size.
• BigBar Is Min% Of AvgBar: the minimum percent of average the big bar must be.
• MedBar Is Max% Of BigBar: the maximum percent of big bar the medium bar can be.
• SmlBar Is Max% Of MedBar: the maximum percent of medium bar the small bar can be.
• Repeat Pattern If n Bars: the number of bars to ignore repeat patterns, 1 allows all.
• Trending: on requires the growing or waning patterns to also be trending.
• GrayBars: colors non pattern bodies gray.
NOTICE: This is an example script and not meant to be used as an actual strategy. By using this script or any portion thereof, you acknowledge that you have read and understood that this is for research purposes only and I am not responsible for any financial losses you may incur by using this script!

Volume on Candles + Alerts [xdecow]Volume-based candle colors with alerts.
5 threshold levels:
-Extra High (red)
-High (orange)
-Medium (yellow)
-Normal (white)
-Low (aqua)
Multi Timeframe ADX and DI w/ AlertsThis script is based off the public DMI code and used to get a quick visual of trend and direction across 3 different timeframes. Alert conditions have been setup for trend changes to bull/bear for all 3 timeframes. This script is meant to pull together the concepts of multi-time frame indicators, custom functions, and custom alert conditions.
The primary instructions for this script was to find a version of the ADX Indicator and give it the same treatment as we did with the Heiken Ashi demo (displaying green/red/gray circles to indicate trend and direction) over a configurable time frame. Display a matrix of each timeframe and the corresponding directional color (green=bull, red=bear, gray=non-trending). Have it produce an alert when the state of indicator changes to either bull or bear.

Study for Squeeze Momentum Indicator [LazyBear]This study is based on LazyBear Squeeze Momentum Indicator and my strategy developed using it.
I added some custom feature and filters.
Main improvements are:
1- study is updated to version 4 of pine script;
2- I added alerts for entry rules and exit rules.
3- Alert syntax can be customized for webhooks: I added one example only for long entry.
You can customize a lot of features to get a profitable strategy.
Here is a link to original study.
Please use comment section for any feedback.

MFI/RSIThis is a simple study that combines MFI and RSI and provides buy/sell alerts.
The red lines are MFI.
the blue lines are RSI.
Boundries are colored as the indicators and are user configurable.
Black triabgles are buy/sell points when both MFI and RSI are overbought/sold.

Moving Average Cross AlertMoving Average Cross Alert, Multi-Timeframe Option (MTF) (by ChartArt) with buy sell alerts added
Significant PP - Swing Failure / Stop Run Alerts [QN]Tried to create a script for Swing Failure / Stop Run patterns. It is based on my QuantNomad - "Significant Pivot Reversal" Indicator.
It's quite tricky to code these kinds of patterns, so it's really not ideal. I alert when a candle cross pivot level but close below (above for bottom) it and previous close was below (above) it as well.
You can setup params for pivot points and also by how much it should cross pivot level with "SF ATR Mult".
I have in mind a few other things I'd like to test:
* Different types of pivot points
* Few recent pivot levels at once
* Pivots from higher timeframe
* Different types of "touching" levels
* etc.
Ideally, I want to create a strategy from it, but I'm far from it for now.
Do you have any ideas on how to make it better?
Original Significant Pivot Reversal Indicator:

EMA20 MA50 MA200 + T3-CCIEMA20 MA50 MA200 + T3-CCI
This combination of triple Moving Average and CCI is a strategy to be used in conjunction with Harmonical Patterns and Fibonacci Rations .
Heikin Ashi price can be used as the price source for the Moving Averages and the T3-CCI, instead of the real price.
Two instances of the indicator can be spawned to have both the triple MAs and the T3-CCI on the chart (L-Click on the Indicator > Move To > New Pane Below).
Alerts are available to warn of possible opportunities in the markets .
A single alert that can fire on both conditions can be set. It can also be used by other indicators, such as the Risk Management Wrapper .
Additional Technical Analysis is required to confirm the signals before opening a position.
This indicator is an update to MA50 EMA20 MA200 .

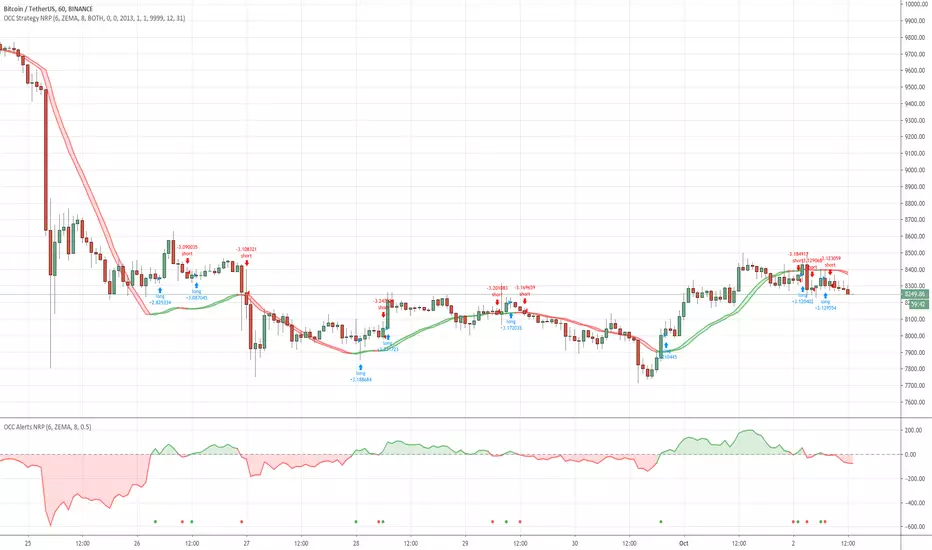
Open Close Cross Alerts NoRepaint Version by JustUncleLThis is a Non Repaint version of my ever popular "Open Close Cross Alert R6 by JustUncleL" and is normally used in conjunction with my strategy script "Open Close Cross Strategy NoRepaint Version by JustUncleL", to provide alerts for the TradingView Alarm subsystem.
Brandon BollSecond day at Pinescript and I am attempting to tweak the Bollinger Bands directed strategy to send alerts to Zignaly in order to automate long buy/sells.
I've left in the short script though for completeness.
The buy and sell instructions work perfectly but I don't know how to do a cancel order alert (as included in the original strategy)

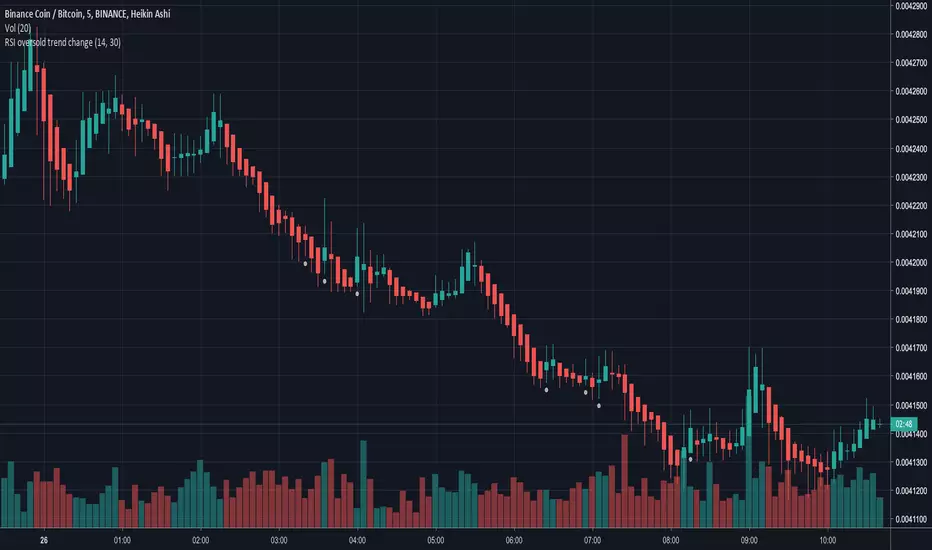
RSI oversold trend changeSimple script that will plot a circle indication on the chart when RSI returns above 30 from oversold position.
Also allows you to create a custom alert.
RSI Divergence UltimateHere it is Everyone - What was once hidden is now revealed
This is the Ultimate RSI Divergence Indicator
Not only does it plot Regular and Hidden Divergence lines for an RSI smoothed by an EMA and for its Signal Line
The RSI can be set to change color with direction or can be set as single color with or with out OB / OS highlights
Color Changing RSI helps when trading Multiple Time Frames as you can look for confluence in the direction of RSI
Included options for the Signal Line include;
Various calculations EMA, SMA and Linear Regression which provides very accurate signal line crossover signals
Color Changing with direction
Second RSI with different Length
Multi Time Frame RSI
Bollinger Bands applied to the RSI
RSI Stochastic that has been compressed to fit into RSI OB / OS so that it doesnt compress the RSI when in these regions
There are also Background Highlights (thanks to Chris Moody) for when the RSI Stochastic moves into OB / OS and crosses its signal line
There are plenty of Alerts for signals with more complex alerts coming soon
I have also added Hima Reddy's Power Zones for support and resistance so now you can also
Take full advantage of trading; signal line crosses, 50 crosses and Power Zone RSI support and resistance and much more
The divergence script is thanks to @RicardoSantos, I've just adjusted it to suite my indicator
Remember that divergences work best when traded with the trend or very late in a trend when going against the trend

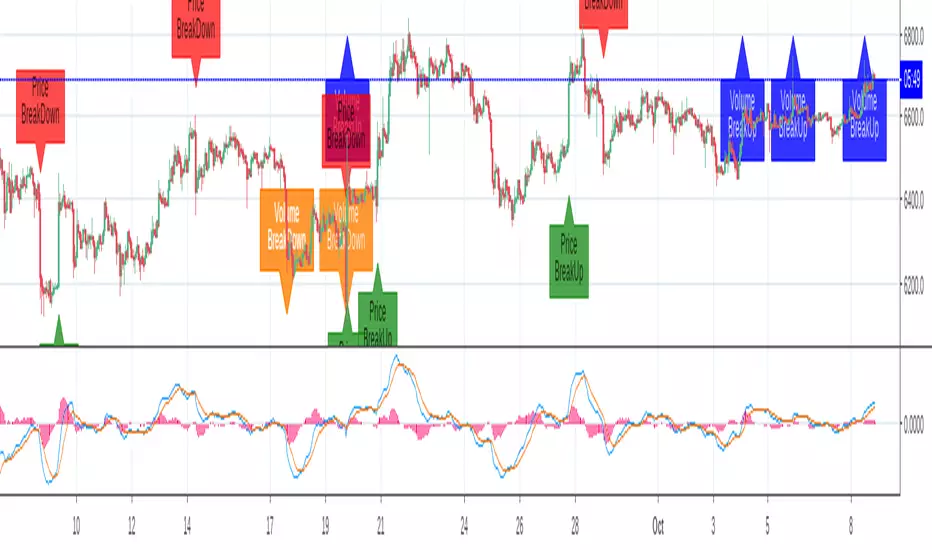
Breakout Labels and Alert For Price And VolumeThe indicator is developped for bitcoin and other cryptocurrencies, whose price and volume changes heavily within minutes. For the other Asset Classes, you may need to adjust the parameters.
Benefits:
1. Since a breakout of price or volume often means the start of a trend, this indicator alerts and displays a label when there is a breakout in price or volume.
2. The indicator prints labels on the chart, which helps people to study the relationship between a breakout and the trend.
3. The volume change is compared to a SMA of volume, instead of the last bar, which can reflect the change compared to a certain period.
4. You can set an alert for breakouts of both price and volume, instead of do it two times.
Settings:
SMA Length for volume: is the length to calculator volume SMA, default:108.
Toggle on/off to display or hide labels for price or volume breakout.
Customize the alert threshhold for price or volume breakout in different time period:3m,5m,15m,30m,60m and other
Use percentageGapForSlopeshape to adjust the relative position of labels.
Style - color settings: Orange for Volume Down, Blue for Volume Up, Red for Price Down, Green for Price Up.
Renko CandlesticksRenko charts are awesome . They reduce noise by only painting a brick on the chart when price moves by a specified amount up/down. When the price reverses, it must go twice the specified amount before a brick is painted. Time is not a factor, just price movement. Sometimes however, you want the pros of a renko chart, but on a regular candlestick chart. This indicator attempts to do just that.
A band is placed around price action showing the upper and lower bounds of what would be the current renko brick. The band only goes up/down when the price action itself moves up/down by the amount you specify. There are several ways of specifying the amount:
Fixed Price Amount: As the name says, you enter the brick size amount, i.e. the amount the price has to move before being in a new brick.
% of Price: This method will calculate the amount the price has to move as a percentage of the price itself. This way as price goes up/down, your brick size will adjust accordingly. Recommended values would be around 1% or less.
% of ATR: This option will make the brick size a percentage of the Average True Range. You can specify the ATR time frame to be different from your current time frame as well as the ATR length. For instance you could be on a 10 minute chart but specify the ATR to be daily with a length of 3 and a percentage amount of 15. This would make your brick size 15% of the Average True Range for the last 3 days. Recommended values are 10 to 20%.
Use this indicator on any time frame, even the 1 minute as the renko bands span the price action the same way on any time frame easily letting you know whether or not the price has moved appreciably, regardless of how much time has passed.
You can also set alerts easily, simply set the alert to crossing and choose “Renko Candlesticks” instead of “Value”. You will then see the options for the renko upper and lower bounds.
Tested on Bitcoin with the following values:
Fixed Price Amount: 30 ($30)
% of Price: 0.45 (if Bitcoin is $7000 then the brick size would be $31.50)
% of ATR: 15%, ATR Time Frame: 1D, ATR Length: 3 (3 days)

lamBOTghini-ALERTador & SL/TP V3I publish the code again in case someone is interested in learning. I am not an expert, I learned from others who published their scripts and for this reason I do the same.
If someone tries to sell you a script it is because they do not make money with it in trading and they need to sell it to earn something.
It is a simple combination algorithm of 3 EMA with stop loss and Take profit and with alerts.
Enjoy!
¡Mucho ánimo a los Venezolanos!
¡Saludos desde España!

[STUDY]HullMA OCC & SL/TP V3Another Open Close Cross. Now with Hull Moving Average: Alerts, SL TP, ...
Best results at 4h.
Enjoy!
