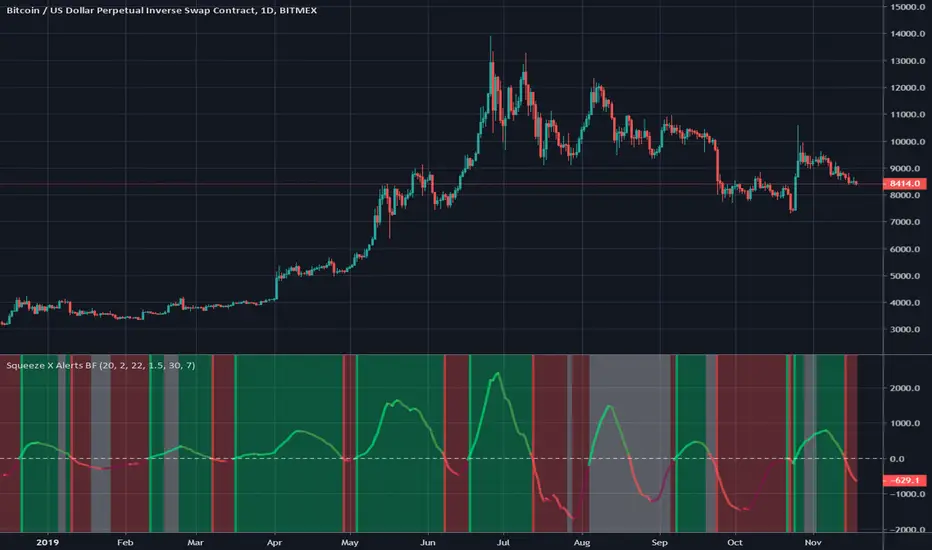
Squeeze X Alerts BFThis is an alerts script for my Squeeze X strategy .
The default settings are the same. The alerts are based on the long and short signals that occur upon a cross of the momentum line to the positive or negative respectively.
Green background is bullish, red is bearish. Bright green lines indicate a long signal, bright red a short signal.
White background means no trade since we are in a period of choppy/sideways price action.
It can be useful to use momentum as a divergence indicator against price as an aside.
Cari dalam skrip untuk "alert"
QQE Cross v6.0 by JustUncleL w-Long-Short Alerts by sscoginThis script provides long and short alerts along with take profit alerts for either long or short positions. Based on the MA color changes set up originally in the script by JustUncleL.

CONSENSIO 3 MA ALERTThis Alert Indicator is based on the Consensio Trading System, Created by an Amazing Man; The Late Tyler Jenks.
The Consensio Investing and trading System was Designed to find and Scale Entry & Exit points within an Asset, with Preserving Capital, and with getting "90% of the Cookie" ... as Tyler would say.
For a Basic Introduction to Consensio, Please Visit the Hyperwave Youtube Channel, and View the Archived Video's. www.youtube.com
For a more in depth understanding of Consensio, consider Purchasing the Introduction and Advanced Consensio Webinars. lucidinvestmentstrategies.com
Thank you Tyler, for generously sharing your Extensive knowledge with Investing and Trading, and for Creating an Amazing Community of People from around the Globe, who Continue to bring your Knowledge and Life's Work forward, for Future Generations to Learn.
...This Script, once loaded, can be Edited and re saved within the Script Editor, to Change the Alert Signal Wording.

QuantNomad - Pivot Points AlertsVery simple scripts that will allow you to receive alerts for new Pivot Lows/Highs Points.
A solid arrow points to actual point low/high point, transparent - to the bar, you'll receive alerts for (Shifter by rightBars).
And remember:
Past performance does not guarantee future results.

Dragon Bot - Default ScriptDragon Script is a framework to make it as easy as possible to test your own strategies and set alerts for external execution bots.
The script has many features build in, like:
1) A ping/pong mechanism between longs and shorts
2) A stop-loss
3) Trailing Stops with several ways to calculate them.
4) 2 different ways to flip from long to short.
The script is divided into several parts.
The first part of the script is used to set all the variables. You should normally never change the first part except for the comments at the top.
The second part of the script is the part where you initialise all your indicators. Several indicators can be found on Tradingview and on other sites. Please keep in mind that all the variable names used in the indicator should be unique. (all the … = … parts)
The third part of the script, is the most important part of the script. Here you can create the entry and exit points.
Let’s look at the OPENLONG function to explain this part: The first variables are all the possible entries; These are longentry1 till longentry5. You can add many more if you like.
The variables are all initialised as being false. This way the script can set a value to true if an entry happens.
The if function is the actual logic: You could say “if this is true” then (the line below the if function) longentry1 := (becomes) true.
In this case we have said: “if this is true” then (the line below the if function) longentry1 := (becomes) true when the current close is larger than the close that is 1 back.
The last part is the makelong_funct. This part says that if any of the entries are true, the whole function is true.
The last part of the script is the actual execution. Here the alerts are plotted and the back test strategies are opened and closed.
We hope you guys like it and all feedback is welcome!


Steroid CCI w/ Overbought & Oversold Alert//@version=2
//By Tantamount
//Channel Commodity Index (CCI) with overbought and oversold alert features! Highly configurable indicator that includes a Topography map feature, used to detect & show minute threshold crosses.
//CCI is a momentum based technical trading tool used to help determine when an asset is reaching an overbought or oversold condition and is an great alternative to RSI.
//This CCI tool comes loaded with features and is easily configurable back to standard CCI or with your own preferences.
Customize to your liking:
Simple alert signals
The full enchilada, with Topo map view!
Stand alone CCI oscillator

Inside Bar Alert I need help!!! I created the alert but it triggering during the formation not once it has printed. Does anyone know who to make it trigger the alert once the inside bar is complete and make it plot an arrow when the inside bar has formed?

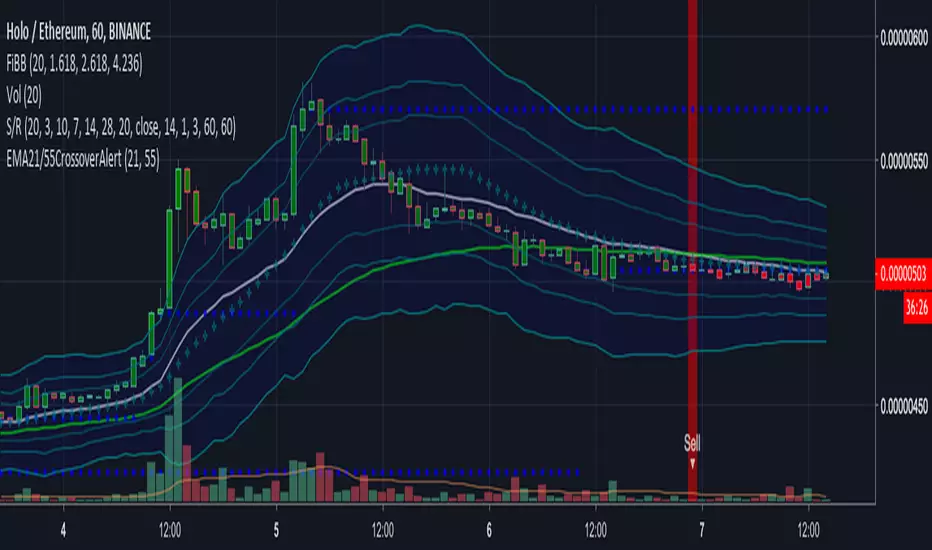
EMA21/55 Crossover AlertThis will alert on EMA crossovers. Alert for 21 crossover and crossunder. Work in progress.
Tenkan Kijun Cross Alert Modified to alert on EqualsI wanted it to alert on equals not only on crossover

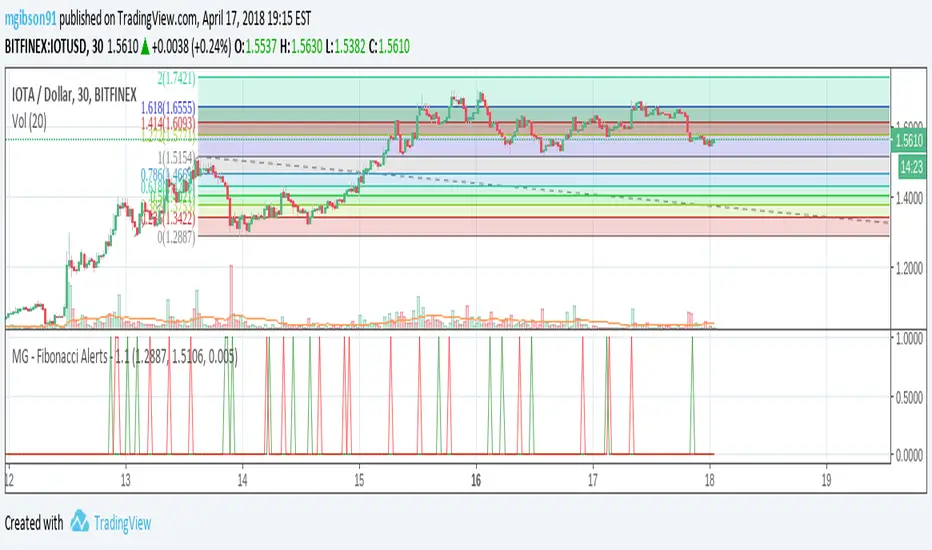
MG - Fibonacci Alerts - 1.1Updated version of
Allows users to receive alerts when price reach a new Fibonacci level.
By default, the Fibonacci levels extend upwards. This can be changed to extend downwards by unchecking 'Extend Upwards' option.
Usage:
- Perform a Fib extension analysis and determine a high value, low value and direction of extension
- Add indicator and specify these values
- Optionally, to view the levels used by the indicator on the main chart, copy the indicator source and:
- Set overlayed = true
- Set highPrice and lowPrice to your determined values (optional, but will save re-entering them later)
- Add to chart
- This will show you the exact levels used by the indicator
- Set overlayed = false
- Remove and re-add the indicator
Kozlod - Pivot Reversal Strategy Alerts V2Its' new version of previously published Kozlod - Pivot Reversal Strategy Alerts
Indicator now better correspond to original strategy. However, there can be some differences. Problem is that it's pretty tricky to implement in plain PineScript same "stop" logic used in strategy.entry of the original script

Bar Close Audio AlertAdd script to chart
Create Alert
Condition: Close/Greater Than/Value/0.0
Frequency: Once on Bar Close
Alert Action: Play Sound
Hide close on chart in Objects Tree if preferred.
Many thanks to tranzium for creating code.

DTS Momentum Dot Plot (Stoch / RSI) + AlertsThis comes from Treyding Stocks Famous Dot Plot, but for think or swim. When the green and red dots align, then it is a good opportunity for a buy or sell. It is the Fast Stochastic,the slow stochastic and the RSI, there is another version with the MACD but I liked this one!
You can also add alerts when all lines turn green or red!
Enjoy!

Touch/Overlap Alert (12M/6M/3M/1M)Wick or price action connection...This indicator is to alert you when price action connects for an entry.

Auto Liquidity Sweep Trendlines With BuySell alerts By V JhaThis automatic trendline system gives buy and sell alerts as well. But you must choose to buy at bottom and sell at top, or in tune with high time frame. This works perfect when used in alignment with HTF.
Points used to draw these trendlines are not ordinary wicks, rather they are liquidity points of huge importance. This trendline system removes any need for mannual tredline drawing.


Ichimoku MTF Heatmap WITH ALERT meeting D and W conditionsThis is a version of the Ichimoku Cloud Heatmap but adds a can't miss alert when it meets Daily and Weekly conditions. The cloud metric is still being refined and the qualifier is ignoring just the cloud for now. As of 12/21/2025 GLD is meeting the conditions to set this flag.


Custom ORB (Adjustable Time + Alerts)Opening range Breakout for the current day only. Time frame and be adjusted for first 15 min, 30 min, e.g., 9:30 am to 9:45 am or to 10 am, etc. You can add price alerts for high and low. You can also change the color of solid lines.

Entry / TP / SL Alert Bands (Simple & Stable)
Get an alert before you reach your take profit or stop loss. Set as a percentage over the distance to your stop loss and take profit and improve your Money Management

NQ 300+ Point Day Checklist (Bias + Alerts + Markers)This indicator helps identify high-range (≥300-point) days on Nasdaq-100 futures (NQ / MNQ) using a clear, rule-based checklist.
It evaluates volatility, compression, price displacement, prior-day structure, and overnight activity to generate a daily expansion score (0–6). Higher scores signal an increased likelihood of a strong trending or expansion day.
The script also provides:
Expansion probability levels (Normal / Watch / High-Prob)
Bullish, bearish, or neutral bias
On-chart markers and background highlights
Optional alerts for early awareness
Best used on the Daily timeframe to help traders focus on high-opportunity days and avoid overtrading during consolidation.
This is a context and probability tool — not a trade signal.

MTF Bias Alert SystemMulti-Time-Frame Bias Alert System
include HTF BIAS and any Time Frame Confluence
