RePaNoCHa V4 [Alerts]Script for automatic trading with Alerts.
LG --> Long (green: not confirmed) (lime: confirmed)
ST --> Short (maroon: not confirmed) (red: confirmed)
TS --> Trailing Stop
xL --> Close Long Position
xS --> Close Short Position
SL --> Stop Loss
The trailing stop closes the trade if the price changes direction by a specified percentage or offset. There is no ideal distance because markets and price are always changing and we know that is impossible to exit on the top or bottom. This script interpolate the trailing Stop Offset with profit, higher profit --> higher Trailing Stop Offset. Despite this, it's difficult to catch the price but not impossible. It has a TS delay too. It take a snapshot every X seconds, if the TS is activated the alert is triggered, otherwise the price keeps fluctuating until a new snapshot.
It can be easily converted to Backtest. Just delete "//" on the corresponding part.
Default settings for XBT:USD at 1H.
Cari dalam skrip untuk "alert"

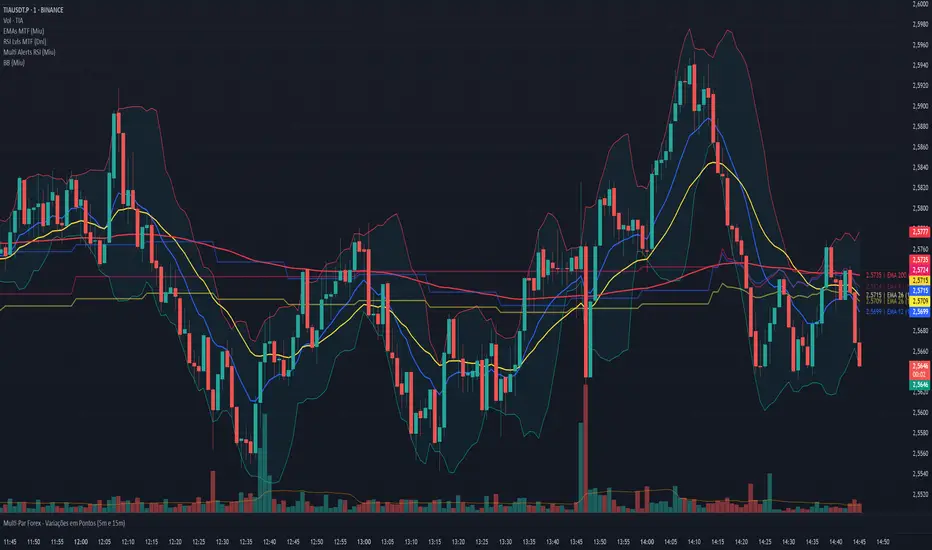
Bollinger Bands - Multi Symbol Alert (Miu)This script extends the classic Bollinger Bands indicator with support for up to 8 user-defined symbols and a unique alert system.
Unlike traditional Bollinger Band indicators, it allows traders to configure alerts across multiple assets without keeping the indicator visible on the chart, making it ideal for passive multi-asset monitoring.
What it does:
This script calculates Bollinger Bands using a 100-period simple moving average and a standard deviation multiplier of 3 (or any input you set in the settings panel).
For each selected symbol, the upper and lower bands are retrieved using request.security() and monitored for breakouts.
Alerts are triggered when the closing price of the selected symbol breaks above the upper band (Overbought) or below the lower band (Oversold) — at the bar close.
How to use it:
1) Add the indicator to your chart.
2) Open the settings panel.
3) Select up to 8 symbols to monitor.
4) After setting parameters, click the three dots next to the indicator title and choose "Add Alert on...".
5) Name your alert and confirm.
6) If you don’t wish to keep the indicator visible, you can remove it from the chart — alerts will still function as expected.
Alert message includes:
- Symbol name (e.g., BTC, ETH, LTC)
- (OB) for overbought or (OS) for oversold
- Symbol’s price at the alert moment
Technical note:
This script uses request.security() to fetch Bollinger Band levels and closing prices from up to 8 selected symbols in real time.
Feel free to leave your feedback or suggestions in the comments section below.
Enjoy!
Price alert multi symbols (Miu)This indicator won't plot anything to the chart.
Please follow steps below to set your alarms based on multiple symbols' prices:
1) Add indicator to the chart
2) Go to settings
3) Check symbols you want to receive alerts (choose up to 8 different symbols)
4) Set price for each symbol
5) Once all is set go back to the chart and click on 3 dots to set alert in this indicator, rename your alert and confirm
6) You can remove indicator after alert is set and it'll keep working as expected
What does this indicator do?
This indicator will generate alerts based on following conditions:
- If price set is met for any symbol
Once condition is met it will send an alert with the following information:
- Symbol name (e.g: BTC, ETH, LTC)
- Price reached
This script requests current price for each symbol through request.security() built-in function. It also requests amount of digits (mintick) for each symbol to send alerts with correct value.
This script was developed to attend a demand from a comment in other published script.
Feel free to give feedbacks on comments section below.
Enjoy!
Scalp Pump-Dump Detector with AlertsThis script displays the percentage of movement of all candles on the chart, as well as identifying abnormal movements to which you can attach alerts. An abnormal movement is considered a rise or fall that exceeds the parameter set in the settings (by default, 1% per 1 bar).
Added a function to display the volume on abnormal candlesticks.

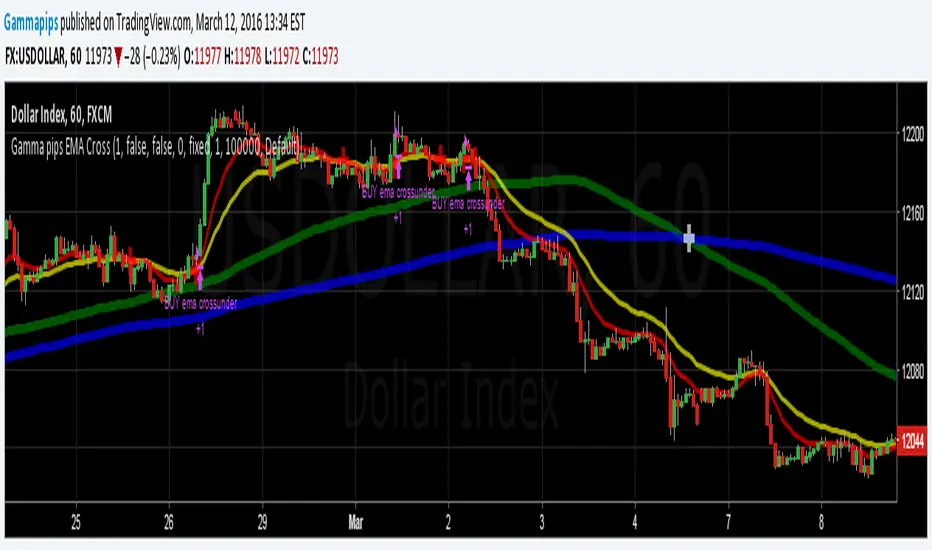
Moving Averages With Cross AlertsA simple way to add up to 5 moving averages with optional crossover/crossunder alerts.
Available options for Moving Average Type are:
SMA
EMA (default)
HMA
RMA
WMA
VWMA
VWAP
ALMA
By default, 5 moving averages are enabled and set to the following:
MA1 set to 5
MA2 set to 13
MA3 set to 50
MA4 set to 200
MA5 set to 800
Each moving average has the following options:
Enable/Disable
Source (default is close)
Length
Color
SuperTrend - Custom Screener and Dynamic AlertsTrading View today published a desktop Bad Internet connection indicator ?! which set me thinking…
Despite recently introduced Dynamic Alerts many scripts do not leverage the information available for active traders and traders on the GO!
So decided to share this script totally ALERT focused on one of the most popular DAY trading indicators.
Of course no more BAD internet problem as long your TV APP is configured , you will have enough data for a mental picture of the chart..
The Alerts give you the BAR Close , %percent gain or loss over previous day CLOSE ++ Previous Day High and Low to effectively plan your trade without a chart!(just in case)
2 additions in the way Alerts are delivered over the last script :
1. You get SUMMARY alerts or concatenated alerts by default , however if you uncomment or activate code lines 48 and 55 you will get individual Stock alerts Too!
2. Summary Alerts will come only if there is some Buy or Sell signal NO more empty Alerts!
Few useful EXTRAS in the code :
1. Flexible code can convert any indicator to screener or Alert function.
2. You will NOT get Mutable Variable error while converting any indicator to screener as long as the function is in "GLOBAL" scope..
3. Many Custom Screeners are available but few give OHLC data in output so easily…and very difficult for traders to MODIFY hundreds of lines of code..
4. For UP or DOWN on SCREEN Stock monitoring copy /paste functions in line 41 and 42 in lieu of CROSS functions in 44 and 51 respectively..
5. You can also uncomment/activate lines 66 and 67 for labels in monitoring.
6. The default mode of the scripts is set to Alerts!
Max Stocks only 20!
Finally idea is to help traders to use the great features that TV works so hard to create and constantly improvise.
Enjoy Profitable Trading on the Fly !!

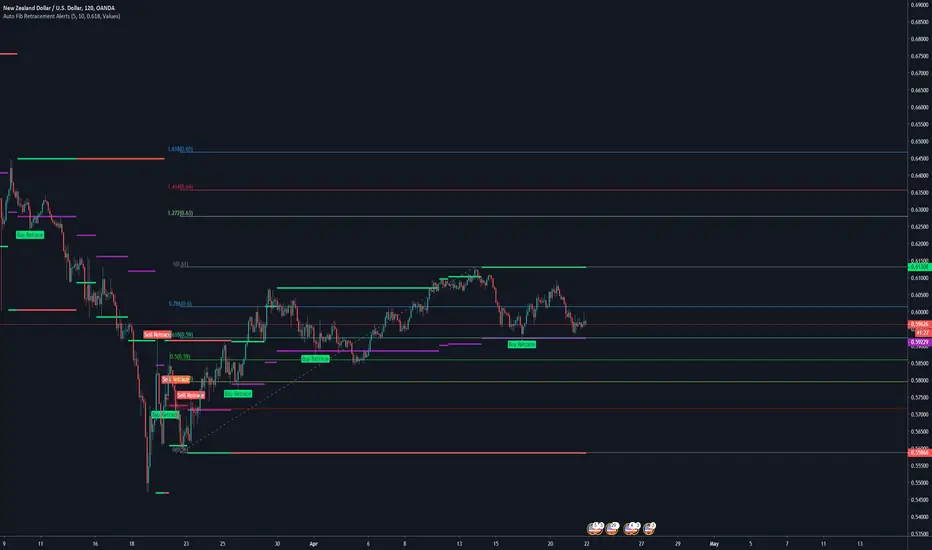
Auto Fib Retracement AlertsFor the fibonacci traders.
The Auto Fib Retracement Is a good indicator for tradingview to show you the current alerts and points to watch in the market
IMPORTANT SETTING => Retracement
This controls your alert levels
I have modified it to deliver the following
+Custom Fib retracement level alerts
+Drawing of old levels and retracement levels
+Backtesting Old Alerts
There are two shapes drawn on the chart;
Shown When the fib end is attained and market retraces back to your level
1. Buy retracement -
2. Sell retracement
How are they detected?
When we have new levels in the market; this is when the red or gree line changes, we calculate the new fib level that we will be watching for retracement
This is the purple level drawn on the chart
When the market first crosses below or above this level, The alert will be fired.
Consequent crosses are not updated
Enjoy! 😍
Originally requested by trade atechproduction
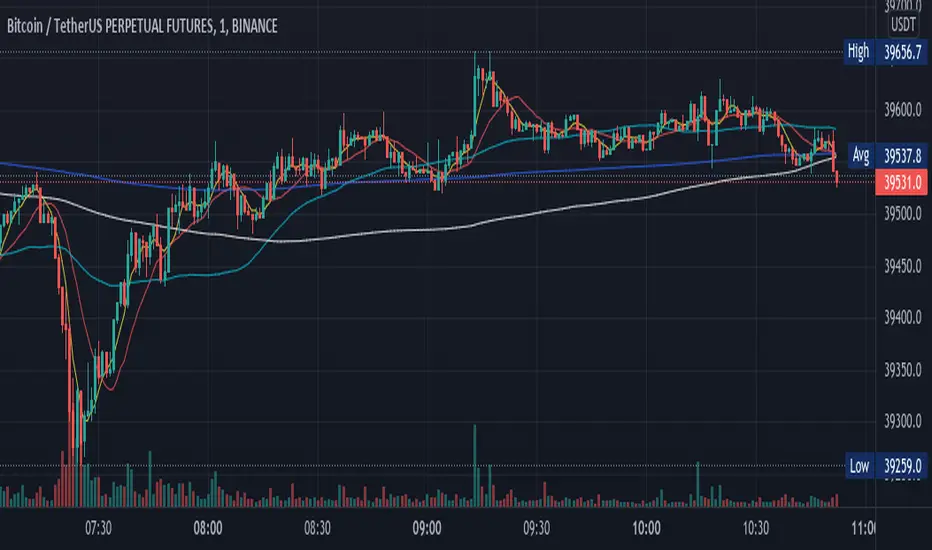
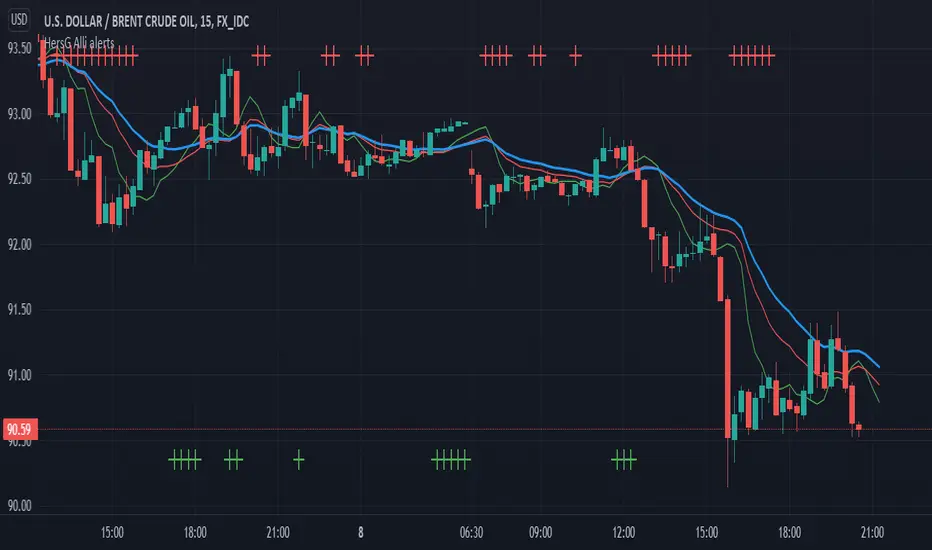
ATR+VWAP Alert//These signals mostly consist of crossovers between a 13 VWMA and a 62 VWMA. I've found these two moving averages to be quite special in their ability to
//recognize a quick trend using volume data. The VWAP is used in the alert system as well, to give some perspective on which direction we are looking to take. We
//are also using ATR. We only take trades when the ATR is on the move, meaning we have a chance to catch a volatile move! Finally, we use RSI to help weed out bad
//trades. We only take 'longs' with bullish readings from RSI, and we only take 'shorts' with bearish readings from RSI. These alerts are fantastic for catching quick intraday
//trades in either direction. I recommend using a small 'take profit' target rather than using an exit indicator. These trades can move 20-30 pips and reverse just as quickly. Good luck!
//How To Use:
//When the alert system is added to the chart, you will notice up/down symbols appear at various locations. For bullish alerts, right click an 'Up' symbol and choose 'Add Alert on VWap & ATR..'
//There are two condition options. 'Long/short', and right below that 'Buy-Signal/Sell-Signal'. Choose 'long' and 'Buy-Signal'. At options, choose 'Once Per Bar Close'. Design your alert, and you're good to go.
//For bearish signals, find a 'down' signal on the chart. Right click and follow the same process, except choosing 'short/Sell-Signal' conditions.
Tips:
Use VWAP as a stop-loss. If a candle closes below/above the VWAP in the direction against you.. get out of the trade. The losses will be minimal and few compared to the wins. Use discretion and trade carefully. This works great with crypto. Invent your own exit. If you come up with a clever exit, please share!
You can contact me at my Discord!
discord.gg

MA Cross - ***Programmers*** Please help with alertcondition() Hello Traders and coders,
Here is a fundamental version of a moving average cross trading strategy that works on 1H and 4H timeframes.
It's very simple and would be well paired with proper technical analysis and risk management.
I am looking to use this to alert me of potential setups. I could not get the alertcondition function to work properly. If anyone can help me with that please comment or message me.
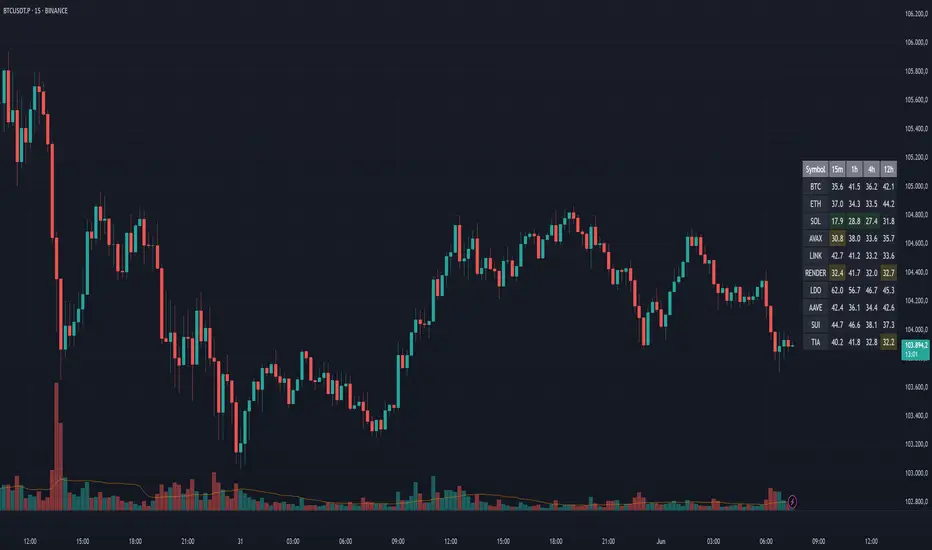
RSI Multi Alerts MTFThis indicator won't plot anything to the chart.
Please follow steps below to set your alarms based on RSI oversold and overbought levels:
1) Add indicator to the chart
2) Go to settings
3) Choose up to 8 different symbols to get alert notification
4) Choose up to 4 different timeframes
5) Set overbought and oversold levels
6) Once all is set go back to the chart and click on 3 dots to set alert in this indicator, rename your alert and confirm
7) You can remove indicator after alert is set and it'll keep working as expected
What is does:
This indicator will generate alerts based on symbols, timeframes and RSI levels settings.
It will consider overbought and oversold levels to alert in each symbol and each timeframe selected. Once these levels are achieved it will send an alert with the following information:
- Symbol name (BTC, ETH, LTC)
- Specific RSI level achieved (e.g: RSI 30, RSI 70 or any custom level)
- Timeframe (e.g: 5m, 1h, 1D)
- Current symbol price
This script will request RSI OB/OS information through request.security() function from all different symbols and timeframes settings. It also requests symbols' price (close).
Due to Tradingview limitation (40 requests calls) it can only request information for 8 symbols for this script (8 symbols X 4 timeframes = 32 + 8 symbols' price (close) = 40)
Standard symbols are Binance USDT-M Futures but you can choose any symbol from Tradingview.
Standard timeframes are 5m|15m|1h|4h but you can choose from a list.
Standard overbought and oversold levels are 70 and 30 but you can change it to other integer values.
Feel free to give feedbacks on comments section below.
Enjoy!
Alligator: Three signals confirmation with AlertsHello Trading Viewers,
The following is the William’s Alligator indicator with alerts indicating strong momentum, it can be used for scalping in lower time-frames or just riding the momentum in 1hr or 4hrs charts.
Input choices are:
1. Source of Data: Open, Low, High, Close, HL2, HLC3 and so on.
2. Simple and Exponential are the two choices of moving averages.
3. Lips, Teeth and Jaws input numbers are Fibonacci numbers with offsets from -4 to +4.
4. Up Momentum and Down Momentum signals will be plotted top and bottom of the charts respectively when conditions are met.
Idea used to confirm strong momentum
When (High + Low / 2) price is greater than Alligator’s Lips, Teeth, and Jaws, it is considered as a good time to go long; however, to strengthen the idea, the up-momentum condition needs to be approved three times consecutively. (Three consecutive candle bars should remain above Lips, Teeth, and Jaws to trigger an alert signal and plot Up- momentum shape on the charts)
The same idea with down-momentum, but the condition (High + Low / 2) price should be less than Alligator’s Lips, Teeth, and Jaws.
There is an alert set-up, once strong momentum is spotted it will send an alert once per bar close. You can relax and run an errand when the alert is not triggered.
Happy Trading!
Relative Volume RVOL AlertsRelative Volume or RVOL is an indicator used to help determine the amount of volume change over a given period of time.
It is often used to help traders determine how in-play a ticker is.
General rule of thumb is the higher the RVOL, the more in play a stock is.
I myself like to use it as a substitute of the volume indicator itself.
Basic Calculation:
Relative Volume = Current Volume / Average Volume
Crossover Signals:
Any time there is a volume spike which causes a crossover of the user set 'Smoothed Moving Average' or 'Threshold' a green/red dot will appear at the top. The color of the dot is dependent on closing of the candle. Therefore it does not necessarily mean price will continue in that direction since volume spikes often happen in peaks or valleys.
Threshold:
The level at which custom alerts and signal can be set. The higher the value, the more volume required to trigger.
Built in Alerts:
You can set custom alerts for the crossovers of the adjustable threshold, or the average RVOL band.

K.M Trend Alerts (BETA 1.2)Like I said previously in the " K.M Trend Strategy (BETA 1.2) " this is the script to set alerts. If you haven't seen the strategy one please search it. Please look at the strategy post to see more information. Thank you.
Buy Alerts = P (greater then) B
Sell Alerts = P (less then) B
Sincerely,
Kevin Manrrique
Follow us on Instagram: TWTForexGroup, we have amazing content and also sell signals.

Watchlist AlertThis “Watchlist Alert” indicator is to help traders monitor multiple symbols and notify them whenever a specified target price is reached. Upon loading the script, you can define up to ten ticker symbols along with their individual price targets. The script stores these pairs in a persistent map so that, on each new bar, it retrieves the previous and current close prices for every symbol in your watchlist. If a symbol’s price crosses above or below its target, the script sends an alert (using your chosen alert frequency) and records the timestamp of that event.
Visually, the indicator displays a small table at the top center of your chart. For each watched symbol, it shows four columns: the symbol name, its latest close price (in the chart’s timeframe), the target price you set, and the last time an alert was emitted (formatted as MM.dd HH:mm:ss). By comparing the previous close to the current close and checking against the stored “lastAlertTime,” the script ensures that you receive exactly one alert per crossing event per bar.
In short, the key features are:
Input up to ten symbols with their corresponding float price targets.
Automatically check each symbol’s previous and current close values every bar.
Trigger a single alert when price crosses a target—either upward or downward.
Maintain a map of last alert timestamps to prevent duplicate notifications.
Display a real-time table listing each symbol’s current price, target, and last alert time.
Whenever you need to keep tabs on multiple instruments across different timeframes without manually tracking price levels, simply add this indicator to your chart. It runs in the background and pushes alerts as soon as any watched symbol touches its defined threshold.

Detect BOS in Five Candles with MTF - Alert [MsF]Japanese below / 日本語説明は英文の後にあります。
-------------------------
*This indicator is based on azmathshah's "Last Three Candles each of Two HTF".
It's a very cool indicator. thank you.
You can detect trend reversal with candlesticks.
It's MTF compatible and can display up to 2 sets of 5 candles of any time frame on the right side of the chart.
By displaying the candles of the upper time frame bars, you can check the trend change and measure the entry timing with the lower time frame bars.
There are two types of alerts.
"Liquidity Sweep": This is an alert when the upper beard (high) of ③ is touched with the next foot.
"Candle Close": An alert when the upper whisker (high) of ③ is exceeded by the closing price of the next bar (generally a strong signal)
-------------------------
ローソク足でトレンド転換を検知するインジケーターです。
MTF対応となっておりチャートの右側に任意タイムフレームのローソク5本を最大2セット表示できます。
上位足のローソクを表示することにより、トレンド転換確認しながら、下位足でエントリータイミングを計ることができます。
アラートは2種類あります。
"Liquidity Sweep":③の上ヒゲ(high)を次の足でタッチした場合のアラートです
"Candle Close":③の上ヒゲ(high)を次の足の終値で上回った場合のアラートです(一般的には強力なシグナルとなります)

Take Session High/Low Alert [MsF]Japanese below / 日本語説明は英文の後にあります。
-------------------------
This indicator that displays High/Low lines for each session. The Key Levels of each session can be visually recognized, which is useful for PD Array analysis. You can display the last 3 days. Based on trinity by ICT.
The biggest feature is that the color shape of the line changes when reaching High/Low. Of course, you can also set alerts.
Unreached High/Low lines can be extended to the right. hides all timeframes over 1 hour. (alert is alive)
You can choose 4 sessions. If you only want to use 3 sessions, you can do that by setting the same session time for 2 of the 4 session settings.
About Parameter Settings
Session Time: Please set it to be a 24-hour cycle. You can also specify the time zone. The default is NY time.
Basis/Other color: The first time specified in "Session Time" in this indicator's parameter is the "Basis color". "Other color" is a line other than that.
Enable Time Lines: You can turn on/off the display of vertical lines.
High/Low color: High/Low line setting that has not been reached.
Taken color: High/Low line setting that has already been reached.
Extend Lines: Allows unreached High/Low lines to be extended to the right in the chart.
-------------------------
セッションごとのHigh/Lowをライン表示するインジケーターです。
過去約3日分を表示することができます。
最大の特徴はHigh/Low到達時にラインの色形が変わることです。もちろんアラート設定も可能です。
未到達のHigh/Lowラインは右側に延長することができます。
チャート表示がビジーとなる為、1時間を超える時間足ではすべて非表示とする仕様です。(アラートは生きてます)
セッションは4つ指定できます。
もしセッションを3つのみ使用したい場合は、4つのセッション設定の内2つに同じセッション時間を設定することで実現可能です。
■パラメータ設定
Session Time:24時間周期となるように設定してください。またタイムゾーンが指定できます。デフォルトはNY timeです。
Basis/Other color:パラメータの"Session Time"にて一番最初に指定した時間が基準=Basisとなります。Otherはそれ以外のラインとなります。
Enable Time Lines:垂直ラインの表示ON/OFFが可能です。
High/Low color:未到達のHigh/Lowライン設定となります。
Taken color:到達済みのHigh/Lowライン設定となります。
Extend Lines:未到達のHigh/Lowラインを右に延長できます。

3 Zigzag for MTF Fib Alert [MsF]Japanese below / 日本語説明は英文の後にあります。
-------------------------
This indicator that automatically displays Fibonacci from each High & Low based on 3 Zigzags. It's useful for multi-timeframe analysis.
For example, Fibonacci calculated from the high and low prices (Zigzag 3 Period=100) of the upper timeframe can be displayed on the lower timeframe.
Also, you can set alerts for each Fibonacci point. It is useful when you are waiting for the price to return to the discount (50% or less) or the premium (50% or more) of the upper timeframe.
"Fib 1 - Crossing 0.00" … Trigger an alert when crossing the 0% line in Fibonacci of Zigzag1
"Fib 1 - Crossing 100.0" … Trigger an alert when crossing the 100% line in Fibonacci of Zigzag1
"Fib 1 - Crossing 23.6" … Trigger an alert when crossing the 23.6% line in Fibonacci of Zigzag1
"Fib 1 - Crossing 38.2" … Trigger an alert when crossing the 38.2% line in Fibonacci of Zigzag1
"Fib 1 - Crossing 50.0" … Trigger an alert when crossing the 50.0% line in Fibonacci of Zigzag1
"Fib 1 - Crossing 61.8" … Trigger an alert when crossing the 61.8% line in Fibonacci of Zigzag1
"Fib 1 - Crossing 76.4" … Trigger an alert when crossing the 76.4% line in Fibonacci of Zigzag1
*Same as Zigzag 1 and Zigzag 2 too.
"Choose Zig Zag Leg for fib" parameter means...
Latest : Calculate Fibonacci based on "the most recent Zigzag line".
Previous : Calculate Fibonacci based on "the previous Zigzag line".
-------------------------
3つのZigzagを元に各High&Lowからフィボナッチを自動で表示するインジケーターです。
Zigzagの期間を工夫することで、マルチタイムフレーム分析に役立ちます。
例えば、以下の設定とした場合:
Zigzag 1 Period … 8
Zigzag 2 Period … 25
Zigzag 3 Period … 100
上位時間足Zigzag(Period=100)の高値安値から形成されるフィボナッチを下位時間足に表示することができるのです。
また、このインジケーターではフィボナッチのポイント毎にアラートの設定が可能です。
上位時間足の割安価格(50%以下)や割高価格(50%以上)に価格が戻ってくるのを待っている時などに力を発揮してくれます。
"Fib 1 - Crossing 0.00" … Zigzag1のフィボナッチにおいて、0%ラインとクロスした場合にアラートを発報します
"Fib 1 - Crossing 100.0" … Zigzag1のフィボナッチにおいて、100%ラインとクロスした場合にアラートを発報します
"Fib 1 - Crossing 23.6" … Zigzag1のフィボナッチにおいて、23.6%ラインとクロスした場合にアラートを発報します
"Fib 1 - Crossing 38.2" … Zigzag1のフィボナッチにおいて、38.2%ラインとクロスした場合にアラートを発報します
"Fib 1 - Crossing 50.0" … Zigzag1のフィボナッチにおいて、50.0%ラインとクロスした場合にアラートを発報します
"Fib 1 - Crossing 61.8" … Zigzag1のフィボナッチにおいて、61.8%ラインとクロスした場合にアラートを発報します
"Fib 1 - Crossing 76.4" … Zigzag1のフィボナッチにおいて、76.4%ラインとクロスした場合にアラートを発報します
※Zigzag1およびZigzag2のフィボナッチも同様
"Choose Zig Zag Leg for fib"パラメータについて:
Latest … 一番新しいZigzagのライン(UpまたはDown)を元にフィボナッチを計算します。
Previous … ひとつ前のZigzagのライン(UpまたはDown)を元にフィボナッチを計算します。

Moving Stop-Loss mechanism + alerts to MT4/MT5"How to code moving stop-loss mechanism", is one of the most often repeating questions in private messages I receive, so just to focus on this mechanism, I made a spin-off from my previous script: TradingView-Alerts-to-MT4-MT5-dynamic-variables-NON-REPAINTING .
The logic here moves the stop-loss each time a trade is running and a new pivot high/low is detected. When such event occurs (UpdateLongStopLoss or UpdateShortStopLoss), stoploss_long or stoploss_short mutable variable is modified. And it needs to be coded inside strategy.exit() line as "stop=stoploss_long" or "stop=stoploss_short". Entries are pretty straightforward - on Stoch crosses.
Last lines of the script show how to wrap information about such updates and send send alerts to MetaTrader via TradingConnector for execution in Forex/indices/commodities/crypto markets via MetaTrader. Please note that "tradeid=" variable must be passed with each alert, to let MetaTrader know which trade to modify. SLMOD, TPMOD are recently added commands, along with BE (as in "move stop-loss to breakeven" - but that's another topic).
Please disregard strategy backtest results, as this script is for coding education purposes only. However, it seems with the stop-loss mechanism enabled, the results are even better, than in original version of the script :)

Smart AlertsThis indicator provides back-tested signals and alerts from multiple technical indicators.
No more guessing whether or not you should trust an indicator. See your indicators' past performance at a glance.
No more false alarms. Disable re-painting of signals.
When multiple indicators overlap, a Confluence indicator will print (large triangle). With your settings properly tuned, this will show a HIGH probability of a move.
Current Signal/Alert Options (more to come):
RSI Oversold
RSI Overbought
EMA Crossing Up
EMA Crossing Down
Buy Signal Confluence
Sell Signal Confluence
Instructions:
-Enable/disable individual indicators so you can fine tune one at a time
-Adjust the indicator's settings
-Adjust your trade parameters (Max Wait, Take Profit %). Signals that would have given the desired profit in the time allowed will be painted orange.
-Repeat this process with each indicator until you're satisfied
-Set-up alerts

Trend Surfers - Premium Breakout + AlertsTrend Surfers - Premium Breakout Strategy with Alerts
I am happy today to release the first free Trend Surfers complete Breakout Strategy!
The strategy includes:
Entry for Long and Short
Stoploss
Position Size
Exit Signal
Risk Management Feature
How the strategy works
This is a Trend Following strategy. The strategy will have drawdowns, but they will be way smaller than what you would go through with buy and old.
As a Trend Following strategy, we will buy on strength, when a breakout occurs. And sell on weakness.
The strategy includes a FIX Stoploss determined by an ATR multiple and a trailing Stoploss/Takeprofit also determined by an ATR multiple.
You can also manage your risk by entering the maximum % you are willing to risk on every trade. Additionally, there is an option to enter how many pairs you will be trading with the strategy. This will change your position size in order to make sure that you have enough funds to trade all your favorite pairs.
Use the strategy with alerts
This strategy is alert-ready. All you have to do is:
Go on a pair you would like to trade
Create an alert
Select the strategy as a Trigger
Wait for new orders to be sent to you
Every Entry (Long/Short) will include:
Market Entry (Enter position NOW!)
Stoploss price
Position Size
Leverage
* If you do not wish to use leverage, you can multiply the Position Size by the Leverage. But doing that, you might end up with a position greater than your equity. Trading on Futures is better in order to have accurate risk management.
Exit signals:
When you receive an exit signal, you need to close the position ASAP. If you want to keep your results as close as possible to the backtest results, you need to execute quickly and follow what the strategy is telling you.
Do not try to outsmart the strategy
Leave your emotion out of trading! If you trust the strategy, you will have way better returns than if you try to outsmart it. Follow each signal you receive even if it doesn't seem logical at the moment.
Become a machine that executes. Don't look at fundamentals. Follow the trend! Trust the strategy!
I hope you enjoy it!

Keltner Channel AlertSimple Keltner Indicator with a custom alert.
The alert should ring when any Band has the price crossing.

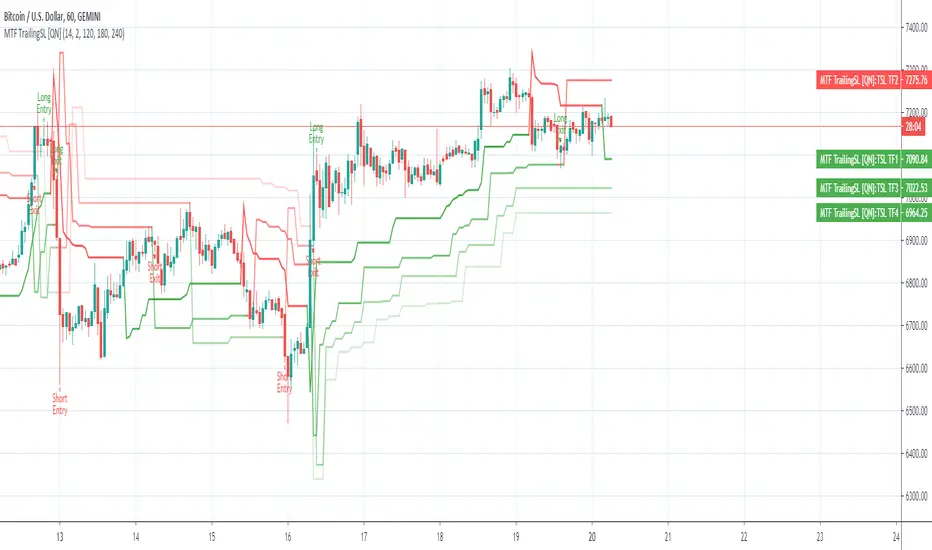
MTF Trailing SL Alerts [QuantNomad]These are alerts for my MTF Trailing SL Strategy.
Entry Long position if all 4 time-frames agree on the long signal.
Exit Long positions when at least 2 time-frames disagree on the long signals.
Entry to Short position if all 4 time-frames agree on Short signal.
Exit from Short positions when at least 2 time-frames disagree on Short signal.
Use "Once Per Bar Close" when creating alerts.
Link to the strategy:
Parabolic SAR Alerts (on close) [QuantNomad]This is study with alerts for my previously published strategy:
Use "Once Per Bar Close" alerts.
