Outlier changes alertAn indicator that calculates click (price change), percentage change, and Z-score changes while displaying outliers based on defined ranges.
Outlier Detection:
Mark outliers (for price, percentage, Z-score) based on user-defined thresholds. For example, any price movement exceeding a certain Z-score or percentage change could be marked as an outlier and displayed on chart.
Indicator Overview:
1. Click (Price Change):
Calculate the absolute price change from one period to another (e.g., from the current closing price to the previous closing price).
2. Percentage Change:
Calculate the percentage price change over a specific period, showing how much the price has changed in relative terms compared to the previous price.
3. Z-Score:
Compute the Z-score to standardize the price change relative to its historical average and standard deviation. The Z-score helps in detecting whether a price movement is an outlier or falls within a normal range of volatility.
Cari dalam skrip untuk "alert"

TrailingTakeProfit exampleQuite recently I came upon a concept of Trailing Take Profit and I couldn't find a PineScript which implements it for the fastest possible execution, so here it is :)
Everybody knows Trailing StopLoss - an invisible mechanism follows the price and exits the trade once the price retreats too much from its recent most extended favourable value. Trailing TakeProfit does the similar thing, but at the opposite end - the trade gets closed if a price moves too well, in too favourable extent.
Why close the trade if it is going so good? Well, whatever goes up, must go down and vice versa. It is expected, that after fast rally a market will soon fall and after a dump it will go up. So Trailing TakeProfit's role is to secure profits.
But how does Trailing TakeProfit differ from the standard one? "Trailing" means, the exit level is moving. Its role is to be executed only after a rapid favourable move within 1-2 candles, not more. We never know when a rapid move happens, but when it does, we wanna catch those pips and quickly exit without looking back.
Visually Trailing TakeProfit levels are... bands. In this script example these are ATR multiplied bands (aka Keltner Channel), but they could also be Bollinger Bands or something else.
The code is simple just to focus on this single functionality, so you can quickly copy-paste it into your script. Entries are triggered by default SMA crosses.
P.S. I wouldn't be myself, if I didn't add alert messages compatible with the syntax of recently revamped TradingConnector - both in the code already and in the table showing them.

Optics Alert ZoneOptics Alert Zone shows price ranges for prices 17 days and 40 days ago. These can be adjusted based on asset class and volatility.
Bullish is when price is above 17 and 40 day.
Bearish is when price is below 17 and 40 day.

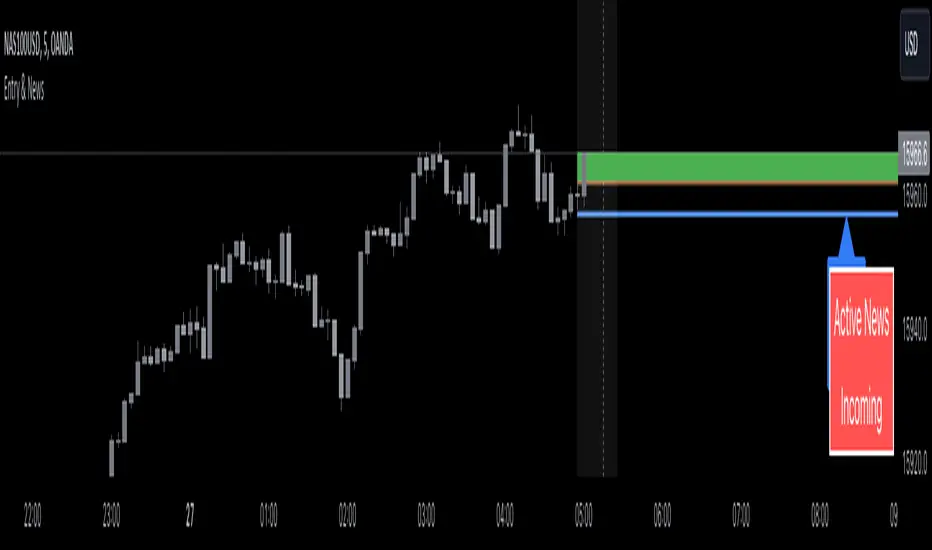
Entry Assistant & News AlertIntention Of This Indicator
This indicator is intended to be used as an assistant in combination with a technical strategy.
This indicator has several functions intended to assist you at entering positions.
This indicator is intended to be used with strategies that place Stop Losses above / below candles, and entries at the BOC ( Break Of The Previous Candle , For Longs it is when price goes above the previous candles high, For Shorts it is when price goes below the previous candles low)
This indicator allows you to enter daily news release times, and it will warn you before and after that news release time ( to help you stay out of trading news )
This indicator Draw / Displays the following
A line below ( for Longs ) / above ( for Shorts ) the current candle, with an additional pip value for extra space ( this displays where to place your Stop Loss )
A label displaying the price of the Stop Loss line, to assist in placing the Stop Loss
A line displaying where the BOC is ( based off of going Long or going Short )
A box that appears when the BOC has occurred ( entry signal )
A line displaying where the news release is going to happen ( only according to your time input settings )
A box that surrounds the news release ( only according to your time input settings )
A table in the bottom right corner that shows you when there is Active News ( only according to your time input settings )
Inputs
Inputs to change the aesthetics ( colours etc. )
Numeric inputs to modify the placement / spacing of the Stop Loss / Entry signal / News
Toggles to activate or deactivate features
Disclaimer
This indicator does not guaranteed to work for every instrument ( always test before use! )
It is not at all intended to be a signal indicator on its own, but rather only to give a signal when used with specific technical strategies that us BOC entries.
This indicator is not guaranteed to be accurate, or error free.
This indicator is not signalling winning entries or high probability entries.
You must manually enter the news time inputs, this indicator does not automatically show you when there is a news release
This is a combination indicator of my Entry Assistant and my News Alert indicator, both can be found and used separately.
Inside Candle alert V1 By HARSH DEO SINGHA breakout long signal is generated when the current high crosses above the previous mother bar's high, and it's an inside bar.
A breakdown short signal is generated when the current low crosses below the previous mother bar's low, and it's an inside bar.
The script plots triangle shapes below breakout long signals and above breakdown short signals.
Alert conditions are added for inside bars, breakout long, and breakdown short.
Please note that this is a basic example, and you can further refine and optimize your strategy based on your specific trading rules and preferences. Always remember to backtest and paper trade any strategy before using it with real money.

Candle Body Color change with Alert-Yogesh PawarThose who wants to get alert for Candle Body Color change, can try this. It will help you.
TDMACD Divergence Multi Timeframe and Alert [5ema]I reused some functions, made by (i believe that):
@paaax: The table position function.
@everget: The RSI divergence function.
@QuantNomad: The function calculated value and array to show on table for input symbols.
@ChaosTrader: The function calculated value TDMACD.
-----
What to do?
MACD divergence signal.
The crossing of MACD and Signal line.
The reversal of MACD.
The reversal of Signal line.
The screener follow 6 different timeframes.
Set notification alert when signal appears.
-----
How is it created?
MACD line = fastMA - slowMA.
Signal line = ta.ema(macd(), signalLength)
Make function for pivot low & high point of MACD and price.
Request.security that function for earch time frame.
-----
How to use?
Can be combined with many other indicators or candlestick patterns.
Customize the input indicators to suit your strategy
1. MACD reversed:
2. Signal line reversed:
3. MACD Divergence :
4. MACD crossing Signal line:
5. Signal on Screener for multi time frame:
Green ⦿: Buy.
Red ⦿: Sell.
Green 〇: Review Buy.
Red 〇: Review Sell.
-----
This indicator is for reference only, you need your own method and strategy.
If you have any questions, please let me know in the comments.

TradeBee Percent Gap AlertA simple script to enable adding a trigger when a stock reaches 'X' percent, the 'X' can be configured.
The script also displays current tickers gap %, this is particularly helpful when you have 2 or more panels on a chart

RSI-ROC Momentum AlertThis is the RSI-ROC Momentum Alert trading indicator, designed to help traders identify potential buy and sell signals based on the momentum of price movements.
The indicator is based on two technical indicators: the Rate of Change (ROC) and the Relative Strength Index (RSI). The ROC measures the speed of price changes over a given period, while the RSI measures the strength of price movements. By combining these two indicators, this trading indicator aims to provide a comprehensive view of the market momentum.
An RSI below its oversold level, which shows as a green background, in addition to a ROC crossing above its moving average (turns green) signals a buying opportunity.
An RSI above its overbought level, which shows as a red background, in addition to a ROC crossing below its moving average (turns red) signals a selling opportunity.
Traders can use this indicator to identify potential momentum shifts and adjust their trading strategies accordingly.
The ROC component of the indicator uses a user-defined length parameter to calculate the ROC and a simple moving average (SMA) of the ROC. The color of the ROC line changes to green when it is above the ROC SMA and to red when it is below the ROC SMA. The ROC SMA color changes whether it's above or below a value of 0.
The RSI component of the indicator uses a user-defined length parameter to calculate the RSI, and user-defined RSI Low and RSI High values to identify potential buy and sell signals. When the RSI falls below the RSI Low value, a green background color is applied to the chart to indicate a potential buy signal. Conversely, when the RSI rises above the RSI High value, a red background color is applied to the chart to indicate a potential sell signal.
This indicator is intended to be used on any time frame and any asset, and can be customized at will.

Leverage Liquidation Circles/dots/alertsThis plots liquidation alerts for different levels of leverage. The script calculates the liquidation prices for both long and short positions based on the inputted leverage values. Then, it plots dots on the chart where liquidation can occur for each level of leverage. Additionally, it plots circles on the chart only when a liquidation event occurs, at which point the circle changes color to indicate the level of leverage that triggered the liquidation.
The script allows traders to visualize potential liquidation events for different levels of leverage, which can be helpful in managing risk when trading on margin. The different colors of the circles can quickly communicate which level of leverage triggered the liquidation, allowing traders to quickly assess the situation and adjust their positions if necessary.
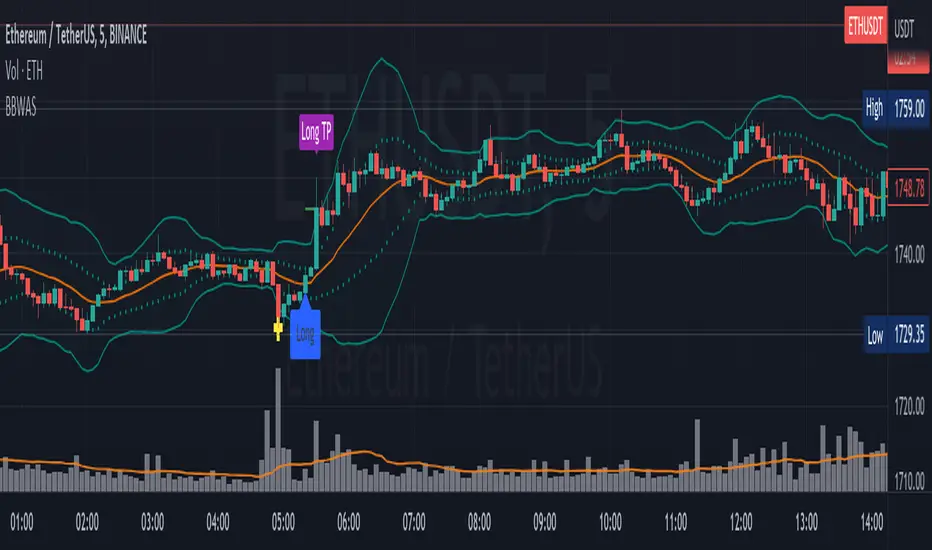
Bollinger Bands Weighted Alert System (BBWAS)The idea of this indicator is very similar to my previous published script called BBAS (Bollinger Bands Alert System).
Just with little additions. In this case, we're using a Weighted Moving Average (ta.wma) instead of Simple Moving Average to calculate the basis line.
A breakout in trading refers to a situation where the price of a security or asset moves beyond a defined level of support or resistance, which is typically indicated by technical analysis tools like Bollinger Bands. Bollinger Bands consist of three lines: the upper band, the lower band, and the middle band (or basis). The upper and lower bands are set at a specified number of standard deviations away from the middle band, and they help to define the range within which the price of an asset is expected to fluctuate.
When the price of the asset moves beyond the upper or lower band, it is said to have "broken out" of the range. If the price closes below the lower band, it is considered a bearish breakout, and if it closes above the upper band, it is considered a bullish breakout.
Once a breakout occurs, traders may look for a confirmation signal before entering a trade. In this case, crossing the middle line (or basis) after a breakout may signal a potential trend reversal and a good opportunity to enter a long or short trade, depending on the direction of the breakout.
Dear traders, while we strive to provide you with the best trading tools and resources, we want to remind you to exercise caution and diligence in your investing decisions.
It is important to always do your own research and analysis before making any trades. Remember, the responsibility for your investments ultimately lies with you.
Happy trading!
Impulse Alerts - Riccardo Di GiacomoThis is the Impulse indicator that allows you to receive alerts in the case one of the following situation occurs:
1) Buy Setup
- Price above Exponential Moving Average 260
- Moving Average 21 above Exponential Moving Average 260
- Moving Average 9 above Moving Average 21
- RSI(14) above 50
- Stochastic equal or below 20
2) Sell Setup
- Price below Exponential Moving Average 260
- Moving Average 21 below Exponential Moving Average 260
- Moving Average 9 below Moving Average 21
- RSI(14) below 50
- Stochastic equal or above 80
The Bollinger Bands represents another useful information:
- If the price is near the upper band when the first situation occurs, it is another green light, otherwise be careful
- If the price is near the lower band when the second situation occurs, it is another green light, otherwise be careful

Know Sure Thing with AlertsIts the same basic Know Sure Thing Indicator, just added alerts and labels for crossovers in it.
Hope you all like it.
Enjoy
Pro Trading Art - Candlestick Patterns with alertAll candlestick pattern based on "Japanese candlestick charting techniques".
Currently Supported List of Candlestick Patterns :
Hammer
Hanging Man
Inverted Hammer
Shooting Star
Morning Star
Evening Star
Bullish Engulfing
Bearish Engulfing
Important Points:
1. You can create alert for all patterns.
2. You can modify multiplier(Length Of Shadow) for Hammer, Hanging Man, Inverted Hammer and Shooting Star
3. You can modify EMA length for upward and downward validation of any pattern.

[MAD MBS] Multibit Alert on ChartThis is a basic debugger to display each individual multibit alert directly on the chart and additionally the possibility to create alarms based on this true/falses to use multibit without a Riskmanagement

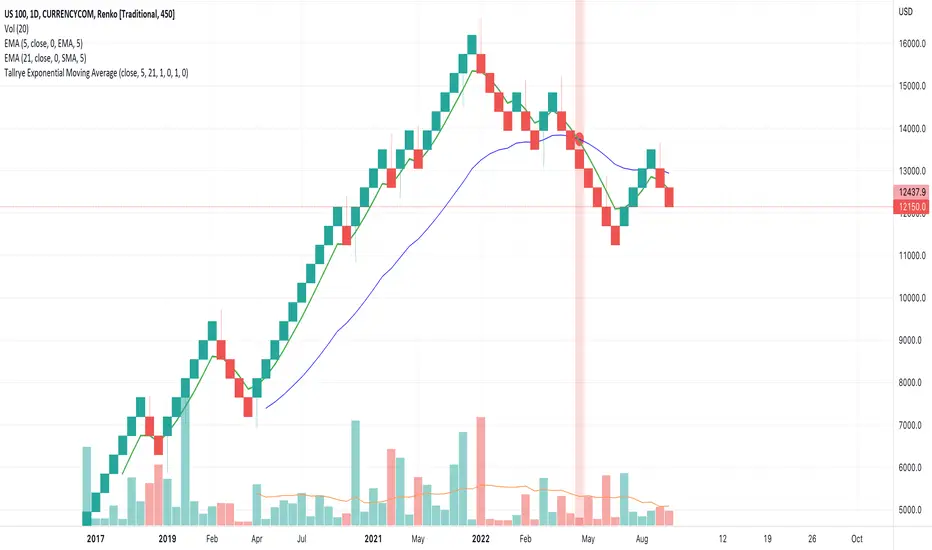
Tallrye AlertsThis is just a script to see the usage of volume from another source, i.e. US100 while using alerts in Renko chartview.
myAlertsLibrary "myAlerts"
My Alerts Functions - To use with autoview
f_order(_price, _qty, _position, _account, _exchange, _i, i_qtyTypeOrder, typeMsg, syminfoticker)
- Write the entry order message
Parameters:
_price : - The order price
_qty : - The order quantity
_position : - The order side
_account : - The user account
_exchange : - The user exchange
_i : - Used for multi-accounts, this represents the index of accounts
i_qtyTypeOrder : - String used to set Thether or Bitcoin Type Orders
typeMsg : - True = Autoview; False = Metatrader
syminfoticker : - Ticker
Returns: - Returns the open order message
f_stop(_stop_price, _slLimit_price, _account, _exchange, _i, i_delayOrders, typeMsg, syminfoticker)
- Write the stop order message
Parameters:
_stop_price : - The order stop price
_slLimit_price : - The order stop limit price
_account : - The user account
_exchange : - The user exchange
_i : - Used for multi-accounts, this represents the index of accounts
i_delayOrders : - Time in seconds to delay command on autoview
typeMsg : - True = Autoview; False = Metatrader
syminfoticker : - Ticker
Returns: - Returns the open order message
f_take(_take_price, _account, _exchange, _i, i_delayOrders, typeMsg, syminfoticker)
- Write the stop order message
Parameters:
_take_price : - The order stop price
_account : - The user account
_exchange : - The user exchange
_i : - Used for multi-accounts, this represents the index of accounts
i_delayOrders : - Time in seconds to delay command on autoview
typeMsg : - True = Autoview; False = Metatrader
syminfoticker : - Ticker
Returns: - Returns the open order message
f_update(_account, _exchange, _i, i_delayOrders, typeMsg, syminfoticker)
- Write the update order message
Parameters:
_account : - The user account
_exchange : - The user exchange
_i : - Used for multi-accounts, this represents the index of accounts
i_delayOrders : - Time in seconds to delay command on autoview
typeMsg : - True = Autoview; False = Metatrader
syminfoticker : - Ticker
Returns: - Returns the open order message
f_exit(_account, _exchange, _i, i_delayOrders, typeMsg, syminfoticker)
- Write the exit order message
Parameters:
_account : - The user account
_exchange : - The user exchange
_i : - Used for multi-accounts, this represents the index of accounts
i_delayOrders : - Time in seconds to delay command on autoview
typeMsg : - True = Autoview; False = Metatrader
syminfoticker : - Ticker
Returns: - Returns the open order message
f_hedge(_account, _exchange, _i, i_delayOrders, typeMsg, syminfoticker)
- Write the exit order message
Parameters:
_account : - The user account
_exchange : - The user exchange
_i : - Used for multi-accounts, this represents the index of accounts
i_delayOrders : - Time in seconds to delay command on autoview
typeMsg : - True = Autoview; False = Metatrader
syminfoticker : - Ticker
Returns: - Returns the open order message
Divergence MACD Sign/Alert [MsF]MACD divergence sign & alert notification.
With this router, you can choose which further indicators you want to see divergence in MACD.
In addition, in order to improve visibility, the sub-window is designed to display only the selected index and diversity.
Lookback Bars: When detecting divergence, you can set how many bars to look back in the past.
--------------
MACDダイバージェンスのサイン&アラートインジケータです。
このインジケータでは、MACDの中でさらにどの指標のダイバージェンスを見るか選択できます。"MACD"、"Signal"、"ヒストグラム"の3つから選べます。
なお、サブウィンドウには可視性向上のため、選択した指標とダイバージェンスのみを表示する仕様としています。
■設定について
Lookback Bars:ダイバージェンス検出する場合に、何個のバーを過去にさかのぼるか設定できます。

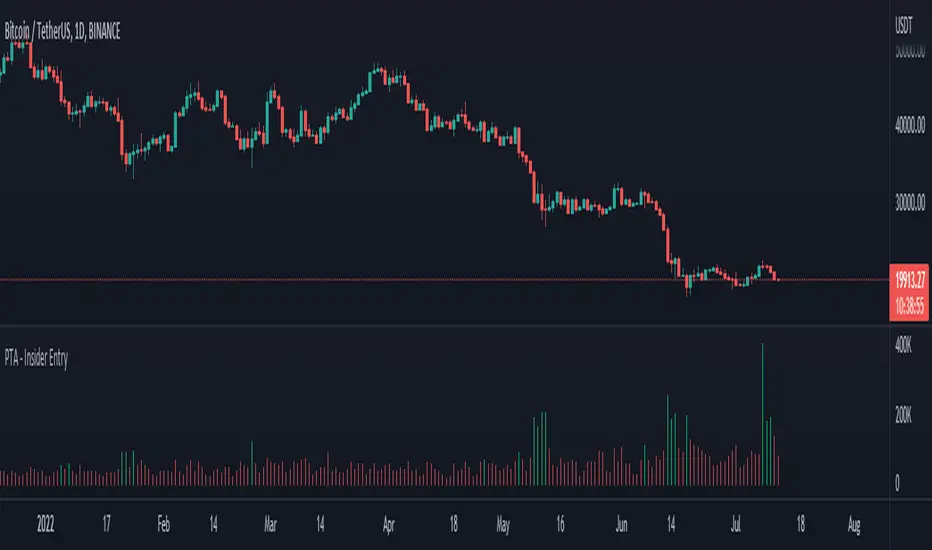
Pro Trading Art - Insider Entry with alertThis indicator is based on volume and ma. This will help you to detect higher volume on chart. You can create alert to stay updated. I am using Fibonacci golden ratio to multiply the current volume. My logic is if volume comes greater than factor of Fibonacci number and current volume then consider it as a insider entry.
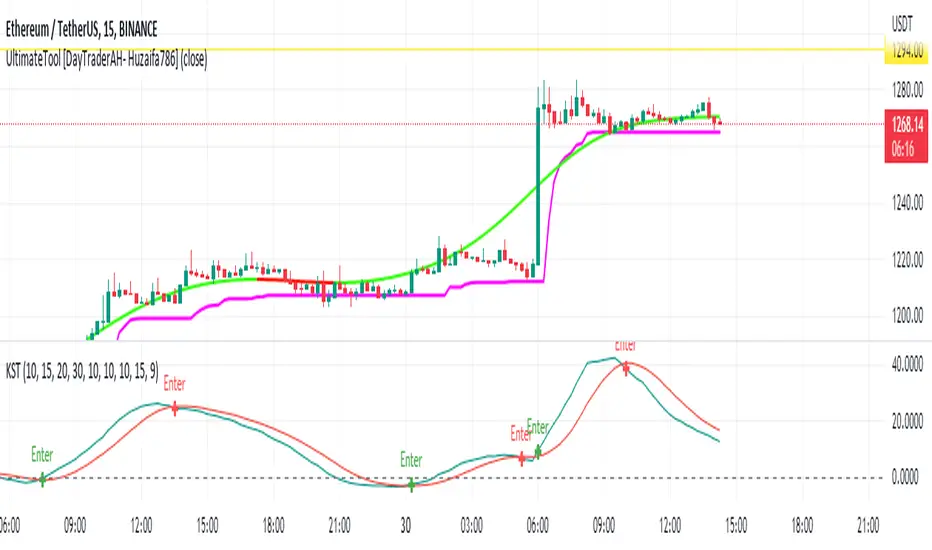
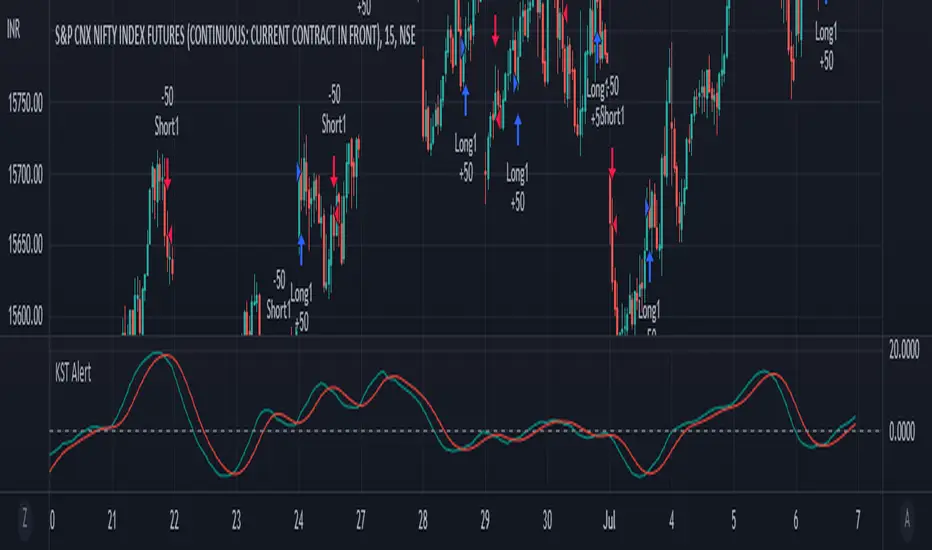
KST AlertJust added Alert condition to the default indicator
Default timeframe is set to 15m
Buy signal initiates when kst line crosses over signal line
Sell Signal initiates when kst line crosses under signal line
RSI Scalping & Swing Signals With AlertsThis RSI indicator shows a green or red ribbon when the smoothed RSI is bullish or bearish. It also includes a long moving average for overall trend confirmation. Wait until the ribbon holds above or below the long moving average and take positions in that direction.
To get an easier to read RSI indicator, I smoothed the RSI out and paired it next to a short term RMA. These two together form the ribbon that will show you early reversals and trend direction. The long moving average is used as an overall trend detector and confirmation for longer term trends.
***HOW TO USE***
Scalping: Enter longs when the ribbon turns green and enter shorts when the ribbon turns red. Exit positions when the ribbon turns the opposite color or crosses the long moving average.
Swing Trading: When the ribbon holds above the long moving average or breaks out and retests it, look for long positions and exit when the ribbon turns red or crosses the long moving average. When the ribbon holds below the long moving average or breaks down and retests it, look for short positions and exit when the ribbon turns green or crosses the long moving average.
***DETAILS***
This indicator gives early reversal signals very well and waiting for the RSI ribbon to cross the long moving average helps to get you into positions when the market is ready to really move while filtering out some of the noise.
The ribbon and background will change to green or red depending on whether it is currently bullish or bearish.
There is also a label that changes colors and tells you if RSI is bullish or bearish and also whether the RSI ribbon is above or below the long moving average.
Green or red circles will appear on the indicator when there is a bullish or bearish cross of the RSI ribbon and the long moving average.
It also has alerts that trigger when RSI is turning bullish/bearish or when the RSI ribbon is crossing the long moving average.
***CUSTOMIZATION***
Each piece of this indicator can be customized to suit your preferences including the RSI source, length, smoothing length, short moving average length and long moving average length. You can also turn off the labels, signals and long moving average. All of these settings can be managed within the indicator settings input tab.
***MARKETS***
This indicator can be used as a signal on all markets, including stocks, crypto, futures and forex.
***TIMEFRAMES***
This RSI Scalping & Swing Signals indicator can be used on all timeframes.
***TIPS***
Try using numerous indicators of ours on your chart so you can instantly see the bullish or bearish trend of multiple indicators in real time without having to analyze the data. Some of our favorites are Trend Friend Scalp & Swing Trade Signals, Volume Spike Scanner, Buy & Sell Pressure Volume Profile, and Momentum Scalper in combination with this RSI indicator. They all have real time Bullish and Bearish labels as well so you can immediately understand each indicator's trend.

Momentum Scalping & Swing Signals With AlertsThis Momentum indicator shows a green or red ribbon when smoothed momentum is bullish or bearish. It also includes a long moving average for overall trend confirmation. Wait until the ribbon holds above or below the long moving average and take positions in that direction.
To get an easier to read momentum indicator, I smoothed the momentum out and paired it next to a short term RMA. These two together form the ribbon that will show you early reversals and trend direction. The long moving average is used as an overall trend detector and confirmation for longer term trends.
***HOW TO USE***
Scalping: Enter longs when the ribbon turns green and enter shorts when the ribbon turns red. Exit positions when the ribbon turns the opposite color or crosses the long moving average.
Swing Trading: When the ribbon holds above the long moving average or breaks out and retests it, look for long positions and exit when the ribbon turns red or crosses the long moving average. When the ribbon holds below the long moving average or breaks down and retests it, look for short positions and exit when the ribbon turns green or crosses the long moving average.
***DETAILS***
This indicator gives early reversal signals very well and waiting for the momentum ribbon to cross the long moving average helps to get you into positions when the market is ready to really move while filtering out some of the noise.
The ribbon and background will change to green or red depending on whether it is currently bullish or bearish.
There is also a label that changes colors and tells you if momentum is bullish or bearish and also whether the momentum ribbon is above or below the long moving average.
Green or red circles will appear on the indicator when there is a bullish or bearish cross of the momentum ribbon and the long moving average.
It includes alerts that trigger when momentum is turning bullish/bearish or when the momentum ribbon is crossing the long moving average.
***CUSTOMIZATION***
Each piece of this indicator can be customized to suit your preferences including the momentum source, length, smoothing length, short moving average length and long moving average length. You can also turn off the labels, signals and long moving average. All of these settings can be managed within the indicator settings input tab.
***MARKETS***
This indicator can be used as a signal on all markets, including stocks, crypto, futures and forex.
***TIMEFRAMES***
This Momentum Scalping & Swing Signals indicator can be used on all timeframes.
***TIPS***
Try using numerous indicators of ours on your chart so you can instantly see the bullish or bearish trend of multiple indicators in real time without having to analyze the data. Some of our favorites are Trend Friend Scalp & Swing Trade Signals, Volume Spike Scanner, Buy & Sell Pressure Volume Profile, and RSI Scalper in combination with this momentum indicator. They all have real time Bullish and Bearish labels as well so you can immediately understand each indicator's trend.