MÈGAS ALGO : NMS (Nexora Momentum Synchronizer) [INDICATOR]Overview
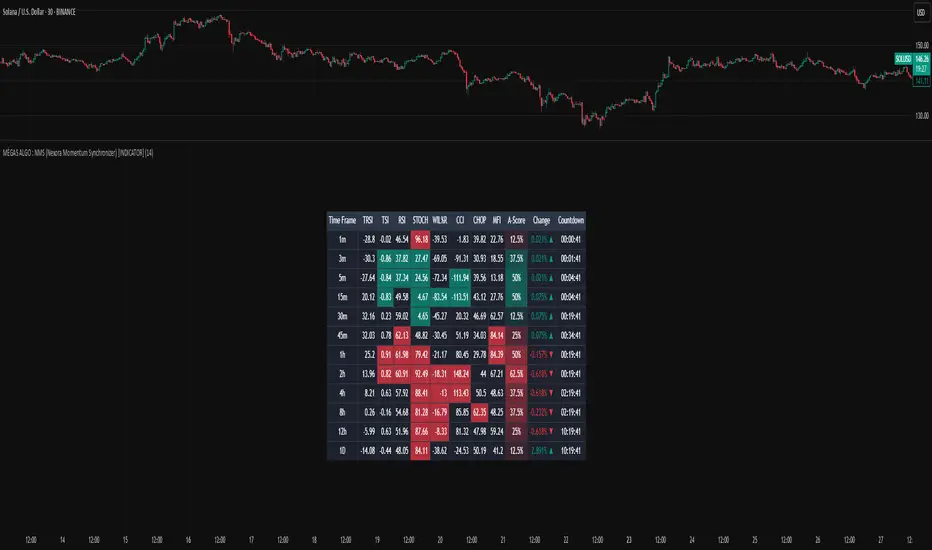
The NMS (Nexora Momentum Synchronizer) is a multi-timeframe indicator that aggregates and analyzes data of multiple momentum oscillators across different timeframes (1m, 5m, 15m, 30m, 45m, 1h, 2h, 4h, 8h, 12h and 24h).
A user-friendly table displaying the indicator’s current values for each timeframe simultaneously.
The script, thanks to the best technical momentum indicators provided by Tradingview, evaluates trend strength and market momentum through synchronized readings of TRSI , TSI , RSI , Stochastic RSI , Williams %R , and CCI.
In addition to the indicator also tracks:
-percentage change in price from the last bar's open across each timeframes
-countdown time to bar close
This indicator caters to the diverse needs of traders, whether they are focused on short-term momentum bursts or long-term trend-following strategies.
By synchronizing momentum indicators, real-time price change(%) from last open and countdow time to close, across multiple timeframes, this tool provides a holistic view of market dynamics, empowering traders to make informed decisions with confidence.
Key Features
1.Multi-Timeframe Momentum Analysis
The Nexora Momentum Synchronizer performs an analysis of key momentum indicator :
—Trend Strength Index (TSI) , True Strength Index (TSI) , Relative Strength Index (RSI) , Stochastic Oscillator (STOCH), Williams Percent Range (W%R) and Commodity Channel Index (CCI) —across multiple timeframes. This ensures traders receive a
comprehensive understanding of momentum alignment, helping them identify high-probability
trade setups with reduced noise and false signals.
In addition to oscillator alignment and regression-based zone detection, the script includes:
-real-time price change(%) from last open for each timeframe, providing insight into intrabar momentum and directional bias.
-real-time countdown to bar close , displayed directly in the table, which enhances timing precision and supports scalping or event-based trading strategies.
These tools combine to offer a comprehensive, real-time framework for both discretionary and alert-driven trading systems.
2.Customizable Parameters
Fully adjustable settings allow traders to tailor the indicator to their specific preferences and
adapt to diverse market conditions. From adjusting overbought and oversold levels to selecting preferred timeframes for alignment alerts, the Nexora Momentum Synchronizer offers unparalleled flexibility to meet individual trading styles.
3.Multi-Timeframe Alerts
Traders can set up alerts for momentum alignment across up to four different timeframes. These alerts ensure that no opportunity is missed, regardless of the trading horizon or strategy being employed.
These alerts can be set up to three different mode : All (to never miss opportunity), Once_for_Bar (to limit to one alert triggered during bar's period) or Bar_Close (to avoid earlier bias).
4.User-Friendly Interface
Designed with simplicity in mind, the Nexora Momentum Synchronizer features an intuitive
table interface that makes complex data easy to interpret. Clear visual cues and
interactive elements allow traders to focus on executing strategies without being
overwhelmed by cluttered charts.
Advantages of Nexora Momentum Synchronizer
Flexibility : Fully customizable parameters ensure the indicator adapts to diverse market
conditions and trader preferences.
Comprehensive Analysis : Multi-timeframe evaluation of momentum indicators provides a
holistic view of market dynamics, enhancing trade confidence.
Real-Time Alerts : Multi-timeframe alert functionality keeps traders informed of critical
market movements and momentum shifts across different horizons.
Please Note:
This indicator is provided for informational and educational purposes only. It is not financial advice, and it should not be considered a recommendation to buy, sell, or trade any financial instrument. Trading involves significant risks, including the potential loss of your entire investment. Always conduct your own research and consult with a licensed financial advisor before making any trading decisions.
The results and images provided are based on algorithms and historical/paid real-time market data but do not guarantee future results or accuracy. Use this tool at your own risk, and understand that past performance is not indicative of future outcomes.
Cari dalam skrip untuk "algo"
MÈGAS ALGO : CNA (Cognitio Analysis) [INDICATOR]Overview
The CNA (Cognitio Analysis) is a comprehensive financial analysis tool designed to evaluate the overall health and potential of a market or company based on fundamental metrics. It aggregates data across five key metric groups—**Growth**, **Profitability**, **Cash Flow**, **Income**, and **Valuation**—to provide a final interpretation of market conditions. The indicator dynamically adapts to the selected fiscal period (Quarter, Year, or Trailing Twelve Months) and delivers insights into dominant trends and conflicting signals.
Key Features
1. Customizable Fiscal Period:
- Users can select between "Quarter", "Year", or "Trailing Twelve Months" (TTM) to analyze data for their desired timeframe.
2. Dynamic Table Visualization:
- Displays raw metric values, aggregated scores, and the final interpretation in an intuitive
table.
- Highlights the final interpretation with dynamic background colors (`color.teal` for bullish,
`color.red` for bearish, etc.).
3. Comprehensive Data Integration:
- Pulls financial data using TradingView's `request.financial()` function for metrics like
revenue, earnings, margins, and valuation ratios.
4. Normalization and Scoring:
- Normalizes data to create a consistent scoring system, ensuring accurate comparisons across
metrics.
How It Works
1. Metric Group Analysis
- Growth Metrics: Measures revenue growth, earnings per share (EPS) growth, and tax
efficiency.
- Profitability Metrics: Analyzes net profit margin, return on equity (ROE), and EBITDA margin.
- Cash Metrics: Assesses operating cash flow margin, free cash flow to operating cash flow
ratio, and cash flow coverage.
- Income Metrics: Examines gross profit margin, operating profit margin, and EBIT margin.
- Valuation Metrics: Evaluates price-to-earnings (P/E), price-to-sales (P/S), and enterprise
value-to-EBITDA (EV/EBITDA).
2. Dynamic Scoring System
- Metrics are normalized to ensure consistency across different scales.
- A geometric mean is used to calculate scores for each metric group, ensuring that all metrics
within a group contribute equally to the final score.
3. Dominant Trend Identification
- Scores from all five metric groups are aggregated to determine the **dominant trend** of the
market.
- The dominant trend is categorized as:
- Bullish: Strong fundamentals across most metrics.
- Bearish: Weak fundamentals across most metrics.
- Neutral: Balanced conditions with no clear direction.
- Unclear: Mixed signals dominate, requiring further monitoring.
4. Conflicting Signals Interpretation
- The indicator identifies scenarios where metrics conflict (e.g., high growth but low valuation).
- These conflicting signals provide nuanced insights into market conditions, highlighting rare opportunities or potential risks.
How to Use the Indicator
1. Select Fiscal Period:
- Choose between "FQ", "FY", or "TTM" to analyze data for the desired timeframe.
2. Review Metric Scores:
- Examine the scores for each metric group (Growth, Profitability, Cash, Income, Valuation) to
understand the underlying performance.
3. Interpret Final Output:
- The final interpretation provides a summary of the dominant trend and conflicting signals,
helping users make informed decisions.
4. Dynamic Coloring:
- Use the dynamic background colors in the table to quickly identify market sentiment
(bullish, bearish, neutral, or mixed).
Applications
- Identifying Opportunities:
- Look for bullish dominant trends combined with undervalued growth opportunities for
potential long positions.
- Avoiding Risks:
- Watch out for bearish dominant trends with overvaluation alerts to avoid potential losses.
- Monitoring Neutral Markets:
- Use the indicator to identify neutral markets and wait for clearer signals before making
decisions.
Conclusion
The CNA (Cognitio Analysis) is a powerful tool for traders and investors seeking to make informed decisions based on fundamental analysis. By combining detailed metric evaluations, dynamic scoring, and sentiment-based interpretations, this indicator provides a comprehensive view of market conditions. Whether you're identifying undervalued opportunities, avoiding overvalued risks, or monitoring neutral markets, this indicator equips you with the insights needed to navigate complex financial landscapes.
Please Note:
This indicator is provided for informational and educational purposes only. It is not financial advice, and it should not be considered a recommendation to buy, sell, or trade any financial instrument. Trading involves significant risks, including the potential loss of your entire investment. Always conduct your own research and consult with a licensed financial advisor before making any trading decisions.
The results and images provided are based on algorithms and historical/paid real-time market data but do not guarantee future results or accuracy. Use this tool at your own risk, and understand that past performance is not indicative of future outc

MÈGAS ALGO : ZIG-ZAG CYCLE INSIGTH [INDICATOR]Overview
The Zig-Zag Cycle Insigth is a revisited version of the classic Zig Zag indicator, designed to provide traders with a more comprehensive and actionable view of price movements.
This advanced tool not only highlights significant price swings but also incorporates additional features such as cycle analysis, real-time data tracking, and Fibonacci retracement levels. These enhancements make it an invaluable resource for identifying trends, potential reversal points, and market structure.
This indicator adheres to TradingView's guidelines and is optimized for both technical analysts and active traders who seek deeper insights into market dynamics.
Key Features:
1. Customizable Thresholds for Price Movements:
- Users can set personalized thresholds for price movement percentages and time periods.
This ensures that only significant price swings are plotted, reducing noise and increasing
clarity.
- Straight lines connect swing highs and lows, providing a cleaner visual representation of
the trend.
2. Cycle Analysis Table:
- A dynamic table is included to analyze price cycles based on three key factors:
- Price Change: Measures the magnitude of each swing (high-to-low or low-to-high).
- Time Duration (Bar Count): Tracks the number of bars elapsed between consecutive swings,
offering precise timing insights.
- Volume: Analyzes trading volume during each segment of the cycle.
- The indicator calculates the **maximum**, **minimum**, and **mean** values for each
parameter across all completed cycles, providing deeper statistical insights into market
behavior.
- This table updates in real-time, offering traders a quantitative understanding of how price
behaves over different cycles.
3. Real-Time Data Integration:
- The indicator displays live updates of current price action relative to the last identified
swing high/low. This includes:
- Current distance from the last pivot point.
- Percentage change since the last pivot.
- Volume traded since the last pivot.
4. Fibonacci Retracement Levels:
- Integrated Fibonacci retracement levels are dynamically calculated based on the most
recent significant swing high and low.
- Key retracement levels (23.6%, 38.2%, 50%, 61.8%, and 78.6%) are plotted alongside the Zig
Zag lines, helping traders identify potential support/resistance zones.
- Extension levels (100%, 161.8%, etc.) are also included to anticipate possible breakout
targets.
5. Customizable Alerts:
- Users can configure alerts for specific real-time conditions, such as:
- Price Change
- Duration
- Volume
- Fibonacci Retracement Levels
How It Works:
1. Zig Zag Identification:
- The indicator scans historical price data to identify significant turning points where the
price moves by at least the user-defined percentage threshold.
- These turning points are connected by straight lines to form the Zig Zag pattern.
2. Cycle Analysis:
For each completed cycle (from one swing high/low to the next), the indicator calculates:
- Price Change: Difference between the start and end prices of the cycle.
- Maximum Price Change: The largest price difference observed across all cycles.
- Minimum Price Change: The smallest price difference observed across all cycles.
- Mean Price Change: The average price difference across all cycles.
- Time Duration (Bar Count): Number of bars elapsed between consecutive swings.
- Maximum Duration: The longest cycle in terms of bar count.
- Minimum Duration: The shortest cycle in terms of bar count.
- Mean Duration: The average cycle length in terms of bar count.
- Volume: Total volume traded during the cycle.
- Maximum Volume: The highest volume traded during any single cycle.
- Minimum Volume: The lowest volume traded during any single cycle.
- Mean Volume: The average volume traded across all cycles.
- These calculations provide traders with a statistical overview of market behavior, enabling
them to identify patterns and anomalies in price, time, and volume.
3. Fibonacci Integration:
- Once a new swing high or low is identified, the indicator automatically calculates Fibonacci
retracement and extension levels.
- These levels serve as reference points for potential entry/exit opportunities.
4. Real-Time Updates:
- As the market evolves, the indicator continuously monitors the relationship between the
current price and the last identified swing point.
- Real-time metrics, such as percentage change and volume, are updated dynamically.
5. Alerts Based on Real-Time Parameters:
- The indicator allows users to set customizable alerts based on real-time conditions:
- Price Change Alert: Triggered when the real-time price change is less or greater than a
predefined percentage threshold (e.g., > or < fixed value).
- Duration Alert: Triggered when the cycle duration (in bars) is less or greater than a
predefined
bar count threshold (e.g., > or < fixed value).
- Volume Alert: Triggered when the trading volume during the current cycle is less or greater
than a predefined volume threshold (e.g., > or < fixed value).
Advantages of Zig-Zag Cycle Insigth
- Comprehensive Insights: Combining cycle analysis, Fibonacci retracements, and real-time data
provides a holistic view of market conditions.
- Statistical Analysis: The inclusion of maximum, minimum, and mean values for price change,
duration, and volume offers deeper insights into market behavior.
- Actionable Signals: Customizable alerts ensure traders never miss critical market events based
on real-time price, duration, and volume parameters.
- User-Friendly Design: Clear visuals and intuitive controls make it accessible for traders of all
skill levels.
Reference:
TradingView/ZigZag
TradingView/AutofibRetracement
Please Note:
This indicator is provided for informational and educational purposes only. It is not financial advice, and it should not be considered a recommendation to buy, sell, or trade any financial instrument. Trading involves significant risks, including the potential loss of your entire investment. Always conduct your own research and consult with a licensed financial advisor before making any trading decisions.
The results and images provided are based on algorithms and historical/paid real-time market data but do not guarantee future results or accuracy. Use this tool at your own risk, and understand that past performance is not indicative of future outcomes.

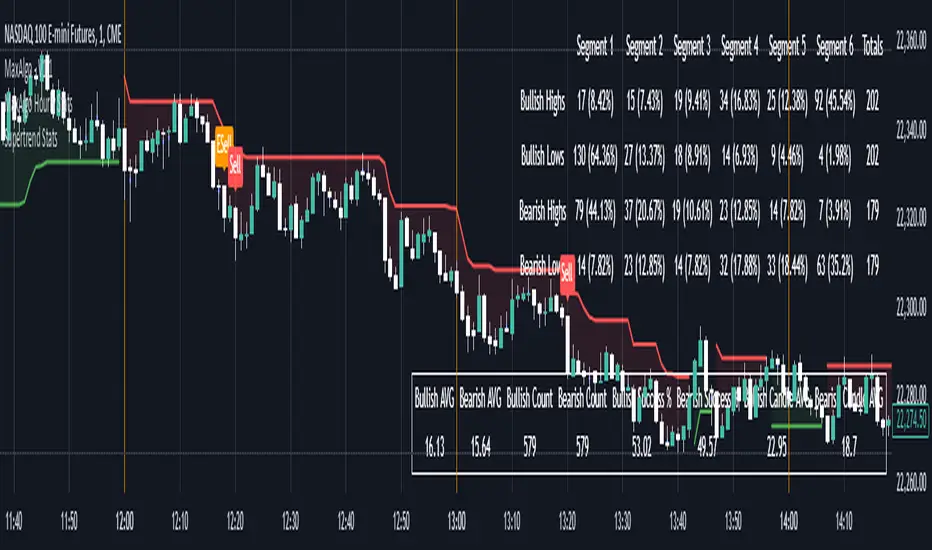
Supertrend StatsSupertrend with Probabilistic Stats and MA Filter
Overview: The Supertrend with Probabilistic Stats and MA Filter is a comprehensive TradingView Pine Script indicator designed to enhance trading strategies by combining the trend-detection capabilities of the Supertrend indicator with the trend-confirmation strength of Moving Averages (MA). Additionally, it offers robust statistical tracking to provide traders with valuable insights into the performance and reliability of their trading signals.
Key Features:
Supertrend Indicator Integration:
Trend Detection: Utilizes the Supertrend algorithm to identify prevailing market trends.
Buy/Sell Signals: Generates clear buy and sell signals based on trend reversals.
Customizable Parameters: Allows adjustment of ATR period and multiplier to suit different trading styles and market conditions.
Visual Aids: Plots Supertrend lines on the chart and highlights trend areas for easy visualization.
Moving Average (MA) Filter:
Trend Confirmation: Filters buy signals to occur only when the open price is above the MA and sell signals only when the open price is below the MA.
Customizable MA Types: Supports various MA types, including SMA, EMA, SMMA (RMA), WMA, and VWMA.
Flexible Configuration: Offers options to enable/disable the MA filter, select MA type, set MA length, and adjust MA source and offset.
Statistical Tracking:
Trimmed Mean Calculation: Computes trimmed means for bullish and bearish movements, removing outliers to provide a more accurate average movement.
Success Rate Metrics: Calculates the success rates (%) for both bullish and bearish signals, indicating the percentage of signals that resulted in favorable price movements.
Candle Count Analysis: Tracks the average number of candles each bullish and bearish move lasts, offering insights into the duration of trends.
Data Visualization: Presents all statistical data in a neatly formatted table on the chart, allowing for quick reference and analysis.
Customizable Statistics Table:
Text Color Customization: Provides an option to change the table text color to match personal preferences or chart aesthetics, enhancing readability.
Comprehensive Metrics: Displays key statistics such as Bullish/Bearish Averages, Counts, Success Rates, and Average Candle Counts.
Optional Pinbar Filtering:
Signal Refinement: Adds an additional layer of signal confirmation by filtering buy and sell signals based on pinbar candlestick patterns.
Adjustable Thresholds: Allows customization of the pinbar wick threshold to fine-tune signal accuracy.
Visual Enhancements:
Markers: Optionally displays markers on the first and last candles of bullish and bearish moves for better trend identification.
Highlighter: Shades the chart background to indicate current trend direction, aiding in visual trend recognition.
How It Works:
Trend Identification with Supertrend:
The indicator calculates the Supertrend based on user-defined ATR periods and multipliers.
It plots the Supertrend lines and generates buy/sell signals when the price crosses these lines, indicating a potential trend reversal.
Filtering Signals with Moving Average:
When the MA filter is enabled, the indicator ensures that buy signals are only considered valid if the candle's open price is above the selected MA, and sell signals only if the open price is below the MA.
This additional confirmation aligns trades with the broader market trend, potentially increasing signal reliability.
Statistical Analysis:
Upon triggering a buy or sell signal, the indicator records the entry price and tracks the subsequent price movements.
It calculates trimmed means to assess average movements while excluding extreme outliers.
Success rates are computed by comparing the closing price against the entry price, indicating how often signals result in favorable outcomes.
The average number of candles per move provides insight into trend duration and volatility.
Visualization and Customization:
All statistical data is presented in a table on the chart, with customizable text colors for enhanced readability.
Optional pinbar filtering and visual markers further refine and illustrate trading signals, aiding in decision-making.
Benefits to Traders:
Enhanced Signal Reliability:
By combining Supertrend with an MA filter, the indicator ensures that only signals aligning with the broader market trend are considered, potentially reducing false signals.
Data-Driven Decision Making:
The comprehensive statistical tracking offers traders insights into the performance of their signals, enabling informed adjustments to their trading strategies based on empirical data.
Trend Confirmation and Alignment:
The MA filter acts as a trend confirmation tool, ensuring that trades are placed in the direction of the prevailing trend, which can enhance the probability of successful trades.
Performance Metrics at a Glance:
The statistics table provides all necessary performance metrics in a single view, allowing traders to quickly assess the effectiveness of their strategy without sifting through extensive data.
Customization and Flexibility:
With options to adjust MA types, lengths, and table text colors, traders can tailor the indicator to fit their specific preferences and trading environments.
Visual Clarity and Aids:
The plotted Supertrend lines, MA line, signal markers, and highlighter enhance visual clarity, making it easier to identify trends and potential trade opportunities on the chart.
Usage Instructions:
Adding the Indicator:
Copy the Script: Select and copy the entire Pine Script provided.
Open TradingView: Navigate to TradingView and open your desired asset's chart.
Access Pine Editor: Click on the Pine Editor tab at the bottom of the TradingView interface.
Paste and Add to Chart: Paste the script into the editor and click "Add to Chart" to apply the indicator.
Configuring Settings:
Supertrend Parameters: Adjust the ATR period and multiplier to suit your trading style and the asset's volatility.
MA Filter Settings:
Enable MA Filter: Toggle "Enable MA Filter?" to ON to activate the filter.
Select MA Type: Choose from SMA, EMA, SMMA (RMA), WMA, or VWMA.
Set MA Length: Define the period for the MA calculation.
MA Source and Offset: Choose the price source (default is close) and set any desired plot offset.
Statistical Tracking:
Trimmed Mean Percentage: Set the percentage to trim outliers in mean calculations.
Show Cross Markers: Toggle to display or hide markers on the first and last candles of bullish and bearish moves.
Table Customization:
Table Text Color: Select your preferred text color for the statistics table to match your chart's theme or enhance readability.
Pinbar Filtering (Optional):
Enable Pinbar Filtering: Toggle to refine signals based on pinbar patterns.
Set Pinbar Wick Threshold: Adjust the threshold to define the characteristics of a valid pinbar.
Interpreting the Indicators:
Buy/Sell Signals: Look for labeled "BUY" and "SELL" signals on the chart that align with Supertrend reversals and MA conditions.
Statistics Table: Refer to the table located at the bottom right of the chart to assess:
Bullish/Bearish Averages: Average price movements following signals.
Counts: Total number of bullish and bearish signals.
Success Rates (%): Percentage of signals that resulted in profitable trades.
Candle Averages: Average duration of bullish and bearish moves in terms of candle counts.
Markers and Highlighter: Utilize visual markers and shaded trend areas to better understand market trends and the context of each signal.
Making Informed Decisions:
Assess Signal Performance: Use the success rates and averages to evaluate the effectiveness of your current settings and make necessary adjustments.
Adjust Parameters: Modify Supertrend and MA parameters based on observed performance and changing market conditions to optimize signal accuracy.
Combine with Other Analysis: Integrate insights from this indicator with other technical analysis tools and fundamental factors to form a holistic trading strategy.
Conclusion: The Supertrend with Probabilistic Stats and MA Filter indicator offers a powerful combination of trend detection, signal filtering, and statistical analysis. By providing detailed performance metrics and ensuring that trades align with the broader market trend, this indicator empowers traders to make more informed, data-driven decisions. Whether you're a novice seeking clarity or an experienced trader aiming to refine your strategy, this tool serves as a valuable asset in your trading toolkit.
If you have any further questions or require additional customizations, feel free to reach out!
Market Structure Algo V2 [OmegaTools]The Market Structure Algo V2 (MS Algo V2) is an advanced TradingView indicator developed by OmegaTools to provide traders with a comprehensive analysis of market structure. This tool refines the insights provided by its predecessor, combining enhanced pivot point analysis, dynamic market structure scoring, and zone visualization to deliver an intuitive view of potential market movements. Through custom settings, the MS Algo V2 allows users to tailor the indicator to fit their trading strategies more closely, offering enhanced adaptability to both short-term and long-term trends.
Core Functionality
The MS Algo V2 differentiates between internal and external market structures by analyzing pivot highs and lows over user-defined periods. The internal market structure focuses on shorter timeframes, providing insights into recent price action, while the external structure considers broader trends. This dual-layered approach helps traders distinguish between immediate and overarching market trends.
The indicator introduces improved visualization for areas of interest or zones around pivot points, adjustable through zone distance settings. These zones serve as potential support and resistance areas, helping traders anticipate price reactions at key levels. In addition to the zones, the indicator now provides gradient-based color coding on bars, reflecting the market structure’s bullish or bearish intensity. This visual enhancement aids in quickly interpreting the current trend's strength.
Dynamic signal generation has been refined in MS Algo V2. The indicator now offers both classic signals and breakout signals based on the market structure, including entries, exits, and change-of-character (CHoCH) alerts. Signals are generated based on price interactions with pivot levels, indicating potential long and short opportunities.
Operational Mechanism
The MS Algo V2 calculates pivot highs and lows over specified periods to define internal and external market structures. A market structure score is derived from these pivot points, classifying the market into bullish or bearish extremes. Signals are generated as the closing price interacts with these levels, marking entry and exit points based on the calculated structure.
A new feature in this version is zone visualization, where zones are plotted around a dynamic moving average derived from the exponential and simple moving averages (EMA and SMA). The zones are adjusted based on ATR (Average True Range) and the specified zone distance percentile, providing a clear visual representation of potential support and resistance regions. The external and internal zones are represented with different levels of transparency for quick reference.
Usage Guidelines
To apply the MS Algo V2 to your TradingView charts, adjust the internal and external market structure settings to match your preferred analysis timeframes. The line style and width of each structure can also be customized for a tailored view. The Zone Distance setting allows users to define the percentile range of the zones around the moving average, providing further flexibility in identifying potential areas of support and resistance.
For a color-coded overview of market sentiment, the bar gradient feature can be enabled. This option uses a gradient that reflects the bullish or bearish intensity of the market structure, giving traders a visual cue on the market’s overall trend. Color-coded signals and zone fill areas further assist in interpreting the current market structure and identifying potential trade areas.
The indicator includes customizable alerts for long and short signals, as well as specific breakout alerts (BOS) and change-of-character (CHoCH) signals. These alerts can help traders stay informed about significant market structure changes, supporting timely trading decisions.
Understanding the Indicator’s Originality
The MS Algo V2 stands out due to its robust integration of pivot analysis, zone visualization, and market structure scoring, offering a unique perspective on market dynamics. With features like color-coded signals, bar gradients, and configurable alerts, MS Algo V2 provides an edge in understanding both the current market environment and potential turning points. This indicator’s ability to represent the market’s structure visually makes it a powerful addition to any trader’s toolkit, especially for those seeking a deeper, multi-layered approach to market analysis.

Market Structure MTF"Market Structure MTF" is designed to help traders analyze and visualize market structures across up to three different timeframes. It allows users to customize various parameters such as period length, label size, and colors for different elements. The indicator identifies and tracks key market structure components, such as highs and lows, break of structure, and displays this information directly on the chart. It is also useful when studying Algo Trade concepts.
Additionally, it includes a table summarizing trends and providing the efficiency of the latest market data for each timeframe.
Recommended Settings
If you're new to this indicator, it's recommended to start with a single timeframe to become familiar with its functionality.
Once comfortable, you can use the following timeframes:
Base Timeframe : 15 minutes
Secondary Timeframe : 1 hour
Tertiary Timeframe : 4 hours
Another example setup could be:
Base Timeframe : 1 hour
Secondary Timeframe : 4 hours
Tertiary Timeframe : 1 day
Important Notes
Multiples of Base Timeframe : Ensure that the secondary and tertiary timeframes are multiples of the base timeframe. This ensures consistency and accuracy in analysis.
Display Order : It is recommended to display the timeframes in the correct order, with the current timeframe displayed on top of the previous ones.
Customization : You can customize the period length, label size, shapes, and colors to match your preferences.
Market Structure Elements : The indicator tracks key market structure elements such as highs and lows, which are crucial for understanding market trends and potential reversal points.
Trend Summary Table : The included table summarizes trends and provides an overview of the latest market data, helping you make informed trading decisions. The "Efficiency" column shows whether the latest structure is IPA (Inefficient Price Action) or EPA (Efficient Price Action).

MTF Breaker Blocks [SMRT Algo]The SMRT Algo Breaker Blocks (BBs) indicator offers an advanced methodology for traders by highlighting breaker blocks, a critical concept in technical analysis that indicates potential areas of support and resistance. This indicator not only identifies these key zones but also integrates breakout signals and premium/discount swing levels to guide traders in setting take profit and stop loss targets. The system includes customizable alerts for each signal, ensuring that traders are promptly notified of important market events.
Breaker blocks are identified after a mitigated order block, which signifies a change in polarity—where a previous resistance turns into support or vice versa (or previous demand turned supply).
The indicator uses price action analysis to determine these zones, which are crucial for identifying potential reversal points or continuation patterns. By focusing on these areas, traders can anticipate where significant price reactions are likely to occur.
Features:
Bullish Breaker Blocks: A bullish BB is generated when a previous supply zone is broken. This setup indicates that the market may be transitioning from a downtrend to an uptrend.
Bearish Breaker Blocks: A bearish BB is created when a previous demand zone is broken, thus creating a new bearish BB. This scenario suggests a potential shift from an uptrend to a downtrend.
Sensitivity: Traders can adjust the indicator’s sensitivity, influencing how it detects swings and constructs breaker blocks. Higher sensitivity results in shorter-term breaker blocks, while lower sensitivity focuses on longer-term BBs.
Alerts: Alerts can be configured for each signal type, ensuring that traders are notified of potential opportunities in real time.
Traders can utilize Breaker Block (BB) zones in multiple strategic ways to enhance their trading decisions:
Profit Targets: BB zones can serve as predefined areas where traders look to take profits. Since these zones represent significant levels of potential support or resistance, they are logical points where the price might reverse or consolidate. By targeting these zones, traders can set realistic and strategic exit points that align with the market's natural behavior, thereby optimizing their profit-taking strategy.
Risk Management: Using BB zones for profit targets also assists in managing risk, as it allows traders to plan their trades with a clear understanding of where they expect the market to move. This foresight helps in setting stop-loss levels relative to the BB zones, creating a balanced risk-reward profile for each trade.
Entry Points & Anticipating Reversals: BB zones are ideal entry points for trades because they highlight areas where a change in price direction is likely. Traders can enter long positions near a BB zone acting as support or short positions near a BB zone acting as resistance. This approach leverages the natural tendency of prices to respect these significant levels, increasing the probability of entering a trade just as the market begins to move in the desired direction.
Confirmation with Additional Indicators: While BB zones can be strong standalone signals, their effectiveness can be further enhanced when used in conjunction with other technical indicators, such as moving averages, RSI, or MACD. This combined approach can provide additional confirmation and improve the reliability of the entry signals, making it a versatile tool in a trader's arsenal.
Inputs:
Timeframe: Changes the Breaker Block timeframe
Sensitivity: Adjust the sensitivity of the BB zones. A smaller value will lead to fewer zones generated on the chart, and a higher value will lead to more zones shown.
Width: Adjust the width (size) of the zones. A smaller value will result in smaller zones, while a larger value will result in larger zones.
Color: Freely adjust the color of bullish and bearish breaker blocks.
Breaker Block Length: Adjust the offset (to the right) of the breaker block zones.
Timeframe Label: The timeframe label is displayed on the top right corner, and can be turned on/off. It shows the timeframe of the MTF Breaker Block. The position and size of the label can also be adjusted.
By incorporating BB zones into their trading strategy, traders can develop a more structured and disciplined approach to both entering and exiting trades, leveraging the unique characteristics of these zones to optimize their trading outcomes.
These components collectively create a system for identifying and trading market reversals and continuations. The breaker blocks provide a structural basis, highlighting areas of potential price reaction.
SMRT Algo’s proprietary approach to identifying and confirming breaker blocks, coupled with our comprehensive alert system, offers a significant edge over standard indicators. This indicator not only provides signals but also embeds a complete trading framework, guiding users through both entry and exit processes with built-in risk management.
Multi-Timeframe Breaker Blocks by SMRT delivers precise and actionable insights making it a valuable asset for serious traders. Traders receive a tool that is both powerful and user-friendly, capable of enhancing their trading performance and decision-making process.
The SMRT Algo Suite offers a comprehensive set of tools and features that extend beyond the capabilities of standard or open-source indicators, providing significant additional value to users.
SMRT Algo Suite includes:
Advanced Customization: Users can customize various aspects of the indicator, such as toggling the confirmation signals on or off and adjusting the parameters of the MA Filter. This customization enhances the adaptability of the tool to different trading styles and market conditions.
Enhanced Market Understanding: The combination of pullback logic, dynamic S/R zones, and MA filtering offers traders a nuanced understanding of market dynamics, helping them make more informed trading decisions.
Unique Features: The specific combination of pullback logic, dynamic S/R, and multi-level TP/SL management is unique to SMRT Algo, offering features that are not readily available in standard or open-source indicators.
Educational and Support Resources: As with other tools in the SMRT Algo suite, this indicator comes with comprehensive educational resources and access to a supportive trading community, as well as 24/7 Discord support.
The educational resources and community support included with SMRT Algo ensure that users can maximize the indicators’ potential, offering guidance on best practices and advanced usage.
SMRT Algo believe that there is no magic indicator that is able to print money. Indicator toolkits provide value via their convinience, adaptibility and uniqueness. Combining these items can help a trader make more educated; less messy, more planned trades and in turn hopefully help them succeed.
RISK DISCLAIMER
Trading involves significant risk, and most day traders lose money. All content, tools, scripts, articles, and educational materials provided by SMRT Algo are intended solely for informational and educational purposes. Past performance is not indicative of future results. Always conduct your own research and consult with a licensed financial advisor before making any trading decisions.

MACD [SMRT Algo]The SMRT Algo MACD is a refined version of the traditional Moving Average Convergence Divergence (MACD) indicator, designed to offer traders a smoother and more reliable trend-following tool. Unlike the standard MACD, which focuses on crossovers between the fast and slow moving averages, the SMRT Algo MACD emphasizes the histogram, minimizing the sensitivity to sudden price changes. This approach allows traders to stay in trades longer, capturing more of the trend and reducing the noise that can lead to premature exits.
Core Features:
Histogram Focused Analysis:
The SMRT Algo MACD does not display the fast and slow-moving averages or their crossovers. Instead, it focuses solely on the MACD histogram, which provides a clearer and more stable indication of trend direction and strength. By removing the emphasis on crossovers, the indicator reduces the impact of short-term price fluctuations, allowing traders to maintain their positions through minor market corrections.
Reduced Sensitivity to Price Fluctuations:
One of the standout features of the SMRT Algo MACD is its reduced sensitivity to sudden price changes. In traditional MACD indicators, the frequent crossovers and histogram shifts can often result in traders exiting positions too early during a trend. The SMRT Algo MACD addresses this issue by smoothing the histogram, leading to fewer and more significant changes. This reduction in sensitivity helps traders remain in their trades longer, capturing larger portions of sustained trends without being shaken out by temporary pullbacks.
Trend Continuation and Profit-Taking Signals:
The SMRT Algo MACD is also a valuable tool for identifying potential profit-taking areas. When the histogram changes color—from blue (bullish) to red (bearish), or vice versa—it can signal a potential area to consider taking profits. For instance, during a bullish trend, if the histogram shifts from blue to red, it might indicate that the uptrend is weakening, suggesting a possible exit point for long positions. Conversely, a change from red to blue during a bearish trend could signal a weakening downtrend, offering an opportunity to close short positions.
Staying in Trends Longer:
By minimizing the frequency of histogram changes and eliminating the fast/slow line crossovers, the SMRT Algo MACD helps traders stay in trends longer. This feature is particularly beneficial during trending markets, where the ability to maintain a position through minor corrections can significantly enhance overall profitability. Traders can confidently hold their trades, knowing that the indicator is designed to filter out the noise and focus on the broader trend direction.
The SMRT Algo MACD’s components work together to provide a more stable and reliable trend-following tool. The focus on the histogram reduces the impact of short-term fluctuations, while the reduced sensitivity ensures that traders can maintain their positions through market noise.
The indicator's ability to signal potential profit-taking areas based on histogram color changes adds another layer of utility, helping traders to maximize their gains while managing risk effectively.
Unlike traditional MACD indicators that can be overly sensitive to minor price changes, the SMRT Algo MACD provides a smoother, more reliable signal that helps traders stay in trends longer. This refinement is particularly valuable in volatile markets, where maintaining a position through temporary corrections can make a significant difference in overall profitability.
The focus on histogram analysis, combined with the elimination of fast/slow line crossovers, sets the SMRT Algo MACD apart from standard MACD tools. This approach not only reduces noise but also enhances the trader’s ability to capture extended trends, making it a powerful addition to any trading strategy. The inclusion of clear, actionable profit-taking signals based on histogram color changes further enhances the indicator's utility.
The SMRT Algo Suite, which the SMRT Algo MACD is a part of, offers a comprehensive set of tools and features that extend beyond the capabilities of standard or open-source indicators, providing significant additional value to users.
What you also get with the SMRT Algo Suite:
Advanced Customization: Users can customize various aspects of the indicator, such as toggling the confirmation signals on or off and adjusting the parameters of the MA Filter. This customization enhances the adaptability of the tool to different trading styles and market conditions.
Enhanced Market Understanding: The combination of pullback logic, dynamic S/R zones, and MA filtering offers traders a nuanced understanding of market dynamics, helping them make more informed trading decisions.
Unique Features: The specific combination of pullback logic, dynamic S/R, and multi-level TP/SL management is unique to SMRT Algo, offering features that are not readily available in standard or open-source indicators.
Educational and Support Resources: As with other tools in the SMRT Algo suite, this indicator comes with comprehensive educational resources and access to a supportive trading community, as well as 24/7 Discord support.
The educational resources and community support included with SMRT Algo ensure that users can maximize the indicators’ potential, offering guidance on best practices and advanced usage.
SMRT Algo believe that there is no magic indicator that is able to print money. Indicator toolkits provide value via their convenience, adaptability and uniqueness. Combining these items can help a trader make more educated; less messy, more planned trades and in turn hopefully help them succeed.
RISK DISCLAIMER
Trading involves significant risk, and most day traders lose money. All content, tools, scripts, articles, and educational materials provided by SMRT Algo are intended solely for informational and educational purposes. Past performance is not indicative of future results. Always conduct your own research and consult with a licensed financial advisor before making any trading decisions.

GannLSVZO Indicator [Algo Alert]The Volume Zone oscillator breaks up volume activity into positive and negative categories. It is positive when the current closing price is greater than the prior closing price and negative when it's lower than the prior closing price. The resulting curve plots through relative percentage levels that yield a series of buy and sell signals, depending on level and indicator direction.
The Gann Laplace Smoothed Volume Zone Oscillator GannLSVZO is a refined version of the Volume Zone Oscillator, enhanced by the implementation of the upgraded Discrete Fourier Transform, the Laplace Stieltjes Transform. Its primary function is to streamline price data and diminish market noise, thus offering a clearer and more precise reflection of price trends.
By combining the Laplace with Gann Swing Entries and Exits (orange X) and with Ehler's white noise histogram, users gain a comprehensive perspective on volume-related market conditions.
HOW TO USE THE INDICATOR:
The default period is 2 but can be adjusted after backtesting. (I suggest 5 VZO length and NoiceR max length 8 as-well)
The VZO points to a positive trend when it is rising above the 0% level, and a negative trend when it is falling below the 0% level. 0% level can be adjusted in setting by adjusting VzoDifference. Oscillations rising below 0% level or falling above 0% level result in a natural trend.
ORIGINALITY & USFULLNESS:
Personal combination of Gann swings and Laplace Stieltjes Transform of a price which results in less noise Volume Zone Oscillator.
The Laplace Stieltjes Transform is a mathematical technique that transforms discrete data from the time domain into its corresponding representation in the frequency domain. This process involves breaking down a signal into its individual frequency components, thereby exposing the amplitude and phase characteristics inherent in each frequency element.
This indicator utilizes the concept of Ehler's Universal Oscillator and displays a histogram, offering critical insights into the prevailing levels of market noise. The Ehler's Universal Oscillator is grounded in a statistical model that captures the erratic and unpredictable nature of market movements. Through the application of this principle, the histogram aids traders in pinpointing times when market volatility is either rising or subsiding.
The Gann swings and the Gan swing strategy is developed by meomeo105, this Gann high and low algorithm forms the basis of the EMA modification.
DETAILED DESCRIPTION:
My detailed description of the indicator and use cases which I find very valuable.
What is oscillator?
Oscillators are chart indicators that can assist a trader in determining overbought or oversold conditions in ranging (non-trending) markets.
What is volume zone oscillator?
Price Zone Oscillator measures if the most recent closing price is above or below the preceding closing price.
Volume Zone Oscillator is Volume multiplied by the 1 or -1 depending on the difference of the preceding 2 close prices and smoothed with Exponential moving Average.
What does this mean?
If the VZO is above 0 and VZO is rising. We have a bullish trend. Most likely.
If the VZO is below 0 and VZO is falling. We have a bearish trend. Most likely.
Rising means that VZO on close is higher than the previous day.
Falling means that VZO on close is lower than the previous day.
What if VZO is falling above 0 line?
It means we have a high probability of a bearish trend.
Thus the indicator returns 0 and Strategy closes all it's positions when falling above 0 (or rising bellow 0) and we combine higher and lower timeframes to gauge the trend.
What is approximation and smoothing?
They are mathematical concepts for making a discrete set of numbers a
continuous curved line.
Laplace Stieltjes Transform approximation of a close price are taken from aprox library.
Key Features:
You can tailor the Indicator/Strategy to your preferences with adjustable parameters such as VZO length, noise reduction settings, and smoothing length.
Volume Zone Oscillator (VZO) shows market sentiment with the VZO, enhanced with Exponential Moving Average (EMA) smoothing for clearer trend identification.
Noise Reduction leverages Euler's White noise capabilities for effective noise reduction in the VZO, providing a cleaner and more accurate representation of market dynamics.
Choose between the traditional Fast Laplace Stieltjes Transform (FLT) and the innovative Double Discrete Fourier Transform (DTF32) soothed price series to suit your analytical needs.
Use dynamic calculation of Laplace coefficient or the static one. You may modify those inputs and Strategy entries with Gann swings.
I suggest using "Close all" input False when fine-tuning Inputs for 1 TimeFrame. When you export data to Excel/Numbers/GSheets I suggest using "Close all" input as True, except for the lowest TimeFrame. I suggest using 100% equity as your default quantity for fine-tune purposes. I have to mention that 100% equity may lead to unrealistic backtesting results. Be avare. When backtesting for trading purposes use Contracts or USDT.

MTF Supply & Demand [SMRT Algo] The SMRT Algo Multi-Timeframe Supply & Demand indicator is a powerful tool designed to help traders identify key supply and demand zones across multiple timeframes on their charts without switching the chart timeframe. This indicator simplifies the process of analyzing higher timeframe zones by allowing users to adjust the timeframe settings within the indicator itself, eliminating the need to switch between different chart timeframes. This flexibility makes it easier for traders to incorporate higher timeframe analysis into their trading strategy, enhancing their ability to identify optimal entry and exit points.
Core Features
Supply and Demand Zones Identification:
The indicator automatically identifies and highlights supply and demand zones on the chart, which are critical areas where the market is likely to reverse or experience significant price movement. These zones represent areas of strong buying (demand) or selling (supply) pressure, making them key levels for potential trade setups. The clear visualization of these zones on the chart helps traders quickly identify important price levels without manual analysis.
Multi-Timeframe Functionality:
One of the standout features of the SMRT Algo Multi-Timeframe Supply & Demand indicator is its ability to display supply and demand zones from other timeframes directly on the current chart. Traders can adjust the timeframe of the supply and demand zones through the indicator settings, allowing them to view and analyze higher timeframe zones without switching between different charts. This feature is particularly useful for traders who rely on higher timeframe analysis to make more informed trading decisions.
Customizable Timeframe Settings:
The indicator provides a high degree of customization, allowing users to select the specific timeframe from which they want to view supply and demand zones. Whether a trader prefers to analyze daily, weekly, or even monthly zones while trading on a lower timeframe, this indicator accommodates their needs. This flexibility helps traders align their strategies with broader market trends, ensuring they are aware of significant supply and demand levels across different timeframes.
Potential Entry and Take Profit Zones:
The supply and demand zones identified by the indicator can be used as potential entry points for trades or as take profit zones. Traders can enter long positions near demand zones, where buying pressure is expected to push prices higher, or enter short positions near supply zones, where selling pressure might drive prices lower. Additionally, these zones can serve as logical areas to take profits, as they represent levels where the market is likely to encounter resistance or support.
The identification of supply and demand zones serves as the foundation for potential trade setups, while the multi-timeframe functionality enhances the depth of analysis by allowing traders to view higher timeframe zones without leaving their current chart. This combination ensures that traders can maintain a clear understanding of significant market levels across different timeframes, enabling them to make more informed and strategic trading decisions.
Inputs:
Timeframe: Choose the timeframe for the supply-demand zones shown on the chart.
Sensitivity: Adjust the sensitivity of the S/D zones. A smaller value will lead to fewer zones generated on the chart, while a larger value will lead to more zones shown.
Width: Adjust the width (size) of the zones. A smaller value will result in smaller zones, while a larger value will result in larger zones.
Supply/Demand Color: Freely adjust the colors of the supply-demand zones.
Zones Offset: This affects the extension of the zones (i.e. many bars to the right).
Timeframe Label: The timeframe label is displayed on the top right corner, and can be turned on/off. It displays the timeframe of the MTF Supply Demand. The position and size of the label can also be adjusted.
The ability to view and adjust supply and demand zones from multiple timeframes directly within the indicator settings offers a significant advantage, providing traders with a more comprehensive view of the market.
This indicator is particularly valuable for traders who utilize multi-timeframe analysis as part of their strategy, offering them the ability to stay aware of critical levels across different timeframes without the hassle of constantly switching charts. The customizable nature of the indicator further enhances its utility, making it a versatile tool that can be tailored to suit various trading styles and preferences.
The SMRT Algo Suite, which the SMRT Algo MTF Supply Demand indicator is a part of, offers a comprehensive set of tools and features that extend beyond the capabilities of standard or open-source indicators, providing significant additional value to users.
What you also get with the SMRT Algo Suite:
Advanced Customization: Users can customize various aspects of the indicator, such as toggling the confirmation signals on or off and adjusting the parameters of the MA Filter. This customization enhances the adaptability of the tool to different trading styles and market conditions.
Enhanced Market Understanding: The combination of pullback logic, dynamic S/R zones, and MA filtering offers traders a nuanced understanding of market dynamics, helping them make more informed trading decisions.
Unique Features: The specific combination of pullback logic, dynamic S/R, and multi-level TP/SL management is unique to SMRT Algo, offering features that are not readily available in standard or open-source indicators.
Educational and Support Resources: As with other tools in the SMRT Algo suite, this indicator comes with comprehensive educational resources and access to a supportive trading community, as well as 24/7 Discord support.
The educational resources and community support included with SMRT Algo ensure that users can maximize the indicators’ potential, offering guidance on best practices and advanced usage.
SMRT Algo believe that there is no magic indicator that is able to print money. Indicator toolkits provide value via their convenience, adaptability and uniqueness. Combining these items can help a trader make more educated; less messy, more planned trades and in turn hopefully help them succeed.
RISK DISCLAIMER
Trading involves significant risk, and most day traders lose money. All content, tools, scripts, articles, and educational materials provided by SMRT Algo are intended solely for informational and educational purposes. Past performance is not indicative of future results. Always conduct your own research and consult with a licensed financial advisor before making any trading decisions.

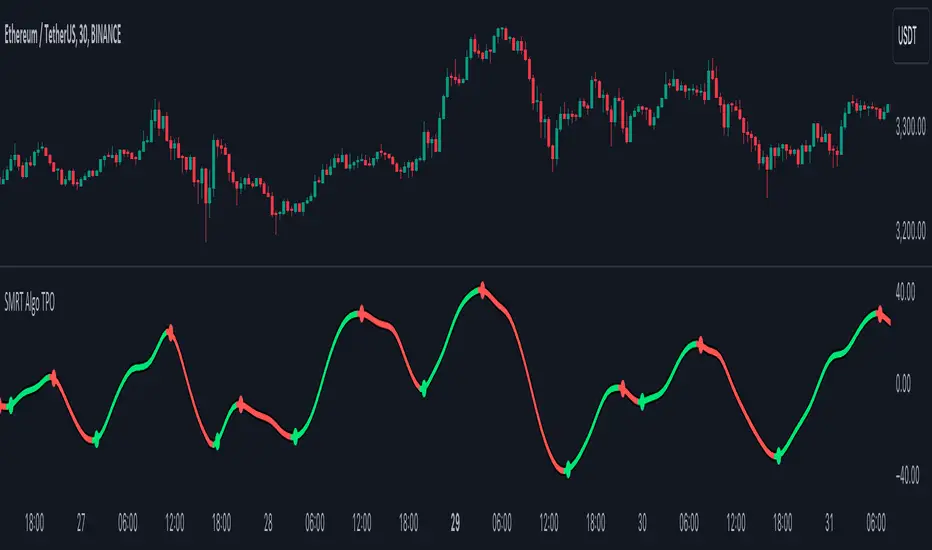
Trend Pivot Oscillator [SMRT Algo]The TPO (Trend Pivot Oscillator) is a powerful tool designed to help traders identify overbought and oversold conditions in the market, as well as pinpoint potential reversal points. This oscillator provides clear visual cues in the form of green and red dots, signaling potential buying and selling opportunities, respectively. The TPO is particularly useful for traders looking to fine-tune their entry points by identifying re-entry opportunities in trending markets.
Core Features:
Overbought and Oversold Zones:
- The TPO is engineered to detect when the market reaches overbought or oversold levels, which are critical areas for potential reversals. These zones are identified by the oscillator, which then generates visual signals to alert traders of possible shifts in market direction. By focusing on these key levels, the TPO helps traders avoid entering trades during extended trends and instead capitalize on market corrections.
Green and Red Dots:
- Green Dot: Indicates that the market may be entering an oversold condition, suggesting a potential buying opportunity. This signal helps traders identify when it may be advantageous to initiate a long position or re-enter an existing one.
- Red Dot: Indicates that the market may be entering an overbought condition, suggesting a potential selling opportunity. This helps traders in identifying optimal points to initiate short positions or take profits on existing long trades.
Re-Entry Identification:
- One of the primary uses of the TPO is to find re-entry points within an existing trend. When the oscillator turns red in an uptrend, it may signal a short-term pullback or consolidation phase, providing an opportunity to re-enter a long position at a more favorable price. Similarly, when the oscillator turns green in a downtrend, it may indicate a brief correction, offering a chance to re-enter a short position. This feature is particularly valuable for traders who want to add to their positions or refine their entry timing.
The green/red TPO dots can also be used as potential take profit areas, as it represents potential key levels in price.
The TPO's components work in unison to provide a clear and actionable trading strategy. By identifying overbought and oversold zones, the oscillator sets the stage for potential reversals, while the green and red dots provide specific entry signals that align with these market conditions. The simplicity of the signals ensures that traders can quickly assess market conditions and make informed decisions about when to enter or exit trades. The focus on re-entry opportunities within trends adds an extra layer of utility, making the TPO a versatile tool for both trend-following and counter-trend strategies.
Inputs:
S : Affects the sensitivity for calculating the short TPO signals.
L : Affects the sensitivity for calculating long TPO signals.
Default settings are recommended.
The SMRT Algo Suite, which the SMRT Algo Trend Pivot Oscillator is a part of, offers a comprehensive set of tools and features that extend beyond the capabilities of standard or open-source indicators, providing significant additional value to users.
What you also get with the SMRT Algo Suite:
Advanced Customization: Users can customize various aspects of the indicator, such as toggling the confirmation signals on or off and adjusting the parameters of the MA Filter. This customization enhances the adaptability of the tool to different trading styles and market conditions.
Enhanced Market Understanding: The combination of pullback logic, dynamic S/R zones, and MA filtering offers traders a nuanced understanding of market dynamics, helping them make more informed trading decisions.
Unique Features: The specific combination of pullback logic, dynamic S/R, and multi-level TP/SL management is unique to SMRT Algo, offering features that are not readily available in standard or open-source indicators.
Educational and Support Resources: As with other tools in the SMRT Algo suite, this indicator comes with comprehensive educational resources and access to a supportive trading community, as well as 24/7 Discord support.
The educational resources and community support included with SMRT Algo ensure that users can maximize the indicators’ potential, offering guidance on best practices and advanced usage.
SMRT Algo believe that there is no magic indicator that is able to print money. Indicator toolkits provide value via their convenience, adaptability and uniqueness. Combining these items can help a trader make more educated; less messy, more planned trades and in turn hopefully help them succeed.
RISK DISCLAIMER
Trading involves significant risk, and most day traders lose money. All content, tools, scripts, articles, and educational materials provided by SMRT Algo are intended solely for informational and educational purposes. Past performance is not indicative of future results. Always conduct your own research and consult with a licensed financial advisor before making any trading decisions.
Pro V3 [SMRT Algo]SMRT Algo Suite is a versatile toolkit featuring advanced features designed to deliver valuable signals and insights, catering to every trader's technical analysis requirements with precise data.
The SMRT Algo V3 represents a groundbreaking, comprehensive solution built from the ground up for traders.
While SMRT Algo can complement other technical analysis methods, it is also designed to function effectively as a standalone indicator adaptable to any trading style. Each feature is designed with the understanding that not all technical indicators suit every market condition.
The optimal approach to leveraging this indicator is to explore its diverse features gradually, select a few that best match your trading style, and use them consistently to develop a personalized SMRT Algo strategy.
Features:
Buy & Sell Signals: Clear buy and sell signals displayed on the chart, with ‘+’ indicating strong signals and normal signals without ‘+’.
Candle Coloring: Blue and red candle colors to signify bullish and bearish trends, respectively.
Signal Sensitivity: Adjust the frequency of signals to match your trading preferences.
MA Filter: Customizable moving average filter to ensure trades align with the prevailing trend.
Dashboard: Multi-timeframe analysis with information on various timeframes, offering quick decision-making capabilities and a customizable dashboard size.
Trailing Stop Loss: Suggestions for trailing stop losses to maximize profits while minimizing risk.
Power MA: A custom moving average that closely follows price, highlighting short-term market trends.
ChoCh/Bos: Displays internal market structure, including changes of character and breaks of structure.
Market Structure: Shows external market structure, detailing changes of character, breaks of structure, and pivot points.
Support & Resistance: Key support and resistance zones plotted on the chart.
Reversals: Highlights areas with a high likelihood of reversal using diamond markers.
Reversal Bands: Zones where price is likely to reverse or correct.
Trend Lines: Auto-plotted trendlines for quick and easy analysis.
Retest Zones: Ideal for break-and-retest traders, identifying key retest zones for entries and re-entries
Take Profit & Stop Loss: Customizable take profit and stop loss points.
Full Any Alert() Function Call Conditions: Create custom alerts directly to your TradingView device for timely notifications.
Additional features: A set of toggles turning on/off these indicators.
SMRT Algo Pro V3 offers a comprehensive set of features designed to enhance your trading experience by providing actionable insights and customizable tools for all trading styles.
SMRT Algo Pro V3 Confirmation Signals and Candle Coloring
The signals in SMRT Algo Pro V3 can generate both normal and strong labels, with strong signals marked by the "+" symbol. These signals are closely linked to the candle coloring, providing a visual representation of trend development to help navigate various market conditions effectively.
Candle Coloring:
Blue Candles: Indicate bullish trends.
Red Candles: Indicate bearish trends.
Candles will turn blue when there is a buy signal, and turn red when there is a sell signal.
The candle coloring is especially useful when interpreting signals. For instance, a consistent series of blue candles alongside buy signals suggests a strong uptrend, reducing the likelihood of a fake-out. Conversely, a series of red candles with sell signals indicates a strong downtrend.
Dashboard for Multi-Timeframe Analysis
The dashboard provides a consolidated view of multiple timeframes, helping traders make quick decisions based on comprehensive data. This feature reduces the need to switch between charts, streamlining the analysis process.
The dashboard will show the trend of higher timeframes, based on signal calculation and the trend filter.
Note on the dashboard: To reduce memory load, it will only display information from the current timeframe and up.
Trailing Stop Loss
This component workw to maximize profits and manage risk. The Trailing Stop Loss feature provides dynamic stop loss levels. Traders can use this feature to place their stop loss in profit while price goes in favor of your direction, so that less profit is left on the table, should the trade reverse against you.
Green trailing stop loss ranges are shown for buy trades, while red lines are shown for sell trades. This can be used together with the buy & sell signals to trail the stop loss for those trades.
Power MA
The Power MA follows the price closely, indicating short-term market trends and potential exit points. Traders can use the Power MA to determine when to enter a trade. For example, if the Pro V3 prints a buy signal, but the power MA is red (indicating that the market is short term bearish), it can act as a confirmation to stay out of that trade. Conversely, if the power MA is blue, then it can be an added confirmation to enter the buy trade based on the signals.
Market Structure
The inclusion of ChoCh/Bos (Change of Character and Break of Structure) helps traders understand internal and external market shifts. The ChoCh/Bos shows internal market structure, while the Market Structure feature shows the external market structure. This feature is crucial for identifying key turning points and potential trend continuations, as well as ICT traders.
We recommend traders to use this as an added confirmation, for example, once a buy signal is printed, wait for an internal or external Choch/BOS, possibly indicating that the market is now in control of the bulls. From there traders an either enter off another signal from the V3 or wait for the retest from the Retest Zones feature of the V3.
Support & Resistance, Reversals, and Reversal Bands
These features highlight critical market levels and areas where price is likely to reverse or correct. They are essential for traders looking to capitalize on key support and resistance zones or potential reversal points.
They can be used together with the buy & sell signals. An example is when a sell signal appears, we can look for potential trade exits either at the S/R zones, the reversal diamonds that are printed on the candle, or when price touches the reversal bands.
Trend Lines
Auto-plotted trend lines and the trend ribbon provide insights into longer-term trends. They can be used together with the buy sell features of the V3, e.g. if a sell signal is printed, but price is in the lower half of the trend lines, we can assume that price is in an area of premium for our short trade. Traders can choose whether to wait for price to retrace back into an area of discount (top half of the trend line), where they can look to short.
Retest Zones
The Retest Zones feature identifies optimal entry and re-entry points for break-and-retest strategies. As mentioned earlier, this feature can be used together with other features to act as a re-entry or further confirmation before entering a trade.
Traders can wait for a signal to be printed by the V3, and wait for further confrirmation from the retest zones to enter at a better price. This feature can be used together with the signals, and the market structure features to create a simple break & retest strategy.
Take Profit Modes:
SMRT Algo Pro V3 includes a versatile Take Profit Mode designed to help traders optimize their exits:
Hybrid Mode: Displays Take Profit, entry, and stop loss lines on the chart for the current position. Additionally, small circles labeled TP1, TP2, and TP3 indicate the points where take profit levels were hit.
Minimal Mode: Only displays the small circles labeled TP1, TP2, and TP3, providing a cleaner chart view while still indicating take profit hits.
Traditional Mode Only: Displays only the lines for Take Profit, entry, and stop loss, without the small circles.
Take profits are based off of 1:1, 1:2 and 1:3 risk to reward ratio with respect to the stop loss.
These modes offer flexibility for traders to choose their preferred level of detail on the chart, helping them to manage their trades effectively and track their take profit levels clearly.
The features of SMRT Algo Pro V3 can significantly strengthen your market analysis by providing additional confluences. These features allow traders to cross-verify signals and trends, making their strategies more robust and reliable. Here's how you can leverage these features:
SMRT Algo Pro V3 offers a comprehensive suite of tools and features that extend beyond the capabilities of standard or open-source indicators, providing significant additional value to users.
Integrated System: Unlike basic or open-source tools that may require multiple installations and configurations, SMRT Algo Pro V3 combines all necessary indicators into a cohesive system.
Advanced Customization: The toolkit offers extensive customization options, including signal sensitivity adjustments, customizable MA Filters, and various Take Profit Modes. These features allow traders to tailor the system to their specific trading styles and risk tolerance, providing a level of personalization that free tools often lack.
Real-Time Market Adaptation: SMRT Algo Pro V3 includes features like a deep learning dashboard and real-time market data integration, which continuously update and adapt to changing market conditions. This ensures that users receive the most current and relevant signals, enhancing decision-making accuracy.
Educational Support: Alongside the tools, SMRT Algo provides comprehensive educational resources and tutorials, helping traders understand how to effectively use the system and develop robust trading strategies. This educational aspect adds significant value, especially for beginners looking to deepen their knowledge.
Comprehensive Analysis Tools: The inclusion of multi-timeframe analysis, a detailed dashboard, and advanced market structure indicators help traders make more informed decisions by offering a complete picture of market dynamics.
Support and Community: Subscribers to SMRT Algo Pro V3 gain access to dedicated 24/7 support and an active trading community. This support network can be invaluable for troubleshooting, strategy development, and gaining insights from other experienced traders.
SMRT Algo believe that there is no magic indicator that is able to print money. Indicator toolkits provide value via their convinience, adaptibility and uniqueness. Combining these items can help a trader make more educated; less messy, more planned trades and in turn hopefully help them succeed.
RISK DISCLAIMER
Trading involves significant risk, and most day traders lose money. All content, tools, scripts, articles, and educational materials provided by SMRT Algo are intended solely for informational and educational purposes. Past performance is not indicative of future results. Always conduct your own research and consult with a licensed financial advisor before making any trading decisions.

DeQuex Algo BISTIntroduction:
The DeQuex Algo is an advanced technical analysis tool designed to help traders identify high-probability entry and exit points in the Borsa Istanbul (BIST) market. This updated version incorporates an adaptive MACD to reduce false signals and improve the overall reliability of the indicator.
Key Features:
1. Adaptive MACD: The script utilizes an adaptive MACD that dynamically adjusts to market volatility, reducing the occurrence of false signals often associated with traditional MACD implementations.
2. RSI Confirmation: In addition to the adaptive MACD, the DeQuex Algo also considers RSI readings to provide stronger confirmation for buy and sell signals.
3. Signal Types:
- Buy Signal: Triggered when the adaptive MACD crosses above its signal line.
- Sell Signal: Triggered when the adaptive MACD crosses below its signal line.
- Strong Buy Signal: Triggered when both the adaptive MACD and RSI cross above their respective thresholds, indicating a high-probability bullish setup.
- Strong Sell Signal: Triggered when both the adaptive MACD and RSI cross below their respective thresholds, indicating a high-probability bearish setup.
4. Price Bar Highlighting: The script color-codes price bars to provide a visual representation of the current trend. Green bars indicate an uptrend, red bars indicate a downtrend, and purple bars signify a period of consolidation or uncertainty. This feature allows traders to quickly assess the market context at a glance.
5. Customizable Alerts: Users can enable alerts for each signal type, ensuring they never miss a potential trading opportunity.
6. Dynamic Support and Resistance: The DeQuex Algo incorporates dynamic support and resistance levels based on market volatility. These levels are plotted using an innovative approach that combines Donchian channels with a Kalman filter for smoother, more reliable zones.
7. User-Friendly Inputs: The script provides a range of input parameters, allowing traders to fine-tune the indicator's sensitivity and adapt it to their preferred trading style and timeframe.
How to Use:
1. Add the DeQuex Algo indicator to your TradingView chart.
2. Customize the input parameters as desired, or use the default settings.
3. Enable alerts for your preferred signal types.
4. Look for buy and sell signals based on the adaptive MACD and RSI readings, paying attention to the color-coded price bars for additional context.
5. Consider the dynamic support and resistance levels when planning your entries, exits, and stop-loss placements.
Please note that while the DeQuex Algo is designed to identify high-probability setups, no indicator is perfect, and false signals may still occur. Always use proper risk management and consider other factors, such as market sentiment and fundamental analysis, when making trading decisions.
We hope that the DeQuex Algo will be a valuable addition to your trading toolbox, and we welcome any feedback or suggestions for further improvement.
Best regards,
BrandonJames1337
TR:
İşte güncellenmiş DeQuex Algo göstergeniz için önerilen bir açıklama:
Giriş:
DeQuex Algo, yatırımcıların Borsa İstanbul (BIST) piyasasında yüksek olasılıklı giriş ve çıkış noktalarını belirlemelerine yardımcı olmak için tasarlanmış gelişmiş bir teknik analiz aracıdır. Bu güncellenmiş sürüm, yanlış sinyalleri azaltmak ve göstergenin genel güvenilirliğini artırmak için uyarlanabilir bir MACD içerir.
Temel Özellikler:
1. Uyarlanabilir MACD: Komut dosyası, piyasa oynaklığına dinamik olarak ayarlanan ve genellikle geleneksel MACD uygulamalarıyla ilişkili yanlış sinyallerin oluşumunu azaltan uyarlanabilir bir MACD kullanır.
2. RSI Onayı: Uyarlanabilir MACD'ye ek olarak DeQuex Algo, alım ve satım sinyalleri için daha güçlü onay sağlamak üzere RSI okumalarını da dikkate alır.
3. Sinyal Türleri:
- Alış Sinyali: Uyarlanabilir MACD sinyal çizgisinin üzerine çıktığında tetiklenir.
- Satış Sinyali: Uyarlanabilir MACD sinyal çizgisinin altından geçtiğinde tetiklenir.
- Güçlü Alış Sinyali: Hem uyarlanabilir MACD hem de RSI kendi eşiklerinin üzerine çıktığında tetiklenir ve yüksek olasılıklı bir yükseliş düzenine işaret eder.
- Güçlü Satış Sinyali: Hem uyarlanabilir MACD hem de RSI kendi eşiklerinin altına düştüğünde tetiklenir ve yüksek olasılıklı bir düşüş düzenine işaret eder.
4. Fiyat Çubuğu Vurgulama: Komut dosyası, mevcut eğilimin görsel bir temsilini sağlamak için fiyat çubuklarını renk kodlarıyla kodlar. Yeşil çubuklar yükseliş trendini, kırmızı çubuklar düşüş trendini ve mor çubuklar ise konsolidasyon veya belirsizlik dönemini gösterir. Bu özellik, yatırımcıların piyasa bağlamını bir bakışta hızlı bir şekilde değerlendirmelerine olanak tanır.
5. Özelleştirilebilir Uyarılar: Kullanıcılar her sinyal türü için uyarıları etkinleştirerek potansiyel bir alım satım fırsatını asla kaçırmamalarını sağlayabilir.
6. Dinamik Destek ve Direnç: DeQuex Algo, piyasa oynaklığına dayalı dinamik destek ve direnç seviyeleri içerir. Bu seviyeler, daha yumuşak ve daha güvenilir bölgeler için Donchian kanallarını Kalman filtresiyle birleştiren yenilikçi bir yaklaşım kullanılarak çizilir.
7. Kullanıcı Dostu Girişler: Komut dosyası, yatırımcıların göstergenin hassasiyetini ince ayarlamalarına ve tercih ettikleri ticaret tarzına ve zaman dilimine uyarlamalarına olanak tanıyan bir dizi giriş parametresi sağlar.
Nasıl Kullanılır:
1. DeQuex Algo göstergesini TradingView grafiğinize ekleyin.
2. Giriş parametrelerini istediğiniz gibi özelleştirin veya varsayılan ayarları kullanın.
3. Tercih ettiğiniz sinyal türleri için uyarıları etkinleştirin.
4. Ek bağlam için renk kodlu fiyat çubuklarına dikkat ederek uyarlanabilir MACD ve RSI okumalarına dayalı alım ve satım sinyallerini arayın.
5. Girişlerinizi, çıkışlarınızı ve stop-loss yerleşimlerinizi planlarken dinamik destek ve direnç seviyelerini göz önünde bulundurun.
DeQuex Algo yüksek olasılıklı kurulumları belirlemek için tasarlanmış olsa da, hiçbir göstergenin mükemmel olmadığını ve yine de yanlış sinyallerin oluşabileceğini lütfen unutmayın. Alım satım kararları verirken her zaman uygun risk yönetimini kullanın ve piyasa duyarlılığı ve temel analiz gibi diğer faktörleri göz önünde bulundurun.
DeQuex Algo'nun ticaret araç kutunuza değerli bir katkı sağlayacağını umuyor ve daha fazla iyileştirme için her türlü geri bildirim veya öneriyi memnuniyetle karşılıyoruz.
Saygılarımla,
BrandonJames1337

BE - Strategy Builder ToolkitIndicator vs Toolkit:
This is definitely not an indicator, hence this doesn't do any kind of analysis nor provide meaningful outputs where you can take trading decisions out of it.
This is a Strategy Builder Toolkit which works like any other broker/3P applications, which helps traders to build their own custom/ predefined strategies, save / deploy them at their wish.
Idea Behind Developing this Toolkit: I am sure many of traders have overcome scenarios where, on break of x level he wants to initiate straddle else he wants to initiate Iron Condor. Some of them wants to deploy custom strategies only at certain time or at certian price levels.
It becomes pretty difficult to track markets when you are away from desk and if you dont adjust the strategy legs, you are incurring big drawdowns. There are many if's and buts to deploy strategies.
To overcome such challenges, i have built this toolkit.
Note: As this is just a toolkit, you should conduct your analysis to gauge the market direction outside the perview of this. Once you know the view / direction of the script. you can use this toolkit in action to
1. Deploy Strategy at (Desired levels| Desired time|Confired Levels|Confirmed Volumes)
2. Strategy can be Prebuilt / Custom Built
3.1 Set SL, Target for Directional view (Trail SL aswell)
3.2 Set Upside or Downside Target for Non Directional view (Trail SL aswell)
3.3 let the strategy play with out SL|Targets for consolidation view.
4. Adjust Legs by closing existing position and opening fresh position or place fresh adjustments
5. Book partial Profits with in the zone.
How the Toolkit is buit: Script uses text related functions to understand the custom input given in the indicator and coverts into a strategy and deployes them as a algo trading (Next Level Bot) with the additional parameter set for SL|Target|Entry levels.
Understanding the settings:
1. Strike Difference: is basically a value between each strike. eg: Banknifty : 100, Nifty & Finnifty: 50
2. 1 Lot Qty: Qty per Lot accepted by exchange|Broker. eg: BNF: 15, Nifty: 50, Finnifty: 40
3. Lot Multiplier: If you build strategy with 1 lot and if you set the Lot multiplier as 2 then strategy gets deployed with 2 lots. for eg. If i have saved strategy to buy BNF 1 ITM with 1Lot and have set lot multipier to 3 then at the time of deploying the trade it pushes as 3 lots (3 * 15Qty per lot = 45Qty) of 1 ITM strike.
4. Symbol Name: Select the Symbol Name here.
5. Current & Next Week Expiry Date: Specify the expiry Dates in the format as supported by your broker.
6. Broker Name, Exchange & Product Type: hope it is self explanatory.
IMPORTANT settings to understand:
7. Triggere Entry Post (optional): You have to specify when you want to deploy the strategy. For instance, if i want to deploy my strategy at 30 min after market open which is 9:45 am, then i have specify as 0945. Another instance where i want to close my strategy at 3 PM then you have to specify as 1500. Uncheck this option if you are not worried about the time of entry.
My personal Used Case: On the Expiry -1 Day at 0916 (9:16AM) i will buy 6 lots of 8OTM PE & CE and Sell 2 lots 7OTM, 2 lots of 6OTM and 2 lots of 5OTM and close the trade by 1100 (11AM).
8. Price Levels (Confirmed vs UnConfirmed) (Optional): Confirmed is basically price is sustained at|around the specified price level, where in UnConfirmed is basically the touch of the specified level.
for instance if i want to deploy straddle only if price is sustained at 100. then, i would specify GE with 100 in price input settings, and check thee Confirmed price box. Assuming if LTP is running at 98 and with the above settings it will only deploy the trade upon price is sustained at 100 level for 3 to 5 candles not at the touch of 100.
Uncheck this option if you are not worried about the Entry Price.
9. Confirmed Volume (Optional) (Long or Short): Basis your view|direction of the strategy. you can get additional confirmation. At the time of entry you want volume to be present towards the direction of the strategy. Uncheck this option if you are not worried about the volume or Volume doesn't exist for the chart loaded.
10. Alert Types: It consists of 3 Long & 3 Short directional (prebuilt) strategy along with Close Strategy, Close Specified Symbols Only & Design Custom Strategy Option.
10.1 : Slow Upmove - If you are having bullish view and predict that prices shall go slow and steady. This strategy can be deployed where you get the benifit of time decay as well while the delta play in favor of you. (viseversa for Slow DownMove)
10.2 : Fast Upmove - If you are having bullish view and predict that prices shall go fast. This strategy can be deployed where you get the smaller benifit of time decay as well while the delta play in favor of you. (viseversa for Fast DownMove)
10.3 : Vol Upmove (Volatality)- If you are having bullish view and predict market is tend to be volatile. This strategy can be deployed where you get the benifit of volatility as well while the delta play in favor of you. (viseversa for VolDownMove)
10.4 : Close Trade - You can use this option close the deployed strategy completely.
10.5 : Close Symbols - You can use this option close few of the symbols for the strategy deployed.
10.6 : Custom: Use this option to design you own custom strayegy with the syntax below:
Sample 1:
N|B|C2|3
N refers to Nextweek Expiry (if C is used then Current week expiry)
B refers to Buy (if S is used then Sell)
C refers to Call | CE (if P is used then PE or Put)
2 refers to 2OTM (for CE any Postitive number refers to as OTM and for PE it will be treated as ITM strikes & 0 refers to as ATM - viseversa for Negative Numbers)
3 refers to as 3 Lot
With the syntax of N|B|C2|3 - strategy will be deployed as "Buy 3 lots of 2 OTM Call of Next expiry"
Sample 2:
C|S|P-3|3|10|30
Above syntax means: SELL Current Expiry 3 Lots of 3 OTM Put Strike with 10 SL and 30 TGT
Sample 3:
C|S|C10|3|Default
Above syntax means: SELL Current Expiry 3 Lots of 10 OTM CALL Strike with 50% SL and 95% TGT
Sample 4:
C|B|C-2|3|40%|50%
Above syntax means: BUY Current Expiry 3 Lots of 2 ITM CALL Strike with 40% SL and 50% TGT
Sample 5: Long Straddle
C|B|C0|3
C|B|P0|3
Above syntax means: BUY Current Expiry 3 Lots of ATM CALL & PUT Strike
Sample 6: Iron Butterfly
C|B|C1|1
C|S|C0|1
C|S|P0|1
C|B|P-1|1
Above syntax means: Sell Current Expiry 1 Lots of ATM CALL & PUT Strike and BUY 1OTM Call & Put Strike
Sample 7: Diagonal Spread
C|S|C2|1
C|S|P-2|1
N|B|C3|1
N|B|P-3|1
Above syntax means: Sell Current Expiry 1 Lots of 2OTM CALL & PUT Strike and BUY 3OTM Call & Put Strike of Next Expiry.
To Understand how to deploy Strategy with defined Adjustments. For instance i want to deploy Iron Condor with Adjustments for BNF when the price is currently running at 45000.
C|B-|C3|1
C|S*|C2|1
C|B--|P-3|1
C|S**|P-2|1
At:2|C|S|C2|1
At:2|C|B|C3|1
At:-2|C|S|P-2|1
At:-2|C|B|P-3|1
On:2|*
On:-2|**
On:2|-
On:-2|--
With the above syntax: Intial trades are placed with
BUY BANKNIFTY45300CALL(Current Expiry) 1 Lot
BUY BANKNIFTY44700PUT(Current Expiry) 1 Lot
SELL BANKNIFTY45200CALL(Current Expiry) 1 Lot
SELL BANKNIFTY44800PUT(Current Expiry) 1 Lot
Toolkit tracks the price and holds the adjustments.
We may start to bleed on the sold leg (45200CALL) once the price crosses 45200. Hence if the price crosses 2 strike upside as specified with syntax " On:2|* " where * is a character tagged to Sold Call Leg. it closes the 45200 Call.
Similarly, " On:2|- " where - is character tagged to Brought Call Leg. it closes the 45300 Call, as soon as prices reaches 2 strike upside.
At:2|C|S|C2|1
At:2|C|B|C3|1
With the At Statements you can place the fresh adjustments legs. Above syntax refers to Once the price reaches 45200 it places below adjustment legs.
BUY BANKNIFTY45500CALL(Current Expiry) 1 Lot
SELL BANKNIFTY45400CALL(Current Expiry) 1 Lot
Note: Similarly If prices reaches downside with the On and At Sytax it places the necessary adjustment legs accordingly.
11. SL & TGT - You can specify SL, TGT or Upside & Dowside TGT during the entry conditions and Stratey shall be closed upon hitting either the SL or TGT accordingly.
12. On % Tgt & Lock % SL: This option is used for Prebuilt strategy where you can lock the Profit | Set Revised SL upon hitting specified TGT percentage.
13. Close Symbols: This option is used if you select Alert type as Close Symbols (Ref - 10.5 : Close Symbols) for specified list of symbols Alert shall be pushed to close the open positions of those symbols.
DISCLAIMER: No sharing, copying, reselling, modifying, or any other forms of use are authorized for our documents, script / strategy, and the information published with them. This informational planning script / strategy is strictly for individual use and educational purposes only. This is not financial or investment advice. Investments are always made at your own risk and are based on your personal judgement. I am not responsible for any losses you may incur. Please invest wisely.
Happy to receive suggestions and feedback in order to improve the performance of the indicator better.

30 Second Futures Session Open RangeThis indicator displays 30 second opening ranges from Globex, Europe, and RTH sessions.
From the RTH session range, it also displays infinitely generating Price Targets based on a % of the opening range size.
I am retrieving the 30 second data using the new "request.security_lower_tf()" function.
The importance of these levels is based on the idea that when the market opens, algorithms establish their positions within the first 30 seconds.
These areas can also be seen as potential areas of support and resistance throughout the sessions.
Enjoy!

Most Power V5 Most Power V5
The MOST indicator is an indicator used as a Moving Stoploss. The MOST indicator also generates a buy signal in case the prices rise, unlike the traditional indicators that allow you to make stop losses.In the MOST POWER V5 indicator, stoploss generates its signals using moving averages such as 'SMA', 'EMA', 'WMA', 'VWMA', 'HMA', 'SMMA', 'DEMA' rather than just the current price. In this way, it aims to prevent false signals that may be produced by excessive price movements during the day.
MOST POWER Indicator follows the average by preserving the stop loss distance in the movement of the moving average in the same direction.
The second variable that creates the MOST POWER curve is the stop loss distance that gives power to MOST with the moving average used and the shift rate that provides the stop signal. In this version, this distance is prepared with 2 separate inputs for both buy and sell.You can set these values as "percentage for long trend" and "percentage for short trend" in the indicator input properties.
You can also enter your Take Profit-1, Take Profit-2-, Take Profit-3- and Stop Loss levels in the indicator input properties, especially if you are interested in algo trading or to take advantage of the wonderful alarm setup features of tradingview and get the chance to get maximum profit. (If you enter Take Profit-1, Take Profit-2-, Take Profit-3- and Stop Loss levels as 0. Only buy and sell labels will appear on the indicator.)
Also, activate the amplitude filter option from the indicator input settings to get less signal and filter our inputs.
In addition, the entry price, take profit1, take profit2, take profit3 values for the last transaction opened to make things easier are located in the upper right corner of your graph as a table.
Important note: No indicator guarantees investment. That's why the tests you will do before real trades are very important in this indicator. I wish you all successful trades.
i will show how works with examples
Example 1
If you enter Take Profit-1, Take Profit-2-, Take Profit-3- and Stop Loss levels greater than 0
Example 2
If you enter Take Profit-1, Take Profit-2-, Take Profit-3- and Stop Loss levels as 0 (u will see only buy - sell labels)
Example 3
if select Amplitude Filter is on . you will see less signal
how works Amplitude Filter whats logic ?
if Amplitude Filter is active the signal from mostpower will be combined with Amplitude Filter.
for example, if the amplitude value is 2, the highest price and the lowest price of the last 2 bars are calculated. then this amplitude value is calculated for sma with its source high and low. Based on these values, the trend is determined in the amplitude of the price movement.
Important note: No indicator guarantees investment. That's why the tests you will do before real trades are very important in this indicator. I wish you all successful trades.

SBS AlgoHello traders, I am here again with a new and improved indicator.
This indicator is based on a pivot breakout algorithm which gives buy and sell signals according to the breakout of trendline. This is an advanced version of another script. It also takes price action into consideration along with some basic indicators like MACD and ADX to give good entry signals.
NOTE: This indicator is not designed to take entries completely based on signals it gives. Please use it along with your trading strategy to add more confluence to your trading system and maximize your profits.
I hope you guys will like this one too .Enjoy 👍
In case you find any bug, please do report in comment section .Thank you.

Tripple EMA Strategy - Dhan HQDear Traders,
Here with presenting the new Indicator (Strategy) which is primarily built based on the the EMA moving Average and Candlestick Pattern.
Idea behind this Indicator: I am sure every trader would have traded using Moving average one day or the other. And Moving average is theoretically they are Lagging and the EMA are used in place of Moving average just to avoid a bit of Lag to take advantage of those accuracy while avoiding the Lag. In order to be successful in trading Money Management and Risk Management is very much crucial and should be part of every trade we place.
What this indicator is providing:
Based on the EMA and candlestick patterns and using the inputs provided for RISK and Money Management options, Indicator continuously scans for trading opportunities and provides alerts for possible trades. I have tried to capture some analytical inputs for one to think and take control over the Reward, Risk and Money management parameters to tweak the indicator accordingly.
Below are the Analytical outputs provided:
1. Total Trades taken (History till present) and its profitability % & appx PNL
2. Current Dates & Yesterday's Trades along with its appx PNL
3. Long Trades performance vs Short Trades performance
4. Retrieve PNL values post specified Date in the Input settings.
5. Last 7 Days PNL
6. Month's PNL
Note: There is known BUG in the calculation where the first date of the month for Monthly PNL value is a trading Holiday then Monthly PNL is being displayed as 0. similarly this Bug is flowed for Last 7 Days PNL. This will be addressed in upcoming version along with planned release.
Alerts & Notifications:
There are basically 2 types of Alerts provided one with General Notification and Other with Dhan HQ notifications to support Algo Trades for Dhan HQ Baskets.
Overview for Dhan HQ Trade Alerts:
1. When the Day Beginning (At Session Start) Hedge Position can be placed and shall be squared off post Closing the session
2. During the course of the Day Buy & Sell Baskets shall be executed
3. Can map the Trade Level SL values
4. Can map Daily Limit for SL to avoid excessive Loss. Upon Loss you could stop trades for the complete day or you may restart the trade post completion of X no of hours.
Enjoy!
DISCLAIMER: No sharing, copying, reselling, modifying, or any other forms of use are authorized for our documents, script / strategy, and the information published with them. This informational planning script / strategy is strictly for individual use and educational purposes only. This is not financial or investment advice. Investments are always made at your own risk and are based on your personal judgement. I am not responsible for any losses you may incur. Please invest wisely.
Happy to receive suggestions and feedback in order to improve the performance of the indicator better.
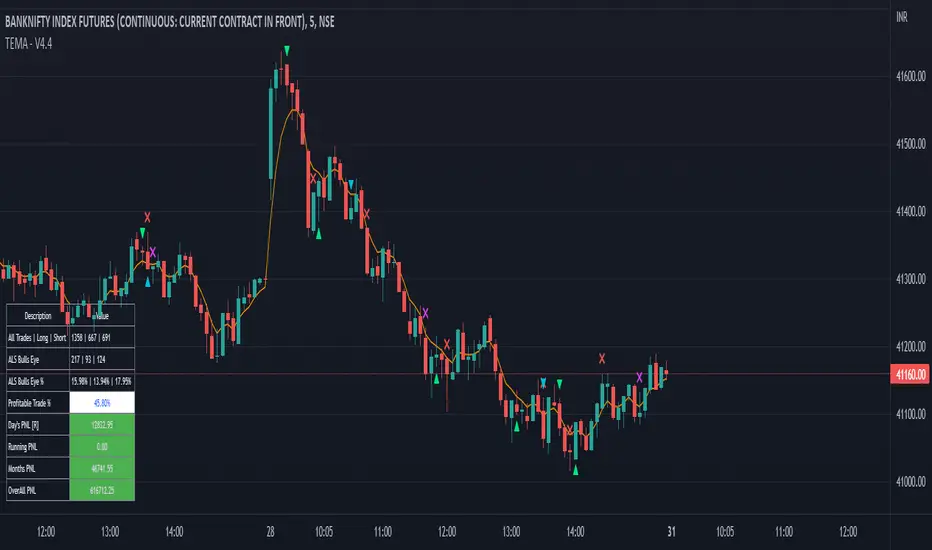
[KRONOS] DeviationsDescription
This indicator calculates the differences between the current price and the local support or resistance, and normalizes it into a range.
The value basis is calculated from a defined period of time that is then multiplied to get a standard deviations and a max. and min. value subtracted and divided into a final value.
It includes
Extreme zones. This value appears as blue and red lines which deviates from the oversold to overbought range.
Momentum. Lower time frame momentum is represented by a gray histogram as well as a signal line oscillating from a red to blue color.
Strong reversal. Red ( bearish ) and blue ( bullish ) columns will appear on the histogram when our algorithm detects that the strength of momentum is coming to an end indicative of a trend reversal.
Trend confirmation. Red or blue arrows will act as a trend confirmation.
Support and resistance . The zero line will frequently serve as a S/R area.
Divergences. You can use this indicator to detect potential pivot areas.
How to use?
Sell/Short when the histogram shows a red column and the signal line is in or above the overbought area (colored in red).
Buy/Long when the histogram shows a blue column and the signal line is in or below the oversold area (colored in blue).
extra tip: if you entered a trade based on the above conditions, you can partially increase your position each time you see a confirmation arrow.
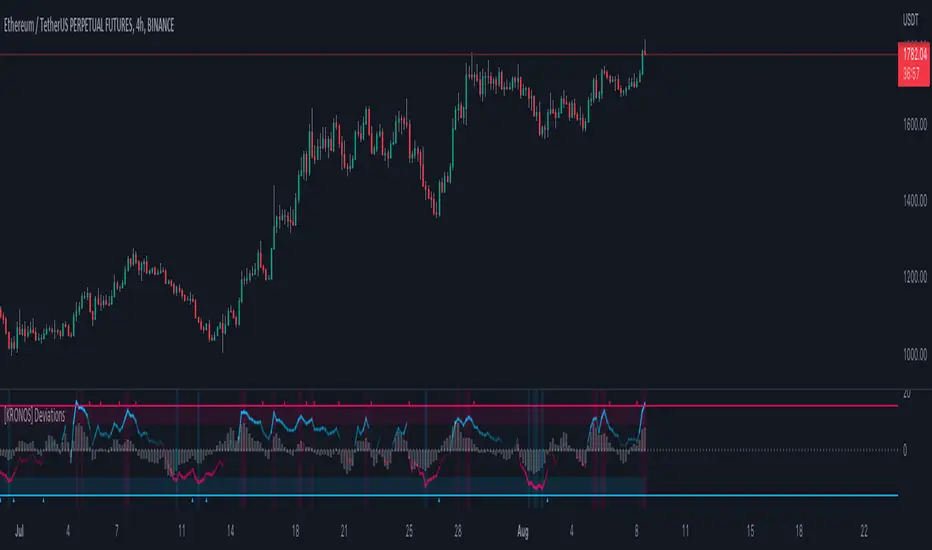
[KRONOS] MomentumDescription
This indicator is based on an algorithm which provides accurate momentum tracking on every timeframe. It is visualized as a colored histogram and through some other tools.
The value is calculated from an exponentially weighted moving average that is used to get a high and a low deviation, merging the last value into a range.
It includes
Overbought and oversold fixed areas. Their purpose is to facilitate the recognition of areas where the trend is likely to end or cool down. They are also marked with a background coloring.
Zero line. It typically represents a change of trend when the price crosses under or over it.
Volume shifts. Colored arrows will appear whenever a volume change is detected.
How to use?
Buy/Long on a blue confirmation arrow
Sell/Short on a red confirmation arrow
Take profit when the indicator starts showing a blue background
Take profit when the indicator starts showing a red background
extra tip: the zero line often acts as support / resistance similarly to the overbought and oversold areas

Commercial Algo Trend © Fzn V1Hello Traders,
Here i bring to you my 2nd Price Action Atr based Indictor combined with fib entry and exit trailing levels with minimum risk and maximum profit , as we must have seen at times as we enter the trend reverse and hits our stop losses . Keeping that in mind as i too struggled and made losses so i decided and focused more on minimizing the stop loss and only on confirmation of Long or Short trade is been initiated with proper Stop loss as explained in the images below , why should we give market our money ;) as we are here to make money :D .. There is no holy grail as Stop loss wont be hit but yes it will be way less and all alerts are based on candle close . One can use this on any chart and any timeframe and its very good for scalping too .ATR Trailing SL is added too just incase you want to enter and exit trend manually . Better results are on 15m and above . Hope you guys will like it and comment if you have any doubts..
-----------------
Disclaimer
Copyright by FaizanNawazz.
The information contained in my scripts/indicators/strategies/ideas does not constitute financial advice or a solicitation to buy or sell any securities of any type. I will not accept liability for any loss or damage, including without limitation any loss of profit, which may arise directly or indirectly from the use of or reliance on such information.
All investments involve risk, and the past performance of a security, industry, sector, market, financial product, trading strategy, or individual’s trading does not guarantee future results or returns. Investors are fully responsible for any investment decisions they make. Such decisions should be based solely on an evaluation of their financial circumstances, investment objectives, risk tolerance, and liquidity needs.
My scripts/indicators are only for educational purposes!
Happy Trading!
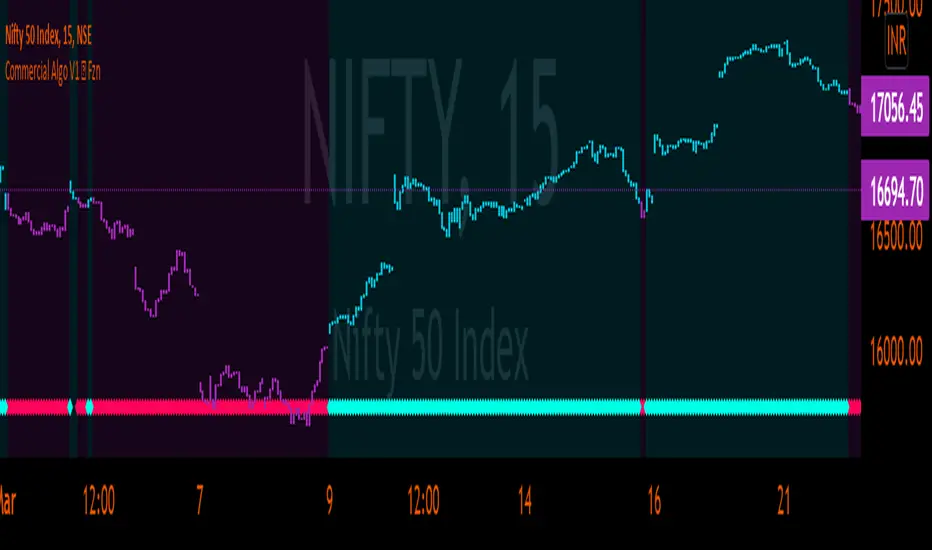
B4Signals Algo PremiumB4Signals Algo indicator is made up of more than 7+ innovative indicators carefully designed to generate high probability buy and sell signals while reducing risk. It derives its entries and exits from the B4Signals Indicator with added trend detection and volatility containment.
B4Signals Algo indicator detects the direction of trends for any asset and on any timeframe allowing traders to increase their confidence in positions, follow trends and stay in positions longer. Profit taking is up to the trader.
B4Signals Algo features:
Automatically generated buy and sell signals
Algo model selection in settings
Algo sensitivity selection in settings
Background chart shading for market hours
B4Signals Algo has two modes to choose from; each with an aggressive and a conservative approach to trading:
Algo 1 - Aggressive = Aims to detect very early trends, and is thus more reactive. Developed to catch both short term and long term trend reversal and provide clarity in the current trend direction. This setting attempts to make it easier to come in early in a new trend as well as to stay longer in that trend.
Algo 1 - Conservative = Aims to detect trend continuation where the stock price is likely to keep its current trend.
Algo 2 - Aggressive = Aims to detect very early confirmed trends, and is thus more reactive. Developed to catch both confirmed short term and confirmed long term trend reversals and provide confirmation in the current trend direction.
Algo 2 - Conservative = Aims to detect very early confirmed trends in conjunction with a filter to keep out false or choppy signals to leave the most accurate ones.
Disclaimer
Copyright by B4Signals.
The information contained in our scripts/indicators/ideas does not constitute financial advice or a solicitation to buy or sell any securities of any type. We will not accept liability for any loss or damage, including without limitation any loss of profit, which may arise directly or indirectly from the use of or reliance on such information.
All investments involve risk, and the past performance of a security, industry, sector, market, financial product, trading strategy, or individual’s trading does not guarantee future results or returns. Investors are fully responsible for any investment decisions they make. Such decisions should be based solely on an evaluation of their financial circumstances, investment objectives, risk tolerance, and liquidity needs.
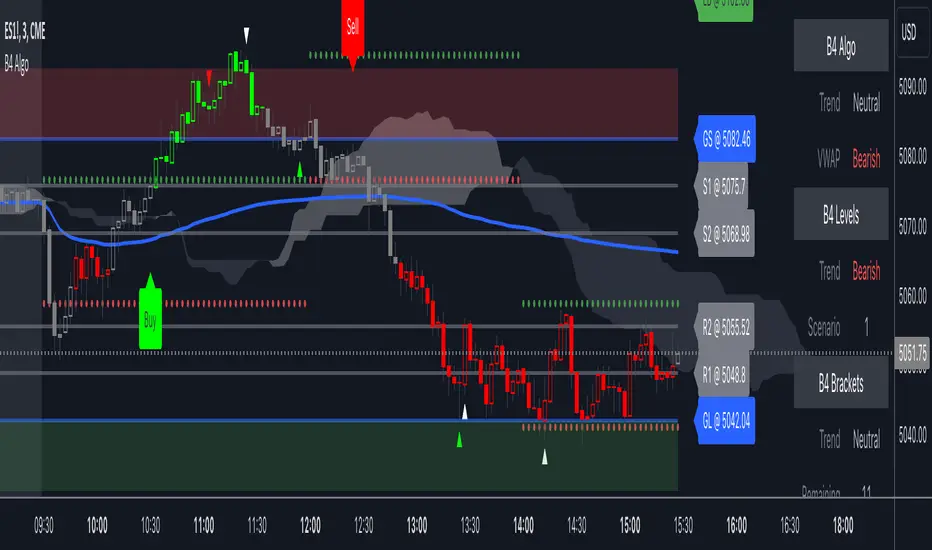
NVME Blackfire XNVME Blackfire X Indicator is a trend-confirmation indicator that includes Buy and Sell signals on the chart, Support & Resistance lines, Automatic Trendlines, Session Highs and Lows, Previous MTF Candle's Highs and Lows, Strategy Mode with Working Win/Loss Calculator, Built-In Position Size Calculator, Institutional Zones, Re-Entry Points and Filters, Customisable Market Dashboard and Alerts for Many Features.
The 2 main settings for the algorithm are 'Sensitivity' and 'Agility'. When you place Blackfire X onto your charts, you should be met automatically with the best settings we've found so far and don't worry if you are struggling to find settings because our system has an onboard system that provides you with an automatic "Best Settings" for the current pair that you are on. You can choose to enable this feature on the algorithm settings or simply see what is ideal on the dashboard too.
The 'Sensitivity' controls how quickly the algorithm responds to the market's trend changes. The higher the sensitivity, the less trades on the chart. The lower the sensitivity, the more trades you'll find on the chart.
The 'Agility' controls where the signals are placed within the trend change, a lower agility will give you signals closer to its reversal points and a higher agility will give you slower signals.
We also have the option to change the indicator to your trading style, there are four modes that heavily impacts the algorithm's calculations.
These are "default", "swing mode", "scalp mode", "strategy mode".
"Default" is our normal algorithm module that utilises the user's input to provide signals using a basic filtration system.
"Swing Mode" is our algorithm that has been modified to give signals that are more delayed for swing traders.
"Scalp Mode" is our algorithm that has been modified to give signals that are quick and fast for scalps.
"Strategy Mode" utilises our default mode but instead places the user in a mode where trades will only appear if a stop loss or a take profit area has been met by the price after the signal call.
Our third key option is our bar colour switches, there are multiple options such as "Cloud-Based", "Pivot Based", "S/R Based", "Change-Based" and "Two Colour Modes". NVME Blackfire X colours the candles in the direction of the trend and a green colour shows an uptrend, a purple colour shows an unconfirmed trend or often a ranging area and a red colour shows a downtrend.
We must let traders know that the signals should be used carefully and with a trader's strategy rather than following signals for the sake of it being printed there!
Since we want this algorithm to have necessary features and respond fast too, we have chosen only trend-following and analysis features that will be quick to use and easy to understand. We want this to be different from our Vanquisher X algorithm as that is a massive multi-tool full of features for traders to enjoy.
The first main feature is our 'Trend Cloud' system, it utilises two moving average plots that creates a cloud filling and with our algorithm you can customise both of the moving averages to any currently existing moving average in the PineScript Library.
The second feature is our 'Institutional Zones' system, which plots area of the market where the institutions have placed orders and these can be used as an extra support and resistance zone for trades. There is an input option that allows the user to get more or less zones and it is called "The Detection Strength", increasing this will show more zones whilst decreasing it will show less.
The third feature is our 'Automatic Trendlines' system, which utilises two input methods ('Trendline Period' and 'Trendline Detection Ratio'), the period controls how many bars of data to lookback to for the trend-lines and the detection ratio controls how many trend-lines are plotted onto the chart.
The fourth feature is our 'Session High and Lows' system, which plots the highest high and the lowest low of each session in the trading hours, these plots can be useful for breakout traders.
The fifth feature is our 'MTF Candle Info' system, which plots the candle's high and low or the candle's open and close for a timeframe and the previous candle of choice. This can also be used for breakout traders such as having a lower timeframe breakout for a higher timeframe plot.
The sixth feature is our 'Adaptive S/R Zones', which plots support and resistance zones into any market pair that are accurate points at which the market could react and reject from.
* Informative Market Dashboard *
Our simple panel on your chart displays the most relevant data from all of our features and calculations in real-time.
Confirmation
The confirmation simply tells the user what the previous signal was and this can be useful if the user may decide to have their signals turned off on the charts.
Market State
The market state informs the user the direction of the trend whether it be ranging, in an uptrend or downtrend, you'll see the emoji that corresponds to that.
Recommended Sensitivity
This feature will show the user what the recommended sensitivity is for the current pair that the user is on and the user may find this helpful if they don't know what settings to use.
Recommended Agility
This feature will show the user what the recommended agility is for the current pair that the user is on and the user may find this helpful if they don't know what settings to use.
Trend Control
The trend control feature calculates data using the user set bars back input and it determines all the factors within the trend to give you an informative response, an uptrend will have "Bulls by: " + percentage of control and a downtrend will have "Bears by" + percentage of control.
Pair Strength
The pair strength is measures the control of bulls or bears in the form of the market strength and it will give the same response as the trend control but the percentage will be based on the buying or selling pressure.
Pair's Change
The pairs change measures the change in price from point A to point B, if the change is greater than 0%, the dashboard will inform you that Bulls are in control, and if not the dashboard will inform you that Bears are in control.
Market Money
The market money measures the amount of volume and money that is going into the current asset and if the net change is greater than 0%, bulls will be in control, if not then bears are giving the market their money.
NVME Oscillator X
This is our very own oscillator that has been integrated into our dashboard, allowing the user to see the trend of our other indicator without having to fill their charts up with more noise. If the oscillator is in a downtrend then the dashboard will state that its in a downtrend and if it is in an uptrend then it will show an uptrend text.
Volatility
This feature measures the amount of volatility in any pair and provides user with the percentage value so they can see whether or not the market is extremely volatile at the current time.
Current Session
This feature will tell the user what session they are currently on such as London, Europe, New York, Asia, Australia.