Exponential Trend [AlgoAlpha]OVERVIEW
This script plots an adaptive exponential trend system that initiates from a dynamic anchor and accelerates based on time and direction. Unlike standard moving averages or trailing stops, the trend line here doesn't follow price directly—it expands exponentially from a pivot determined by a modified Supertrend logic. The result is a non-linear trend curve that starts at a specific price level and accelerates outward, allowing traders to visually assess trend strength, persistence, and early-stage reversal points through both base and volatility-adjusted extensions.
CONCEPTS
This indicator builds on the idea that trend-following tools often need dynamic, non-static expansion to reflect real market behavior. It uses a simplified Supertrend mechanism to define directional context and anchor levels, then applies an exponential growth function to simulate trend acceleration over time. The exponential growth is unidirectional and resets only when the direction flips, preserving trend memory. This method helps avoid whipsaws and adds time-weighted confirmation to trends. A volatility buffer—derived from ATR and modifiable by a width multiplier—adds a second layer to indicate zones of risk around the main trend path.
FEATURES
Exponential Trend Logic : Once a directional anchor is set, the base trend line accelerates using an exponential formula tied to elapsed bars, making the trend stronger the longer it persists.
Volatility-Adjusted Extension : A secondary band is plotted above or below the base trend line, widened by ATR to visualize volatility zones, act as soft stop regions or as a better entry point (Dynamic Support/Resistance).
Color-Coded Visualization : Clear green/red base and extension lines with shaded fills indicate trend direction and confidence levels.
Signal Markers & Alerts : Triangle markers indicate confirmed trend reversals. Built-in alerts notify users of bullish or bearish direction changes in real-time.
USAGE
Use this script to identify strong trends early, visually measure their momentum over time, and determine safe areas for entries or exits. Start by adjusting the *Exponential Rate* to control how quickly the trend expands—the higher the rate, the more aggressive the curve. The *Initial Distance* sets how far the anchor band is placed from price initially, helping filter out noise. Increase the *Width Multiplier* to widen the volatility zone for more conservative entries or exits. When the price crosses above or below the base line, a new trend is assumed and the exponential projection restarts from the new anchor. The base trend and its extension both shift over time, but only reset on a confirmed reversal. This makes the tool especially useful for momentum continuation setups or trailing stop logic in trending markets.
Cari dalam skrip untuk "algo"

Trend Targets [AlgoAlpha]OVERVIEW
This script combines a smoothed trend-following model with dynamic price rejection logic and ATR-based target projection to give traders a complete visual framework for trading trend continuations. It overlays on price and automatically detects potential trend shifts, confirms rejections near dynamic support/resistance, and displays calculated stop-loss and take-profit levels to support structured risk-reward management. Unlike traditional indicators that only show trend direction or signal entries, this tool brings together a unique mix of signal validation, volatility-aware positioning, and layered profit-taking to guide decision-making with more context.
CONCEPTS
The core trend logic is built on a custom Supertrend that uses an ATR-based band structure with long smoothing chains—first through a WMA, then an EMA—allowing the trend line to respond to major shifts while ignoring noise. A key addition is the use of rejection logic: the script looks for consolidation candles that "hug" the smoothed trend line and counts how many consecutive bars reject from it. This behavior often precedes significant moves. A user-defined threshold filters out weak tests and highlights only meaningful rejections.
FEATURES
Trend Detection : Automatically identifies trend direction using a smoothed Supertrend (WMA + EMA), with shape markers on trend shifts and color-coded bars for clarity.
Rejection Signals : Detects price rejections at the trend line after a user-defined number of consolidation bars; plots ▲/▼ icons to highlight strong continuation setups.
Target Projection : On trend confirmation, plots entry, stop-loss (ATR-based), and three dynamic take-profit levels based on customizable multiples.
Dynamic Updates : All levels (entry, SL, TP1–TP3) auto-adjust based on volatility and are labeled in real time on the chart.
Customization : Users can tweak trend parameters, rejection confirmation count, SL/TP ratios, smoothing lengths, and appearance settings.
Alerts : Built-in alerts for trend changes, rejection events, and when TP1, TP2, or TP3 are reached.
Chart Overlay : Plots directly on price chart with minimal clutter and clearly labeled levels for easy trading.
USAGE
Start by tuning the Supertrend factor and ATR period to fit your asset and timeframe—higher values will catch bigger swings, lower values catch faster moves. The confirmation count should match how tightly you want to filter rejection behavior—higher values make signals rarer but stronger. When the trend shifts, the indicator colors the bars and line accordingly, and if enabled, plots the full entry-TP-SL structure. Rejection markers appear only after enough qualifying bars confirm price pressure at the trend line. This is especially useful for continuation plays where price retests the trend but fails to break it. All calculations are based on volatility (ATR), so targets naturally adjust with market conditions. Add alerts to get notified of important signals even when away from the chart.

HEMA Trend Levels [AlgoAlpha]OVERVIEW
This script plots two Hull-EMA (HEMA) curves to define a color-coded dynamic trend zone and generate context-aware breakout levels, allowing traders to easily visualize prevailing momentum and identify high-probability breakout retests. The script blends smoothed price tracking with conditional box plotting, delivering both trend-following and mean-reversion signals within one system. It is designed to be simple to read visually while offering nuanced trend shifts and test confirmations.
█ CONCEPTS
The Hull-EMA (HEMA) is a hybrid moving average combining the responsiveness of short EMAs with the smoothness of longer ones. It applies layered smoothing: first by subtracting a full EMA from a half-length EMA (doubling the short EMA's weight), and then by smoothing the result again with the square root of the original length. This process reduces lag while maintaining clarity in direction changes. In this script, two HEMAs—fast and slow—are used to define the trend structure and trigger events when they cross. These crossovers generate "trend shift boxes"—temporary support or resistance zones drawn immediately after trend transitions—to detect price retests in the new direction. When price cleanly retests these levels, the script marks them as confirmations with triangle symbols, helping traders isolate better continuation setups. Color-coded bars further enhance visual interpretation: bullish bars when price is above both HEMAs, bearish when below, and neutral (gray) when indecisive.
█ FEATURES
Bullish and bearish bar coloring based on price and HEMA alignment.
Box plotting at each crossover (bullish or bearish) to create short-term decision zones.
Real-time test detection: price must cleanly test and bounce from box levels to be considered valid.
Multiple alert conditions: crossover alerts, test alerts, and trend continuation alerts.
█ USAGE
Use this indicator on any time frame and asset. Adjust HEMA lengths to match your trading style—shorter lengths for scalping or intraday, longer for swing trading. The shaded area between HEMAs helps visually define the current trend. Watch for crossovers: a bullish crossover plots a green support box just below price, and a bearish one plots a red resistance box just above. These zones act as short-term decision points. When price returns to test a box and confirms with strong rejection (e.g., closes above for bullish or below for bearish), a triangle symbol is plotted. These tests can signal strong trend continuation. For traders looking for clean entries, combining the crossover with a successful retest improves reliability. Alerts can be enabled for all key signals: trend shift, test confirmations, and continuation conditions, making it suitable for automated setups or discretionary traders tracking multiple charts.

Range Breakout Signals [AlgoAlpha]OVERVIEW
This script detects range-bound market conditions and breakout signals using a combination of volatility compression and volume imbalance analysis. It identifies zones where price consolidates within a defined range and highlights potential breakout points with visual markers. Traders can use this to spot market transitions from ranging to trending phases, aiding in decision-making for breakout strategies.
CONCEPTS
The script measures volatility by comparing the ratio of the simple moving average (SMA) of price movements to their median value. When volatility drops below a threshold, the script assumes a range-bound market. It then tracks the cumulative volume of buying and selling pressure to assess breakout strength. The approach is based on the idea that market consolidation often precedes strong moves, and volume distribution can provide clues on the breakout direction.
FEATURES
Range Detection : Uses a volatility filter to identify low-volatility zones and marks them on the chart with shaded boxes.
Volume Imbalance Analysis : Evaluates cumulative up and down volume over a confirmation period to assess directional bias.
Breakout Signals : When price exits a detected range, the script plots breakout markers. A ▲ symbol indicates a bullish breakout, and a ▼ symbol indicates a bearish breakout. Additional "+" markers indicate strong volume imbalance favoring the breakout direction.
Adaptive Timeframe Volume Analysis : The script dynamically adjusts its volume calculation based on the chart’s timeframe, ensuring reliable signal generation across different trading conditions.
Alerts : Notifies traders when a new range is detected or when a breakout occurs, allowing for automated monitoring.
USAGE
Traders can use this script to identify potential trade setups by entering positions when price breaks out of a detected range. For breakout confirmation, traders can look at volume imbalance cues—bullish breakouts with strong buying volume may indicate sustained moves, while weak volume breakouts may lead to false signals. This script is particularly useful for breakout traders, range traders seeking to fade breakouts, and those looking to automate trade alerts in volatile markets.

Liquidity Depth [AlgoAlpha]OVERVIEW
This script visualizes market liquidity by identifying key price levels where significant volume has transacted. It highlights zones of high buying and selling interest, helping traders understand where liquidity is accumulating and how price may respond to these areas. By dynamically tracking volume at highs and lows, the script builds a real-time liquidity profile, making it a powerful tool for identifying potential support and resistance levels.
CONCEPTS
Liquidity depth analysis helps traders determine how price interacts with supply and demand at different levels. The script processes historical volume data to distinguish between high-liquidity and low-liquidity zones. It assigns transparency levels to plotted lines , ensuring that more relevant liquidity areas stand out visually. The script adds a profile to show the depth of liquidity (derived from historical volume data) for levels above and below the current price
FEATURES
Liquidity Levels: Tracks liquidity levels based on volume concentration at price high and lows.
Volume-Based Transparency: More significant liquidity levels are displayed with higher visibility, showing their significance.
Interpolation: interpolates the bullish and bearish liquidity depth at a user defined range away from the price, helping in comparing the liquidity amounts between bullish and bearish.
Depth Profile: Allows traders to visualize depth of liquidity in a more quantitative and clearer way than the liquidity levels/list]
USAGE
This indicator is best used to track liquidity levels and potential price reaction areas. Traders can adjust the Liquidity Lookback setting to analyze past liquidity levels over different historical periods. The Profile Resolution setting controls the granularity of liquidity depth visualization, with higher values providing more detail. The script can be applied across different timeframes, from intraday scalping to swing trading analysis. The plotted liquidity zones provide traders with insights into where price may encounter strong support, resistance, or potential liquidity-driven reversals.

Breakout and Retest Signals [AlgoAlpha]OVERVIEW
This script detects breakout and retest signals by identifying key pivot points in price action and analyzing their relationship with historical swing highs and lows. It highlights breakout structures using ATR-based tolerance levels and volume analysis to confirm potential trend continuations or reversals. The script marks significant price levels with dynamic boxes and dashed lines to help traders visualize breakout and retest areas effectively.
CONCEPTS
The script relies on pivot point analysis, a technique used to identify significant price levels where the market has previously reversed. It dynamically tracks a set number of recent swing highs and lows, allowing traders to see if the price is revisiting a previously significant level. The concept of breakouts and retests is widely used in technical analysis to determine potential entry points. A breakout occurs when the price moves beyond a resistance or support level, and a retest happens when the price returns to test that level before continuing in the breakout direction. This script enhances that analysis by incorporating ATR-based tolerance levels, ensuring that price zones are not too large.
FEATURES
Breakout and Retest Markings : Highlights breakout and retest areas with shaded boxes, allowing traders to visualize where price action is confirming key levels.
Volume Delta and Ratio : Analyzes volume at breakout levels to gauge the strength of the move, displaying volume delta information for additional context. The script also displays the ratio of selling to buying at the retest along traders to make better judgement on their entries.
Multi-Timeframe Adaptability : Dynamically adjusts volume analysis to align with the appropriate lower timeframe, ensuring reliable volume comparisons.
Alerts for Breakout and Retest Events : Traders can receive real-time notifications when bullish or bearish breakout retests are detected.
USAGE
This script is best suited for traders looking to identify strong breakout and retest setups across different timeframes. Users can customize the pivot detection period and swing point memory to adjust sensitivity based on their trading style. The ATR length and multiplier allow further refinement of breakout tolerance, reducing noise in volatile markets. The breakout zones are displayed as shaded boxes, where traders can assess whether a price retest is occurring under favorable conditions. Alerts can be set to notify traders of potential trade opportunities.

Range Filtered Trend Signals [AlgoAlpha]Introducing the Range Filtered Trend Signals , a cutting-edge trading indicator designed to detect market trends and ranging conditions with high accuracy. This indicator leverages a combination of Kalman filtering and Supertrend analysis to smooth out price fluctuations while maintaining responsiveness to trend shifts. By incorporating volatility-based range filtering, it ensures traders can differentiate between trending and ranging conditions effectively, reducing false signals and enhancing trade decision-making.
:key: Key Features
:white_check_mark: Kalman Filter Smoothing – Minimizes market noise while preserving trend clarity.
:bar_chart: Supertrend Integration – A dynamic trend-following mechanism for spotting reversals.
:fire: Volatility-Based Range Detection – Detects trending vs. ranging conditions with precision.
:art: Color-Coded Trend Signals – Instantly recognize bullish, bearish, and ranging market states.
:gear: Customizable Inputs – Fine-tune Kalman parameters, Supertrend settings, and color themes to match your strategy.
:bell: Alerts for Trend Shifts – Get real-time notifications when market conditions change!
:tools: How to Use
Add the Indicator – Click the star icon to add it to your TradingView favorites.
Analyze Market Conditions – Observe the color-coded signals and range boundaries to identify trend strength and direction.
Use Alerts for Trade Execution – Set alerts for trend shifts and market conditions to stay ahead without constantly monitoring charts.
:mag: How It Works
The Kalman filter smooths price fluctuations by dynamically adjusting its weighting based on market volatility. It helps remove noise while keeping the signal reactive to trend changes. The Supertrend calculation is then applied to the filtered price data, providing a robust trend-following mechanism. To enhance signal accuracy, a volatility-weighted range filter is incorporated, creating upper and lower boundaries that define trend conditions. When price breaks out of these boundaries, the indicator confirms trend continuation, while signals within the range indicate market consolidation. Traders can leverage this tool to enhance trade timing, filter false breakouts, and identify optimal entry/exit zones.

Adaptive Resonance Oscillator [AlgoAlpha]Introducing the Adaptive Resonance Oscillator , an advanced momentum-based oscillator designed to dynamically adjust to changing market conditions. This innovative indicator detects market frequency through a Hilbert Transform approach, adapting in real-time to identify overbought and oversold conditions with improved accuracy. With built-in divergence detection, trend analysis, and customizable smoothing, this tool is perfect for traders looking to refine their entries and exits based on adaptive oscillation mechanics.
🚀 Key Features :
🔹 Adaptive Frequency Detection – Uses Hilbert Transform principles to dynamically determine market cycle length for precise oscillator calculation.
⚙️ Customizable Smoothing – Option to apply a Hull Moving Average (HMA) for enhanced signal clarity.
📈 Divergence Detection – Identifies bullish and bearish divergences with visual markers, helping traders spot early trend reversals.
🟢 Overbought & Oversold Signals – Highlights extreme momentum conditions with adjustable thresholds.
🔔 Real-Time Alerts – Get notified for crossovers, divergences, and strong trend shifts directly on your TradingView chart.
🎨 Fully Customizable Appearance – Modify colors, divergence sensitivity, and smoothing options to fit your trading style.
🛠 How to Use :
Add the Adaptive Resonance Oscillator to your TradingView chart by clicking the ★ to favorite it.
Monitor the Charts , switch between smoothed and I smoothed modes to identify trend and price swings, use divergences and reversal signals for potential entry/exits.
Set alerts for bullish/bearish crossovers and divergence signals to stay ahead of market moves.
⚙ How It Works :
The indicator begins by applying a Hilbert Transform frequency estimation to the price series, identifying the dominant market cycle length. This is used to calculate a period for the RSI that matches its resonant frequency with the dominant market frequency, dynamically adjusting the Oscillator. The oscillator then applies an optional Hull Moving Average (HMA) smoothing for signal refinement. Additionally, the indicator scans for bullish and bearish divergences by comparing oscillator movements against price action, plotting signals accordingly. When overbought/oversold conditions or divergence events occur, alerts are triggered to notify the trader in real time.

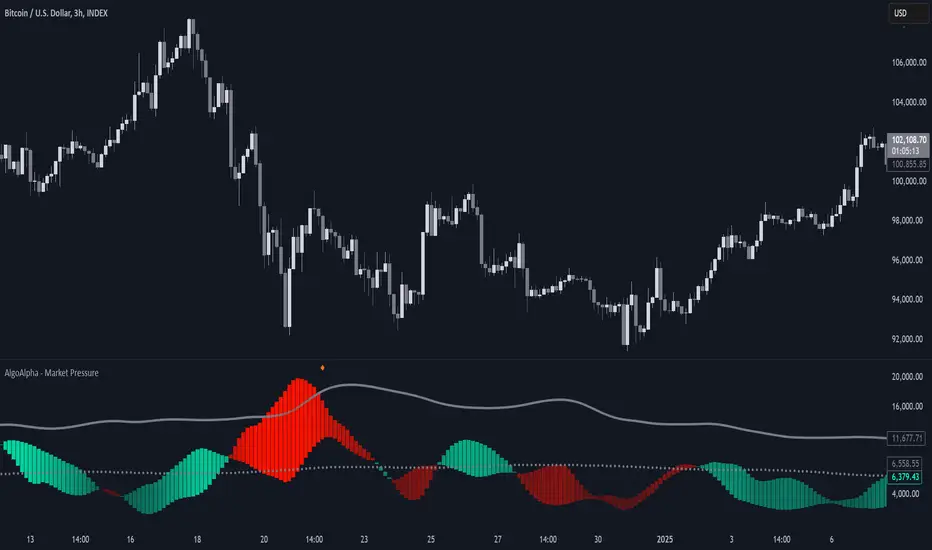
Market Pressure Index [AlgoAlpha]The Market Pressure Index is a cutting-edge trading tool designed to measure and visualize bullish and bearish momentum through a unique blend of volatility analysis and dynamic smoothing techniques. This indicator provides traders with an intuitive understanding of market pressure, making it easier to identify trend shifts, breakout opportunities, and key moments to take profit. Perfect for scalpers and swing traders looking for a strategic edge in volatile markets.
Key Features:
🔎 Bullish and Bearish Volatility Separation : Dynamically calculates and displays bullish and bearish momentum separately, helping traders assess market direction with precision.
🎨 Customizable Appearance: Set your preferred colors for bullish and bearish signals to match your chart's theme.
📊 Deviation-Based Upper Band : Tracks extreme volatility levels using a configurable deviation multiplier, highlighting potential breakout points.
📈 Real-Time Signal Alerts : Provides alerts for bullish and bearish crossovers, as well as take-profit signals, ensuring you never miss key market movements.
⚡ Gradient-Based Visualization : Uses color gradients to depict the intensity of market pressure, making it easy to spot changes in momentum at a glance.
How to Use:
Add the Indicator : Add the Market Pressure Index to your TradingView chart by clicking the star icon. Customize inputs like the pressure lookback period, deviation settings, and colors to fit your trading style.
Interpret the Signals : Monitor the bullish and bearish momentum columns to gauge market direction. Look for crossovers to signal potential trend changes.
Take Action : Use alerts for breakouts above the upper band or for take-profit levels to enhance your trade execution.
How It Works:
The Market Pressure Index separates bullish and bearish momentum by analyzing price movement (close vs. open) and volatility. These values are smoothed using Hull Moving Averages (HMA) to highlight trends while minimizing noise. A deviation-based upper band dynamically tracks market extremes, signaling breakout zones. Color gradients depict the intensity of momentum, offering a clear, visually intuitive representation of market pressure. Alerts are triggered when significant crossovers or take-profit conditions occur, giving traders actionable insights without constant chart monitoring.
Smart Money Breakout Signals [AlgoAlpha]Introducing the Smart Money Breakout Signals, a cutting-edge trading indicator designed to identify key structural shifts and breakout opportunities in the market. This tool leverages a blend of smart money concepts like Break of Structure (BOS) and Change of Character (CHoCH) to provide traders with actionable insights into market direction and potential entry or exit points.
Key Features :
✨ Market Structure Analysis : Automatically detects and labels BOS and CHoCH for trend confirmation and reversals.
🎨 Customizable Visualization : Tailor bullish and bearish colors for breakout lines and signals to suit your preferences.
📊 Dynamic Take-Profit Targets : Displays three tiered take-profit levels based on breakout volatility.
🔔 Real-Time Alerts : Stay ahead of the game with notifications for bullish and bearish breakouts.
📋 Performance Dashboard : Monitor signal statistics, including win rates and total signals, directly on your chart.
How to Use :
Add the Indicator : Add the script to your favourites ⭐ and customize settings like market structure horizon and confirmation type.
Monitor Breakouts : Observe BOS and CHoCH labels to identify potential trend shifts. Use the breakout lines and tiered take-profit levels to plan trades effectively.
Set Alerts : Enable alerts for bullish or bearish breakouts to act on opportunities without constant monitoring.
How It Works :
The indicator identifies market structure by analyzing pivot highs and lows over a user-defined time horizon. A breakout is confirmed based on either candle closes or wicks surpassing previous pivot points. Upon detection, the script generates signals with breakout lines and calculates take-profit targets based on the distance from the breakout level. A built-in dashboard tracks performance metrics like total signals and win rates, giving traders real-time feedback on strategy effectiveness.

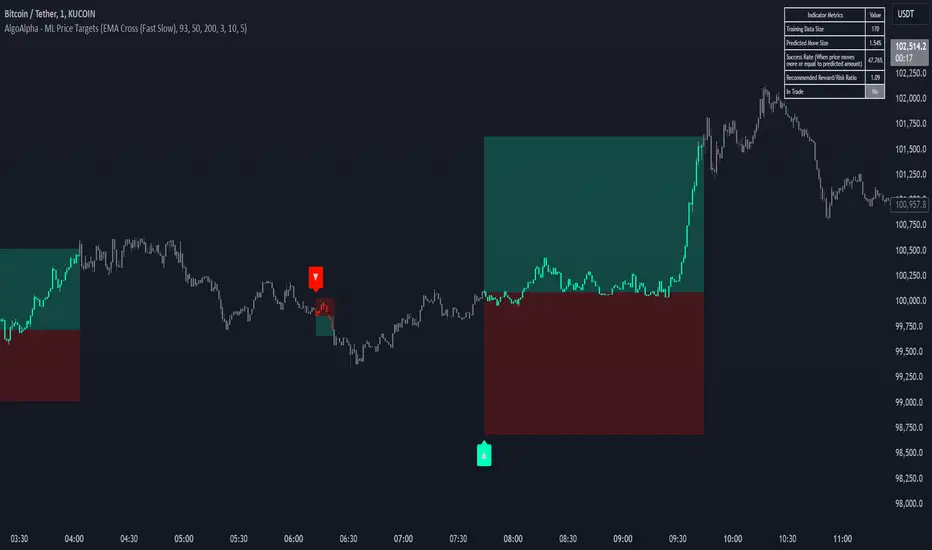
Machine Learning Price Target Prediction Signals [AlgoAlpha]Introducing the Machine Learning Price Target Predictions, a cutting-edge trading tool that leverages kernel regression to provide accurate price targets and enhance your trading strategy. This indicator combines trend-based signals with advanced machine learning techniques, offering predictive insights into potential price movements. Perfect for traders looking to make data-driven decisions with confidence.
What is Kernel Regression and How It Works
Kernel regression is a non-parametric machine learning technique that estimates the relationship between variables by weighting data points based on their similarity to a given input. The similarity is determined using a kernel function, such as the Gaussian (RBF) kernel, which assigns higher weights to closer data points and progressively lower weights to farther ones. This allows the model to make smooth and adaptive predictions, balancing recent data and historical trends.
Key Features
🎯 Predictive Price Targets : Uses kernel regression to estimate the magnitude of price movements.
📈 Dynamic Trend Analysis : Multiple trend detection methods, including EMA crossovers, Hull Moving Average, and SuperTrend.
🔧 Customizable Settings : Adjust bandwidth for kernel regression and tweak trend indicator parameters to suit your strategy.
📊 Visual Trade Levels : Displays take-profit and stop-loss levels directly on the chart with customizable colors.
📋 Performance Metrics : Real-time win rate, recommended risk-reward ratio, and training data size displayed in an on-chart table.
🔔 Alerts : Get notified for new trends, take-profit hits, and stop-loss triggers.
How to Use
🛠 Add the Indicator : Add it to your favorites and apply it to your chart. Configure the trend detection method (SuperTrend, HMA, or EMA crossover) and other parameters based on your preferences.
📊 Analyze Predictions : Observe the predicted move size, recommended risk-reward ratio, and trend direction. Use the displayed levels for trade planning.
🔔 Set Alerts : Enable alerts for trend signals, take-profit hits, or stop-loss triggers to stay informed without constant monitoring.
How It Works
The indicator calculates features such as price volatility, relative strength, and trend signals, which are stored during training periods. When a trend change is detected, the kernel regression model predicts the likely price move based on these features. Predictions are smoothed using the specified bandwidth to avoid overfitting while ensuring timely responses to feature changes. Visualized take-profit and stop-loss levels help traders optimize risk management. Real-time metrics like win rate and recommended risk-reward ratios provide actionable insights for decision-making.
Support and Resistance Non-Repainting [AlgoAlpha]Elevate your technical analysis with the Non-Repainting Support and Resistance indicator from AlgoAlpha. Designed for traders who value precision, this tool highlights key support and resistance zones without repainting, ensuring reliable signals for better market decisions.
Key Features
🔍 Concise Zones: Identifies critical levels in real-time without repainting.
🖍 Customizable Appearance: Choose your preferred colors for bullish and bearish zones.
📏 Pivot Sensitivity Settings: Adjust the lookback period to fit different market conditions.
🔔 Visual Alerts: Highlights zones on your chart with clear, dynamic boxes and lines.
How to Use
Add the Indicator : Add it to your favorites chart by clicking the star icon. Adjust the lookback period, max zone duration, and colors to match your strategy.
Analyze the Chart : Look for zones where prices frequently react, indicating strong support or resistance.
Set Alerts : Enable notifications for new zone formations and zone invalidations, ensuring you never miss critical market moves.
How It Works
The indicator detects pivot highs and lows using a specified lookback period. When a pivot is confirmed, it draws corresponding support or resistance zones using TradingView’s built-in drawing tools. These zones extend until price breaks through them or they expire based on a maximum allowed duration. The indicator continuously checks if price interacts with any active zones and adjusts accordingly, ensuring accurate and real-time visualization.

Dynamic Supply and Demand Zones [AlgoAlpha]Introducing the Dynamic Supply and Demand Zones by AlgoAlpha. This indicator is designed to automatically identify and visualize dynamic supply and demand zones on your chart, helping traders pinpoint potential reversal areas and assess market sentiment with enhanced clarity. It adapts to market conditions using a dynamic look-back mechanism, making it more responsive to recent price movements. 📈💡
Key Features
📊 Dynamic Look-Back : Automatically adjusts the look-back period based on the most recent pivot point, ensuring the most relevant data is analyzed.
🎯 Pivot Point Detection : Utilizes a user-defined period to detect significant pivot highs and lows, marking potential reversal points with precision.
🛠 Customizable Parameters : Offers extensive customization options including look-back period, pivot detection sensitivity, resolution, and zone tolerance.
🗺 Visual Display : Shows supply and demand zones as boxes on the chart, with optional profiles and background highlighting to differentiate between bullish and bearish zones.
🖍 Color-Coded Zones : Zones are color-coded for easy identification: green for bullish, red for bearish, and gray for neutral levels.
🔔 Alert Conditions : Triggers alerts when new pivot points are detected, ensuring you never miss a key market movement.
How to Use
🚀 Adding the Indicator : Press the star icon and add the indicator to favorites. Add it to your chart and adjust settings to fit your trading strategy.
🔍 Zone Analysis : Observe the color-coded zones on the chart. Bullish zones indicate potential support areas, while bearish zones suggest resistance. Monitor price interactions with these zones for potential entry and exit signals.
🔔 Alerts : Activate alert conditions for new pivot detections to stay ahead of market reversals.
How It Works
The indicator starts by detecting pivot highs and lows over a specified period. These pivots serve as reference points for determining the analysis range. If the Dynamic Look-Back feature is enabled, the look-back range dynamically adjusts from the most recent pivot to the current bar. Otherwise, a fixed look-back period is used. The price range is divided into multiple bins based on a specified resolution, and each bin’s volume is calculated by accumulating the volume of candles that fall within its price range. A zone is defined as significant if its volume is less than the adjacent bins, and the difference meets the Zone Tolerance criteria, indicating a potential area of support or resistance. These zones are then plotted on the chart as boxes. Bullish zones are shown in green, and bearish zones in red, helping traders visually identify key levels where supply and demand imbalances may cause price reversals.

Standardized PSAR Oscillator [AlgoAlpha]Enhance your trading experience with the "Standardized PSAR Oscillator" 🪝, a powerful tool that combines the Parabolic Stop and Reverse (PSAR) with standardization techniques to offer more nuanced insights into market trends and potential reversals.
🔑 Key Features:
- 🛠 Customizable PSAR Settings: Adjust the starting point, increment, and maximum values for the PSAR to tailor the indicator to your strategy.
- 📏 Standardization: Smooth out volatility by standardizing the PSAR values using a customizable EMA, making reversals easier to identify.
- 🎨 Dynamic Color-Coding: The oscillator changes colors based on market conditions, helping you quickly spot bullish and bearish trends.
- 🔄 Divergence Detection: Automatic detection of bullish and bearish divergences with customizable sensitivity and confirmation settings.
- 🔔 Alerts: Set up alerts for key events like zero-line crossovers and trend weakening, ensuring you never miss a critical market move.
🚀 How to Use:
✨ Add the Indicator: Add the indicator to favorites by pressing the star icon, adjust the settings to suite your needs.
👀 Monitor Signals: Watch for the automatic plotting of divergences and reversal signals to identify potential market entries and exits.
🔔 Set Alerts: Configure alerts to get notified of key changes without constantly monitoring the charts.
🔍 How It Works:
The Standardized PSAR Oscillator is an advanced trading tool that refines the traditional PSAR (Parabolic Stop and Reverse) indicator by incorporating several key enhancements to improve trend analysis and signal accuracy. The script begins by calculating the PSAR, a widely used indicator known for its effectiveness in identifying trend reversals. To make the PSAR more adaptive and responsive to market conditions, it is standardized using an Exponential Moving Average (EMA) of the high-low range over a user-defined period. This standardization helps to normalize the PSAR values, making them more comparable across different market conditions.
To further enhance signal clarity, the standardized PSAR is then smoothed using a Weighted Moving Average (WMA). This combination of EMA and WMA creates an oscillator that not only captures trend direction but also smooths out market noise, providing a cleaner signal. The oscillator's values are color-coded to visually indicate its position relative to the zero line, with additional emphasis on whether the WMA is rising or falling—this helps traders quickly interpret the trend’s strength and direction.
The oscillator also includes built-in divergence detection by comparing pivot points in price action with those in the oscillator. This feature helps identify potential discrepancies between the price and the oscillator, signaling possible trend reversals. Alerts can be configured for when the oscillator crosses the zero line or when a trend shows signs of weakening, ensuring that traders receive timely notifications to act on emerging opportunities. These combined elements make the Standardized PSAR Oscillator a robust tool for enhancing your trading strategy with more reliable and actionable signals

Volume Spread Analysis [AlgoAlpha]Unleash the power of Volume Spread Analysis (VSA) with our state-of-the-art indicator designed to detect market divergences and convergences, helping you make informed trading decisions. 📈
Key Features:
Detects bullish and bearish divergences based on volume and price movements. 📊🔍
Identifies bullish and bearish convergences, signaling potential trend continuations or reversals. 🔄📉
Customizable parameters for period length, volume SMA period, and outlier reduction factor. ⚙️🔧
Visual highlights for detected effects, with color-coded boxes and labels. 🟩🟥
Provides alerts for divergences and convergences, keeping you updated on market conditions. 🔔📬
📚 Introduction to Volume Spread Analysis (VSA) :
Volume Spread Analysis is a method used to interpret the relationship between volume and price to identify the intentions of market participants. By analyzing the spread (range) of a price bar and its corresponding volume, VSA helps traders discern market strength and potential reversals.
In VSA, harmony occurs when price and volume move in sync, such as when increasing prices(aka "Effect" in the script) are accompanied by increasing volume. This indicates a strong and healthy trend. Conversely, divergence happens when price and volume move in opposite directions. For example, if prices are rising lesser but volume is still high, it may signal a weakening trend and a potential reversal. Identifying these patterns helps traders understand market dynamics and make more informed trading decisions.
🛠 Quick Guide to Using the Volume Spread Analysis Indicator
⭐ Add the Indicator: Add the indicator to favorites by pressing the star icon. Customize settings such as period length, volume SMA period, and outlier reduction factor to fit your trading style.
📊 Market Analysis: Watch for color-coded boxes indicating effects and labels showing effort values. Look for divergences and convergences to identify potential trading opportunities. A higher work done suggests that the markets are needing to work harder to move the price and users can use that information as displayed below each trend impulse box to analyze the likely hood of trend continuation/reversals.
🔔 Alerts: Enable alerts for divergences and convergences to stay informed of critical market conditions without constant chart monitoring.
🔍 How It Works:
Our indicator meticulously analyzes volume and price data to detect significant market movements. It identifies periods where volume is above or below a moving average, marks these points, and tracks the price effect over a user-defined range. By calculating the effort (volume) and effect (price movement), it distinguishes between divergences and convergences based on predefined conditions. Bullish and bearish conditions are visually represented with color-coded boxes and labels, making it easy to spot trading opportunities. Alerts can be set to notify you of critical market conditions, ensuring you never miss a potential trade setup.
Happy trading! 📈🚀

Trend Flow Profile [AlgoAlpha]Description:
The "Trend Flow Profile" indicator is a powerful tool designed to analyze and interpret the underlying trends and reversals in a financial market. It combines the concepts of Order Flow and Rate of Change (ROC) to provide valuable insights into market dynamics, momentum, and potential trade opportunities. By integrating these two components, the indicator offers a comprehensive view of market sentiment and price movements, facilitating informed trading decisions.
Rationale:
The combination of Order Flow and ROC in the "Trend Flow Profile" indicator stems from the recognition that both factors play critical roles in understanding market behavior. Order Flow represents the net buying or selling pressure in the market, while ROC measures the rate at which prices change. By merging these elements, the indicator captures the interplay between market participants' actions and the momentum of price movements, enabling traders to identify trends, spot reversals, and gauge the strength of price acceleration or deceleration.
Calculation:
The Order Flow component is computed by summing the volume when prices move up and subtracting the volume when prices move down. This cumulative measure reflects the overall order imbalance in the market, providing insights into the dominant buying or selling pressure.
The ROC component calculates the percentage change in price over a given period. It compares the current price to a previous price and expresses the change as a percentage. This measurement indicates the velocity and direction of price movement, allowing traders to assess the market's momentum.
How to Use It?
The "Trend Flow Profile" indicator offers valuable information to traders for making informed trading decisions. It enables the identification of underlying trends and potential reversals, providing a comprehensive view of market sentiment and momentum. Here are some key ways to utilize the indicator:
Spotting Trends: The indicator helps identify the prevailing market trend, whether bullish or bearish. A consistent positive (green) histogram indicates a strong uptrend, while a consistent negative (red) histogram suggests a robust downtrend.
Reversal Signals: Reversal patterns can be identified when the histogram changes color, transitioning from positive to negative (or vice versa). These reversals can signify potential turning points in the market, highlighting opportunities for counter-trend trades.
Momentum Assessment: By observing the width and intensity of the histogram, traders can assess the acceleration or deceleration of price momentum. A wider histogram suggests strong momentum, while a narrower histogram indicates a potential slowdown.
Utility:
The "Trend Flow Profile" indicator serves as a valuable tool for traders, providing several benefits. Traders can easily identify the prevailing market trend, enabling them to align their trading strategies with the dominant direction of the market. The indicator also helps spot potential reversals, allowing traders to anticipate market turning points and capture counter-trend opportunities. Additionally, the green and red histogram colors provide visual cues to determine the optimal duration of a long or short position. Following the green histogram signals when in a long position and the red histogram signals when in a short position can assist traders in managing their trades effectively. Moreover, the width and intensity of the histogram offer insights into the acceleration or deceleration of momentum. Traders can gauge the strength of price movements and adjust their trading strategies accordingly. By leveraging the "Trend Flow Profile" indicator, traders gain a comprehensive understanding of market dynamics, which enhances their decision-making and improves their overall trading outcomes.

Algo Market Structure (Nephew_Sam_)This indicator takes a different approach into reading market structure.
The key difference between this logic compared to the pivot logic is; we read highs and lows based on bullish and bearish candles. Ie:
Pivot method - highest/lowest point in previous and next X candles
Algo method - Bullish candle(s) followed by a bearish candle and vice versa
More explanation in each of the key feature below.
Here are all of the concepts and features included in the indicator:
Timeframe
- You can select the timeframe of the indicator (has to be higher or equal to the chart timeframe)
- Min option is the minimum timeframe to show the indicator. If you show daily structure on 1m chart, you can run into a timeout error so keep it close to the chart timeframe.
- Recommended timeframe for no bugs is the current chart timeframe.
Structure
The structure is calculated using a combination of candle patterns (ie. pivot top = Bullish x3-Bearish-Bullish) and marks out circle labels after a new HH or LL
Structure high = 1 or more consecutive bull candles followed by a bear candle
Structure low = 1 or more consecutive bear candles followed by a bull candle
Structure direction change = when the second previous H/L is taken out (TLQ)
ILQ - Inducement Liquidity concept
In a bearish example this is the most recent structure high.
TLQ
In a bearish example this is the second most recent structure high.
This is also what helps define our structure direction. If broken, the structure changes (bullish / bearish) and plots a bos line.
EPA - Efficient price action
When price returns back to previous structure point after bos. Similar to an ICT breaker.
Note: It might be a little, just a little buggy if you have set your indicator timeframe to higher than the chart timeframe.
Extremes Zones
The final zone to find a trade entry before a structural shift. These are wick of the TLQ candle. This is select the wick of the current timeframe candle even if indicator is set to higher timeframe.
MSU
Tiny arrow labels at the bottom of your chart. Plots the arrows when price is between an ILQ and TLQ
VTA
Valid trading range. This is when we get some sort of a structure pattern. Plots a box when price induces previous structure point and then breaks structure in the opposite direction. Here are the patterns:
Bull VTA - HH-LL-HH
Bear VTA - LL-HH-LL
Bull Strict VTA - LL-HH-LL-HH
Bear Strict VTA - HH-LL-HH-LL
Bar colors
Changes the bar color based on the structure to all green/red.
Note: for this to work, you will have to right click on the indicator, then under visual order select 'bring to front'
Table
This table plots the structure stats/data
1. If structure is bullish / bearish
2. If price is efficient or not
3. If there is an MSU
4. If price is inside a VTA
Disclaimer: This indicator is fully written from scratch by me, the idea behind the concepts come from AlgoHub material on Youtube. Do NOT use this code for reselling purposes and if anything is created using any part of this code, the source code should be public.

Mutanabby_AI | Ultimate Algo | Remastered+Overview
The Mutanabby_AI Ultimate Algo Remastered+ represents a sophisticated trend-following system that combines Supertrend analysis with multiple moving average confirmations. This comprehensive indicator is designed specifically for identifying high-probability trend continuation and reversal opportunities across various market conditions.
Core Algorithm Components
**Supertrend Foundation**: The primary signal generation relies on a customizable Supertrend indicator with adjustable sensitivity (1-20 range). This adaptive trend-following tool uses Average True Range calculations to establish dynamic support and resistance levels that respond to market volatility.
**SMA Confirmation Matrix**: Multiple Simple Moving Averages (SMA 4, 5, 9, 13) provide layered confirmation for signal strength. The algorithm distinguishes between regular signals and "Strong" signals based on SMA 4 vs SMA 5 relationship, offering traders different conviction levels for position sizing.
**Trend Ribbon Visualization**: SMA 21 and SMA 34 create a visual trend ribbon that changes color based on their relationship. Green ribbon indicates bullish momentum while red signals bearish conditions, providing immediate visual trend context.
**RSI-Based Candle Coloring**: Advanced 61-tier RSI system colors candles with gradient precision from deep red (RSI ≤20) through purple transitions to bright green (RSI ≥79). This visual enhancement helps traders instantly assess momentum strength and overbought/oversold conditions.
Signal Generation Logic
**Buy Signal Criteria**:
- Price crosses above Supertrend line
- Close price must be above SMA 9 (trend confirmation)
- Signal strength determined by SMA 4 vs SMA 5 relationship
- "Strong Buy" when SMA 4 ≥ SMA 5
- Regular "Buy" when SMA 4 < SMA 5
**Sell Signal Criteria**:
- Price crosses below Supertrend line
- Close price must be below SMA 9 (trend confirmation)
- Signal strength based on SMA relationship
- "Strong Sell" when SMA 4 ≤ SMA 5
- Regular "Sell" when SMA 4 > SMA 5
Advanced Risk Management System
**Automated TP/SL Calculation**: The indicator automatically calculates stop loss and take profit levels using ATR-based measurements. Risk percentage and ATR length are fully customizable, allowing traders to adapt to different market conditions and personal risk tolerance.
**Multiple Take Profit Targets**:
- 1:1 Risk-Reward ratio for conservative profit taking
- 2:1 Risk-Reward for balanced trade management
- 3:1 Risk-Reward for maximum profit potential
**Visual Risk Display**: All risk management levels appear as both labels and optional trend lines on the chart. Customizable line styles (solid, dashed, dotted) and positioning ensure clear visualization without chart clutter.
**Dynamic Level Updates**: Risk levels automatically recalculate with each new signal, maintaining current market relevance throughout position lifecycles.
Visual Enhancement Features
**Customizable Display Options**: Toggle trend ribbon, TP/SL levels, and risk lines independently. Decimal precision adjustments (1-8 decimal places) accommodate different instrument price formats and personal preferences.
**Professional Label System**: Clean, informative labels show entry points, stop losses, and take profit targets with precise price levels. Labels automatically position themselves for optimal chart readability.
**Color-Coded Momentum**: The gradient RSI candle coloring system provides instant visual feedback on momentum strength, helping traders assess market energy and potential reversal zones.
Implementation Strategy
**Timeframe Optimization**: The algorithm performs effectively across multiple timeframes, with higher timeframes (4H, Daily) providing more reliable signals for swing trading. Lower timeframes work well for day trading with appropriate risk adjustments.
**Sensitivity Adjustment**: Lower sensitivity values (1-5) generate fewer but higher-quality signals, ideal for conservative approaches. Higher sensitivity (15-20) increases signal frequency for active trading styles.
**Risk Management Integration**: Use the automated risk calculations as baseline parameters, adjusting risk percentage based on account size and market conditions. The 1:1, 2:1, 3:1 targets enable systematic profit-taking strategies.
Market Application
**Trend Following Excellence**: Primary strength lies in capturing significant trend movements through the Supertrend foundation with SMA confirmation. The dual-layer approach reduces false signals common in single-indicator systems.
**Momentum Assessment**: RSI-based candle coloring provides immediate momentum context, helping traders assess signal strength and potential continuation probability.
**Range Detection**: The trend ribbon helps identify ranging conditions when SMA 21 and SMA 34 converge, alerting traders to potential breakout opportunities.
Performance Optimization
**Signal Quality**: The requirement for both Supertrend crossover AND SMA 9 confirmation significantly improves signal reliability compared to basic trend-following approaches.
**Visual Clarity**: The comprehensive visual system enables rapid market assessment without complex calculations, ideal for traders managing multiple instruments.
**Adaptability**: Extensive customization options allow fine-tuning for specific markets, trading styles, and risk preferences while maintaining the core algorithm integrity.
## Non-Repainting Design
**Educational Note**: This indicator uses standard TradingView functions (Supertrend, SMA, RSI) with normal behavior patterns. Real-time updates on current candles are expected and standard across all technical indicators. Historical signals on closed candles remain fixed and unchanged, ensuring reliable backtesting and analysis.
**Signal Confirmation**: Final signals are confirmed only when candles close, following standard technical analysis principles. The algorithm provides clear distinction between developing signals and confirmed entries.
Technical Specifications
**Supertrend Parameters**: Default sensitivity of 4 with ATR length of 11 provides balanced signal generation. Sensitivity range from 1-20 allows adaptation to different market volatilities and trading preferences.
**Moving Average Configuration**: SMA periods of 8, 9, and 13 create multi-layered trend confirmation, while SMA 21 and 34 form the visual trend ribbon for broader market context.
**Risk Management**: ATR-based calculations with customizable risk percentage ensure dynamic adaptation to market volatility while maintaining consistent risk exposure principles.
Recommended Settings
**Conservative Approach**: Sensitivity 4-5, RSI length 14, higher timeframes (4H, Daily) for swing trading with maximum signal reliability.
**Active Trading**: Sensitivity 6-8, RSI length 8-10, intermediate timeframes (1H) for balanced signal frequency and quality.
**Scalping Setup**: Sensitivity 10-15, RSI length 5-8, lower timeframes (15-30min) with enhanced risk management protocols.
## Conclusion
The Mutanabby_AI Ultimate Algo Remastered+ combines proven trend-following principles with modern visual enhancements and comprehensive risk management. The algorithm's strength lies in its multi-layered confirmation approach and automated risk calculations, providing both novice and experienced traders with clear signals and systematic trade management.
Success with this system requires understanding the relationship between signal strength indicators and adapting sensitivity settings to match current market conditions. The comprehensive visual feedback system enables rapid decision-making while the automated risk management ensures consistent trade parameters.
Practice with different sensitivity settings and timeframes to optimize performance for your specific trading style and risk tolerance. The algorithm's systematic approach provides an excellent framework for disciplined trend-following strategies across various market environments.

Simple RSI-MA Algo Beats DOW By Huge Margin Over Past 100 Years!This simple RSI-MA long/short algorithm beats the Dow by a FREAKING HUGE margin over the past century (excluding dividends and trading costs).
The algorithm uses a fast SMA of the RSI as a buy/cover signal and a slow SMA of the RSI as a sell/short signal.
Backtest period = 09/17/1916 - 11/02/2015
Dow = 98 --> 17,830 = +18,094% = 5.38% CAGR
Algorithm = net profit + open P/L = +43,349% = 6.31% CAGR
Notice how the algorithm dodged both the 30s' Great Depression and the 2008 Crisis. Pretty cool huh? :)
ALGORITHM'S FORMULA (use weekly chart):
Buy/Cover = MA10(RSI10) cross> 50
Sell/Short = MA50(RSI10) cross< 50
STRATEGY TESTER'S SETTINGS:
- Initial cash = $10,000
- Pyramiding disabled
- Re-investment enabled (order size = 100% of equity )
- Trade re-calculations disabled
DISCLAIMER: None of my ideas and posts are investment advice. Past performance is not an indication of future results. This strategy was constructed with the benefit of hindsight and its future performance cannot be guaranteed.

Triple EMA + Key Levels [Scalping-Algo]TITLE: Triple EMA Day Trading System with Multi-Timeframe Support/Resistance Levels
DESCRIPTION:
📊 Overview
This indicator combines trend-following EMAs with key historical price levels to create a complete day trading toolkit. It helps traders identify trend direction while highlighting important support and resistance zones from multiple timeframes.
🎯 Purpose & Trading Application
Day traders often need to quickly assess:
1. Current trend direction (using EMAs)
2. Key price levels where reversals or breakouts may occur
This indicator solves both needs in one tool, reducing chart clutter from multiple indicators.
📈 How It Works
TREND IDENTIFICATION (EMAs):
- EMA 13 (Yellow): Fast EMA for short-term momentum and entry timing
- EMA 48 (Purple): Medium EMA for intraday trend direction
- EMA 200 (Red): Slow EMA for overall trend bias
Trading Logic:
- When price is above all 3 EMAs = Strong bullish bias
- When price is below all 3 EMAs = Strong bearish bias
- EMA crossovers signal potential trend changes
- The 13/48 crossover is particularly useful for intraday entries
SUPPORT & RESISTANCE LEVELS:
- Previous Day High/Low (Green, Solid): Most recent daily range - high probability reaction zones
- 2-Day High/Low (Blue, Dashed): Extended lookback for stronger levels
- Previous Week High/Low (Orange, Dotted): Major institutional levels
Why These Levels Matter:
Previous day and weekly highs/lows are watched by many traders and algorithms. Price often:
- Reverses at these levels (support/resistance)
- Accelerates through them (breakout trades)
🔧 How To Use
FOR TREND TRADING:
1. Identify bias using EMA stack (all 3 aligned = strong trend)
2. Look for pullbacks to EMA 13 or 48 for entries
3. Use key levels as profit targets
FOR REVERSAL TRADING:
1. Watch for price approaching previous day/week levels
2. Look for rejection candles at these levels
3. Use EMA 13 break as confirmation
FOR BREAKOUT TRADING:
1. Identify consolidation near key levels
2. Enter on break of level with volume
3. Use opposite level as target
⚙️ Settings
All parameters are fixed for simplicity:
- EMAs: 13, 48, 200 periods
- Levels: Previous Day, 2-Day, Previous Week
- All lines thickness: 2
📝 Notes
- Best used on intraday timeframes (1min to 1hour)
- Levels update automatically each day/week
- Labels on right side identify each level (PDH, PDL, 2DH, 2DL, PWH, PWL)
---
TAGS: ema, daytrading, support, resistance, levels, intraday, trend, scalping, swingtrading

Murder Algo Stats: last portion of Indices closing hour (S&P)Stats regarding the 'murder algo' (last 10mins of the closing hour). Works on all sub-1hr timeframes. Best used on 5min, 10min 15min timeframe. Ideal use on 10min timeframe.
Can be applied to other user input sessions also
What i'm calling the 'Murder Algo' is the tendency of dynamic lower time frame price action in the final 10minutes of the S&P closing hour (or any of the three major US indices: S&P, Nasdaq, Dow).
If there are un-met liquidity targets (i.e. clean highs or lows) as we come into the last portion of the closing hour, price has a tendency to stretch up or down to reach these targets, swiftly.
These statisitics are somewhat experimental/research; trying to quantify this tendency. Please comment below if you think of some additions / modifications that may prove useful.
//Purpose:
-To get statistics of the tendency to 'reach' of the final bar (10minute bar in the above) of the closing hour in Indices (3pm - 4pm NY time).
-Specifically to see how often price reaches for HH or LL in the final bar of the closing hour (most of the time); and to see how far it reaches one way when it does (Mean, median, mode).
//Notes:
-Two sets of historical stats; one is based on the 'solo reach' of the last bar; the other is based on the reach of the last bar from the average price of the preceding bars of the session (purple line in the above)
-Works on any timeframe below hourly. Ideally used on 10min timeframe, but may be interesting to plot on 15min or 5min timeframe also.
-Should also work on custom user-defined session; though this indicator was explicly designed to investigate the 'murder algo': that final rush and/or whipsaw tendency of price in the last few minutes of Regular trading on Indices.
-For S&P, best used on SPX, which gives the longest history of all the S&P variants due to only showing Regular trading hours bars (500 days of history on 10min timeframe, for premium users)
-For most stats, i've rounded to ES1! mintick (i.e. rounded to nearest quarter dollar) =>> This allows more meaningful values for 'mode' statistical measure.
-I trade S&P; but this 'muder algo' phenomenon also obviously presents in Nasdaq and Dow.
//User Inputs:
-Session time input (defaults to closing hour 3pm - 4pm NY time)
-Average method (for the average of all the input session EXCEPT the final bar)
-Toggle on/off Average line.
-other formatting options: text color, table position, line color/style/size.
Example usage with annotations on SPX 500 chart 15m timeframe; using closing hour (3pm-4pm NY time) as our session:

TV Community AlgoTV Community Algo is a free TradingView script that I designed from the ground to benefit the traders of this community. It has plenty of features that you will enjoy, and I have included documentation for how to use this below!
Settings:
Basic:
Turn the Void Lines on or off
Turn the Dashboard on or off
Turn the Signal Bars on or off
Turn the Support & Resistance Lines on or off
Turn the EMA 8 and EMA 200 on or off
Turn the Buy & Sell Signals on or off
Turn the Fibonacci Retracement Tool on or off
Style:
Change the Dashboard's distance from the price action
Change the Dashboard's Color and Transparency
Change the Dashboard Text Color
Change the Fibonacci Deviation
Make the Fibonacci Retracement Tool reverse
Make the Fibonacci Lines extend left, right, both directions, or none
Turn Fibonacci Prices on or off
Turn Fibonacci Levels on or off and change between percent or value
Change Fibonacci Label Position from the left or the right
Usage:
This algo has many uses including but not limited to:
Finding entries and exits using the EMA 8 and EMA 200 crossovers
Using the Void Lines to identify bounces or reversals
Using the Signal Bars to identify trend and confirmation for entries and exits
Using the Dashboard information for confirmation and informational purposes
In the images below, I give a few examples of the many uses of the TV Community Algo!
VOID LINES
The Void Lines are very helpful when it comes to identifying reversals.
TV COMMUNITY ALGO DASHBOARD
The Dashboard is filled with useful information that all traders can benefit from!
SIGNAL BARS
The colored candles known as Signal Bars inform you of when the price action is above or below the midpoint of the Void Lines.
AUTO SUPPORT & RESISTANCE LINES
These lines help traders find accurate levels of support & resistance on all time frames, and the lines change color depending on if the price is above or below them.
EMA 8 AND 200
The EMA 8 and EMA 200 crossovers can be used as entry and exit signals.
BUY & SELL SIGNALS
The BUY & SELL signals can be used to find optimal entries and exits for trades on any time frame. Smaller time frames are best for scalping, while larger time frames are more suited for longer trades. When combined with the EMA lines and Dashboard information, these signals can produce incredibly profitable trades.
AUTO FIBONACCI RETRACEMENT TOOL
The Auto Fibonacci Retracement Tool allows you to plot perfect Fib Lines every time.
Conclusion:
I truly hope that the TV Community Algo benefits the TradingView community and that you all find some value in it. I worked very hard on this product and I would love to see it put to good use.
with love,
-Lemon 🍋
This work is licensed under a Attribution-NonCommercial-ShareAlike 4.0 International (CC BY-NC-SA 4.0) creativecommons.org

Parabolic SAR [with Algorithm and Alerts]Hello All,
In one of my projects I needed Parabolic SAR algorithm. I decided to write it in Pine and publish it. Then I added Alerts and Labels. here it is ;)
ENJOY!
