ICT Silver Bullet | Flux Charts💎 GENERAL OVERVIEW
Introducing our new ICT Silver Bullet Indicator! This indicator is built around the ICT's "Silver Bullet" strategy. The strategy has 5 steps for execution and works best in 1-5 min timeframes. For more information about the process, check the "HOW DOES IT WORK" section.
Features of the new ICT Silver Bullet Indicator :
Implementation of ICT's Silver Bullet Strategy
Customizable Execution Settings
2 NY Sessions & London Session
Customizable Backtesting Dashboard
Alerts for Buy, Sell, TP & SL Signals
📌 HOW DOES IT WORK ?
ICT's Silver Bullet strategy has 5 steps :
1. Mark your market sessions open (This indicator has 3 -> NY 10-11, NY 14-15, LDN 03-04)
2. Mark the swing liquidity points
3. Wait for market to take down one liquidity side
4. Look for a market structure-shift for reversals
5. Wait for a FVG for execution
This indicator follows these steps and inform you step by step by plotting them in your chart. You can switch execution types between FVG and MSS.
🚩UNIQUENESS
This indicator is an all-in-one suit for the ICT's Silver Bullet concept. It's capable of plotting the strategy, giving signals, a backtesting dashboard and alerts feature. It's designed for simplyfing a rather complex strategy, helping you to execute it with clean signals. The backtesting dashboard allows you to see how your settings perform in the current ticker. You can also set up alerts to get informed when the strategy is executable for different tickers.
⚙️SETTINGS
1. General Configuration
Execution Type -> FVG execution type will require a FVG to take an entry, while the MSS setting will take an entry as soon as it detects a market structure-shift.
MSS Swing Length -> The swing length when finding liquidity zones for market structure-shift detection.
Breakout Method -> If "Wick" is selected, a bar wick will be enough to confirm a market structure-shift. If "Close" is selected, the bar must close above / below the liquidity zone to confirm a market structure-shift.
FVG Detection -> "Same Type" means that all 3 bars that formed the FVG should be the same type. (Bullish / Bearish). "All" means that bar types may vary between bullish / bearish.
FVG Detection Sensitivity -> You can turn this setting on and off. If it's off, any 3 consecutive bullish / bearish bars will be calculated as FVGs. If it's on, the size of FVGs will be filtered by the selected sensitivity. Lower settings mean less but larger FVGs.
2. TP / SL
TP / SL Method -> If "Fixed" is selected, you can adjust the TP / SL ratios from the settings below. If "Dynamic" is selected, the TP / SL zones will be auto-determined by the algorithm.
Risk -> The risk you're willing to take if "Dynamic" TP / SL Method is selected. Higher risk usually means a better winrate at the cost of losing more if the strategy fails.
Close Position @ Session End -> If this setting is enabled, the current position (if any) will be closed at the beginning of a new session, regardless if it hit the TP / SL zone. If it's off, the position will be open until it hits a TP / SL zone.
Cari dalam skrip untuk "backtest"

Harmonic Pattern Detection, Prediction, and Backtesting ToolOverview:
The ultimate harmonic XABCD pattern identification, prediction, and backtesting system.
Harmonic patterns are among the most accurate of trading signals, yet they're widely underutilized because they can be difficult to spot and tedious to validate. If you've ever come across a pattern and struggled with questions like "are these retracement ratios close enough to the harmonic ratios?" or "what are the Potential Reversal levels and are they confluent with point D?", then this tool is your new best friend. Or, if you've never traded harmonic patterns before, maybe it's time to start. Put away your drawing tools and calculators, relax, and let this indicator do the heavy lifting for you.
- Identification -
An exhaustive search across multiple pivot lengths ensures that even the sneakiest harmonic patterns are identified. Each pattern is evaluated and assigned a score, making it easy to differentiate weak patterns from strong ones. Tooltips under the pattern labels show a detailed breakdown of the pattern's score and retracement ratios (see the Scoring section below for details).
- Prediction -
After a pattern is identified, paths to potential targets are drawn, and Potential Reversal Zone (PRZ) levels are plotted based on the retracement ratios of the harmonic pattern. Targets are customizable by pattern type (e.g. you can specify one set of targets for a Gartley and another for a Bat, etc).
- Backtesting -
A table shows the results of all the patterns found in the chart. Change your target, stop-loss, and % error inputs and observe how it affects your success rate.
//------------------------------------------------------
// Scoring
//------------------------------------------------------
A percentage-based score is calculated from four components:
(1) Retracement % Accuracy - this measures how closely the pattern's retracement ratios match the theoretical values (fibs) defined for a given harmonic pattern. You can change the "Allowed fib ratio error %" in Settings to be more or less inclusive.
(2) PRZ Level Confluence - Potential Reversal Zone levels are projected from retracements of the XA and BC legs. The PRZ Level Confluence component measures the closeness of the closest XA and BC retracement levels, relative to the total height of the PRZ.
(3) Point D / PRZ Confluence - this measures the closeness of point D to either of the closest two PRZ levels (identified in the PRZ Level Confluence component above), relative to the total height of the PRZ. In theory, the closer together these levels are, the higher the probability of a reversal.
(4) Leg Length Symmetry - this measures the ΔX symmetry of each leg. You can change the "Allowed leg length asymmetry %" in settings to be more or less inclusive.
So, a score of 100% would mean that (1) all leg retracements match the theoretical fib ratios exactly (to 16 decimal places), (2) the closest XA and BC PRZ levels are exactly the same, (3) point D is exactly at the confluent PRZ level, and (4) all legs are exactly the same number of bars. While this is theoretically possible, you have better odds of getting struck by lightning twice on a sunny day.
Calculation weights of all four components can be changed in Settings.
//------------------------------------------------------
// Targets
//------------------------------------------------------
A hard-coded set of targets are available to choose from, and can be applied to each pattern type individually:
(1) .618 XA = .618 retracement of leg XA, measured from point D
(2) 1.272 XA = 1.272 retracement of leg XA, measured from point D
(3) 1.618 XA = 1.618 retracement of leg XA, measured from point D
(4) .618 CD = .618 retracement of leg CD, measured from point D
(5) 1.272 CD = 1.272 retracement of leg CD, measured from point D
(6) 1.618 CD = 1.618 retracement of leg CD, measured from point D
(7) A = point A
(8) B = point B
(9) C = point C
//------------------------------------------------------
// Stops
//------------------------------------------------------
Stop-loss levels are also user-defined, in one of three ways:
(1) % beyond the furthest PRZ level (below the PRZ level for bullish patterns, and above for bearish)
(2) % beyond point D
(3) % of distance to Target 1, beyond point D. This method allows for a proper Risk:Reward approach by defining your potential losses as a percentage of the potential gains. This is the default.
//------------------------------------------------------
// Results Table / Backtesting Statistics
//------------------------------------------------------
To properly assess the effectiveness of a specific pattern type, a time limit is enforced for a completed pattern to reach the targets or the stop level. When this time limit expires, the pattern has "timed out", and is no longer considered in the Success Rate statistics. During the time limit period, if price reaches Target 1 before reaching the Stop level, the pattern is considered successful. Conversely, if price reaches the Stop level before reaching Target 1, the pattern is considered a failure. The time limit can be changed in Settings, and is defined in terms of the total pattern length (point X to point D). It is set to 1.5 by default.
Increasing the time limit value will give you more realistic Success Rate values, but will less accurately represent the success rate of the harmonic patterns (i.e. the more time that elapses after a pattern completes, the less likely it is that the price action is related to that pattern).
//------------------------------------------------------
// Coming soon...
//------------------------------------------------------
I have a handful of other features in development, including:
(1) Drawing incomplete patterns as they develop. This will allow you more time to plan entries and stops, or potentially trade reversals from point C to point D PRZ levels.
(2) Support for the Shark and Cypher patterns
(3) Alerts
Please report any bugs, runtime errors, other issues or enhancement suggestions.
I also welcome any feedback from experienced harmonic pattern traders, especially regarding your strategy for setting targets and stop-losses.
@reees

BO - Bar's direction Signal - BacktestingBO - Bar's direction Signal - Backtesting Options:
A. Factors Calculate probability of x bars same direction
1. Periods Counting: Data to count From day/month/year To day/month/year
2. Trading Time: only cases occurred in trading time were counted.
B. Timezone
1. Trading time depend on Time zone and specified chart.
2. Enable Highlight Trading Time to check your period time is correct
C. Date Backtesting
* Only cases occurred in Date Backtesting were reported.
D. Setup Options & Rule
1. Reversal after 2 bars same direction
* Probability of 3 bars same direction < 50
* 2 bars same direction is start of series
2. Reversal after 3 bars same direction
* Probability of 4 bars same direction < 50
* 3 bars same direction is start of series
3. Reversal after 4 bars same direction
* Probability of 4 bars same direction < 50
* 3 bars same direction is start of series
4. Reversal after 5 bars same direction
* Probability of 5 bars same direction < 50
* 4 bars same direction is start of series
5. Reversal after 6 bars same direction
* Probability of 6 bars same direction < 50
* 5 bars same direction is start of series

PnL Bubble [%] | Fractalyst1. What's the indicator purpose?
The PnL Bubble indicator transforms your strategy's trade PnL percentages into an interactive bubble chart with professional-grade statistics and performance analytics. It helps traders quickly assess system profitability, understand win/loss distribution patterns, identify outliers, and make data-driven strategy improvements.
How does it work?
Think of this indicator as a visual report card for your trading performance. Here's what it does:
What You See
Colorful Bubbles: Each bubble represents one of your trades
Blue/Cyan bubbles = Winning trades (you made money)
Red bubbles = Losing trades (you lost money)
Bigger bubbles = Bigger wins or losses
Smaller bubbles = Smaller wins or losses
How It Organizes Your Trades:
Like a Photo Album: Instead of showing all your trades at once (which would be messy), it shows them in "pages" of 500 trades each:
Page 1: Your first 500 trades
Page 2: Trades 501-1000
Page 3: Trades 1001-1500, etc.
What the Numbers Tell You:
Average Win: How much money you typically make on winning trades
Average Loss: How much money you typically lose on losing trades
Expected Value (EV): Whether your trading system makes money over time
Positive EV = Your system is profitable long-term
Negative EV = Your system loses money long-term
Payoff Ratio (R): How your average win compares to your average loss
R > 1 = Your wins are bigger than your losses
R < 1 = Your losses are bigger than your wins
Why This Matters:
At a Glance: You can instantly see if you're a profitable trader or not
Pattern Recognition: Spot if you have more big wins than big losses
Performance Tracking: Watch how your trading improves over time
Realistic Expectations: Understand what "average" performance looks like for your system
The Cool Visual Effects:
Animation: The bubbles glow and shimmer to make the chart more engaging
Highlighting: Your biggest wins and losses get extra attention with special effects
Tooltips: hover any bubble to see details about that specific trade.
What are the underlying calculations?
The indicator processes trade PnL data using a dual-matrix architecture for optimal performance:
Dual-Matrix System:
• Display Matrix (display_matrix): Bounded to 500 trades for rendering performance
• Statistics Matrix (stats_matrix): Unbounded storage for complete statistical accuracy
Trade Classification & Aggregation:
// Separate wins, losses, and break-even trades
if val > 0.0
pos_sum += val // Sum winning trades
pos_count += 1 // Count winning trades
else if val < 0.0
neg_sum += val // Sum losing trades
neg_count += 1 // Count losing trades
else
zero_count += 1 // Count break-even trades
Statistical Averages:
avg_win = pos_count > 0 ? pos_sum / pos_count : na
avg_loss = neg_count > 0 ? math.abs(neg_sum) / neg_count : na
Win/Loss Rates:
total_obs = pos_count + neg_count + zero_count
win_rate = pos_count / total_obs
loss_rate = neg_count / total_obs
Expected Value (EV):
ev_value = (avg_win × win_rate) - (avg_loss × loss_rate)
Payoff Ratio (R):
R = avg_win ÷ |avg_loss|
Contribution Analysis:
ev_pos_contrib = avg_win × win_rate // Positive EV contribution
ev_neg_contrib = avg_loss × loss_rate // Negative EV contribution
How to integrate with any trading strategy?
Equity Change Tracking Method:
//@version=6
strategy("Your Strategy with Equity Change Export", overlay=true)
float prev_trade_equity = na
float equity_change_pct = na
if barstate.isconfirmed and na(prev_trade_equity)
prev_trade_equity := strategy.equity
trade_just_closed = strategy.closedtrades != strategy.closedtrades
if trade_just_closed and not na(prev_trade_equity)
current_equity = strategy.equity
equity_change_pct := ((current_equity - prev_trade_equity) / prev_trade_equity) * 100
prev_trade_equity := current_equity
else
equity_change_pct := na
plot(equity_change_pct, "Equity Change %", display=display.data_window)
Integration Steps:
1. Add equity tracking code to your strategy
2. Load both strategy and PnL Bubble indicator on the same chart
3. In bubble indicator settings, select your strategy's equity tracking output as data source
4. Configure visualization preferences (colors, effects, page navigation)
How does the pagination system work?
The indicator uses an intelligent pagination system to handle large trade datasets efficiently:
Page Organization:
• Page 1: Trades 1-500 (most recent)
• Page 2: Trades 501-1000
• Page 3: Trades 1001-1500
• Page N: Trades to
Example: With 1,500 trades total (3 pages available):
• User selects Page 1: Shows trades 1-500
• User selects Page 4: Automatically falls back to Page 3 (trades 1001-1500)
5. Understanding the Visual Elements
Bubble Visualization:
• Color Coding: Cyan/blue gradients for wins, red gradients for losses
• Size Mapping: Bubble size proportional to trade magnitude (larger = bigger P&L)
• Priority Rendering: Largest trades displayed first to ensure visibility
• Gradient Effects: Color intensity increases with trade magnitude within each category
Interactive Tooltips:
Each bubble displays quantitative trade information:
tooltip_text = outcome + " | PnL: " + pnl_str +
"\nDate: " + date_str + " " + time_str +
"\nTrade #" + str.tostring(trade_number) + " (Page " + str.tostring(active_page) + ")" +
"\nRank: " + str.tostring(rank) + " of " + str.tostring(n_display_rows) +
"\nPercentile: " + str.tostring(percentile, "#.#") + "%" +
"\nMagnitude: " + str.tostring(magnitude_pct, "#.#") + "%"
Example Tooltip:
Win | PnL: +2.45%
Date: 2024.03.15 14:30
Trade #1,247 (Page 3)
Rank: 5 of 347
Percentile: 98.6%
Magnitude: 85.2%
Reference Lines & Statistics:
• Average Win Line: Horizontal reference showing typical winning trade size
• Average Loss Line: Horizontal reference showing typical losing trade size
• Zero Line: Threshold separating wins from losses
• Statistical Labels: EV, R-Ratio, and contribution analysis displayed on chart
What do the statistical metrics mean?
Expected Value (EV):
Represents the mathematical expectation per trade in percentage terms
EV = (Average Win × Win Rate) - (Average Loss × Loss Rate)
Interpretation:
• EV > 0: Profitable system with positive mathematical expectation
• EV = 0: Break-even system, profitability depends on execution
• EV < 0: Unprofitable system with negative mathematical expectation
Example: EV = +0.34% means you expect +0.34% profit per trade on average
Payoff Ratio (R):
Quantifies the risk-reward relationship of your trading system
R = Average Win ÷ |Average Loss|
Interpretation:
• R > 1.0: Wins are larger than losses on average (favorable risk-reward)
• R = 1.0: Wins and losses are equal in magnitude
• R < 1.0: Losses are larger than wins on average (unfavorable risk-reward)
Example: R = 1.5 means your average win is 50% larger than your average loss
Contribution Analysis (Σ):
Breaks down the components of expected value
Positive Contribution (Σ+) = Average Win × Win Rate
Negative Contribution (Σ-) = Average Loss × Loss Rate
Purpose:
• Shows how much wins contribute to overall expectancy
• Shows how much losses detract from overall expectancy
• Net EV = Σ+ - Σ- (Expected Value per trade)
Example: Σ+: 1.23% means wins contribute +1.23% to expectancy
Example: Σ-: -0.89% means losses drag expectancy by -0.89%
Win/Loss Rates:
Win Rate = Count(Wins) ÷ Total Trades
Loss Rate = Count(Losses) ÷ Total Trades
Shows the probability of winning vs losing trades
Higher win rates don't guarantee profitability if average losses exceed average wins
7. Demo Mode & Synthetic Data Generation
When using built-in sources (close, open, etc.), the indicator generates realistic demo trades for testing:
if isBuiltInSource(source_data)
// Generate random trade outcomes with realistic distribution
u_sign = prand(float(time), float(bar_index))
if u_sign < 0.5
v_push := -1.0 // Loss trade
else
// Skewed distribution favoring smaller wins (realistic)
u_mag = prand(float(time) + 9876.543, float(bar_index) + 321.0)
k = 8.0 // Skewness factor
t = math.pow(u_mag, k)
v_push := 2.5 + t * 8.0 // Win trade
Demo Characteristics:
• Realistic win/loss distribution mimicking actual trading patterns
• Skewed distribution favoring smaller wins over large wins
• Deterministic randomness for consistent demo results
• Includes jitter effects to prevent visual overlap
8. Performance Limitations & Optimizations
Display Constraints:
points_count = 500 // Maximum 500 dots per page for optimal performance
Pine Script v6 Limits:
• Label Count: Maximum 500 labels per indicator
• Line Count: Maximum 100 lines per indicator
• Box Count: Maximum 50 boxes per indicator
• Matrix Size: Efficient memory management with dual-matrix system
Optimization Strategies:
• Pagination System: Handle unlimited trades through 500-trade pages
• Priority Rendering: Largest trades displayed first for maximum visibility
• Dual-Matrix Architecture: Separate display (bounded) from statistics (unbounded)
• Smart Fallback: Automatic page clamping prevents empty displays
Impact & Workarounds:
• Visual Limitation: Only 500 trades visible per page
• Statistical Accuracy: Complete dataset used for all calculations
• Navigation: Use page input to browse through entire trade history
• Performance: Smooth operation even with thousands of trades
9. Statistical Accuracy Guarantees
Data Integrity:
• Complete Dataset: Statistics matrix stores ALL trades without limit
• Proper Aggregation: Separate tracking of wins, losses, and break-even trades
• Mathematical Precision: Pine Script v6's enhanced floating-point calculations
• Dual-Matrix System: Display limitations don't affect statistical accuracy
Calculation Validation:
// Verified formulas match standard trading mathematics
avg_win = pos_sum / pos_count // Standard average calculation
win_rate = pos_count / total_obs // Standard probability calculation
ev_value = (avg_win * win_rate) - (avg_loss * loss_rate) // Standard EV formula
Accuracy Features:
• Mathematical Correctness: Formulas follow established trading statistics
• Data Preservation: Complete dataset maintained for all calculations
• Precision Handling: Proper rounding and boundary condition management
• Real-Time Updates: Statistics recalculated on every new trade
10. Advanced Technical Features
Real-Time Animation Engine:
// Shimmer effects with sine wave modulation
offset = math.sin(shimmer_t + phase) * amp
// Dynamic transparency with organic flicker
new_transp = math.min(flicker_limit, math.max(-flicker_limit, cur_transp + dir * flicker_step))
• Sine Wave Shimmer: Dynamic glowing effects on bubbles
• Organic Flicker: Random transparency variations for natural feel
• Extreme Value Highlighting: Special visual treatment for outliers
• Smooth Animations: Tick-based updates for fluid motion
Magnitude-Based Priority Rendering:
// Sort trades by magnitude for optimal visual hierarchy
sort_indices_by_magnitude(values_mat)
• Largest First: Most important trades always visible
• Intelligent Sorting: Custom bubble sort algorithm for trade prioritization
• Performance Optimized: Efficient sorting for real-time updates
• Visual Hierarchy: Ensures critical trades never get hidden
Professional Tooltip System:
• Quantitative Data: Pure numerical information without interpretative language
• Contextual Ranking: Shows trade position within page dataset
• Percentile Analysis: Performance ranking as percentage
• Magnitude Scaling: Relative size compared to page maximum
• Professional Format: Clean, data-focused presentation
11. Quick Start Guide
Step 1: Add Indicator
• Search for "PnL Bubble | Fractalyst" in TradingView indicators
• Add to your chart (works on any timeframe)
Step 2: Configure Data Source
• Demo Mode: Leave source as "close" to see synthetic trading data
• Strategy Mode: Select your strategy's PnL% output as data source
Step 3: Customize Visualization
• Colors: Set positive (cyan), negative (red), and neutral colors
• Page Navigation: Use "Trade Page" input to browse trade history
• Visual Effects: Built-in shimmer and animation effects are enabled by default
Step 4: Analyze Performance
• Study bubble patterns for win/loss distribution
• Review statistical metrics: EV, R-Ratio, Win Rate
• Use tooltips for detailed trade analysis
• Navigate pages to explore full trade history
Step 5: Optimize Strategy
• Identify outlier trades (largest bubbles)
• Analyze risk-reward profile through R-Ratio
• Monitor Expected Value for system profitability
• Use contribution analysis to understand win/loss impact
12. Why Choose PnL Bubble Indicator?
Unique Advantages:
• Advanced Pagination: Handle unlimited trades with smart fallback system
• Dual-Matrix Architecture: Perfect balance of performance and accuracy
• Professional Statistics: Institution-grade metrics with complete data integrity
• Real-Time Animation: Dynamic visual effects for engaging analysis
• Quantitative Tooltips: Pure numerical data without subjective interpretations
• Priority Rendering: Intelligent magnitude-based display ensures critical trades are always visible
Technical Excellence:
• Built with Pine Script v6 for maximum performance and modern features
• Optimized algorithms for smooth operation with large datasets
• Complete statistical accuracy despite display optimizations
• Professional-grade calculations matching institutional trading analytics
Practical Benefits:
• Instantly identify system profitability through visual patterns
• Spot outlier trades and risk management issues
• Understand true risk-reward profile of your strategies
• Make data-driven decisions for strategy optimization
• Professional presentation suitable for performance reporting
Disclaimer & Risk Considerations:
Important: Historical performance metrics, including positive Expected Value (EV), do not guarantee future trading success. Statistical measures are derived from finite sample data and subject to inherent limitations:
• Sample Bias: Historical data may not represent future market conditions or regime changes
• Ergodicity Assumption: Markets are non-stationary; past statistical relationships may break down
• Survivorship Bias: Strategies showing positive historical EV may fail during different market cycles
• Parameter Instability: Optimal parameters identified in backtesting often degrade in forward testing
• Transaction Cost Evolution: Slippage, spreads, and commission structures change over time
• Behavioral Factors: Live trading introduces psychological elements absent in backtesting
• Black Swan Events: Extreme market events can invalidate statistical assumptions instantaneously

Ultimate T3 Fibonacci for BTC Scalping. Look at backtest report!Hey Everyone!
I created another script to add to my growing library of strategies and indicators that I use for automated crypto trading! This strategy is for BITCOIN on the 30 minute chart since I designed it to be a scalping strategy. I calculated for trading fees, and use a small amount of capital in the backtest report. But feel free to modify the capital and how much per order to see how it changes the results:)
It is called the "Ultimate T3 Fibonacci Indicator by NHBprod" that computes and displays two T3-based moving averages derived from price data. The t3_function calculates the Tilson T3 indicator by applying a series of exponential moving averages to a combined price metric and then blending these results with specific coefficients derived from an input factor.
The script accepts several user inputs that toggle the use of the T3 filter, select the buy signal method, and set parameters like lengths and volume factors for two variations of the T3 calculation. Two T3 lines, T3 and T32, are computed with different parameters, and their colors change dynamically (green/red for T3 and blue/purple for T32) based on whether the lines are trending upward or downward. Depending on the selected signal method, the script generates buy signals either when T32 crosses over T3 or when the closing price is above T3, and similarly, sell signals are generated on the respective conditions for crossing under or closing below. Finally, the indicator plots the T3 lines on the chart, adds visual buy/sell markers, and sets alert conditions to notify users when the respective trading signals occur.
The user has the ability to tune the parameters using TP/SL, date timerames for analyses, and the actual parameters of the T3 function including the buy/sell signal! Lastly, the user has the option of trading this long, short, or both!
Let me know your thoughts and check out the backtest report!

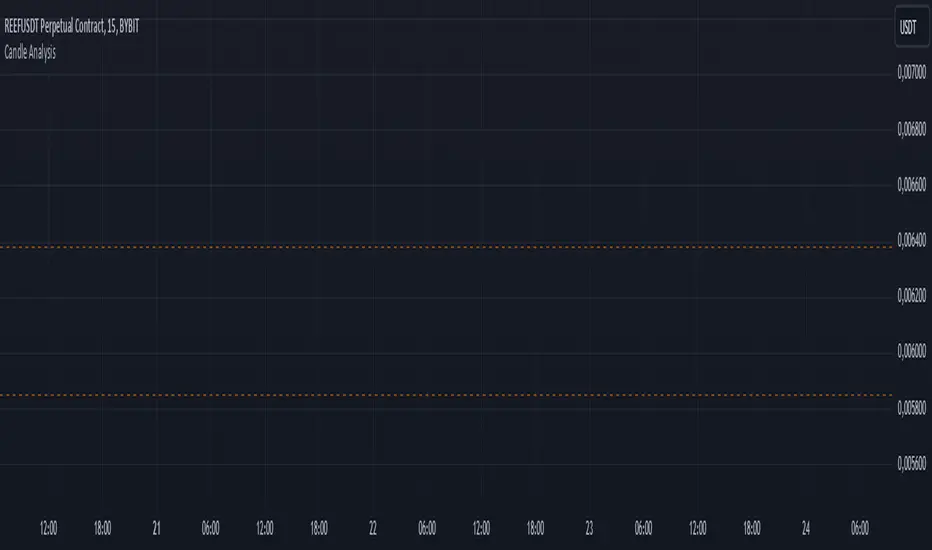
Candle AnalysisImportant Setup Note
Optimize Your Viewing Experience
To ensure the Candle Analysis Indicator displays correctly and to prevent any default chart colors from interfering with the indicator's visuals, please adjust your chart settings:
Right-Click on the Chart and select "Settings".
Navigate to the "Symbol" tab.
Set transparent default candle colors:
- Body
-Borders
- Wick
By customizing these settings, you'll experience the full visual benefits of the indicator without any overlapping colors or distractions.
Elevate your trading strategy with the Candle Analysis Indicator—a powerful tool designed to give you a focused view of the market exactly when you need it. Whether you're honing in on specific historical periods or testing new strategies, this indicator provides the clarity and control you've been looking for.
Key Features:
🔹 Custom Date Range Selection
Tailored Analysis: Choose your own start and end dates to focus on the market periods that matter most to you.
Historical Insights: Dive deep into past market movements to uncover hidden trends and patterns.
🔹 Dynamic Backtesting Simulation
Interactive Playback: Enable backtesting to simulate how the market unfolded over time.
Strategy Testing: Watch candles appear at your chosen interval, allowing you to test and refine your trading strategies in real-time scenarios.
🔹 Enhanced Visual Clarity
Focused Visualization: Only candles within your specified date range are highlighted, eliminating distractions from irrelevant data.
Distinct Candle Styling: Bullish and bearish candles are displayed with unique colors and transparency, making it easy to spot market sentiment at a glance.
🔹 User-Friendly Interface
Easy Setup: Simple input options mean you can configure the indicator quickly without any technical hassle.
Versatile Application: Compatible with various timeframes—whether you're trading intraday, daily, or weekly.
Market Structure Based Stop LossMarket Structure Based Dynamic Stop Loss
Introduction
The Market Structure Based Stop Loss indicator is a strategic tool for traders designed to be useful in both rigorous backtesting and live testing, by providing an objective, “guess-free” stop loss level. This indicator dynamically plots suggested stop loss levels based on market structure, and the concepts of “interim lows/highs.”
It provides a robust framework for managing risk in both long and short positions. By leveraging historical price movements and real time market dynamics, this indicator helps traders identify quantitatively consistent risk levels while optimizing trade returns.
Legend
This indicator utilizes various inputs to customize its functionality, including "Stop Loss Sensitivity" and "Wick Depth," which dictate how closely the stop loss levels hug the price's highs and lows. The stop loss levels are plotted as lines on the trading chart, providing clear visual cues for position management. As seen in the chart below, this indicator dynamically plots stop loss levels for both long and short positions at every point in time.
A “Stop Loss Table” is also included, in order to enhance precision trading and increase backtesting accuracy. It is customizable in both size and positioning.
Case Study
Methodology
The methodology behind this indicator focuses on the precision placement of stop losses using market structure as a guide. It calculates stop losses by identifying the "lowest close" and the corresponding "lowest low" for long setups, and inversely for short setups. By adjusting the sensitivity settings, traders can tweak the indicator's responsiveness to price changes, ensuring that the stop losses are set with a balance between tight risk control and enough room to avoid premature exits due to market noise. The indicator's ability to adapt to different trading styles and time frames makes it an essential tool for traders aiming for efficiency and effectiveness in their risk management strategies.
An important point to make is the fact that the stop loss levels are always placed within the wicks. This is important to avoid what can be described as a “floating stop loss”. A stop loss placed outside of a wick is susceptible to an outsized degree of slippage. This is because traders always cluster their stop losses at high/low wicks, and a stop loss placed outside of this level will inevitably be caught in a low liquidity cascade or “wash-out.” When price approaches a cluster of stop losses, it is highly probable that you will be stopped out anyway, so it is prudent to attempt to be the trader who gets stopped out first in order to avoid high slippage, and losses above what you originally intended.
// For long positions: stop-loss is slightly inside the lowest wick
float dynamic_SL_Long = lowestClose - (lowestClose - lowestLow) * (1 - WickDepth)
// For short positions: stop-loss is slightly inside the highest wick
float dynamic_SL_Short = highestClose + (highestHigh - highestClose) * (1 - WickDepth)
The percentage depth of the wick in which the stop loss is placed is customisable with the “Wick Depth” variable, in order to customize stop loss strategies around the liquidity of the market a trader is executing their orders in.

Hulk Grid Algorithm V2 - The Quant ScienceIt's the latest proprietary grid algorithm developed by our team. This software represents a clearer and more comprehensive modernization of the deprecated Hulk Grid Algorithm. In this new release, we have optimized the source code architecture and investment logic, which we will describe in detail below.
Overview
Hulk Grid Algorithm V2 is designed to optimize returns in sideways market conditions. In this scenario, the algorithm divides purchases with long orders at each level of the grid. Unlike a typical grid algorithm, this version applies an anti-martingale model to mitigate volatility and optimize the average entry price. Starting from the lower level, the purchase quantity is increased at each new subsequent level until reaching the upper level. The initial quantity of the first order is fixed at 0.50% of the initial capital. With each new order, the initial quantity is multiplied by a value equal to the current grid level (where 1 is the lower level and 10 is the upper level).
Example: Let's say we have an initial capital of $10,000. The initial capital for the first order would be $50 * 1 = $50, for the second order $50 * 2 = $100, for the third order $50 * 3 = $150, and so on until reaching the upper level.
All previously opened orders are closed using a percentage-based stop-loss and take-profit, calculated based on the extremes of the grid.
Set Up
As mentioned earlier, the user's goal is to analyze this strategy in markets with a lack of trend, also known as sideways markets. After identifying a price range within which the asset tends to move, the user can choose to create the grid by placing the starting price at the center of the range. This way, they can consider trading the asset, if the backtesting generates a return greater than the Buy & Hold return.
Grid Configuration
To create the grid, it's sufficient to choose the starting price during the launch phase. This level will be the center of the grid from which the upper and lower levels will be calculated. The grid levels are computed using an arithmetic method, adding and subtracting a configurable fixed amount from the user interface (Grid Step $).
Example: Let's imagine choosing 1000 as the starting price and 50 as the Grid Step ($). The upper levels will be 1000, 1050, 1100, 1150, 1200. The lower levels will be 950, 900, 850, 800, and 750.
Markets
This software can be used in all markets: stocks, indices, commodities, cryptocurrencies, ETFs, Forex, etc.
Application
With this backtesting software, is possible to analyze the strategy and search for markets where it can generate better performance than Buy & Hold returns. There are no alerts or automatic investment mechanisms, and currently, the strategy can only be executed manually.
Design
Is possible to modify the grid style and customize colors by accessing the Properties section of the user interface.

SUPPORT RESISTANCE STRATEGY [5MIN TF]A SUPPORT RESISTANCE BREAKOUT STRATEGY for 5 minute Time-Frame , that has the time condition for Indian Markets
The Timing can be changed to fit other markets, scroll down to "TIME CONDITION" to know more.
The commission is also included in the strategy .
The basic idea is when ,
1) Price crosses above Resistance Level ,indicated by Red Line, is a Long condition.
2) Price crosses below Support Level ,indicated by Green Line , is a Short condition.
3) Candle high crosses above ema1, is a part of the Long condition .
4) Candle low crosses below ema1, is a part of the Short condition .
5) Volume Threshold is an added confirmation for long/short positions.
6) Maximum Risk per trade for the intraday trade can be changed .
7) Default qty size is set to 50 contracts , which can be changed under settings → properties → order size.
8) ATR is used for trailing after entry, as mentioned in the inputs below.
// ═════════════════════════//
// ————————> INPUTS <————————— //
// ═════════════════════════//
→ L_Bars ———————————> Length of Resistance / Support Levels.
→ R_Bars ———————————> Length of Resistance / Support Levels.
→ Volume Break ———————> Volume Breakout from range to confirm Long/Short position.
→ Price Cross Ema —————> Added condition as explained above (3) and (4).
→ ATR LONG —————————> ATR stoploss trail for Long positions.
→ ATR SHORT ————————> ATR stoploss trail for Short positions.
→ RISK ————————————> Maximum Risk per trade intraday.
The strategy was back-tested on TCS ,the input values and the results are mentioned under "BACKTEST RESULTS" below.
// ═════════════════════════ //
// ————————> PROPERTIES<——————— //
// ═════════════════════════ //
Default_qty_size ————> 50 contracts , which can be changed under
Settings
↓
Properties
↓
Order size
// ═══════════════════════════════//
// ————————> TIME CONDITION <————————— //
// ═══════════════════════════════//
The time can be changed in the script , Add it → click on ' { } ' → Pine editor→ making it a copy [right top corner} → Edit the line 27.
The Indian Markets open at 9:15am and closes at 3:30pm.
The 'time_cond' specifies the time at which Entries should happen .
"Close All" function closes all the trades at 3pm , at the open of the next candle.
To change the time to close all trades , Go to Pine Editor → Edit the line 92 .
All open trades get closed at 3pm , because some brokers don't allow you to place fresh intraday orders after 3pm .
// ═══════════════════════════════════════════════ //
// ————————> BACKTEST RESULTS ( 100 CLOSED TRADES )<————————— //
// ═══════════════════════════════════════════════ //
INPUTS can be changed for better Back-Test results.
The strategy applied to NSE:TCS ( 5 min Time-Frame and contract size 50) gives us 60% profitability , as shown below
It was tested for a period a 6 months with a Profit Factor of 1.8 ,net Profit of 30,000 Rs profit .
Sharpe Ratio : 0.49
Sortino Ratio : 1.4
The graph has a Linear Curve with Consistent Profits.
The INPUTS are as follows,
1) L_Bars —————————> 4
2) R_Bars —————————> 4
3) Volume Break ————> 5
4) Price Cross Ema ——> 100
5) ATR LONG ——————> 2.4
6) ATR SHORT —————> 2.6
7) RISK —————————> 2000
8) Default qty size ——> 50
NSE:TCS
Save it to favorites.
Apply it to your charts Now !!
Thank You ☺ NSE:TCS

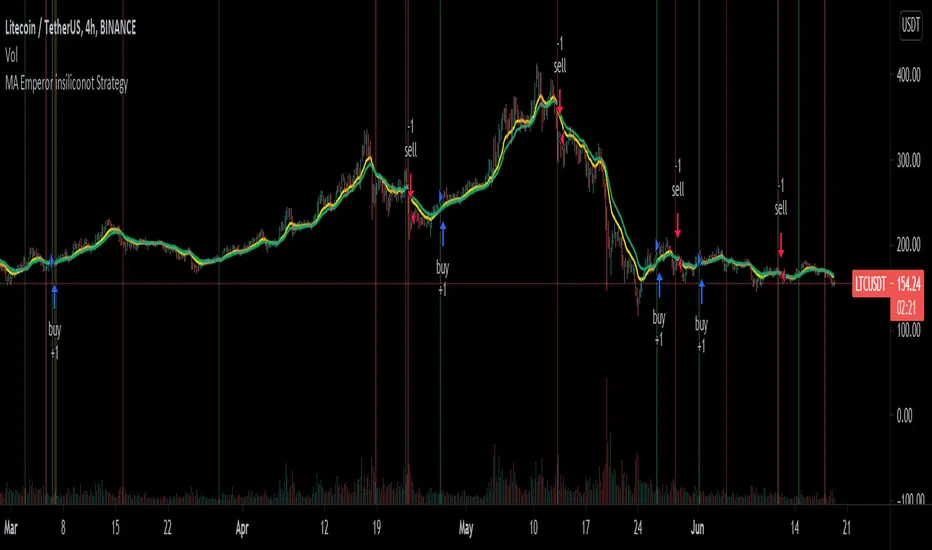
MA Emperor insiliconot StrategyConverted EmperorBTC's EMA crossover indicator for easy backtesting and added ability to:
Specify time period for backtesting
Specify order quantity
Toggle original indicators (default off)
Quoting EmperorBTC:
Entry is to be made when the
1. Cross over gives a P(Positive Sign) and the candle completely closes above the cross-over
2. When the Heikin Ashi turns green and the next green HA candle goes above the previous green HA candle.
3. The price should be at-least above the 0.236 Level from the Swing high.
Kindly note that the strategy only attempts to do check number 1, where it ensures the entry opens above the cross-over.
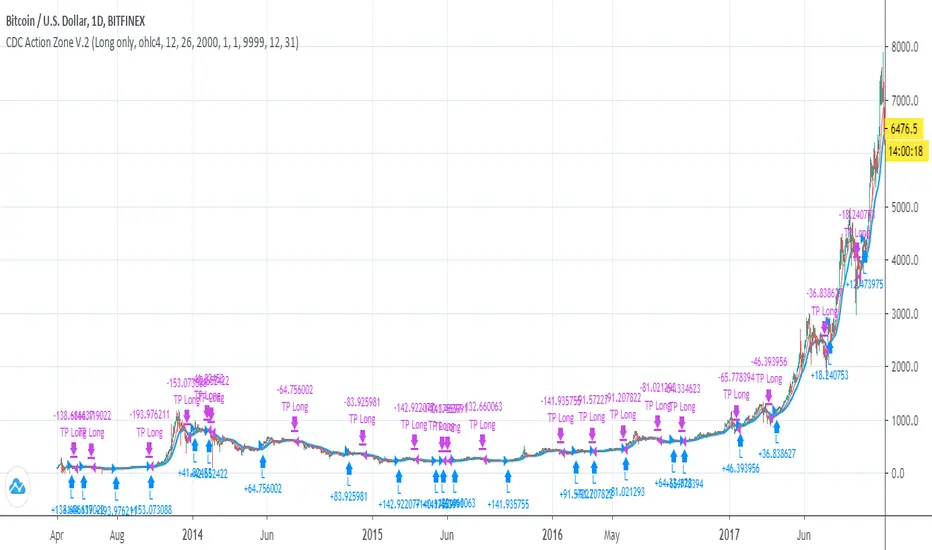
CDC Action Zone V.2 Strategy BacktestPublished for backtest purpose
All credit to : CDC Action Zone V.2 by piriya33
จัดทำขึ้นเพื่อการดูผล Backtest เขียวซื้อแดงขาย
ตัวสคริปท์มีการเพิ่ม
- Strategy Long/Short/Both // ปรับได้ใน Setting
- Back test range // ปรับได้ใน Setting
Price Drop CounterThe Price Drop Counter is a very basic statistical indicator.
See it as an analytical tool that tracks how many times an asset's price has dropped by a specified percentage from its recent peak within a defined date range.
The indicator monitors the highest price reached and counts each occurrence when the price falls by your chosen threshold, then resets its peak tracking point after each drop is registered.
Uses
Volatility Assessment: Measure how frequently significant price corrections occur during specific periods
Market Behavior Analysis: Compare drop frequency across different timeframes or market conditions
Risk Evaluation: Identify assets or periods with higher downside volatility
Historical Pattern Recognition: Study how often major pullbacks happened during bull or bear markets
Backtesting Support: Analyze how your strategy would perform based on the frequency of drawdowns
How to use it
Add the indicator to your TradingView chart
Configure the Percent Drop (%) to define your threshold (default: 10%). The indicator will count each time price falls by this percentage from the most recent high
IMPORTANT Set your Start Date and End Date to analyze a specific period of interest
The blue step-line plot shows the cumulative count of drops within your date range
Adjust the percentage threshold based on your analysis needs - use smaller values (2-5%) for more frequent signals or larger values (15-20%) for major corrections only
The counter resets its high-water mark after each qualifying drop, allowing it to track multiple sequential drops within the same period.

Sunmool's NY Lunch Model BacktestingICT NY Lunch Model Backtesting (12:00–13:00 NY) 🗽🍔
This research indicator tests an ICT narrative using the New York lunch window (12:00–13:00 America/New_York). It records that hour’s high/low and measures, during the post-lunch session (default 13:00–16:00), how often:
⬆️ If the afternoon trends up, the Lunch Low gets swept first.
⬇️ If the afternoon trends down, the Lunch High gets swept first.
It reports these as conditional probabilities, not trade signals. 📈
👀 What it shows
🟦 Lunch Range box (toggle): high/low from 12:00–13:00 NY
🔻🔺 Sweep signals (bar-anchored)
Low sweep: triangle below bar + optional “L”
High sweep: triangle above bar + optional “H”
🧱 Optional small box wrapping the swept candle
📊 Stats table (top-right)
P(L-swept | Up) — % of Up-days where Lunch Low was swept
P(H-swept | Down) — % of Down-days where Lunch High was swept
🔁 Contradictions + sample sizes (Up-days / Down-days)
🎯 Direction logic (Up/Down)
Anchor: 13:00 open (pmOpen) ⏰
Threshold: ATR × multiple or % from 13:00
Close ≥ pmOpen + threshold → Up-day
Close ≤ pmOpen − threshold → Down-day
Tiny moves under the threshold are ignored to reduce noise 🧹
⚙️ Inputs
🌐 Timezone: America/New_York (DST handled)
🍽️ Lunch window: 1200–1300
🕓 Post-lunch window: default 1300–1600 (try 17:00/20:00 for sensitivity)
📐 Trend threshold: ATR / Percent (with length/multiple or % level)
📅 Weekdays-only toggle (FX/Equities style)
👁️ Display toggles: Lunch box / sweep arrows / sweep text / sweep candle box / stats table
🔔 TF hint when chart TF > 15m
🧭 How to use
Use 5–15m charts for accurate lunch range capture.
Scroll ~1 year for meaningful samples.
Run sensitivity checks: vary ATR/% thresholds and the post-lunch end time.
For crypto, compare with vs without weekends. 🚀
🧠 Reading the results
High P(L-swept | Up) with a solid Up-day count ⇒ on up afternoons, lunch low is often swept.
High P(H-swept | Down) ⇒ on down afternoons, lunch high is often swept.
Lower Contradictions = cleaner tendency.
Remember: this is a probabilistic tendency, not a rule. 🎲
📝 Notes & limits
All markers (arrows, text, sweep boxes) are bar-anchored; the lunch range box is a research overlay you can toggle.
Real-time vs historical bar building can differ—interpret on bar close. 🔒

Strategy Chameleon [theUltimator5]Have you ever looked at an indicator and wondered to yourself "Is this indicator actually profitable?" Well now you can test it out for yourself with the Strategy Chameleon!
Strategy Chameleon is a versatile, signal-agnostic trading strategy designed to adapt to any external indicator or trading system. Like a chameleon changes colors to match its environment, this strategy adapts to match any buy/sell signals you provide, making it the ultimate backtesting and automation tool for traders who want to test multiple strategies without rewriting code.
🎯 Key Features
1) Connects ANY external indicator's buy/sell signals
Works with RSI, MACD, moving averages, custom indicators, or any Pine Script output
Simply connect your indicator's signal output to the strategy inputs
2) Multiple Stop Loss Types:
Percentage-based stops
ATR (Average True Range) dynamic stops
Fixed point stops
3) Advanced Trailing Stop System:
Percentage trailing
ATR-based trailing
Fixed point trailing
4) Flexible Take Profit Options:
Risk:Reward ratio targeting
Percentage-based profits
ATR-based profits
Fixed point profits
5) Trading Direction Control
Long Only - Bull market strategies
Short Only - Bear market strategies
Both - Full market strategies
6) Time-Based Filtering
Optional trading session restrictions
Customize active trading hours
Perfect for day trading strategies
📈 How It Works
Signal Detection: The strategy monitors your connected buy/sell signals
Entry Logic: Executes trades when signals trigger during valid time periods
Risk Management: Automatically applies your chosen stop loss and take profit levels
Trailing System: Dynamically adjusts stops to lock in profits
Performance Tracking: Real-time statistics table showing win rate and performance
⚙️ Setup Instructions
0) Add indicator you want to test, then add the Strategy to your chart
Connect Your Signals:
imgur.com
Go to strategy settings → Signal Sources
1) Set "Buy Signal Source" to your indicator's buy output
2) Set "Sell Signal Source" to your indicator's sell output
3) Choose table position - This simply changes the table location on the screen
4) Set trading direction preference - Buy only? Sell only? Both directions?
imgur.com
5) Set your preferred stop loss type and level
You can set the stop loss to be either percentage based or ATR and fully configurable.
6) Enable trailing stops if desired
imgur.com
7) Configure take profit settings
8) Toggle time filter to only consider specific time windows or trading sessions.
🚀 Use Cases
Test various indicators to determine feasibility and/or profitability.
Compare different signal sources quickly
Validate trading ideas with consistent risk management
Portfolio Management
Apply uniform risk management across different strategies
Standardize stop loss and take profit rules
Monitor performance consistently
Automation Ready
Built-in alert conditions for automated trading
Compatible with trading bots and webhooks
Easy integration with external systems
⚠️ Important Notes
This strategy requires external signals to function
Default settings use 10% of equity per trade
Pyramiding is disabled (one position at a time)
Strategy calculates on bar close, not every tick
🔗 Integration Examples
Works perfectly with:
RSI strategies (connect RSI > 70 for sells, RSI < 30 for buys)
Moving average crossovers
MACD signal line crosses
Bollinger Band strategies
Custom oscillators and indicators
Multi-timeframe strategies
📋 Default Settings
Position Size: 10% of equity
Stop Loss: 2% percentage-based
Trailing Stop: 1.5% percentage-based (enabled)
Take Profit: Disabled (optional)
Trade Direction: Both long and short
Time Filter: Disabled

RSI-Adaptive T3 + Squeeze Momentum Strategy✅ Strategy Guide: RSI-Adaptive T3 + Squeeze Momentum Strategy
📌 Overview
The RSI-Adaptive T3 + Squeeze Momentum Strategy is a dynamic trend-following strategy based on an RSI-responsive T3 moving average and Squeeze Momentum detection .
It adapts in real-time to market volatility to enhance entry precision and optimize risk.
⚠️ This strategy is provided for educational and research purposes only.
Past performance does not guarantee future results.
🎯 Strategy Objectives
The main objective of this strategy is to catch the early phase of a trend and generate consistent entry signals.
Designed to be intuitive and accessible for traders from beginner to advanced levels.
✨ Key Features
RSI-Responsive T3: T3 length dynamically adjusts according to RSI values for adaptive trend detection
Squeeze Momentum: Combines Bollinger Bands and Keltner Channels to identify trend buildup phases
Visual Triggers: Entry signals are generated from T3 crossovers and momentum strength after squeeze release
📊 Trading Rules
Long Entry:
When T3 crosses upward, momentum is positive, and the squeeze has just been released.
Short Entry:
When T3 crosses downward, momentum is negative, and the squeeze has just been released.
Exit (Reversal):
When the opposite condition to the entry is triggered, the position is reversed.
💰 Risk Management Parameters
Pair & Timeframe: BTC/USD (30-minute chart)
Capital (simulated): $30,00
Order size: `$100` per trade (realistic, low-risk sizing)
Commission: 0.02%
Slippage: 2 pips
Risk per Trade: 5%
Number of Trades (backtest period): 181
📊 Performance Overview
Symbol: BTC/USD
Timeframe: 30-minute chart
Date Range: January 1, 2024 – July 3, 2025
Win Rate: 47.8%
Profit Factor: 2.01
Net Profit: 173.16 (units not specified)
Max Drawdown: 5.77% or 24.91 (0.79%)
⚙️ Indicator Parameters
Indicator Name: RSI-Adaptive T3 + Squeeze Momentum
RSI Length: 14
T3 Min Length: 5
T3 Max Length: 50
T3 Volume Factor: 0.7
BB Length: 27 (Multiplier: 2.0)
KC Length: 20 (Multiplier: 1.5, TrueRange enabled)
🖼 Visual Support
T3 slope direction, squeeze status, and momentum bars are visually plotted on the chart,
providing high clarity for quick trend analysis and execution.
🔧 Strategy Improvements & Uniqueness
Inspired by the RSI Adaptive T3 by ChartPrime and Squeeze Momentum Indicator by LazyBear ,
this strategy fuses both into a hybrid trend-reversal and momentum breakout detection system .
Compared to traditional trend-following methods, it excels at capturing early trend signals with greater sensitivity .
✅ Summary
The RSI-Adaptive T3 + Squeeze Momentum Strategy combines momentum detection with volatility-responsive risk management.
With a strong balance between visual clarity and practicality, it serves as a powerful tool for traders seeking high repeatability.
⚠️ This strategy is based on historical data and does not guarantee future profits.
Always use appropriate risk management when applying it.

SMA Backtest Optimizer [Mr_Rakun]The SMA Backtest Optimizer is a powerful Pine Script tool designed to systematically analyze and compare various Simple Moving Average (SMA) periods to identify the most profitable configuration for trading strategies. This indicator tests multiple SMA periods (from 10 to 100) using a crossover strategy where buys occur when price crosses above the SMA and sells when price crosses below it.
Key Features:
Tests 10 different SMA periods to determine optimal settings
Calculates profit/loss based on a defined starting capital
Tracks total profit and number of trades for each period
Visually highlights the best performing SMA on your chart
Displays comprehensive results in an easy-to-read table
Labels the chart with key performance metrics
This code serves as a core framework that traders can customize for their specific needs. You can easily modify the strategy parameters, test different technical indicators, adjust capital settings, or implement more complex entry/exit rules. The optimization methodology can be applied to virtually any trading approach you wish to evaluate.
Feel free to adapt this framework to test your own trading ideas and discover which parameters work best in different market conditions.

Multi Indicator Buy/Sell with BacktestThis backtest indicator allows you to configure up to 4 different indicators and set buy/sell levels for each one, then back test how well your strategy would have worked over a given time period.
EMA Crossover Backtest [BarScripts]This indicator lets you backtest an EMA crossover strategy with built-in risk management and trade tracking. It simulates long and short trades based on EMA crossovers, allowing you to fine-tune entry conditions, stop-loss placement, and reward/risk settings.
🔹 How It Works:
Long Entry: Fast EMA crosses above Slow EMA, and price closes above Fast EMA.
Short Entry: Fast EMA crosses below Slow EMA, and price closes below Fast EMA.
Stop Loss: Set based on previous bars or a fixed amount.
Take Profit: Adjustable reward/risk ratio.
Higher Timeframe Confluence: Confirms trades based on a larger timeframe.
Trade Hours Filter: Limits trades to specific time windows.
🔹 Key Features:
✅ Shows Entry & Exit Points with visual trade lines.
✅ Customizable EMA Lengths to fit any strategy.
✅ P&L Tracking & Statistics to measure performance.
✅ Position Sizing Options: Fixed position, fixed risk, or percentage of balance.
✅ Commissions Tracking (based on total trades, not contracts).
Use this tool to fine-tune your EMA crossover strategy and see how it performs over time! 🚀
💬 Let me know your feedback—suggest improvements, report issues, or request new features!

Cumulative Volume Delta Strategy | Flux Charts💎 GENERAL OVERVIEW
Introducing the Cumulative Volume Delta Strategy (CVDS) Indicator, an advanced tool designed to enhance trading strategies by identifying potential trend reversals through volume dynamics. This script features integrated order block detection, Fair Value Gaps (FVGs), and a dynamic take-profit (TP) and stop-loss (SL) system. For an in-depth understanding of the strategy, refer to the "HOW DOES IT WORK?" section below.
Features of the new Cumulative Volume Delta Strategy (CVDS) Indicator :
Cumulative Volume Delta-based Strategy
Order Block and Fair Value Gap (FVG) Entry Methods
Dynamic TP/SL System
Customizable Risk Management Settings
Alerts for Buy, Sell, TP, and SL Signals
📌 HOW DOES IT WORK ?
The CVDS indicator operates by tracking the net volume difference between buyers and sellers to identify divergences that could indicate potential trend reversals. A cumulative volume delta (CVD) calculation is employed to measure the intensity of these divergences in relation to price movements. The net volume sum is reset every trading day (can be changed from the settings using the anchor period option), and divergences are detected when the cumulative volume crosses the 0-line over or under.
Once a significant divergence is detected, the indicator identifies breakout points, confirmed by either Fair Value Gaps (FVGs) or Order Blocks (OBs). Depending on your chosen entry mode, the indicator will trigger a buy or sell entry when the confirmation signal aligns with the breakout direction. Alerts for Buy, Sell, Take-Profit, and Stop-Loss are available.
Note that the indicator cannot run on 1-minute and 1-second charts, as it needs to get data from a lower timeframe. 1-minutes & 1-second timeframes are the minimum timeframes in their ranges respectively.
🚩 UNIQUENESS
What sets this indicator apart is the combination of volume divergence analysis with advanced price action tools like Fair Value Gaps (FVGs) and Order Blocks (OBs). The ability to choose between these methods, along with a dynamic TP/SL system that adapts based on volatility, provides flexibility for traders in any market condition. The backtesting dashboard provides metrics about the performance of the indicator. You can use it to tune the settings for best use in the current ticker. The CVD-based strategy ensures that trades are initiated only when meaningful divergences between volume and price occur, filtering out noise and increasing the likelihood of profitable trades.
⚙️ SETTINGS
1. General Configuration
Anchor Period: Time anchor period used in CVD calculation. This is essentially the period that the volume delta sum will be reset. Lower timeframes may result in more entries at the cost of less reliable results.
Entry Mode: Choose between FVGs or OBs to trigger your entries based on the confirmation signals.
Retracement Requirement: Enable to confirm the entry after a retracement toward the FVG or OB.
2. Fair Value Gaps
FVG Sensitivity: Modify the sensitivity of FVG detection, allowing for more or fewer gaps to be considered valid.
3. Order Blocks (OB)
Swing Length: Define the swing length to identify OB formations. Shorter lengths find smaller OBs, while longer lengths detect larger structures.
4. TP / SL
TP / SL Method:
a) Dynamic: The TP / SL zones will be auto-determined by the algorithm based on the Average True Range (ATR) of the current ticker.
b) Fixed : You can adjust the exact TP / SL ratios from the settings below.
Dynamic Risk: The risk you're willing to take if "Dynamic" TP / SL Method is selected. Higher risk usually means a better winrate at the cost of losing more if the strategy fails. This setting is has a crucial effect on the performance of the indicator, as different tickers may have different volatility so the indicator may have increased performance when this setting is correctly adjusted.

Alligator + MA Trend Catcher [TradeDots]The "Alligator + MA Trend Catcher" is a trading strategy that integrates the William Alligator indicator with a Moving Average (MA) to establish robust entry and exit conditions, optimized for capturing trends.
HOW IT WORKS
This strategy combines the traditional William Alligator set up with an additional Moving Average indicator for enhanced trend confirmation, creating a user-friendly backtesting tool for traders who prefer the Alligator method.
The original Alligator strategy can frequently present fluctuations, even in well-established trends, leading to potentially premature exits. To mitigate this, we incorporate a Moving Average as a secondary confirmation measure to ensure the market trend has indeed shifted.
Here’s the operational flow for long orders:
Entry Signal: When the price rises above the Moving Average, it confirms a bullish market state. Enter if Alligator spread in an upward direction. The trade remains active even if the Alligator indicator suggests a trend reversal.
Exit Signal: The position is closed when the price falls below the Moving Average, and the Alligator spreads in the downward direction. This setup helps traders to maintain positions through the entirety of the trend for maximum gain.
APPLICATION
This strategy is tailored for assets with significant, well-defined trends, such as Bitcoin and Ethereum, which are known for their high volatility and substantial price movements.
This strategy offers a low win-rate but high reward configuration, making asset selection critical for long-term profitability. If you choose assets that lack strong price momentum, there's a high chance that this strategy may not be effective.
For traders seeking to maximize gains from large trends without exiting prematurely, this strategy provides an aggressive yet controlled approach to riding out substantial market waves.
DEFAULT SETUP
Commission: 0.01%
Initial Capital: $10,000
Equity per Trade: 80%
RISK DISCLAIMER
Trading entails substantial risk, and most day traders incur losses. All content, tools, scripts, articles, and education provided by TradeDots serve purely informational and educational purposes. Past performances are not definitive predictors of future results.

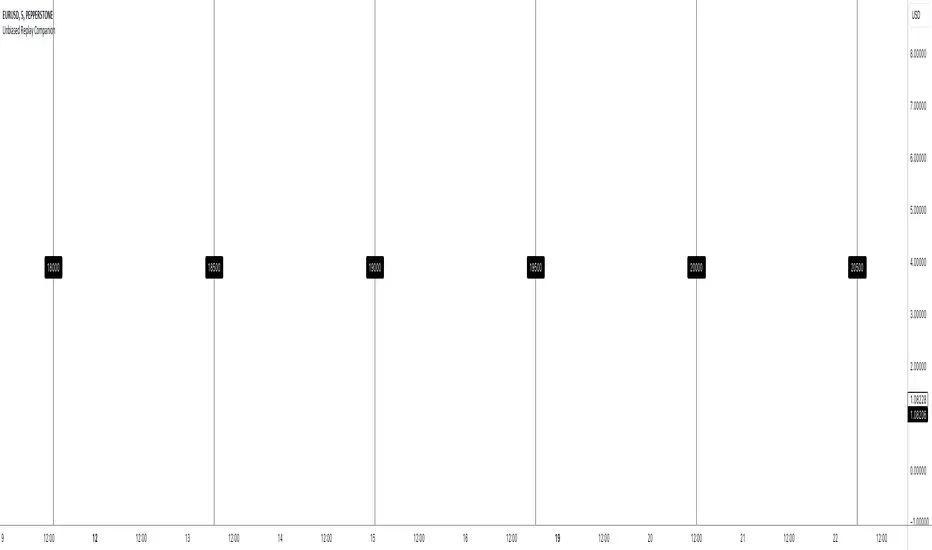
Unbiased Replay CompanionWhen using bar replay mode on TradingView, you have to scroll your way back through clearly visible price history, which always leaves you with unwanted lookahead bias because you unfortunately see all future price movements before they are hidden by the use of the scissors tool.
This indicator provides a simple way to hide all the price action and displays a configurable bar counter instead, allowing you to scroll back to every moment in history without seeing any of the prices' movements. The bar counter hereby serves as a visual aid to guide you back to the very first available bar on the chart.
You can configure the color of the overlay to match your charts' background as well as the style of the bar counter and the distance at which the counter is being displayed.
The indicator crops the vertical price scale by a random amount (only when it is being displayed) to also prevent you from having any unwanted bias based on the current price range.
Whenever you're done scrolling and have used the replay scissors tool to start your session just hide the indicator and bring it up again when you need to scroll. That's all there is to it.
Important: After you apply the indicator to your charts, make sure it is displayed in front of everything else. You can configure this by clicking on the three dots that are displayed on the right side of the indicator name on hover and choose "Visual order > Bring to front" from the popup menu that appears.
Enjoy your unbiased backtesting sessions!