[BACKTEST]Traders Dynamic Index Indicator Alert by JustUncleLBy request, this script is a "strategy" version of my "Traders Dynamic Index Indicator Alert" script, made available for backtesting to help find optimal trade settings for a particular asset.
Cari dalam skrip untuk "backtest"

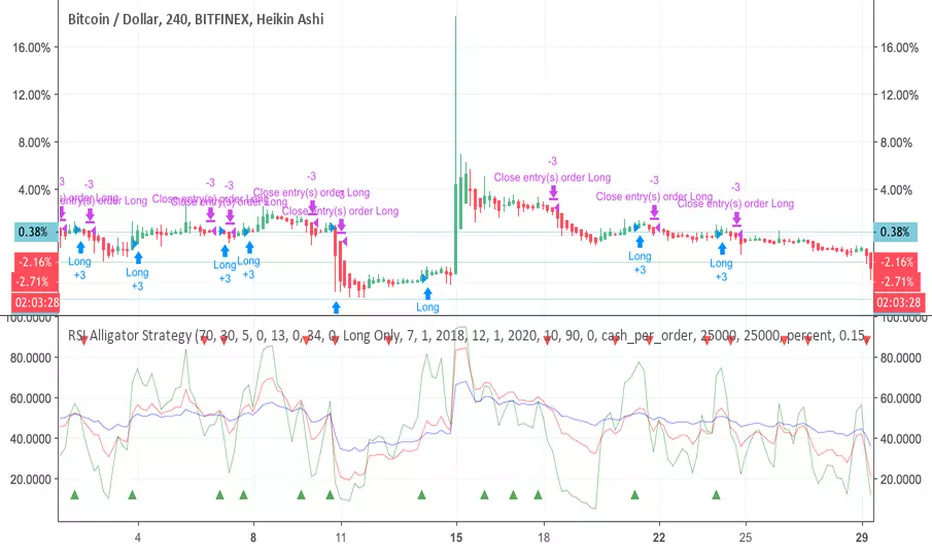
RSI Alligator Strategy [forked from jedireza]Backtester for RSI alligator is Williams Alligator strategy using Relative Strength Index to predict entries
Original script can be found at
Backtest EngineThis is a simple backtest engine for your trading strategies. The idea behind this script is to make testing new strategies as easy as possible. Parameters such as take profit/stop loss and time period are built into the script and are customisable by the user via the settings interface. The only coding is to set the entry and exit conditions. Users need not touch any code beyond line 30.
For this post, I have used a 50/200 SMA crossover to demonstrate the ease of use for this script.
The features of this script include:
Backtest period start
Number of days until backtest period end
Take profit and stop loss % (via settings)
Programmable long and short entry/exit
Anti duplicate system (for entry conditions that are continuously satisfied, the engine will only make 1 trade until the is exit condition is satisfied).
DISCLAIMER: The strategy in this post is only a placeholder. The TP/SL levels are set to showcase the functionality of the engine and are in no means optimal settings.
Hope this helps! Feel free to ask any questions about the engine and happy coding!

Vortex Ocillator - backtestingbacktesting strategy for the vortex oscilator indicator, slightly modified on this version so that the buy and sell signals work with the backtesting and are consistant
original idea i posted by accident
the script with alerts
not intended to be financial advice, strategy is for made for testing
Biffy

Mix1 : Ema Cross + Trend Channel [Gu5] - BacktestBacktest of the indicator "Mix1: Ema Cross + Trend Channel "
Trend indicator, by the crossing of moving averages
SMA200 with a channel as a filter confirms the trend.
The crossing of two moving averages, give alert only in trend.

[Backtest]QQE Cross v6.0 by JustUncleLDescription:
This is the Backtest version of the " QQE Cross v6.0 by JustUncleL" Tool, can be used to optimize settings.
RSI MACD with conditional MA indicator backtestingbacktesting for the RSI MACD with conditional MA indicator:

3Commas Bot DCA Backtester & Signals FREEThis is a DCA Strategy backtester + signals, built to emulate the 3Commas DCA bots. It uses your choice of 4 different buy signals, 2 of which can be adjusted in the settings. Everything is customizable so you can backtest specific settings with different buy signals and find the best performing strategy for your risk tolerance and capital. It can be used to backtest strategies on stocks as well, but just make sure your base order is larger than the share price for the entire backtesting range or it will not calculate properly.
You can use this template to code your own buy signals and then backtest them as a DCA strategy if you know some basic pine script.
The indicator shows all of your backtesting orders on the chart. The red line is your take profit level, the blue line is your average price level, the white line is your first order and the green lines are your average down orders. If you enable a stop loss in the settings your stop loss will be shown as an orange line once all of your average down orders have been hit, it will not be set until price has dipped below your covered trading range.
These levels update when things change during backtesting so you can visualize your strategy and how it would perform as well as see if your percentage deviation is large enough to cover dips. When backtesting trades are taken, the chart will show where they were taken(in backtesting) along with info on those trades such as the number each order is, the size of that order and the percentage deviation that order is from the initial buy.
SENDING SIGNALS TO 3COMMAS
Tradingview cannot sync this backtester to 3Commas and with the way alerts are setup for strategies on Tradingview, the best option for you to give signals to your bot would be to use this backtester to figure out what trigger you want to use and then setup that indicator separately to send alerts to your bot. All of the indicators used for signals in this backtester are available for free and can be configured to match this backtester and send alerts to 3Commas for you. Just make sure you set your alerts to once per bar close and don’t use less than a 15 second timeframe because then you could trigger the Tradingview threshold for alerts and get your alerts shut off.
You can also use this backtester with your own buy triggers if you know a little pine script. Just make copy of the script and code in your own buy signals and see how it backtests.
INFO PANEL FOR ANALYZING YOUR STRATEGY
The right hand side of the screen will show an info panel that shows a lot of different information so you can quickly see your bot settings and how it performed right on the screen.
In the top right corner you will see in purple your bot settings. These include your stoploss % if turned on, take profit %, average down order %, average down order % multiplier, volume multiplier, max number of orders allowed and size of your base order.
The top section of the first column “Current Trade” shows these stats: the open trade’s average price, the open trade’s take profit price, the open trade’s PNL, how far price is from your open tarde’s take profit level in percentage, your open position size and number of open orders.
The bottom section of the first column “Overall Performance” shows these stats: total number of trades taken during backtesting range, the largest amount of trades that were open at one time during backtesting, the max drawdown, the average number of bars per trade, gross profit, net profit, percent profit from your initial capital, current portfolio value and your initial capital.
CUSTOMIZABLE OPTIONS TO FIND THE PERFECT STRATEGY
Stoploss On/Off
This will turn your stoploss on or off. By default it is set to off and will not affect anything unless turned on.
Stoploss Percentage
This is the percentage below your final average down order price that will be set as a stoploss to keep your account from going too far in the red on big dips.
Take Profit Percentage - This is the percentage of profit you want the trade to hit before taking profit on your entire DCA trade. This level updates everytime you average down.
Average Down Percentage - This is the percentage that price has to drop from your initial order to initiate your first safety order. If the Average Down Percent Multiplier is set to 1 then this percentage will be the same for every average down order.
Average Down Percentage Multiplier - This multiplies your Average Down Percentage so each safety order needs a larger percentage deviation than the previous one. This keeps your buys closer together at the beginning and further apart when you hit more orders so you can extend your trading range but still be aggressive when price is going sideways.
Volume Multiplier Per New Order - This multiplies the size of each trade based on your base order. If you set it to a 2x multiplier then each average down order will be 2 times the size of the last one. So for example, a $100 base order with a 2x multiplier would have these values for the first 3 average down orders: 200, 400, 800.
Size Of Base Order - This is the size of your first position entry and will be used as a starting point for the volume multiplier. If your base order is $100 then it will buy $100 worth of whatever crypto you are backtesting this on. If you are looking at stock charts, you need to make sure your base order is higher than the share price across the entire backtesting range or it will not perform correctly.
Max Number Of Orders - This is the maximum number of orders the bot can take, including your base order. Adjust this to suit the amount of capital you are willing to allocate to your bot based on how much money it will require to run according to your bot settings.
TIPS ON HOW TO USE FOR BEST RESULTS
If you don’t have a lot of capital to work with, then use longer timeframes with a reasonable take profit percentage so that you don’t need a lot of average down orders. You can also try keeping the volume multiplier close to 1.
You can use the 3Commas dca bot settings page to see how much capital you will need for your strategy if you match it to the settings you have on this indicator. You can also check to see how much of a percentage deviation your bot is covering to make sure you have a reasonable range to trade in and orders to cover big dips. You can also check your coverage by seeing how far down the chart the green lines cover, which are your average down orders.
Make sure the initial capital in the properties tab of the settings has enough to cover all of your orders otherwise you will get unrealistic backtesting results. Also, make sure you leave the order size in the properties tab on contracts so it calculates your trades correctly. The only settings you need to touch in the properties tab is the initial capital. Unless you are trading somewhere that has lower commission fees, then you can change that to match, but leave all the other settings as is for it to function properly.
Increasing the volume multiplier will make your average price and take profit target follow the price action a lot closer as price falls, but it can also lead to having very large orders very quickly once you get into the 1.5-3x multiple range. Try using a high volume multiplier with less safety orders and you will get better results, however you need to have money on the sidelines to add on major dips to keep your bot turning a profit. Be very careful with this as greed and impatience will hurt your overall performance. This bot is meant to make money with lots of small wins so don’t get greedy and make sure you have enough money to cover large dips. If you are being aggressive with your bot, then I recommend only using 25% or less of your portfolio to trade aggressively and then use the smart trade feature on 3commas to add chunks of funds to your trades when price dips below your last safety order. Or if you want it to run without any supervision, then use lower volume multipliers and have lots of safety orders that can cover entire bear markets and still keep buying lower.
It’s a good idea to have some capital on the sidelines that you can add in when price dips quickly. This will help lower your average price and allow your bot to get out in profit quicker. 3Commas bot has a smart trade feature that will allow you to track your average price when adding extra funds and it will automatically update your other orders which is very convenient. Look at the longer timeframes when price dips and only add chunks at major areas where price is very likely to bounce. Or you can be aggressive when trading and add to your position when price dips and is at a likely bounce zone to maximize profits.
Only trade coins that have a good amount of liquidity as the larger your orders get, the harder it will be to sell if there isn’t much liquidity. Also, beware of how large your first order is as it will usually be a market order and can move the market if there is not much liquidity.
Since this bot takes a lot of trades and performs best when taking small profits consistently, you will need to factor in exchange fees. The bot is set to .5% commission(you can change this) on the buy and sell orders as most exchanges charge that amount. Some exchanges offer no fee trading on certain coins so be sure to look around for those so you can keep the commissions and maximize profits.
I strongly encourage you to try out a lot of different setting combinations across multiple different coins and do it across a few months to see how it would have performed under various market conditions. This will help you get a better idea of how much of a percentage deviation you’ll need to be able to cover to keep your bot running and making constant profits. You can also use the deep backtesting feature of the strategy panel to see how it would have done, but just beware that the info panel of the indicator will not reflect deep backtesting results, only the normal backtesting range.
MARKETS
This backtester can be used on any market including crypto, stocks, forex & futures. You just need to make sure your base order is larger than the share price when using this on things besides crypto.
TIMEFRAMES
This backtester can be used on all timeframes.

Great Expectations [LucF]Great Expectations helps traders answer the question: What is possible? It is a powerful question, yet exploration of the unknown always entails risk. A more complete set of questions better suited to traders could be:
What opportunity exists from any given point on a chart?
What portion of this opportunity can be realistically captured?
What risk will be incurred in trying to do so, and how long will it take?
Great Expectations is the result of an exploration of these questions. It is a trade simulator that generates visual and quantitative information to help strategy modelers visually identify and analyse areas of optimal expectation on charts, whether they are designing automated or discretionary strategies.
WARNING: Great Expectations is NOT an indicator that helps determine the current state of a market. It works by looking at points in the past from which the future is already known. It uses one definition of repainting extensively (i.e. it goes back in the past to print information that could not have been know at the time). Repainting understood that way is in fact almost all the indicator does! —albeit for what I hope is a noble cause. The indicator is of no use whatsoever in analyzing markets in real-time. If you do not understand what it does, please stay away!
This is an indicator—not a strategy that uses TradingView’s backtesting engine. It works by simulating trades, not unlike a backtest, but with the crucial difference that it assumes a trade (either long or short) is entered on all bars in the historic sample. It walks forward from each bar and determines possible outcomes, gathering individual trade statistics that in turn generate precious global statistics from all outcomes tested on the chart.
Great Expectations provides numbers summarizing trade results on all simulations run from the chart. Those numbers cannot be compared to backtest-produced numbers since all non-filtered bars are examined, even if an entry was taken on the bar immediately preceding the current one, which never happens in a backtest. This peculiarity does NOT invalidate Great Expectations calculations; it just entails that results be considered under a different light. Provided they are evaluated within the indicator’s context, they can be useful—sometimes even more than backtesting results, e.g. in evaluating the impact of parameter-fitting or variations in entry, exit or filtering strats.
Traders and strategy modelers are creatures of hope often suffering from blurred vision; my hope is that Great Expectations will help them appraise the validity of their setup and strat intuitions in a realistic fashion, preventing confirmation bias from obstructing perspective—and great expectations from turning into financial great deceptions.
USE CASES
You’ve identified what looks like a promising setup on other indicators. You load Great Expectations on the chart and evaluate if its high-expectation areas match locations where your setup’s conditions occur. Unless today is your lucky day, chances are the indicator will help you realize your setup is not as promising as you had hoped.
You want to get a rough estimate of the optimal trade duration for a chart and you don’t mind using the entry and exit strategies provided with the indicator. You use the trade length readouts of the indicator.
You’re experimenting with a new stop strategy and want to know how long it will keep you in trades, on average. You integrate your stop strategy in the indicator’s code and look at the average trade length it produces and the TST ratio to evaluate its performance.
You have put together your own entry and exit criteria and are looking for a filter that will help you improve backtesting results. You visually ascertain the suitability of your filter by looking at its results on the charts with great Expectations, to see if your filter is choosing its areas correctly.
You have a strategy that shows backtested trades on your chart. Great Expectations can help you evaluate how well your strategy is benefitting from high-opportunity areas while avoiding poor expectation spots.
You want more complete statistics on your set of strategies than what backtesting will provide. You use Great Expectations, knowing that it tests all bars in the sample that correspond to your criteria, as opposed to backtesting results which are limited to a subset of all possible entries.
You want to fool your friends into thinking you’ve designed the holy grail of indicators, something that identifies optimal opportunities on any chart; you show them the P&L cloud.
FEATURES
For one trade
At any given point on the chart, assuming a trade is entered there, Great Expectations shows you information specific to that trade simulation both on the chart and in the Data Window.
The chart can display:
the P & L Cloud which shows whether the trade ended profitably or not, and by how much,
the Opportunity & Risk Cloud which the maximum opportunity and risk the simulation encountered. When superimposed over the P & L cloud, you will see what I call the managed opportunity and risk, i.e the portion of maximum opportunity that was captured and the portion of the maximum risk that was incurred,
the target and if it was reached,
a background that uses a gradient to show different levels of trade length, P&L or how frequently the target was reached during simulation.
The Data Window displays more than 40 values on individual trades and global results. For any given trade you will know:
Entry/Exit levels, including slippage impact,
It’s outcome and duration,
P/L achieved,
The fraction of the maximum opportunity/risk managed by the trade.
For all trades
After going through all the possible trades on the chart, the indicator will provide you with a rare view of all outcomes expressed with the P&L cloud, which allows us to instantly see the most/least profitable areas of a chart using trade data as support, while also showing its relationship with the opportunity/risk encountered during the simulation. The difference between the two clouds is the managed opportunity and risk.
The Data Window will present you with numbers which we will go through later. Some of them are: average stop size, P/L, win rate, % opportunity managed, trade lengths for different types of trade outcomes and the TST (Target:Stop Travel) ratio.
Let’s see Great Expectations in action… and remember to open your Data Window!
INPUTS
Trade direction : You must first choose if you wish to look at long or short trades. Because of the way the indicator works and the amount of visual information on the chart, it is only practical to look at one type of trades at a time. The default is Longs.
Maximum trade Length (MaxL) : This is the maximum walk forward distance the simulator will go in analyzing outcomes from any given point in the past. It also determines the size of the dead zone among the chart’s last bars. A red background line identifies the beginning of the dead zone for which not enough bars have elapsed to analyze outcomes for the maximum trade length defined. If an ATR-based entry stop is used, that length is added to the wait time before beginning simulations, so that the first entry starts with a clean ATR value. On a sample of around 16000 bars, my tests show that the indicator runs into server errors at lengths of around 290, i.e. having completed ~4,6M simulation loop iterations. That is way too high a length anyways; 100 will usually be amply enough to ring out all the possibilities out of a simulation, and on shorter time frames, 30 can be enough. While making it unduly small will prevent simulations of expressing the market’s potential, the less you use, the faster the indicator will run. The default is 40.
Unrealized P&L base at End of Trade (EOT) : When a simulation ends and the trade is still open, we calculate unrealized P&L from an exit order executed from either the last in-trade stop on the previous bar, or the close of the last bar. You can readily see the impact of this selection on the chart, with the P&L cloud. The default is on the close.
Display : The check box besides the title does nothing.
Show target : Shows a green line displaying the trade’s target expressed as a multiple of X, i.e. the amplitude of the entry stop. I call this value “X” and use it as a unit to express profit and loss on a trade (some call it “R”). The line is highlighted for trades where the close reached the target during the trade, whether the trade ended in profit or loss. This is also where you specify the multiple of X you wish to use in calculating targets. The multiple is used even if targets are not displayed.
Show P&L Cloud : The cloud allows traders to see right away the profitable areas of the chart. The only line printed with the cloud is the “end of trade line” (EOT). The EOT line is the only way one can see the level where a trade ended on the chart (in the Data Window you can see it as the “Exit Fill” value). The EOT level for the trade determines if the trade ended in a profit or a loss. Its value represents one of the following:
- fill from order executed at close of bar where stop is breached during trade (which produces “Realized P/L”),
- simulation of a fill pseudo-fill at the user-defined EOT level (last close or stop level) if the trade runs its course through MaxL bars without getting stopped (producing Unrealized P/L).
The EOT line and the cloud fill print in green when the trade’s outcome is profitable and in red when it is not. If the trade was closed after breaching the stop, the line appears brighter.
Show Opportunity&Risk Cloud : Displays the maximum opportunity/risk that was present during the trade, i.e. the maximum and minimum prices reached.
Background Color Scheme : Allows you to choose between 3 different color schemes for the background gradients, to accommodate different types of chart background/candles. Select “None” if you don’t want a background.
Background source : Determines what value will be used to generate the different intensities of the gradient. You can choose trade length (brighter is shorter), Trade P&L (brighter is higher) or the number of times the target was reached during simulation (brighter is higher). The default is Trade Length.
Entry strat : The check box besides the title does nothing. The default strat is All bars, meaning a trade will be simulated from all bars not excluded by the filters where a MaxL bars future exists. For fun, I’ve included a pseudo-random entry strat (an indirect way of changing the seed is to vary the starting date of the simulation).
Show Filter State : Displays areas where the combination of filters you have selected are allowing entries. Filtering occurs as per your selection(s), whether the state is displayed or not. The effect of multiple selections is additive. The filters are:
1. Bar direction: Longs will only be entered if close>open and vice versa.
2. Rising Volume: Applies to both long and shorts.
3. Rising/falling MA of the length you choose over the number of bars you choose.
4. Custom indicator: You can feed your own filtering signal through this from another indicator. It must produce a signal of 1 to allow long entries and 0 to allow shorts.
Show Entry Stops :
1. Multiple of user-defined length ATR.
2. Fixed percentage.
3. Fixed value.
All entry stops are calculated using the entry fill price as a reference. The fill price is calculated from the current bar’s open, to which slippage is added if configured. This simulates the case where the strategy issued the entry signal on the previous bar for it to be executed at the next bar’s open.
The entry stop remains active until the in-trade stop becomes the more aggressive of the two stops. From then on, the entry stop will be ignored, unless a bar close breaches the in-trade stop, in which case the stop will be reset with a new entry stop and the process repeats.
Show In-trade stops : Displays in bright red the selected in-trade stop (be sure to read the note in this section about them).
1. ATR multiple: added/subtracted from the average of the two previous bars minimum/maximum of open/close.
2. A trailing stop with a deviation expressed as a multiple of entry stop (X).
3. A fixed percentage trailing stop.
Trailing stops deviations are measured from the highest/lowest high/low reached during the trade.
Note: There is a twist with the in-trade stops. It’s that for any given bar, its in-trade stop can hold multiple values, as each successive pass of the advancing simulation loops goes over it from a different entry points. What is printed is the stop from the loop that ended on that bar, which may have nothing to do with other instances of the trade’s in-trade stop for the same bar when visited from other starting points in previous simulations. There is just no practical way to print all stop values that were used for any given bar. While the printed entry stops are the actual ones used on each bar, the in-trade stops shown are merely the last instance used among many.
Include Slippage : if checked, slippage will be added/subtracted from order price to yield the fill price. Slippage is in percentage. If you choose to include slippage in the simulations, remember to adjust it by considering the liquidity of the markets and the time frame you’ll be analyzing.
Include Fees : if checked, fees will be subtracted/added to both realized an unrealized trade profits/losses. Fees are in percentage. The default fees work well for crypto markets but will need adjusting for others—especially in Forex. Remember to modify them accordingly as they can have a major impact on results. Both fees and slippage are included to remind us of their importance, even if the global numbers produced by the indicator are not representative of a real trading scenario composed of sequential trades.
Date Range filtering : the usual. Just note that the checkbox has to be selected for date filtering to activate.
DATA WINDOW
Most of the information produced by this indicator is made available in the Data Window, which you bring up by using the icon below the Watchlist and Alerts buttons at the right of the TV UI. Here’s what’s there.
Some of the information presented in the Data Window is standard trade data; other values are not so standard; e. g. the notions of managed opportunity and risk and Target:Stop Travel ratio. The interplay between all the values provided by Great Expectations is inherently complex, even for a static set of entry/filter/exit strats. During the constant updating which the habitual process of progressive refinement in building strategies that is the lot of strategy modelers entails, another level of complexity is no doubt added to the analysis of this indicator’s values. While I don’t want to sound like Wolfram presenting A New Kind of Science , I do believe that if you are a serious strategy modeler and spend the time required to get used to using all the information this indicator makes available, you may find it useful.
Trade Information
Entry Order : This is the open of the bar where simulation starts. We suppose that an entry signal was generated at the previous bar.
Entry Fill (including slip.) : The actual entry price, including slippage. This is the base price from which other values will be calculated.
Exit Order : When a stop is breached, an exit order is executed from the close of the bar that breached the stop. While there is no “In-trade stop” value included in the Data Window (other than the End of trade Stop previously discussed), this “Exit Order” value is how we can know the level where the trade was stopped during the simulation. The “Trade Length” value will then show the bar where the stop was breached.
Exit Fill (including slip.) : When the exit order is simulated, slippage is added to the order level to create the fill.
Chart: Target : This is the target calculated at the beginning of the simulation. This value also appear on the chart in teal. It is controlled by the multiple of X defined under the “Show Target” checkbox in the Inputs.
Chart: Entry Stop : This value also appears on the chart (the red dots under points where a trade was simulated). Its value is controlled by the Entry Strat chosen in the Inputs.
X (% Fill, including Fees) and X (currency) : This is the stop’s amplitude (Entry Fill – Entry Stop) + Fees. It represents the risk incurred upon entry and will be used to express P&L. We will show R expressed in both a percentage of the Entry Fill level (this value), and currency (the next value). This value represents the risk in the risk:reward ratio and is considered to be a unit of 1 so that RR can be expressed as a single value (i.e. “2” actually meaning “1:2”).
Trade Length : If trade was stopped, it’s the number of bars elapsed until then. The trade is then considered “Closed”. If the trade ends without being stopped (there is no profit-taking strat implemented, so the stop is the only exit strat), then the trade is “Open”, the length is MaxL and it will show in orange. Otherwise the value will print in green/red to reflect if the trade is winning/losing.
P&L (X) : The P&L of the trade, expressed as a multiple of X, which takes into account fees paid at entry and exit. Given our default target setting at 2 units of “X”, a trade that closes at its target will have produced a P&L of +2.0, i.e. twice the value of X (not counting fees paid at exit ). A trade that gets stopped late 50% further that the entry stop’s level will produce a P&L of -1.5X.
P&L (currency, including Fees) : same value as above, but expressed in currency.
Target first reached at bar : If price closed above the target during the trade (even if it occurs after the trade was stopped), this will show when. This value will be used in calculating our TST ratio.
Times Stop/Target reached in sim. : Includes all occurrences during the complete simulation loop.
Opportunity (X) : The highest/lowest price reached during a simulation, i.e. the maximum opportunity encountered, whether the trade was previously stopped or not, expressed as a multiple of X.
Risk (X) : The lowest/highest price reached during a simulation, i.e. the maximum risk encountered, whether the trade was previously stopped or not, expressed as a multiple of X.
Risk:Opportunity : The greater this ratio, the greater Opportunity is, compared to Risk.
Managed Opportunity (%) : The portion of Opportunity that was captured by the highest/low stop position, even if it occurred after a previous stop closed the trade.
Managed Risk (%) : The portion of risk that was protected by the lowest/highest stop position, even if it occurred after a previous stop closed the trade. When this value is greater than 100%, it means the trade’s stop is protecting more than the maximum risk, which is frequent. You will, however, never see close to those values for the Managed Opportunity value, since the stop would have to be higher than the Maximum opportunity. It is much easier to alleviate the risk than it is to lock in profits.
Managed Risk:Opportunity : The ratio of the two preceding values.
Managed Opp. vs. Risk : The Managed Opportunity minus the Managed Risk. When it is negative, which is most often is, it means your strat is protecting a greater portion of the risk than it captures opportunity.
Global Numbers
Win Rate(%) : Percentage of winning trades over all entries. Open trades are considered winning if their last stop/close (as per user selection) locks in profits.
Avg X%, Avg X (currency) : Averages of previously described values:.
Avg Profitability/Trade (APPT) : This measures expectation using: Average Profitability Per Trade = (Probability of Win × Average Win) − (Probability of Loss × Average Loss) . It quantifies the average expectation/trade, which RR alone can’t do, as the probabilities of each outcome (win/lose) must also be used to calculate expectancy. The APPT combine the RR with the win rate to yield the true expectancy of a strategy. In my usual way of expressing risk with X, APPT is the equivalent of the average P&L per trade expressed in X. An APPT of -1.5 means that we lose on average 1.5X/trade.
Equity (X), Equity (currency) : The cumulative result of all trade outcomes, expressed as a multiple of X. Multiplied by the Average X in currency, this yields the Equity in currency.
Risk:Opportunity, Managed Risk:Opportunity, Managed Opp. vs. Risk : The global values of the ones previously described.
Avg Trade Length (TL) : One of the most important values derived by going through all the simulations. Again, it is composed of either the length of stopped trades, or MaxL when the trade isn’t stopped (open). This value can help systems modelers shape the characteristics of the components they use to build their strategies.
Avg Closed Win TL and Avg Closed Lose TL : The average lengths of winning/losing trades that were stopped.
Target reached? Avg bars to Stop and Target reached? Avg bars to Target : For the trades where the target was reached at some point in the simulation, the number of bars to the first point where the stop was breached and where the target was reached, respectively. These two values are used to calculate the next value.
TST (Target:Stop Travel Ratio) : This tracks the ratio between the two preceding values (Bars to first stop/Bars to first target), but only for trades where the target was reached somewhere in the loop. A ratio of 2 means targets are reached twice as fast as stops.
The next values of this section are counts or percentages and are self-explanatory.
Chart Plots
Contains chart plots of values already describes.
NOTES
Optimization/Overfitting: There is a fine line between optimizing and overfitting. Tools like this indicator can lead unsuspecting modelers down a path of overfitting that often turns strategies into over-specialized beasts that do not perform elegantly when confronted to the real-world. Proven testing strategies like walk forward analysis will go a long way in helping modelers alleviate this risk.
Input tuning: Because the results generated by the indicator will vary with the parameters used in the active entry, filtering and exit strats, it’s important to realize that although it may be fun at first, just slapping the default settings on a chart and time frame will not yield optimal nor reliable results. While using ATR as often as possible (as I do in this indicator) is a good way to make strat parametrization adaptable, it is not a foolproof solution.
There is no data for the last MaxL bars of the chart, since not enough trade future has elapsed to run a simulation from MaxL bars back.
Modifying the code: I have tried to structure the code modularly, even if that entails a larger code base, so that you can adapt it to your needs. I’ve included a few token components in each of the placeholders designed for entry strategies, filters, entry stops and in-trade stops. This will hopefully make it easier to add your own. In the same spirit, I have also commented liberally.
You will find in the code many instances of standard trade management tasks that can be lifted to code TV strategies where, as I do in mine, you manage everything yourself and don’t rely on built-in Pine strategy functions to act on your trades.
Enjoy!
THANKS
To @scarf who showed me how plotchar() could be used to plot values without ruining scale.
To @glaz for the suggestion to include a Chandelier stop strat; I will.
To @simpelyfe for the idea of using an indicator input for the filters (if some day TV lets us use more than one, it will be useful in other modules of the indicator).
To @RicardoSantos for the random generator used in the random entry strat.
To all scripters publishing open source on TradingView; their code is the best way to learn.
To my trading buddies Irving and Bruno; who showed me way back how pro traders get it done.

Adaptive Trend SelectorThe Adaptive Trend Selector is a comprehensive trend-following tool designed to automatically identify the optimal moving average crossover strategy. It features adjustable parameters and an integrated backtester that delivers institutional-grade insights into the recommended strategy. The model continuously adapts to new data in real time by evaluating multiple moving average combinations, determining the best performing lengths, and presenting the backtest results in a clear, color-coded table that benchmarks performance against the buy-and-hold strategy.
At its core, the model systematically backtests a wide range of moving average combinations to identify the configuration that maximizes the selected optimization metric. Users can choose to optimize for absolute returns or risk-adjusted returns using the Sharpe, Sortino, or Calmar ratios. Alternatively, users can enable manual optimization to test custom fast and slow moving average lengths and view the corresponding backtest results. The label displays the Compounded Annual Growth Rate (CAGR) of the strategy, with the buy-and-hold CAGR in parentheses for comparison. The table presents the backtest results based on the fast and slow lengths displayed at the top:
Sharpe = CAGR per unit of standard deviation.
Sortino = CAGR per unit of downside deviation.
Calmar = CAGR relative to maximum drawdown.
Max DD = Largest peak-to-trough decline in value.
Beta (β) = Return sensitivity relative to buy-and-hold.
Alpha (α) = Excess annualized risk-adjusted returns.
Win Rate = Ratio of profitable trades to total trades.
Profit Factor = Total gross profit per unit of losses.
Expectancy = Average expected return per trade.
Trades/Year = Average number of trades per year.
This indicator is designed with flexibility in mind, enabling users to specify the start date of the backtesting period and the preferred moving average strategy. Supported strategies include the Exponential Moving Average (EMA), Simple Moving Average (SMA), Wilder’s Moving Average (RMA), Weighted Moving Average (WMA), and Volume-Weighted Moving Average (VWMA). To minimize overfitting, users can define constraints such as a minimum and maximum number of trades per year, as well as an optional optimization margin that prioritizes longer, more robust combinations by requiring shorter-length strategies to exceed this threshold. The table follows an intuitive color logic that enables quick performance comparison against buy-and-hold (B&H):
Sharpe = Green indicates better than B&H, while red indicates worse.
Sortino = Green indicates better than B&H, while red indicates worse.
Calmar = Green indicates better than B&H, while red indicates worse.
Max DD = Green indicates better than B&H, while red indicates worse.
Beta (β) = Green indicates better than B&H, while red indicates worse.
Alpha (α) = Green indicates above 0%, while red indicates below 0%.
Win Rate = Green indicates above 50%, while red indicates below 50%.
Profit Factor = Green indicates above 2, while red indicates below 1.
Expectancy = Green indicates above 0%, while red indicates below 0%.
In summary, the Adaptive Trend Selector is a powerful tool designed to help investors make data-driven decisions when selecting moving average crossover strategies. By optimizing for risk-adjusted returns, investors can confidently identify the best lengths using institutional-grade metrics. While results are based on the selected historical period, users should be mindful of potential overfitting, as past results may not persist under future market conditions. Since the model recalibrates to incorporate new data, the recommended lengths may evolve over time.

MA MACD BB BackTesterOverview:
This Pine Script™ code provides a comprehensive backtesting tool that combines Moving Average (MA), Moving Average Convergence Divergence (MACD), and Bollinger Bands (BB). It is designed to help traders analyze market trends and make informed trading decisions by testing various strategies over historical data.
Key Features:
1. Customizable Indicators:
Moving Average (MA): Smooths out price data for clearer trend direction.
MACD: Measures trend momentum through MACD Line, Signal Line, and Histogram.
Bollinger Bands (BB): Identifies overbought or oversold conditions with upper and lower bands.
2. Flexible Trading Direction: Choose between long or short positions to adapt to different market conditions.
3. Risk Management: Efficiently allocate your capital with customizable position sizes.
4. Signal Generation:
Buy Signals: Triggered by crossovers for MACD, MA, and BB.
Sell Signals: Triggered by crossunders for MACD, MA, and BB.
5. Automated Trading: Automatically enter and exit trades based on signal conditions and strategy parameters.
How It Works:
1. Indicator Selection: Select your preferred indicator (MA, MACD, BB) and trading direction (Long/Short).
2. Risk Management Configuration: Set the percentage of capital to allocate per position to manage risk effectively.
3.Signal Detection: The algorithm identifies and plots buy/sell signals directly on the chart based on the chosen indicator.
4. Trade Execution: The strategy automatically enters and exits trades based on signal conditions and configured strategy parameters.
Use Cases:
- Backtesting: Evaluate the effectiveness of trading strategies using historical data to understand potential performance.
- Strategy Development: Customize and expand the strategy to incorporate additional indicators or conditions to fit specific trading styles.
ADDONS That Affect Strategy:
1. Indicator Parameters:
Adjustments to the settings of MACD (e.g., fast length, slow length), MA (e.g., length), and BB (e.g., length, multiplier) will directly impact the detection of signals and the strategy's performance.
2. Trading Direction:
Changing the trading direction (Long/Short) will alter the entry and exit conditions based on the detected signals.
3. Risk Management Settings:
Modifying the position size percentage affects capital allocation and overall risk exposure per trade.
ADDONS That Do Not Affect Strategy:
1. Visual Customizations:
Changes to the color, shape, and style of the plotted lines and signals do not impact the core functionality of the strategy but enhance visual clarity.
2. Text and Labels:
Modifying text labels for the signals (such as renaming "Buy MACD" to "MACD Buy Signal") is purely cosmetic and does not influence the strategy’s logic or outcomes.
Notes:
- Customization: The indicator is highly customizable to fit various trading styles and market conditions.
- Risk Management: Adjust position sizes and risk parameters according to your risk tolerance and account size.
- Optimization: Regularly backtest and optimize parameters to adapt to changing market dynamics for better performance.
Getting Started:
-Add the script to your chart.
-Adjust the input parameters to suit your analysis preferences.
-Observe the marked buy and sell signals on your chart to make informed trading decisions.

[Sextan] T-Step LSMA MTF BacktestLevel: 1
NOTE: This is a request by @scantor516 to backtest T-Step LSMA by alexgrover with my Sextan framework. You can backtest many of my indicators in minutes now! Of course,you can define your own indicator in the highlighted area in compliance with the uniform format, which guarantee when you use "Indicator on Indicator" function, it would not produce any error.
Courtesy of alexgrover for his T-Step LSMA
Background
Backtesting of technical indicators and strategies is the most common way to understand a quantitative strategy. However, the complicated configuration and adaptation work of backtesting many quantitative tools makes many traders who do not understand the code daunted. Moreover, although I have written a lot of strategies, I am still not very satisfied with the backtest configuration and writing efficiency. Therefore, I have been thinking about how to build a backtesting framework that can quickly and easily evaluate the backtesting performance of any indicator with a "long/short entry" indicator, that is, a "simple backtesting tool for dummies". The performance requirements should be stable, and the operation should be simple and convenient. It is best to "copy", "paste", and "a few mouse clicks" to complete the quick backtest and evaluation of a new indicator.
Luckily, I recently realized that TradingView provides an "Indicator on Indicator" feature, which is the perfect foundation for doing "hot swap" backtesting. My basic idea is to use a two-layer design. The first layer is the technical indicator signal source that needs to be embedded, which is only used to provide buy and sell signals of custom strategies; the second layer is the trading system, which is used to receive the output signals of the first layer, and filter the signals according to the agreed specifications. , Take Profit, Stop Loss, draw buy and sell signals and cost lines, define and send custom buy and sell alert messages to mobile phones, social software or trading interfaces. In general, this two-layer design is a flexible combination of "death and alive", which can meet the needs of most traders to quickly evaluate the performance of a certain technical indicator. The first layer here is flexible. Users can insert their own strategy codes according to my template, and they can draw buy and sell signals and output them to the second layer. The second layer is fixed, and the overall framework is solidified to ensure the stability and unity of the trading system. It is convenient to compare different or similar strategies under the same conditions. Finally, all trading signals are drawn on the chart, and the output strategy returns. test report.
The main function:
The first layer: "{Sextan} Your Indicator Source", the script provides a template for personalized strategy input, and the signal and definition interfaces ensure full compatibility with the second layer. Backtesting is performed stably in the backtesting framework of the layer. The first layer of this script is also relatively simple: enter your script in the highlighted custom script area, and after ensuring the final buy and sell signals long = bool condition, short = bool condition, the design of the first layer is considered complete. Input it into the PINE script editor of TradingView, save it and add it to the chart, you can see the pulse sequence in yellow (buy) and purple (sell) on the sub-picture, corresponding to the main picture, you can subjectively judge that the quality of the trading point of the strategy is good Bad.
The second layer: "{Sextan} PINEv4 Sextans Backtest Framework". This script is the standardized trading system strategy execution and alarm, used to generate the final report of the strategy backtest and some key indicators that I have customized that I find useful, such as: winning rate , Odds, Winning Surface, Kelly Ratio, Take Profit and Stop Loss Thresholds, Trading Frequency, etc. are evaluated according to the Kelly formula. To use the second layer, first load it into the TrainingView chart, no markers will appear on the chart, since you have not specified any strategy source signals, click on the gear-shaped setting next to the "{Sextan} PINEv4 Sextans BTFW" header button, you can open the backtest settings, the first item is to select your custom strategy source. Because we have added the strategy source to the chart in the previous step, you can easily find an option "{Sextan} Your Indicator Source: Signal" at the bottom of the list, this is the strategy source input we need, select and confirm , you can see various markers on the main graph, and quickly generate a backtesting profit graph and a list of backtesting reports. You can generate files and download the backtesting reports locally. You can also click the gear on the backtest chart interface to customize some conditions of the backtest, including: initial capital amount, currency type, percentage of each order placed, amount of pyramid additions, commission fees, slippage, etc. configuration. Note: The configuration in the interface dialog overrides the same configuration implemented by the code in the backtest script.
How to output charts:
The first layer: "{Sextan} Your Indicator Source", the output of this script is the pulse value of yellow and purple, yellow +1 means buy, purple -1 means sell.
The second layer: PINEv4 Sextans Backtest Framework". The output of this script is a bit complicated. After all, it is the entire trading system with a lot of information:
1. Blue and red arrows. The blue upward arrow indicates long position, the red downward arrow indicates short position, and the horizontal bar at the end of the purple arrow indicates take profit or stop loss exit.
2. Red and green lines. This is the holding cost line of the strategy, green represents the cost of holding a long position, and red represents the cost of holding a short position. The cost line is a continuous solid line and the price action is relatively close.
3. Green and yellow long take profit and stop loss area and green and yellow long take profit and stop loss fork. Once a long position is held, there is a conditional order for take profit and stop loss. The green horizontal line is the long take profit ratio line, and the yellow is the long stop loss ratio line; the green cross indicates the long take profit price, and the yellow cross indicates the long position. Stop loss price. It's worth noting that the prongs and wires don't necessarily go together. Because of the optimization of the algorithm, for a strong market, the take profit will occur after breaking the take profit line, and the profit will not be taken until the price falls.
4. The purple and red short take profit and stop loss area and the purple red short stop loss fork. Once a short position is held, there will be a take profit and stop loss conditional order, the red is the short take profit ratio line, and the purple is the short stop loss ratio line; the red cross indicates the short take profit price, and the purple cross indicates the short stop loss price.
5. In addition to the above signs, there are also text and numbers indicating the profit and loss values of long and short positions. "L" means long; "S" means short; "XL" means close long; "XS" means close short.
TradingView Strategy Tester Panel:
The overview graph is an intuitive graph that plots the blue (gain) and red (loss) curves of all backtest periods together, and notes: the absolute value and percentage of net profit, the number of all closed positions, the winning percentage, the profit factor, The maximum trading loss, the absolute value and ratio of the average trading profit and loss, and the average number of K-lines held in all trades.
Another is the performance summary. This is to display all long and short statistical indicators of backtesting in the form of a list, such as: net profit, gross profit, Sharpe ratio, maximum position, commission, times of profit and loss, etc.
Finally, the transaction list is a table indexed by the transaction serial number, showing the signal direction, date and time, price, profit and loss, accumulated profit and loss, maximum transaction profit, transaction loss and other values.
Remarks
Finally, I will explain that this is just the beginning of this model. I will continue to optimize the trading system of the second layer. Various optimization feedback and suggestions are welcome. For valuable feedback, I am willing to provide some L4/L5 technical indicators as rewards for free subscription rights.

[Sextan] %R Trend Exhaustion BacktestLevel: 1
NOTE: This is a request by @upslidedown to backtest %R Trend Exhaustion by upslidedown with my Sextan framework. You can backtest many of my indicators in minutes now! Of course,you can define your own indicator in the highlighted area in compliance with the uniform format, which guarantee when you use "Indicator on Indicator" function, it would not produce any error.
Courtesy of upslidedown for his %R Trend Exhaustionindicator
Background
Backtesting of technical indicators and strategies is the most common way to understand a quantitative strategy. However, the complicated configuration and adaptation work of backtesting many quantitative tools makes many traders who do not understand the code daunted. Moreover, although I have written a lot of strategies, I am still not very satisfied with the backtest configuration and writing efficiency. Therefore, I have been thinking about how to build a backtesting framework that can quickly and easily evaluate the backtesting performance of any indicator with a "long/short entry" indicator, that is, a "simple backtesting tool for dummies". The performance requirements should be stable, and the operation should be simple and convenient. It is best to "copy", "paste", and "a few mouse clicks" to complete the quick backtest and evaluation of a new indicator.
Luckily, I recently realized that TradingView provides an "Indicator on Indicator" feature, which is the perfect foundation for doing "hot swap" backtesting. My basic idea is to use a two-layer design. The first layer is the technical indicator signal source that needs to be embedded, which is only used to provide buy and sell signals of custom strategies; the second layer is the trading system, which is used to receive the output signals of the first layer, and filter the signals according to the agreed specifications. , Take Profit, Stop Loss, draw buy and sell signals and cost lines, define and send custom buy and sell alert messages to mobile phones, social software or trading interfaces. In general, this two-layer design is a flexible combination of "death and alive", which can meet the needs of most traders to quickly evaluate the performance of a certain technical indicator. The first layer here is flexible. Users can insert their own strategy codes according to my template, and they can draw buy and sell signals and output them to the second layer. The second layer is fixed, and the overall framework is solidified to ensure the stability and unity of the trading system. It is convenient to compare different or similar strategies under the same conditions. Finally, all trading signals are drawn on the chart, and the output strategy returns. test report.
The main function:
The first layer: "{Sextan} Your Indicator Source", the script provides a template for personalized strategy input, and the signal and definition interfaces ensure full compatibility with the second layer. Backtesting is performed stably in the backtesting framework of the layer. The first layer of this script is also relatively simple: enter your script in the highlighted custom script area, and after ensuring the final buy and sell signals long = bool condition, short = bool condition, the design of the first layer is considered complete. Input it into the PINE script editor of TradingView, save it and add it to the chart, you can see the pulse sequence in yellow (buy) and purple (sell) on the sub-picture, corresponding to the main picture, you can subjectively judge that the quality of the trading point of the strategy is good Bad.
The second layer: "{Sextan} PINEv4 Sextans Backtest Framework". This script is the standardized trading system strategy execution and alarm, used to generate the final report of the strategy backtest and some key indicators that I have customized that I find useful, such as: winning rate , Odds, Winning Surface, Kelly Ratio, Take Profit and Stop Loss Thresholds, Trading Frequency, etc. are evaluated according to the Kelly formula. To use the second layer, first load it into the TrainingView chart, no markers will appear on the chart, since you have not specified any strategy source signals, click on the gear-shaped setting next to the "{Sextan} PINEv4 Sextans BTFW" header button, you can open the backtest settings, the first item is to select your custom strategy source. Because we have added the strategy source to the chart in the previous step, you can easily find an option "{Sextan} Your Indicator Source: Signal" at the bottom of the list, this is the strategy source input we need, select and confirm , you can see various markers on the main graph, and quickly generate a backtesting profit graph and a list of backtesting reports. You can generate files and download the backtesting reports locally. You can also click the gear on the backtest chart interface to customize some conditions of the backtest, including: initial capital amount, currency type, percentage of each order placed, amount of pyramid additions, commission fees, slippage, etc. configuration. Note: The configuration in the interface dialog overrides the same configuration implemented by the code in the backtest script.
How to output charts:
The first layer: "{Sextan} Your Indicator Source", the output of this script is the pulse value of yellow and purple, yellow +1 means buy, purple -1 means sell.
The second layer: PINEv4 Sextans Backtest Framework". The output of this script is a bit complicated. After all, it is the entire trading system with a lot of information:
1. Blue and red arrows. The blue upward arrow indicates long position, the red downward arrow indicates short position, and the horizontal bar at the end of the purple arrow indicates take profit or stop loss exit.
2. Red and green lines. This is the holding cost line of the strategy, green represents the cost of holding a long position, and red represents the cost of holding a short position. The cost line is a continuous solid line and the price action is relatively close.
3. Green and yellow long take profit and stop loss area and green and yellow long take profit and stop loss fork. Once a long position is held, there is a conditional order for take profit and stop loss. The green horizontal line is the long take profit ratio line, and the yellow is the long stop loss ratio line; the green cross indicates the long take profit price, and the yellow cross indicates the long position. Stop loss price. It's worth noting that the prongs and wires don't necessarily go together. Because of the optimization of the algorithm, for a strong market, the take profit will occur after breaking the take profit line, and the profit will not be taken until the price falls.
4. The purple and red short take profit and stop loss area and the purple red short stop loss fork. Once a short position is held, there will be a take profit and stop loss conditional order, the red is the short take profit ratio line, and the purple is the short stop loss ratio line; the red cross indicates the short take profit price, and the purple cross indicates the short stop loss price.
5. In addition to the above signs, there are also text and numbers indicating the profit and loss values of long and short positions. "L" means long; "S" means short; "XL" means close long; "XS" means close short.
TradingView Strategy Tester Panel:
The overview graph is an intuitive graph that plots the blue (gain) and red (loss) curves of all backtest periods together, and notes: the absolute value and percentage of net profit, the number of all closed positions, the winning percentage, the profit factor, The maximum trading loss, the absolute value and ratio of the average trading profit and loss, and the average number of K-lines held in all trades.
Another is the performance summary. This is to display all long and short statistical indicators of backtesting in the form of a list, such as: net profit, gross profit, Sharpe ratio, maximum position, commission, times of profit and loss, etc.
Finally, the transaction list is a table indexed by the transaction serial number, showing the signal direction, date and time, price, profit and loss, accumulated profit and loss, maximum transaction profit, transaction loss and other values.
Remarks
Finally, I will explain that this is just the beginning of this model. I will continue to optimize the trading system of the second layer. Various optimization feedback and suggestions are welcome. For valuable feedback, I am willing to provide some L4/L5 technical indicators as rewards for free subscription rights.

[Sextan] B-Xtrender BacktestLevel: 1
NOTE: This is a request by @scantor516 to backtest B-Xtrender @PuppyTherapy by QuantTherapy with my Sextan framework. You can backtest many of my indicators in minutes now! Of course,you can define your own indicator in the highlighted area in compliance with the uniform format, which guarantee when you use "Indicator on Indicator" function, it would not produce any error.
Courtesy of QuantTherapy for his B-Xtrender @PuppyTherapy
Background
Backtesting of technical indicators and strategies is the most common way to understand a quantitative strategy. However, the complicated configuration and adaptation work of backtesting many quantitative tools makes many traders who do not understand the code daunted. Moreover, although I have written a lot of strategies, I am still not very satisfied with the backtest configuration and writing efficiency. Therefore, I have been thinking about how to build a backtesting framework that can quickly and easily evaluate the backtesting performance of any indicator with a "long/short entry" indicator, that is, a "simple backtesting tool for dummies". The performance requirements should be stable, and the operation should be simple and convenient. It is best to "copy", "paste", and "a few mouse clicks" to complete the quick backtest and evaluation of a new indicator.
Luckily, I recently realized that TradingView provides an "Indicator on Indicator" feature, which is the perfect foundation for doing "hot swap" backtesting. My basic idea is to use a two-layer design. The first layer is the technical indicator signal source that needs to be embedded, which is only used to provide buy and sell signals of custom strategies; the second layer is the trading system, which is used to receive the output signals of the first layer, and filter the signals according to the agreed specifications. , Take Profit, Stop Loss, draw buy and sell signals and cost lines, define and send custom buy and sell alert messages to mobile phones, social software or trading interfaces. In general, this two-layer design is a flexible combination of "death and alive", which can meet the needs of most traders to quickly evaluate the performance of a certain technical indicator. The first layer here is flexible. Users can insert their own strategy codes according to my template, and they can draw buy and sell signals and output them to the second layer. The second layer is fixed, and the overall framework is solidified to ensure the stability and unity of the trading system. It is convenient to compare different or similar strategies under the same conditions. Finally, all trading signals are drawn on the chart, and the output strategy returns. test report.
The main function:
The first layer: "{Sextan} Your Indicator Source", the script provides a template for personalized strategy input, and the signal and definition interfaces ensure full compatibility with the second layer. Backtesting is performed stably in the backtesting framework of the layer. The first layer of this script is also relatively simple: enter your script in the highlighted custom script area, and after ensuring the final buy and sell signals long = bool condition, short = bool condition, the design of the first layer is considered complete. Input it into the PINE script editor of TradingView, save it and add it to the chart, you can see the pulse sequence in yellow (buy) and purple (sell) on the sub-picture, corresponding to the main picture, you can subjectively judge that the quality of the trading point of the strategy is good Bad.
The second layer: "{Sextan} PINEv4 Sextans Backtest Framework". This script is the standardized trading system strategy execution and alarm, used to generate the final report of the strategy backtest and some key indicators that I have customized that I find useful, such as: winning rate , Odds, Winning Surface, Kelly Ratio, Take Profit and Stop Loss Thresholds, Trading Frequency, etc. are evaluated according to the Kelly formula. To use the second layer, first load it into the TrainingView chart, no markers will appear on the chart, since you have not specified any strategy source signals, click on the gear-shaped setting next to the "{Sextan} PINEv4 Sextans BTFW" header button, you can open the backtest settings, the first item is to select your custom strategy source. Because we have added the strategy source to the chart in the previous step, you can easily find an option "{Sextan} Your Indicator Source: Signal" at the bottom of the list, this is the strategy source input we need, select and confirm , you can see various markers on the main graph, and quickly generate a backtesting profit graph and a list of backtesting reports. You can generate files and download the backtesting reports locally. You can also click the gear on the backtest chart interface to customize some conditions of the backtest, including: initial capital amount, currency type, percentage of each order placed, amount of pyramid additions, commission fees, slippage, etc. configuration. Note: The configuration in the interface dialog overrides the same configuration implemented by the code in the backtest script.
How to output charts:
The first layer: "{Sextan} Your Indicator Source", the output of this script is the pulse value of yellow and purple, yellow +1 means buy, purple -1 means sell.
The second layer: PINEv4 Sextans Backtest Framework". The output of this script is a bit complicated. After all, it is the entire trading system with a lot of information:
1. Blue and red arrows. The blue upward arrow indicates long position, the red downward arrow indicates short position, and the horizontal bar at the end of the purple arrow indicates take profit or stop loss exit.
2. Red and green lines. This is the holding cost line of the strategy, green represents the cost of holding a long position, and red represents the cost of holding a short position. The cost line is a continuous solid line and the price action is relatively close.
3. Green and yellow long take profit and stop loss area and green and yellow long take profit and stop loss fork. Once a long position is held, there is a conditional order for take profit and stop loss. The green horizontal line is the long take profit ratio line, and the yellow is the long stop loss ratio line; the green cross indicates the long take profit price, and the yellow cross indicates the long position. Stop loss price. It's worth noting that the prongs and wires don't necessarily go together. Because of the optimization of the algorithm, for a strong market, the take profit will occur after breaking the take profit line, and the profit will not be taken until the price falls.
4. The purple and red short take profit and stop loss area and the purple red short stop loss fork. Once a short position is held, there will be a take profit and stop loss conditional order, the red is the short take profit ratio line, and the purple is the short stop loss ratio line; the red cross indicates the short take profit price, and the purple cross indicates the short stop loss price.
5. In addition to the above signs, there are also text and numbers indicating the profit and loss values of long and short positions. "L" means long; "S" means short; "XL" means close long; "XS" means close short.
TradingView Strategy Tester Panel:
The overview graph is an intuitive graph that plots the blue (gain) and red (loss) curves of all backtest periods together, and notes: the absolute value and percentage of net profit, the number of all closed positions, the winning percentage, the profit factor, The maximum trading loss, the absolute value and ratio of the average trading profit and loss, and the average number of K-lines held in all trades.
Another is the performance summary. This is to display all long and short statistical indicators of backtesting in the form of a list, such as: net profit, gross profit, Sharpe ratio, maximum position, commission, times of profit and loss, etc.
Finally, the transaction list is a table indexed by the transaction serial number, showing the signal direction, date and time, price, profit and loss, accumulated profit and loss, maximum transaction profit, transaction loss and other values.
Remarks
Finally, I will explain that this is just the beginning of this model. I will continue to optimize the trading system of the second layer. Various optimization feedback and suggestions are welcome. For valuable feedback, I am willing to provide some L4/L5 technical indicators as rewards for free subscription rights.

[Sextan] Haos Vieual BacktestLevel: 1
NOTE: This is a request by @scantor516 to backtest Haos Visual @PuppyTherapy by QuantTherapy with my Sextan framework. You can backtest many of my indicators in minutes now! Of course,you can define your own indicator in the highlighted area in compliance with the uniform format, which guarantee when you use "Indicator on Indicator" function, it would not produce any error.
Courtesy of QuantTherapy for his Haos Visual @PuppyTherapy
Background
Backtesting of technical indicators and strategies is the most common way to understand a quantitative strategy. However, the complicated configuration and adaptation work of backtesting many quantitative tools makes many traders who do not understand the code daunted. Moreover, although I have written a lot of strategies, I am still not very satisfied with the backtest configuration and writing efficiency. Therefore, I have been thinking about how to build a backtesting framework that can quickly and easily evaluate the backtesting performance of any indicator with a "long/short entry" indicator, that is, a "simple backtesting tool for dummies". The performance requirements should be stable, and the operation should be simple and convenient. It is best to "copy", "paste", and "a few mouse clicks" to complete the quick backtest and evaluation of a new indicator.
Luckily, I recently realized that TradingView provides an "Indicator on Indicator" feature, which is the perfect foundation for doing "hot swap" backtesting. My basic idea is to use a two-layer design. The first layer is the technical indicator signal source that needs to be embedded, which is only used to provide buy and sell signals of custom strategies; the second layer is the trading system, which is used to receive the output signals of the first layer, and filter the signals according to the agreed specifications. , Take Profit, Stop Loss, draw buy and sell signals and cost lines, define and send custom buy and sell alert messages to mobile phones, social software or trading interfaces. In general, this two-layer design is a flexible combination of "death and alive", which can meet the needs of most traders to quickly evaluate the performance of a certain technical indicator. The first layer here is flexible. Users can insert their own strategy codes according to my template, and they can draw buy and sell signals and output them to the second layer. The second layer is fixed, and the overall framework is solidified to ensure the stability and unity of the trading system. It is convenient to compare different or similar strategies under the same conditions. Finally, all trading signals are drawn on the chart, and the output strategy returns. test report.
The main function:
The first layer: "{Sextan} Your Indicator Source", the script provides a template for personalized strategy input, and the signal and definition interfaces ensure full compatibility with the second layer. Backtesting is performed stably in the backtesting framework of the layer. The first layer of this script is also relatively simple: enter your script in the highlighted custom script area, and after ensuring the final buy and sell signals long = bool condition, short = bool condition, the design of the first layer is considered complete. Input it into the PINE script editor of TradingView, save it and add it to the chart, you can see the pulse sequence in yellow (buy) and purple (sell) on the sub-picture, corresponding to the main picture, you can subjectively judge that the quality of the trading point of the strategy is good Bad.
The second layer: "{Sextan} PINEv4 Sextans Backtest Framework". This script is the standardized trading system strategy execution and alarm, used to generate the final report of the strategy backtest and some key indicators that I have customized that I find useful, such as: winning rate , Odds, Winning Surface, Kelly Ratio, Take Profit and Stop Loss Thresholds, Trading Frequency, etc. are evaluated according to the Kelly formula. To use the second layer, first load it into the TrainingView chart, no markers will appear on the chart, since you have not specified any strategy source signals, click on the gear-shaped setting next to the "{Sextan} PINEv4 Sextans BTFW" header button, you can open the backtest settings, the first item is to select your custom strategy source. Because we have added the strategy source to the chart in the previous step, you can easily find an option "{Sextan} Your Indicator Source: Signal" at the bottom of the list, this is the strategy source input we need, select and confirm , you can see various markers on the main graph, and quickly generate a backtesting profit graph and a list of backtesting reports. You can generate files and download the backtesting reports locally. You can also click the gear on the backtest chart interface to customize some conditions of the backtest, including: initial capital amount, currency type, percentage of each order placed, amount of pyramid additions, commission fees, slippage, etc. configuration. Note: The configuration in the interface dialog overrides the same configuration implemented by the code in the backtest script.
How to output charts:
The first layer: "{Sextan} Your Indicator Source", the output of this script is the pulse value of yellow and purple, yellow +1 means buy, purple -1 means sell.
The second layer: PINEv4 Sextans Backtest Framework". The output of this script is a bit complicated. After all, it is the entire trading system with a lot of information:
1. Blue and red arrows. The blue upward arrow indicates long position, the red downward arrow indicates short position, and the horizontal bar at the end of the purple arrow indicates take profit or stop loss exit.
2. Red and green lines. This is the holding cost line of the strategy, green represents the cost of holding a long position, and red represents the cost of holding a short position. The cost line is a continuous solid line and the price action is relatively close.
3. Green and yellow long take profit and stop loss area and green and yellow long take profit and stop loss fork. Once a long position is held, there is a conditional order for take profit and stop loss. The green horizontal line is the long take profit ratio line, and the yellow is the long stop loss ratio line; the green cross indicates the long take profit price, and the yellow cross indicates the long position. Stop loss price. It's worth noting that the prongs and wires don't necessarily go together. Because of the optimization of the algorithm, for a strong market, the take profit will occur after breaking the take profit line, and the profit will not be taken until the price falls.
4. The purple and red short take profit and stop loss area and the purple red short stop loss fork. Once a short position is held, there will be a take profit and stop loss conditional order, the red is the short take profit ratio line, and the purple is the short stop loss ratio line; the red cross indicates the short take profit price, and the purple cross indicates the short stop loss price.
5. In addition to the above signs, there are also text and numbers indicating the profit and loss values of long and short positions. "L" means long; "S" means short; "XL" means close long; "XS" means close short.
TradingView Strategy Tester Panel:
The overview graph is an intuitive graph that plots the blue (gain) and red (loss) curves of all backtest periods together, and notes: the absolute value and percentage of net profit, the number of all closed positions, the winning percentage, the profit factor, The maximum trading loss, the absolute value and ratio of the average trading profit and loss, and the average number of K-lines held in all trades.
Another is the performance summary. This is to display all long and short statistical indicators of backtesting in the form of a list, such as: net profit, gross profit, Sharpe ratio, maximum position, commission, times of profit and loss, etc.
Finally, the transaction list is a table indexed by the transaction serial number, showing the signal direction, date and time, price, profit and loss, accumulated profit and loss, maximum transaction profit, transaction loss and other values.
Remarks
Finally, I will explain that this is just the beginning of this model. I will continue to optimize the trading system of the second layer. Various optimization feedback and suggestions are welcome. For valuable feedback, I am willing to provide some L4/L5 technical indicators as rewards for free subscription rights.

[Sextan] Delta-RSI Oscillator BacktestLevel: 1
NOTE: This is a request by @scantor516 to backtest Delta-RSI Oscillator by tbiktag with my Sextan framework. You can backtest many of my indicators in minutes now! Of course,you can define your own indicator in the highlighted area in compliance with the uniform format, which guarantee when you use "Indicator on Indicator" function, it would not produce any error.
Courtesy of tbiktag for his Delta-RSI Oscillator Strategy
Background
Backtesting of technical indicators and strategies is the most common way to understand a quantitative strategy. However, the complicated configuration and adaptation work of backtesting many quantitative tools makes many traders who do not understand the code daunted. Moreover, although I have written a lot of strategies, I am still not very satisfied with the backtest configuration and writing efficiency. Therefore, I have been thinking about how to build a backtesting framework that can quickly and easily evaluate the backtesting performance of any indicator with a "long/short entry" indicator, that is, a "simple backtesting tool for dummies". The performance requirements should be stable, and the operation should be simple and convenient. It is best to "copy", "paste", and "a few mouse clicks" to complete the quick backtest and evaluation of a new indicator.
Luckily, I recently realized that TradingView provides an "Indicator on Indicator" feature, which is the perfect foundation for doing "hot swap" backtesting. My basic idea is to use a two-layer design. The first layer is the technical indicator signal source that needs to be embedded, which is only used to provide buy and sell signals of custom strategies; the second layer is the trading system, which is used to receive the output signals of the first layer, and filter the signals according to the agreed specifications. , Take Profit, Stop Loss, draw buy and sell signals and cost lines, define and send custom buy and sell alert messages to mobile phones, social software or trading interfaces. In general, this two-layer design is a flexible combination of "death and alive", which can meet the needs of most traders to quickly evaluate the performance of a certain technical indicator. The first layer here is flexible. Users can insert their own strategy codes according to my template, and they can draw buy and sell signals and output them to the second layer. The second layer is fixed, and the overall framework is solidified to ensure the stability and unity of the trading system. It is convenient to compare different or similar strategies under the same conditions. Finally, all trading signals are drawn on the chart, and the output strategy returns. test report.
The main function:
The first layer: "{Sextan} Your Indicator Source", the script provides a template for personalized strategy input, and the signal and definition interfaces ensure full compatibility with the second layer. Backtesting is performed stably in the backtesting framework of the layer. The first layer of this script is also relatively simple: enter your script in the highlighted custom script area, and after ensuring the final buy and sell signals long = bool condition, short = bool condition, the design of the first layer is considered complete. Input it into the PINE script editor of TradingView, save it and add it to the chart, you can see the pulse sequence in yellow (buy) and purple (sell) on the sub-picture, corresponding to the main picture, you can subjectively judge that the quality of the trading point of the strategy is good Bad.
The second layer: "{Sextan} PINEv4 Sextans Backtest Framework". This script is the standardized trading system strategy execution and alarm, used to generate the final report of the strategy backtest and some key indicators that I have customized that I find useful, such as: winning rate , Odds, Winning Surface, Kelly Ratio, Take Profit and Stop Loss Thresholds, Trading Frequency, etc. are evaluated according to the Kelly formula. To use the second layer, first load it into the TrainingView chart, no markers will appear on the chart, since you have not specified any strategy source signals, click on the gear-shaped setting next to the "{Sextan} PINEv4 Sextans BTFW" header button, you can open the backtest settings, the first item is to select your custom strategy source. Because we have added the strategy source to the chart in the previous step, you can easily find an option "{Sextan} Your Indicator Source: Signal" at the bottom of the list, this is the strategy source input we need, select and confirm , you can see various markers on the main graph, and quickly generate a backtesting profit graph and a list of backtesting reports. You can generate files and download the backtesting reports locally. You can also click the gear on the backtest chart interface to customize some conditions of the backtest, including: initial capital amount, currency type, percentage of each order placed, amount of pyramid additions, commission fees, slippage, etc. configuration. Note: The configuration in the interface dialog overrides the same configuration implemented by the code in the backtest script.
How to output charts:
The first layer: "{Sextan} Your Indicator Source", the output of this script is the pulse value of yellow and purple, yellow +1 means buy, purple -1 means sell.
The second layer: PINEv4 Sextans Backtest Framework". The output of this script is a bit complicated. After all, it is the entire trading system with a lot of information:
1. Blue and red arrows. The blue upward arrow indicates long position, the red downward arrow indicates short position, and the horizontal bar at the end of the purple arrow indicates take profit or stop loss exit.
2. Red and green lines. This is the holding cost line of the strategy, green represents the cost of holding a long position, and red represents the cost of holding a short position. The cost line is a continuous solid line and the price action is relatively close.
3. Green and yellow long take profit and stop loss area and green and yellow long take profit and stop loss fork. Once a long position is held, there is a conditional order for take profit and stop loss. The green horizontal line is the long take profit ratio line, and the yellow is the long stop loss ratio line; the green cross indicates the long take profit price, and the yellow cross indicates the long position. Stop loss price. It's worth noting that the prongs and wires don't necessarily go together. Because of the optimization of the algorithm, for a strong market, the take profit will occur after breaking the take profit line, and the profit will not be taken until the price falls.
4. The purple and red short take profit and stop loss area and the purple red short stop loss fork. Once a short position is held, there will be a take profit and stop loss conditional order, the red is the short take profit ratio line, and the purple is the short stop loss ratio line; the red cross indicates the short take profit price, and the purple cross indicates the short stop loss price.
5. In addition to the above signs, there are also text and numbers indicating the profit and loss values of long and short positions. "L" means long; "S" means short; "XL" means close long; "XS" means close short.
TradingView Strategy Tester Panel:
The overview graph is an intuitive graph that plots the blue (gain) and red (loss) curves of all backtest periods together, and notes: the absolute value and percentage of net profit, the number of all closed positions, the winning percentage, the profit factor, The maximum trading loss, the absolute value and ratio of the average trading profit and loss, and the average number of K-lines held in all trades.
Another is the performance summary. This is to display all long and short statistical indicators of backtesting in the form of a list, such as: net profit, gross profit, Sharpe ratio, maximum position, commission, times of profit and loss, etc.
Finally, the transaction list is a table indexed by the transaction serial number, showing the signal direction, date and time, price, profit and loss, accumulated profit and loss, maximum transaction profit, transaction loss and other values.
Remarks
Finally, I will explain that this is just the beginning of this model. I will continue to optimize the trading system of the second layer. Various optimization feedback and suggestions are welcome. For valuable feedback, I am willing to provide some L4/L5 technical indicators as rewards for free subscription rights.

[Sextan] Supertrend - Ladder ATR BacktestLevel: 1
NOTE: This is a request by @upslidedown to backtest Supertrend - Ladder ATR by HeWhoMustNotBeNamed with my Sextan framework. You can backtest many of my indicators in minutes now! Of course,you can define your own indicator in the highlighted area in compliance with the uniform format, which guarantee when you use "Indicator on Indicator" function, it would not produce any error.
Courtesy of HeWhoMustNotBeNamed for his Supertrend - Ladder ATR indicator
Background
Backtesting of technical indicators and strategies is the most common way to understand a quantitative strategy. However, the complicated configuration and adaptation work of backtesting many quantitative tools makes many traders who do not understand the code daunted. Moreover, although I have written a lot of strategies, I am still not very satisfied with the backtest configuration and writing efficiency. Therefore, I have been thinking about how to build a backtesting framework that can quickly and easily evaluate the backtesting performance of any indicator with a "long/short entry" indicator, that is, a "simple backtesting tool for dummies". The performance requirements should be stable, and the operation should be simple and convenient. It is best to "copy", "paste", and "a few mouse clicks" to complete the quick backtest and evaluation of a new indicator.
Luckily, I recently realized that TradingView provides an "Indicator on Indicator" feature, which is the perfect foundation for doing "hot swap" backtesting. My basic idea is to use a two-layer design. The first layer is the technical indicator signal source that needs to be embedded, which is only used to provide buy and sell signals of custom strategies; the second layer is the trading system, which is used to receive the output signals of the first layer, and filter the signals according to the agreed specifications. , Take Profit, Stop Loss, draw buy and sell signals and cost lines, define and send custom buy and sell alert messages to mobile phones, social software or trading interfaces. In general, this two-layer design is a flexible combination of "death and alive", which can meet the needs of most traders to quickly evaluate the performance of a certain technical indicator. The first layer here is flexible. Users can insert their own strategy codes according to my template, and they can draw buy and sell signals and output them to the second layer. The second layer is fixed, and the overall framework is solidified to ensure the stability and unity of the trading system. It is convenient to compare different or similar strategies under the same conditions. Finally, all trading signals are drawn on the chart, and the output strategy returns. test report.
The main function:
The first layer: "{Sextan} Your Indicator Source", the script provides a template for personalized strategy input, and the signal and definition interfaces ensure full compatibility with the second layer. Backtesting is performed stably in the backtesting framework of the layer. The first layer of this script is also relatively simple: enter your script in the highlighted custom script area, and after ensuring the final buy and sell signals long = bool condition, short = bool condition, the design of the first layer is considered complete. Input it into the PINE script editor of TradingView, save it and add it to the chart, you can see the pulse sequence in yellow (buy) and purple (sell) on the sub-picture, corresponding to the main picture, you can subjectively judge that the quality of the trading point of the strategy is good Bad.
The second layer: "{Sextan} PINEv4 Sextans Backtest Framework". This script is the standardized trading system strategy execution and alarm, used to generate the final report of the strategy backtest and some key indicators that I have customized that I find useful, such as: winning rate , Odds, Winning Surface, Kelly Ratio, Take Profit and Stop Loss Thresholds, Trading Frequency, etc. are evaluated according to the Kelly formula. To use the second layer, first load it into the TrainingView chart, no markers will appear on the chart, since you have not specified any strategy source signals, click on the gear-shaped setting next to the "{Sextan} PINEv4 Sextans BTFW" header button, you can open the backtest settings, the first item is to select your custom strategy source. Because we have added the strategy source to the chart in the previous step, you can easily find an option "{Sextan} Your Indicator Source: Signal" at the bottom of the list, this is the strategy source input we need, select and confirm , you can see various markers on the main graph, and quickly generate a backtesting profit graph and a list of backtesting reports. You can generate files and download the backtesting reports locally. You can also click the gear on the backtest chart interface to customize some conditions of the backtest, including: initial capital amount, currency type, percentage of each order placed, amount of pyramid additions, commission fees, slippage, etc. configuration. Note: The configuration in the interface dialog overrides the same configuration implemented by the code in the backtest script.
How to output charts:
The first layer: "{Sextan} Your Indicator Source", the output of this script is the pulse value of yellow and purple, yellow +1 means buy, purple -1 means sell.
The second layer: PINEv4 Sextans Backtest Framework". The output of this script is a bit complicated. After all, it is the entire trading system with a lot of information:
1. Blue and red arrows. The blue upward arrow indicates long position, the red downward arrow indicates short position, and the horizontal bar at the end of the purple arrow indicates take profit or stop loss exit.
2. Red and green lines. This is the holding cost line of the strategy, green represents the cost of holding a long position, and red represents the cost of holding a short position. The cost line is a continuous solid line and the price action is relatively close.
3. Green and yellow long take profit and stop loss area and green and yellow long take profit and stop loss fork. Once a long position is held, there is a conditional order for take profit and stop loss. The green horizontal line is the long take profit ratio line, and the yellow is the long stop loss ratio line; the green cross indicates the long take profit price, and the yellow cross indicates the long position. Stop loss price. It's worth noting that the prongs and wires don't necessarily go together. Because of the optimization of the algorithm, for a strong market, the take profit will occur after breaking the take profit line, and the profit will not be taken until the price falls.
4. The purple and red short take profit and stop loss area and the purple red short stop loss fork. Once a short position is held, there will be a take profit and stop loss conditional order, the red is the short take profit ratio line, and the purple is the short stop loss ratio line; the red cross indicates the short take profit price, and the purple cross indicates the short stop loss price.
5. In addition to the above signs, there are also text and numbers indicating the profit and loss values of long and short positions. "L" means long; "S" means short; "XL" means close long; "XS" means close short.
TradingView Strategy Tester Panel:
The overview graph is an intuitive graph that plots the blue (gain) and red (loss) curves of all backtest periods together, and notes: the absolute value and percentage of net profit, the number of all closed positions, the winning percentage, the profit factor, The maximum trading loss, the absolute value and ratio of the average trading profit and loss, and the average number of K-lines held in all trades.
Another is the performance summary. This is to display all long and short statistical indicators of backtesting in the form of a list, such as: net profit, gross profit, Sharpe ratio, maximum position, commission, times of profit and loss, etc.
Finally, the transaction list is a table indexed by the transaction serial number, showing the signal direction, date and time, price, profit and loss, accumulated profit and loss, maximum transaction profit, transaction loss and other values.
Remarks
Finally, I will explain that this is just the beginning of this model. I will continue to optimize the trading system of the second layer. Various optimization feedback and suggestions are welcome. For valuable feedback, I am willing to provide some L4/L5 technical indicators as rewards for free subscription rights.

[Sextan] Hull MA BacktestLevel: 1
NOTE: This is a request by @babaa to backtest Hull suite by InSilico with my Sextan framework. You can backtest many of my indicators in minutes now! Of course,you can define your own indicator in the highlighted area in compliance with the uniform format, which guarantee when you use "Indicator on Indicator" function, it would not produce any error.
Courtesy of InSilico for his Hull suite indicator
Background
Backtesting of technical indicators and strategies is the most common way to understand a quantitative strategy. However, the complicated configuration and adaptation work of backtesting many quantitative tools makes many traders who do not understand the code daunted. Moreover, although I have written a lot of strategies, I am still not very satisfied with the backtest configuration and writing efficiency. Therefore, I have been thinking about how to build a backtesting framework that can quickly and easily evaluate the backtesting performance of any indicator with a "long/short entry" indicator, that is, a "simple backtesting tool for dummies". The performance requirements should be stable, and the operation should be simple and convenient. It is best to "copy", "paste", and "a few mouse clicks" to complete the quick backtest and evaluation of a new indicator.
Luckily, I recently realized that TradingView provides an "Indicator on Indicator" feature, which is the perfect foundation for doing "hot swap" backtesting. My basic idea is to use a two-layer design. The first layer is the technical indicator signal source that needs to be embedded, which is only used to provide buy and sell signals of custom strategies; the second layer is the trading system, which is used to receive the output signals of the first layer, and filter the signals according to the agreed specifications. , Take Profit, Stop Loss, draw buy and sell signals and cost lines, define and send custom buy and sell alert messages to mobile phones, social software or trading interfaces. In general, this two-layer design is a flexible combination of "death and alive", which can meet the needs of most traders to quickly evaluate the performance of a certain technical indicator. The first layer here is flexible. Users can insert their own strategy codes according to my template, and they can draw buy and sell signals and output them to the second layer. The second layer is fixed, and the overall framework is solidified to ensure the stability and unity of the trading system. It is convenient to compare different or similar strategies under the same conditions. Finally, all trading signals are drawn on the chart, and the output strategy returns. test report.
The main function:
The first layer: "{Sextan} Your Indicator Source", the script provides a template for personalized strategy input, and the signal and definition interfaces ensure full compatibility with the second layer. Backtesting is performed stably in the backtesting framework of the layer. The first layer of this script is also relatively simple: enter your script in the highlighted custom script area, and after ensuring the final buy and sell signals long = bool condition, short = bool condition, the design of the first layer is considered complete. Input it into the PINE script editor of TradingView, save it and add it to the chart, you can see the pulse sequence in yellow (buy) and purple (sell) on the sub-picture, corresponding to the main picture, you can subjectively judge that the quality of the trading point of the strategy is good Bad.
The second layer: "{Sextan} PINEv4 Sextans Backtest Framework". This script is the standardized trading system strategy execution and alarm, used to generate the final report of the strategy backtest and some key indicators that I have customized that I find useful, such as: winning rate , Odds, Winning Surface, Kelly Ratio, Take Profit and Stop Loss Thresholds, Trading Frequency, etc. are evaluated according to the Kelly formula. To use the second layer, first load it into the TrainingView chart, no markers will appear on the chart, since you have not specified any strategy source signals, click on the gear-shaped setting next to the "{Sextan} PINEv4 Sextans BTFW" header button, you can open the backtest settings, the first item is to select your custom strategy source. Because we have added the strategy source to the chart in the previous step, you can easily find an option "{Sextan} Your Indicator Source: Signal" at the bottom of the list, this is the strategy source input we need, select and confirm , you can see various markers on the main graph, and quickly generate a backtesting profit graph and a list of backtesting reports. You can generate files and download the backtesting reports locally. You can also click the gear on the backtest chart interface to customize some conditions of the backtest, including: initial capital amount, currency type, percentage of each order placed, amount of pyramid additions, commission fees, slippage, etc. configuration. Note: The configuration in the interface dialog overrides the same configuration implemented by the code in the backtest script.
How to output charts:
The first layer: "{Sextan} Your Indicator Source", the output of this script is the pulse value of yellow and purple, yellow +1 means buy, purple -1 means sell.
The second layer: PINEv4 Sextans Backtest Framework". The output of this script is a bit complicated. After all, it is the entire trading system with a lot of information:
1. Blue and red arrows. The blue upward arrow indicates long position, the red downward arrow indicates short position, and the horizontal bar at the end of the purple arrow indicates take profit or stop loss exit.
2. Red and green lines. This is the holding cost line of the strategy, green represents the cost of holding a long position, and red represents the cost of holding a short position. The cost line is a continuous solid line and the price action is relatively close.
3. Green and yellow long take profit and stop loss area and green and yellow long take profit and stop loss fork. Once a long position is held, there is a conditional order for take profit and stop loss. The green horizontal line is the long take profit ratio line, and the yellow is the long stop loss ratio line; the green cross indicates the long take profit price, and the yellow cross indicates the long position. Stop loss price. It's worth noting that the prongs and wires don't necessarily go together. Because of the optimization of the algorithm, for a strong market, the take profit will occur after breaking the take profit line, and the profit will not be taken until the price falls.
4. The purple and red short take profit and stop loss area and the purple red short stop loss fork. Once a short position is held, there will be a take profit and stop loss conditional order, the red is the short take profit ratio line, and the purple is the short stop loss ratio line; the red cross indicates the short take profit price, and the purple cross indicates the short stop loss price.
5. In addition to the above signs, there are also text and numbers indicating the profit and loss values of long and short positions. "L" means long; "S" means short; "XL" means close long; "XS" means close short.
TradingView Strategy Tester Panel:
The overview graph is an intuitive graph that plots the blue (gain) and red (loss) curves of all backtest periods together, and notes: the absolute value and percentage of net profit, the number of all closed positions, the winning percentage, the profit factor, The maximum trading loss, the absolute value and ratio of the average trading profit and loss, and the average number of K-lines held in all trades.
Another is the performance summary. This is to display all long and short statistical indicators of backtesting in the form of a list, such as: net profit, gross profit, Sharpe ratio, maximum position, commission, times of profit and loss, etc.
Finally, the transaction list is a table indexed by the transaction serial number, showing the signal direction, date and time, price, profit and loss, accumulated profit and loss, maximum transaction profit, transaction loss and other values.
Remarks
Finally, I will explain that this is just the beginning of this model. I will continue to optimize the trading system of the second layer. Various optimization feedback and suggestions are welcome. For valuable feedback, I am willing to provide some L4/L5 technical indicators as rewards for free subscription rights.

[Sextan] Fisher Transform BacktestLevel: 1
NOTE: This is a request by @Uni_ve12se to backtest Ehlers Fisher Transform by cheatcountry with my Sextan framework. I ONLY take 5 minutes to perform it and how much time would you cost for this work? You can backtest many of my indicators in minutes now! Of course,you can define your own indicator in the highlighted area in compliance with the uniform format, which guarantee when you use "Indicator on Indicator" function, it would not produce any error.
Courtesy of cheatcountry for his Ehlers Fisher Transform indicator
Background
Backtesting of technical indicators and strategies is the most common way to understand a quantitative strategy. However, the complicated configuration and adaptation work of backtesting many quantitative tools makes many traders who do not understand the code daunted. Moreover, although I have written a lot of strategies, I am still not very satisfied with the backtest configuration and writing efficiency. Therefore, I have been thinking about how to build a backtesting framework that can quickly and easily evaluate the backtesting performance of any indicator with a "long/short entry" indicator, that is, a "simple backtesting tool for dummies". The performance requirements should be stable, and the operation should be simple and convenient. It is best to "copy", "paste", and "a few mouse clicks" to complete the quick backtest and evaluation of a new indicator.
Luckily, I recently realized that TradingView provides an "Indicator on Indicator" feature, which is the perfect foundation for doing "hot swap" backtesting. My basic idea is to use a two-layer design. The first layer is the technical indicator signal source that needs to be embedded, which is only used to provide buy and sell signals of custom strategies; the second layer is the trading system, which is used to receive the output signals of the first layer, and filter the signals according to the agreed specifications. , Take Profit, Stop Loss, draw buy and sell signals and cost lines, define and send custom buy and sell alert messages to mobile phones, social software or trading interfaces. In general, this two-layer design is a flexible combination of "death and alive", which can meet the needs of most traders to quickly evaluate the performance of a certain technical indicator. The first layer here is flexible. Users can insert their own strategy codes according to my template, and they can draw buy and sell signals and output them to the second layer. The second layer is fixed, and the overall framework is solidified to ensure the stability and unity of the trading system. It is convenient to compare different or similar strategies under the same conditions. Finally, all trading signals are drawn on the chart, and the output strategy returns. test report.
The main function:
The first layer: "{Sextan} Your Indicator Source", the script provides a template for personalized strategy input, and the signal and definition interfaces ensure full compatibility with the second layer. Backtesting is performed stably in the backtesting framework of the layer. The first layer of this script is also relatively simple: enter your script in the highlighted custom script area, and after ensuring the final buy and sell signals long = bool condition, short = bool condition, the design of the first layer is considered complete. Input it into the PINE script editor of TradingView, save it and add it to the chart, you can see the pulse sequence in yellow (buy) and purple (sell) on the sub-picture, corresponding to the main picture, you can subjectively judge that the quality of the trading point of the strategy is good Bad.
The second layer: "{Sextan} PINEv4 Sextans Backtest Framework". This script is the standardized trading system strategy execution and alarm, used to generate the final report of the strategy backtest and some key indicators that I have customized that I find useful, such as: winning rate , Odds, Winning Surface, Kelly Ratio, Take Profit and Stop Loss Thresholds, Trading Frequency, etc. are evaluated according to the Kelly formula. To use the second layer, first load it into the TrainingView chart, no markers will appear on the chart, since you have not specified any strategy source signals, click on the gear-shaped setting next to the "{Sextan} PINEv4 Sextans BTFW" header button, you can open the backtest settings, the first item is to select your custom strategy source. Because we have added the strategy source to the chart in the previous step, you can easily find an option "{Sextan} Your Indicator Source: Signal" at the bottom of the list, this is the strategy source input we need, select and confirm , you can see various markers on the main graph, and quickly generate a backtesting profit graph and a list of backtesting reports. You can generate files and download the backtesting reports locally. You can also click the gear on the backtest chart interface to customize some conditions of the backtest, including: initial capital amount, currency type, percentage of each order placed, amount of pyramid additions, commission fees, slippage, etc. configuration. Note: The configuration in the interface dialog overrides the same configuration implemented by the code in the backtest script.
How to output charts:
The first layer: "{Sextan} Your Indicator Source", the output of this script is the pulse value of yellow and purple, yellow +1 means buy, purple -1 means sell.
The second layer: PINEv4 Sextans Backtest Framework". The output of this script is a bit complicated. After all, it is the entire trading system with a lot of information:
1. Blue and red arrows. The blue upward arrow indicates long position, the red downward arrow indicates short position, and the horizontal bar at the end of the purple arrow indicates take profit or stop loss exit.
2. Red and green lines. This is the holding cost line of the strategy, green represents the cost of holding a long position, and red represents the cost of holding a short position. The cost line is a continuous solid line and the price action is relatively close.
3. Green and yellow long take profit and stop loss area and green and yellow long take profit and stop loss fork. Once a long position is held, there is a conditional order for take profit and stop loss. The green horizontal line is the long take profit ratio line, and the yellow is the long stop loss ratio line; the green cross indicates the long take profit price, and the yellow cross indicates the long position. Stop loss price. It's worth noting that the prongs and wires don't necessarily go together. Because of the optimization of the algorithm, for a strong market, the take profit will occur after breaking the take profit line, and the profit will not be taken until the price falls.
4. The purple and red short take profit and stop loss area and the purple red short stop loss fork. Once a short position is held, there will be a take profit and stop loss conditional order, the red is the short take profit ratio line, and the purple is the short stop loss ratio line; the red cross indicates the short take profit price, and the purple cross indicates the short stop loss price.
5. In addition to the above signs, there are also text and numbers indicating the profit and loss values of long and short positions. "L" means long; "S" means short; "XL" means close long; "XS" means close short.
TradingView Strategy Tester Panel:
The overview graph is an intuitive graph that plots the blue (gain) and red (loss) curves of all backtest periods together, and notes: the absolute value and percentage of net profit, the number of all closed positions, the winning percentage, the profit factor, The maximum trading loss, the absolute value and ratio of the average trading profit and loss, and the average number of K-lines held in all trades.
Another is the performance summary. This is to display all long and short statistical indicators of backtesting in the form of a list, such as: net profit, gross profit, Sharpe ratio, maximum position, commission, times of profit and loss, etc.
Finally, the transaction list is a table indexed by the transaction serial number, showing the signal direction, date and time, price, profit and loss, accumulated profit and loss, maximum transaction profit, transaction loss and other values.
Remarks
Finally, I will explain that this is just the beginning of this model. I will continue to optimize the trading system of the second layer. Various optimization feedback and suggestions are welcome. For valuable feedback, I am willing to provide some L4/L5 technical indicators as rewards for free subscription rights.

[Sextan] M-Oscillator BacktestLevel: 1
NOTE: This is a request by @scantor516 to backtest M-Oscillator by Mango2Juice with my Sextan framework. I ONLY take 5 minutes to perform it and how much time would you cost for this work?
Courtesy of Mango2Juice for M-Oscillator script.
You can backtest many of my indicators in minutes now! Of course,you can define your own indicator in the highlighted area in compliance with the uniform format, which guarantee when you use "Indicator on Indicator" function, it would not produce any error.
Background
Backtesting of technical indicators and strategies is the most common way to understand a quantitative strategy. However, the complicated configuration and adaptation work of backtesting many quantitative tools makes many traders who do not understand the code daunted. Moreover, although I have written a lot of strategies, I am still not very satisfied with the backtest configuration and writing efficiency. Therefore, I have been thinking about how to build a backtesting framework that can quickly and easily evaluate the backtesting performance of any indicator with a "long/short entry" indicator, that is, a "simple backtesting tool for dummies". The performance requirements should be stable, and the operation should be simple and convenient. It is best to "copy", "paste", and "a few mouse clicks" to complete the quick backtest and evaluation of a new indicator.
Luckily, I recently realized that TradingView provides an "Indicator on Indicator" feature, which is the perfect foundation for doing "hot swap" backtesting. My basic idea is to use a two-layer design. The first layer is the technical indicator signal source that needs to be embedded, which is only used to provide buy and sell signals of custom strategies; the second layer is the trading system, which is used to receive the output signals of the first layer, and filter the signals according to the agreed specifications. , Take Profit, Stop Loss, draw buy and sell signals and cost lines, define and send custom buy and sell alert messages to mobile phones, social software or trading interfaces. In general, this two-layer design is a flexible combination of "death and alive", which can meet the needs of most traders to quickly evaluate the performance of a certain technical indicator. The first layer here is flexible. Users can insert their own strategy codes according to my template, and they can draw buy and sell signals and output them to the second layer. The second layer is fixed, and the overall framework is solidified to ensure the stability and unity of the trading system. It is convenient to compare different or similar strategies under the same conditions. Finally, all trading signals are drawn on the chart, and the output strategy returns. test report.
The main function:
The first layer: "{Sextan} Your Indicator Source", the script provides a template for personalized strategy input, and the signal and definition interfaces ensure full compatibility with the second layer. Backtesting is performed stably in the backtesting framework of the layer. The first layer of this script is also relatively simple: enter your script in the highlighted custom script area, and after ensuring the final buy and sell signals long = bool condition, short = bool condition, the design of the first layer is considered complete. Input it into the PINE script editor of TradingView, save it and add it to the chart, you can see the pulse sequence in yellow (buy) and purple (sell) on the sub-picture, corresponding to the main picture, you can subjectively judge that the quality of the trading point of the strategy is good Bad.
The second layer: "{Sextan} PINEv4 Sextans Backtest Framework". This script is the standardized trading system strategy execution and alarm, used to generate the final report of the strategy backtest and some key indicators that I have customized that I find useful, such as: winning rate , Odds, Winning Surface, Kelly Ratio, Take Profit and Stop Loss Thresholds, Trading Frequency, etc. are evaluated according to the Kelly formula. To use the second layer, first load it into the TrainingView chart, no markers will appear on the chart, since you have not specified any strategy source signals, click on the gear-shaped setting next to the "{Sextan} PINEv4 Sextans BTFW" header button, you can open the backtest settings, the first item is to select your custom strategy source. Because we have added the strategy source to the chart in the previous step, you can easily find an option "{Sextan} Your Indicator Source: Signal" at the bottom of the list, this is the strategy source input we need, select and confirm , you can see various markers on the main graph, and quickly generate a backtesting profit graph and a list of backtesting reports. You can generate files and download the backtesting reports locally. You can also click the gear on the backtest chart interface to customize some conditions of the backtest, including: initial capital amount, currency type, percentage of each order placed, amount of pyramid additions, commission fees, slippage, etc. configuration. Note: The configuration in the interface dialog overrides the same configuration implemented by the code in the backtest script.
How to output charts:
The first layer: "{Sextan} Your Indicator Source", the output of this script is the pulse value of yellow and purple, yellow +1 means buy, purple -1 means sell.
The second layer: PINEv4 Sextans Backtest Framework". The output of this script is a bit complicated. After all, it is the entire trading system with a lot of information:
1. Blue and red arrows. The blue upward arrow indicates long position, the red downward arrow indicates short position, and the horizontal bar at the end of the purple arrow indicates take profit or stop loss exit.
2. Red and green lines. This is the holding cost line of the strategy, green represents the cost of holding a long position, and red represents the cost of holding a short position. The cost line is a continuous solid line and the price action is relatively close.
3. Green and yellow long take profit and stop loss area and green and yellow long take profit and stop loss fork. Once a long position is held, there is a conditional order for take profit and stop loss. The green horizontal line is the long take profit ratio line, and the yellow is the long stop loss ratio line; the green cross indicates the long take profit price, and the yellow cross indicates the long position. Stop loss price. It's worth noting that the prongs and wires don't necessarily go together. Because of the optimization of the algorithm, for a strong market, the take profit will occur after breaking the take profit line, and the profit will not be taken until the price falls.
4. The purple and red short take profit and stop loss area and the purple red short stop loss fork. Once a short position is held, there will be a take profit and stop loss conditional order, the red is the short take profit ratio line, and the purple is the short stop loss ratio line; the red cross indicates the short take profit price, and the purple cross indicates the short stop loss price.
5. In addition to the above signs, there are also text and numbers indicating the profit and loss values of long and short positions. "L" means long; "S" means short; "XL" means close long; "XS" means close short.
TradingView Strategy Tester Panel:
The overview graph is an intuitive graph that plots the blue (gain) and red (loss) curves of all backtest periods together, and notes: the absolute value and percentage of net profit, the number of all closed positions, the winning percentage, the profit factor, The maximum trading loss, the absolute value and ratio of the average trading profit and loss, and the average number of K-lines held in all trades.
Another is the performance summary. This is to display all long and short statistical indicators of backtesting in the form of a list, such as: net profit, gross profit, Sharpe ratio, maximum position, commission, times of profit and loss, etc.
Finally, the transaction list is a table indexed by the transaction serial number, showing the signal direction, date and time, price, profit and loss, accumulated profit and loss, maximum transaction profit, transaction loss and other values.
Remarks
Finally, I will explain that this is just the beginning of this model. I will continue to optimize the trading system of the second layer. Various optimization feedback and suggestions are welcome. For valuable feedback, I am willing to provide some L4/L5 technical indicators as rewards for free subscription rights.

[Sextan] KAMA BacktestLevel: 1
NOTE: This is ONLY an EXAMPLE on HOW-TO produce a customized "{Sextan} PINEv4 Sextans Backtest Framework" with intput signal source as my "{blackcat} L2 Perry Kaufman Adaptive MA (KAMA)" quickly and drawing on main chart. You can backtest many of my indicators in minutes now!
Of course,you can define your own indicator in the highlighted area in compliance with the uniform format, which guarantee when you use "Indicator on Indicator" function, it would not produce any error.
Background
Backtesting of technical indicators and strategies is the most common way to understand a quantitative strategy. However, the complicated configuration and adaptation work of backtesting many quantitative tools makes many traders who do not understand the code daunted. Moreover, although I have written a lot of strategies, I am still not very satisfied with the backtest configuration and writing efficiency. Therefore, I have been thinking about how to build a backtesting framework that can quickly and easily evaluate the backtesting performance of any indicator with a "long/short entry" indicator, that is, a "simple backtesting tool for dummies". The performance requirements should be stable, and the operation should be simple and convenient. It is best to "copy", "paste", and "a few mouse clicks" to complete the quick backtest and evaluation of a new indicator.
Luckily, I recently realized that TradingView provides an "Indicator on Indicator" feature, which is the perfect foundation for doing "hot swap" backtesting. My basic idea is to use a two-layer design. The first layer is the technical indicator signal source that needs to be embedded, which is only used to provide buy and sell signals of custom strategies; the second layer is the trading system, which is used to receive the output signals of the first layer, and filter the signals according to the agreed specifications. , Take Profit, Stop Loss, draw buy and sell signals and cost lines, define and send custom buy and sell alert messages to mobile phones, social software or trading interfaces. In general, this two-layer design is a flexible combination of "death and alive", which can meet the needs of most traders to quickly evaluate the performance of a certain technical indicator. The first layer here is flexible. Users can insert their own strategy codes according to my template, and they can draw buy and sell signals and output them to the second layer. The second layer is fixed, and the overall framework is solidified to ensure the stability and unity of the trading system. It is convenient to compare different or similar strategies under the same conditions. Finally, all trading signals are drawn on the chart, and the output strategy returns. test report.
The main function:
The first layer: "{Sextan} Your Indicator Source", the script provides a template for personalized strategy input, and the signal and definition interfaces ensure full compatibility with the second layer. Backtesting is performed stably in the backtesting framework of the layer. The first layer of this script is also relatively simple: enter your script in the highlighted custom script area, and after ensuring the final buy and sell signals long = bool condition, short = bool condition, the design of the first layer is considered complete. Input it into the PINE script editor of TradingView, save it and add it to the chart, you can see the pulse sequence in yellow (buy) and purple (sell) on the sub-picture, corresponding to the main picture, you can subjectively judge that the quality of the trading point of the strategy is good Bad.
The second layer: "{Sextan} PINEv4 Sextans Backtest Framework". This script is the standardized trading system strategy execution and alarm, used to generate the final report of the strategy backtest and some key indicators that I have customized that I find useful, such as: winning rate , Odds, Winning Surface, Kelly Ratio, Take Profit and Stop Loss Thresholds, Trading Frequency, etc. are evaluated according to the Kelly formula. To use the second layer, first load it into the TrainingView chart, no markers will appear on the chart, since you have not specified any strategy source signals, click on the gear-shaped setting next to the "{Sextan} PINEv4 Sextans BTFW" header button, you can open the backtest settings, the first item is to select your custom strategy source. Because we have added the strategy source to the chart in the previous step, you can easily find an option "{Sextan} Your Indicator Source: Signal" at the bottom of the list, this is the strategy source input we need, select and confirm , you can see various markers on the main graph, and quickly generate a backtesting profit graph and a list of backtesting reports. You can generate files and download the backtesting reports locally. You can also click the gear on the backtest chart interface to customize some conditions of the backtest, including: initial capital amount, currency type, percentage of each order placed, amount of pyramid additions, commission fees, slippage, etc. configuration. Note: The configuration in the interface dialog overrides the same configuration implemented by the code in the backtest script.
How to output charts:
The first layer: "{Sextan} Your Indicator Source", the output of this script is the pulse value of yellow and purple, yellow +1 means buy, purple -1 means sell.
The second layer: PINEv4 Sextans Backtest Framework". The output of this script is a bit complicated. After all, it is the entire trading system with a lot of information:
1. Blue and red arrows. The blue upward arrow indicates long position, the red downward arrow indicates short position, and the horizontal bar at the end of the purple arrow indicates take profit or stop loss exit.
2. Red and green lines. This is the holding cost line of the strategy, green represents the cost of holding a long position, and red represents the cost of holding a short position. The cost line is a continuous solid line and the price action is relatively close.
3. Green and yellow long take profit and stop loss area and green and yellow long take profit and stop loss fork. Once a long position is held, there is a conditional order for take profit and stop loss. The green horizontal line is the long take profit ratio line, and the yellow is the long stop loss ratio line; the green cross indicates the long take profit price, and the yellow cross indicates the long position. Stop loss price. It's worth noting that the prongs and wires don't necessarily go together. Because of the optimization of the algorithm, for a strong market, the take profit will occur after breaking the take profit line, and the profit will not be taken until the price falls.
4. The purple and red short take profit and stop loss area and the purple red short stop loss fork. Once a short position is held, there will be a take profit and stop loss conditional order, the red is the short take profit ratio line, and the purple is the short stop loss ratio line; the red cross indicates the short take profit price, and the purple cross indicates the short stop loss price.
5. In addition to the above signs, there are also text and numbers indicating the profit and loss values of long and short positions. "L" means long; "S" means short; "XL" means close long; "XS" means close short.
TradingView Strategy Tester Panel:
The overview graph is an intuitive graph that plots the blue (gain) and red (loss) curves of all backtest periods together, and notes: the absolute value and percentage of net profit, the number of all closed positions, the winning percentage, the profit factor, The maximum trading loss, the absolute value and ratio of the average trading profit and loss, and the average number of K-lines held in all trades.
Another is the performance summary. This is to display all long and short statistical indicators of backtesting in the form of a list, such as: net profit, gross profit, Sharpe ratio, maximum position, commission, times of profit and loss, etc.
Finally, the transaction list is a table indexed by the transaction serial number, showing the signal direction, date and time, price, profit and loss, accumulated profit and loss, maximum transaction profit, transaction loss and other values.
Remarks
Finally, I will explain that this is just the beginning of this model. I will continue to optimize the trading system of the second layer. Various optimization feedback and suggestions are welcome. For valuable feedback, I am willing to provide some L4/L5 technical indicators as rewards for free subscription rights.

[Sextan] Your Indicator SourceLevel: 1
NOTE: This is ONLY an EXAMPLE on HOW-TO produce a customized "{Sextan} PINEv4 Sextans Backtest Framework" intput signal source, you can define your own indicator in the highlighted area in compliance with the uniform format, which guarantee when you use "Indicator on Indicator" function, it would not produce any error.
I use two simple moving average crossings to produce long and short entry signal with SMA3 and SMA8 in the example.
Background
Backtesting of technical indicators and strategies is the most common way to understand a quantitative strategy. However, the complicated configuration and adaptation work of backtesting many quantitative tools makes many traders who do not understand the code daunted. Moreover, although I have written a lot of strategies, I am still not very satisfied with the backtest configuration and writing efficiency. Therefore, I have been thinking about how to build a backtesting framework that can quickly and easily evaluate the backtesting performance of any indicator with a "long/short entry" indicator, that is, a "simple backtesting tool for dummies". The performance requirements should be stable, and the operation should be simple and convenient. It is best to "copy", "paste", and "a few mouse clicks" to complete the quick backtest and evaluation of a new indicator.
Luckily, I recently realized that TradingView provides an "Indicator on Indicator" feature, which is the perfect foundation for doing "hot swap" backtesting. My basic idea is to use a two-layer design. The first layer is the technical indicator signal source that needs to be embedded, which is only used to provide buy and sell signals of custom strategies; the second layer is the trading system, which is used to receive the output signals of the first layer, and filter the signals according to the agreed specifications. , Take Profit, Stop Loss, draw buy and sell signals and cost lines, define and send custom buy and sell alert messages to mobile phones, social software or trading interfaces. In general, this two-layer design is a flexible combination of "death and alive", which can meet the needs of most traders to quickly evaluate the performance of a certain technical indicator. The first layer here is flexible. Users can insert their own strategy codes according to my template, and they can draw buy and sell signals and output them to the second layer. The second layer is fixed, and the overall framework is solidified to ensure the stability and unity of the trading system. It is convenient to compare different or similar strategies under the same conditions. Finally, all trading signals are drawn on the chart, and the output strategy returns. test report.
The main function:
The first layer: "{Sextan} Your Indicator Source", the script provides a template for personalized strategy input, and the signal and definition interfaces ensure full compatibility with the second layer. Backtesting is performed stably in the backtesting framework of the layer. The first layer of this script is also relatively simple: enter your script in the highlighted custom script area, and after ensuring the final buy and sell signals long = bool condition, short = bool condition, the design of the first layer is considered complete. Input it into the PINE script editor of TradingView, save it and add it to the chart, you can see the pulse sequence in yellow (buy) and purple (sell) on the sub-picture, corresponding to the main picture, you can subjectively judge that the quality of the trading point of the strategy is good Bad.
The second layer: "{Sextan} PINEv4 Sextans Backtest Framework". This script is the standardized trading system strategy execution and alarm, used to generate the final report of the strategy backtest and some key indicators that I have customized that I find useful, such as: winning rate , Odds, Winning Surface, Kelly Ratio, Take Profit and Stop Loss Thresholds, Trading Frequency, etc. are evaluated according to the Kelly formula. To use the second layer, first load it into the TrainingView chart, no markers will appear on the chart, since you have not specified any strategy source signals, click on the gear-shaped setting next to the "{Sextan} PINEv4 Sextans BTFW" header button, you can open the backtest settings, the first item is to select your custom strategy source. Because we have added the strategy source to the chart in the previous step, you can easily find an option "{Sextan} Your Indicator Source: Signal" at the bottom of the list, this is the strategy source input we need, select and confirm , you can see various markers on the main graph, and quickly generate a backtesting profit graph and a list of backtesting reports. You can generate files and download the backtesting reports locally. You can also click the gear on the backtest chart interface to customize some conditions of the backtest, including: initial capital amount, currency type, percentage of each order placed, amount of pyramid additions, commission fees, slippage, etc. configuration. Note: The configuration in the interface dialog overrides the same configuration implemented by the code in the backtest script.
How to output charts:
The first layer: "{Sextan} Your Indicator Source", the output of this script is the pulse value of yellow and purple, yellow +1 means buy, purple -1 means sell.
The second layer: PINEv4 Sextans Backtest Framework". The output of this script is a bit complicated. After all, it is the entire trading system with a lot of information:
1. Blue and red arrows. The blue upward arrow indicates long position, the red downward arrow indicates short position, and the horizontal bar at the end of the purple arrow indicates take profit or stop loss exit.
2. Red and green lines. This is the holding cost line of the strategy, green represents the cost of holding a long position, and red represents the cost of holding a short position. The cost line is a continuous solid line and the price action is relatively close.
3. Green and yellow long take profit and stop loss area and green and yellow long take profit and stop loss fork. Once a long position is held, there is a conditional order for take profit and stop loss. The green horizontal line is the long take profit ratio line, and the yellow is the long stop loss ratio line; the green cross indicates the long take profit price, and the yellow cross indicates the long position. Stop loss price. It's worth noting that the prongs and wires don't necessarily go together. Because of the optimization of the algorithm, for a strong market, the take profit will occur after breaking the take profit line, and the profit will not be taken until the price falls.
4. The purple and red short take profit and stop loss area and the purple red short stop loss fork. Once a short position is held, there will be a take profit and stop loss conditional order, the red is the short take profit ratio line, and the purple is the short stop loss ratio line; the red cross indicates the short take profit price, and the purple cross indicates the short stop loss price.
5. In addition to the above signs, there are also text and numbers indicating the profit and loss values of long and short positions. "L" means long; "S" means short; "XL" means close long; "XS" means close short.
TradingView Strategy Tester Panel:
The overview graph is an intuitive graph that plots the blue (gain) and red (loss) curves of all backtest periods together, and notes: the absolute value and percentage of net profit, the number of all closed positions, the winning percentage, the profit factor, The maximum trading loss, the absolute value and ratio of the average trading profit and loss, and the average number of K-lines held in all trades.
Another is the performance summary. This is to display all long and short statistical indicators of backtesting in the form of a list, such as: net profit, gross profit, Sharpe ratio, maximum position, commission, times of profit and loss, etc.
Finally, the transaction list is a table indexed by the transaction serial number, showing the signal direction, date and time, price, profit and loss, accumulated profit and loss, maximum transaction profit, transaction loss and other values.
Remarks
Finally, I will explain that this is just the beginning of this model. I will continue to optimize the trading system of the second layer. Various optimization feedback and suggestions are welcome. For valuable feedback, I am willing to provide some L4/L5 technical indicators as rewards for free subscription rights.
